Embed Size (px)
Citation preview
USAARL REPORT NO. 77412
clo SUBJECTIVE RATINGS OF ANNOYANCE PRODUCED BY ROTARY-WING
AIRCRAFT NOISE
By
James H. Patterson, Jr.Ben T. Mozo
USMARLFort Rucker, Alabama
Paul 0. SchomerUSA CERL
Champaign, Illinois
Robert T. Camp, Jr. D D CUSAARL -l
Fort Rucker, Alabama 7 AUG 25 1977 I
MAY 1977 - ~ B
US ARMY AEROMEDICAL RESEARCH LABORATORYFort Rucker, Alabama 36362
0-D
DISTBflUUICNT14MYA
C= Aprov'eiI ~ uihc reln'-se;

NOTICE
Qualified requesters may obtain copies from the Defense DocumentationCenter (DDC), Cameron Station, Alexandria, Virginia. Orders will beexpedited if placed through the librdrian or other person designatedto request documents from DDC.
Change of Address
Organizations receiving reports from the US Army Aeromedical ResearchLaboratory on automatic mailing lists should confirm correct addresswhen corresponding abcut laboratory reports.
Disposition
Destroy this report when it is nD longer needed. Do not return it tothe originator.
Distribution Statement
This document has been approved for public release and sale; itsdistribution is unlimited.
Disclaimer
The findings in this report are not to be construed as an officialDepartment of the Army position unless so designated by otherauthorized documents.
*WIWI
]UnciAssifieuSECURITY CL ASSIFICATION Of THIS PAGE WMn Da Rnerod)
REPORT V'CUMENTATION PAGE BFRE INSPTU7N
REPORT HUMBER .[. GOVT ACCESSION NO. 3. R ECI4.Tg Z1A
_kz~ ~~SPOR of &ov PERIOD COVEREDSUBJECTIE RtfINGS OF ANNOYANCE PRODUCED BY
ROTARY-WJNG AIRCRAFT NOISE,V G. PERFORMING ORG. REPORT NUMBER
.AUTHW5 H.Pteso.J.. CONTRACT OR GRANT NUMBER(e)
K~./ Ben T./Mozo)Robert D./Schomer
Robert T(a J r- VkS. PERFORMING ORGANIZATION APO S IeISS' 10. PROGRAM ELEMENT. PROJECT, TASK
AREA & WORK U NIT NUMBIERS
II. CONTROLLING OFFICE NAME AND ADDRESS 12. R O' ATE
BiaosisDivision V May 077 1'US Army Aeromedical Research Laboratory 13. NUMBER OF PAGE_..
Fort Rucker, Alabama 3636230 i4IS MO-NITORING AGENCY NAME a ALCDRESS(If dlifferent from Controfllng Office) 1S. SECURI'Yr-Y4ASS._(of tiq,.pr)"
US Army Medical Research and Development CormmandA-Washington, D.C. 20314 Unclassified
15a. DECLASSIFICATION/DOWSIGRADINGSCHEDULE
I6. DISTRIBUTION STATEMENT (of (hie Report)
This document has been approved for public release and sale; itsdistribution is unlimited.
17. DISTRIBUTION STATEMENT (of the abstract entered In Block 20. It different from Report)
141. SUPPLEMENTARY NOTES
IS. KEIY WORDS (Conltinue on reverse side If necessary and Identify by block number')
-Annoyance
7- Helicopter Noise-Acoustics-Psychoacoustics
-Land Use Planning20. BSTAVIC-oran r 1 It necer and Idenify by block nuwbet~l
26. ~ S ABSRA r;,~~4 ngs of annoyance caused by helicopter noise reldtiveto that caused by fixed-wing aircraft were obtained. Comparison of the subjectivratings with various physical predictors of annoyance indicated that the integrat dA-weighted level (dBA) predicted as wall as any of the predictors A!th the
LQ.4,xD2-weighted level and EPNL almost equivalent. The B-weighted level and C-weighted level did not predict as well. No correction factor for the impulsivecharacter (blade slap) of the helicopter noise was required. No substantialpenalty for helicopters compared to fixed-wing aircraft noise was required.
DO I OM7 1473 EDIIOMor I nov "is ossoLaTa UnclassifiedSECURITY CLASSFICATION 5.Frs PARE FW- D Eneredt-
'1 5 7 W

Unclassified69CURITY CLASIFICATION OF THIS PAG9(Vhw Da ftaemEJ
UnclassifiledSIECURITY CLASSIFICATION OF THIS PAGEWMho Date Eneud)

USAARL REPORT NO. 77-12
SUBJECTIVE RATINGS OF ANNOYANCE PRODUCED BY ROTARY-WING
AIRCRAFT NOISE
By
James H. Patterson, Jr.Ben T. Mozo
USAARLFort Rucker, Alabama
Paul D. SchomerUSA CERL
Champaign, Illinois
Robert T. Camp, Jr.USAARL
Fort Rucker, Alabama
MAY 1977
Bioacoustics Division
US ARMY AEROMEDICAL RESEARCH LABORATORYFort Rucker, Alabama 36362
US Army Medical Research and Development Command
Distribution Statement. This document has been approved for publicrelease and sale; its distribution is unlimited.
K..noi

ABSTRACT
Subjective ratings of annoyance caused by helicopter noiserelative to that caused by fixed-wing aircraft were obtained.Comparison of the subjective ratings with various physical predictorsof annoyance indicated that the integrated A-weighted level (dBA)predicted as well as any of the predictors with the D2-weightedlevel and EPNL almost equivalent. The B-weighted level and C-weightedlevel did not predict as well. No correction factor for theimpulsive character (blade slap) of the helicopter noise was required.No substantial penalty for helicopters compared to fixed-wing air-craft noise was required.
APPROVED 4ROBERT W. BAILEY-COL, MSCConmandinj
ii

TABLE OF CONTENTS
Page No.
Abstract ........................................... ii
List of Tables...................................... iv
List of Illustrations........................... v
Introduction ......................................... 1
Method and Instrumentation ............................ 2
Data Analysis ........................................ 7
Results and Discussion ................................ 7
Conclusion.......................................... 14
kei erences.......................................... 16Appendix A ......................................... A-1
Appendix B ......................................... B-i
Appendix C ......................................... c-i
Appendix D ......................................... D-1
ACCESSION
for_NTIS wi'p SectionD DDC Pit[f Seciion Q3IJNANNNIIl' 0JUSTI IVU'N
BY
DIM :i/'p SPECIAL.

LIST OF TABLES
Table No. Page No.
1 Types of Aircraft used in Annoyance Ratings ....... 3
11 Maneuver Flown by Each Aircraft ,.ring AnnoyanceRatings ........................................... 4
III Product Moment Correlations Between SubjectiveRatings and Twenty-One predictors of Annoyance .... 8
IV Product Moment Correlations Between Twenty-OnePredictors of Annoyance ........................... 11
i
iv
ri ~ m. ' - ' ' .. U.,mm lmnmm n,. " ...Jj... ,. .. P- ..

LIST OF ILLUSTRATIONS
Figure Page No.
1 Schematic Representation of Flight Paths Relativeto Listener Location at Louisville Stage Field ..... 5
2 Scatter Diagram Relating the Geometric Mean SubjectiveAnnoyance Ratings and the Predicted Relative AnnoyanceBased on Integrated A-Weighted Sound Pressure Levels .. 9
v

SUBJECTIVE RATINGS OF ANNOYANCE PRODUCED BY
ROTARY-WING AIRCRAFT NOISE
INTRODUCTION
Growing public concern about noise pollution, coupled withincreasingly frequent passage of noise control legislation, has led toa demand for careful planning in aircraft operations. Army Aviationhas not been immune to this requirement. In the Construction CriteriaManual No. 4270.1-M, published in 1972, the Department of Defense (DOD)set limits for noise at on-post housing construction sites and othersensitive land uses. The DOD Air Installation Compatibility Use ZoneProgram (AICUZ) of 1973 provided noise limits for off-post land useand noise impact. The latter document required coordination withlocal communities on the planning and use of land near aircorridors. However, little information about far-field helicopter noisecharacteristics and annoyance caused by this type of noise has beenavailable.
To answer this need, the US Army Construction Engineering ResearchLaboratory (CERL), Champaign, Illinois, and the US Army AeromedicalResearch Laboratory (USAARL), Fort Rucker, Alabama, undertook to collectdata on the far-field external noise produced by rotary-wing aircraftand to investigate the annoyance associated with it. This reportcontains the results of the annoyance evaluation part of that project.
The primary purpose of the subjective test conducted in thisportion of the project was to quantify the annoyance caused byhelicopter noise ard to investigate the validity of applying the fixed-wing aircraft annoyance predictors to rotary-wing aircraft acousticproblems. Many studies concerned with the prediction of annoyancefrom various types of noises have been conducted (see Kryter, 1970).The general approach has been to attempt to find some means oftransforming noise spectra and durations to a single numberwhich predicts the annoyance to humans, Previous efforts have been
I' concentrated primarily on finding some spectral weighting function bywhich the noises can be quantified into a single overall value on whichto base the prediction and on determining "level correction factors"to better predict annoyance.
IiLI

Most of the studies of annoyance from aircraft noise have concen-trated on fixed-winq aircraft, particularly jets. As a result,relatively little information is available on how well these predictorspredict the annoyance caused by rotary-winq aircraft. The resultsreported here provide information concerning four questions about theprediction of annoyance from rotary-wing aircraft. Which spectralweighting function is most appropriate in predicting annoyance?One of the most popular predictors -- Effective Perceived NoiseLevel EPNL -- has become a part of Federal Aviation AdmiiiTs-ation(FAA) Regulations, Part 36 (1969). Another popular predictor -- theA-Weighted Level (dBA -- has been established as the basic unit ofmeasurement by the Environmental Protection Agency (EPA) in the"Levels" document (1974). In addition to these two predictors, the"C-Weighting Network" as found on sound level meters was considered,along with the earlier EPNL and D2-weighting functions formulatedin Kryter (1970).
2. Is a "correction" factor for the impulsive "blade slap"of rotary-wing aircraft necessary? It has been suggested that rotary-wing aircraft are considered more annoying when they produce the periodicimpulsive sound commonly referred to as "blade slap."
3. What type of integration should be used to best characterizean entire flyby? The EPNL measures require a temporal integration ofthe spectrally weighted acoustic energy. Other possibilities which wereconsidered include the peak level, the weighted sum of the maximum levelwithin each octave band, and the time average weighted level which isproportional to Leq.
4. Do the fixed-wing aircraft annoyance predictors underestimatethe annoyance of helicopters relative to fixed-wing aircraft? If so,how large a penalty is needed to correct for this underestimation?
METHOD AND INSTRUMENTATION
The general approach used in this study was to obtain subjectiveratings of annoyance caused by a variety of rotary-wing aircraftperforming a variety of maneuvers. These ratings were obtained on anon-interfering basis within the constraints of a test plan preparedby CERL (Schomer et al., 1974). The scheduling of aircraft and thetypes of maneuvers were determined in accordance with that test plan.Table I lists the aircraft rated during the study. (Annoyanceratings were not obtained during all measurement sessions scheduledby CERL.) Table II contains a list of the maneuvers which each air-craft performed during each set. The order in which the maneuvers wereflown was varied from set to set. Occasionally, some maneuverswere repeated within a set. Figure 1 shows a schematic diagr-i of the
2

Table I
Types of Aircraft Used in Annoyance Ratings
C -47
CH-54
UH-1 M
UH-1B
OH-58
TH-55
UH -11
CH-47B
AH-1G
3

Table II
Maneuvers Flown by Each Aircraft During Annoyance Ratings
Maneuver Direction Altitude (AGL)
Level Flyover S to N 300 Ft
Level Flyover N to S 300 Ft
Nap-of-the-Earth S to N 20-50 Ft
Nap-of-the-Earth N to S 20-50 Ft
Ascent S to N 275-600 Ft
Ascent N to S 275-600 Ft
Descent S to N 325-75 Ft
Descent N to S 325-75 Ft
Left Turn SE to SW 300 Ft
Left Turn NW to NE 300 Ft
Right Turn SW to SE 300 Ft
Right Turn NE to NW 300 Ft
4
e
II
t A 4I

-A
'UU
I--lu
L
0 >
/ '9 wLA7 >9
'Of
zz
AIx

stage field and the "theoretical" flight paths followed during thevarious maneuvers relative to the location of the observers renderingthe ratings.
The observers were 25 adults hired on a part-time basis by CERLto serve as engineering assistants. The ages ranged from 18 to 46, witha median age of 22. Five of the observers were male and 20 Female. Allsubjects were given an audiometric screening and found to have hearinglevels within 20 dB of normal (ANSI 1969) for frequencies from 125to 4000 Hz. Thirteen of the subjects were dependents of military orcivilian personnel working at Fort Rucker, Alabama; twelve had no directaffiliation with the military installation.
The tests were conducted at a remote stage field in a rural areanear Louisville, Alabama. There are no state or Federal highways within15 miles of this field, and there was virtually no traffic on nearbycounty roads. There was no air traffic in the area except for theaircraft participating in the test. The observers were taken by busfrom Fort Rucker, Alabama, to the test site each morning for a half-daylistening session. During each half-day session, a complete set ofmaneuvers was scheduled to be flown by two different types of aircraftor by two aircraft of the same type.
The observers were Instructed (see Appendix A for instructions toobservers) to listen to the sound of a C-47 (DC-3) fixed-wing aircraft asit passed over and then rate each flyby of a rotary-wing aircraft rela-tive to the C-47. During each half-day session, the C-47 made two passesover the field: one at the beginning of each set. (On three of thesets, the C-47 pass was omitted due to uncontrollable factors.) The C-47always made a level flyover at an altitude of approximately 300 ft (AGL).The ratings were recorded on answer sheets with ratio scales marked foreach maneuver (see Appendix B). The observers indicated their rating bymarking through the scale at the point corresponding to their judgmentof the relative annoyance of the rotary-wing aircraft. The scales wereopen-ended at both ends, and observers were allowed to use arbitrarilylarge or small ratings. These sheets were then scored, using "1" as anindication that the helicopter was equaly as annoying as the C-47.
The instrumentation used to record the sound of each aircraftmaneuver consisted of: a B&K type 4145 1-M. microphone, a B&K type2619 cathode follower, a B&K type ZEO003 variable gain microphone amplifier,and an Ampex FR1300A seven-channel tape recorder. The microphone output wasrouted through two parallel microphone amplifiers and recorded on twoseparate tape channels at levels differing by 10 dB to insure adequaterecording levels.
6

DATA ANALYSIS
The ratings recorded by each observer for the first 12 flybys in aset were converted to numerical ratios and entered on punched cards forcomputer analysis by a SEL System 85/86 computer. The Analog taperecordings were sampled by analog-to-digital conversion at 20,000 samplesper second using a TD 1923 Time Series Analyzer. These time series werestored on digital tape for extraction of the blade slap parameters andfor conversion to one-third-octave band levels, using Fast Fourier Trans-form techniques. The one-third-octave band level by .4-secondtime interval data were transferred to the SEL SyLcem 85/86 for finalanalysis. The results presented in the next section are all based onvarious comparisons of the subjective ratings and annoyance predictorscomputed from the one-third-octave band data and the blade slap param-eters extracted by the TD 1923 Time Series Analyzer. Appendix Ccontains the computational formulas for various predictors.
RESULTS AND DISCUSSION
The one-third-octave band levels for each helicopter flyby wereused to calculate 21 predictors of annoyance (see Appendix C). Theratios of these predictors to the same predictors calculated from thereference C-47 flyby were correlated with the subjects' responses.Table III contains the correlation coefficients between the variouspredictor ratios and the arithmetic means of all subject responses, themedian of all subject responses, the geometric means of all subjectresponses, and the arithmetic mean of two subgroups of subject responses.
In general, the predictors based on A-weighted sound pressure levels,D -weighted sound pressure levels, and EPNL are most highly correlated withtfe average subjective annoyance ratings (arithmetic or geometric). Twosubgroups of subjects were derived by looking at the correlation ofindividual observer responses with the 21 predictor ratios (see AppendixD). One group of observers ratings were more highly correlated withthe A-weighted and D2-weighted predictors than the B-weighted andC-weighted predictors (observers 2, 6, 9, 11, 13, 14, 16, 18, 20, 21,22, 23, 25). These observers were placed into one subgroup and allother subjects formed the second subgroup. The ratings of Observer 3did not correlate with any physical predictor of annoyance, and herdata were excluded for all other analyses.
It has been suggested that helicopters be penalized in assessingtheir noisiness. The results of this study indicate that a smallpenalty may be necessary. Some insight into this penalty can be gainedby examining the regression equation relating the log geometricmean relative subjective annoyance and the predicted relative annoyancebased on the integrated A-weighted levels. Figure 2 shows the scatter
7

TABLE III
Product Moment Correlations Between SubjectiveRatings and Twenty-One Predictors of Annoyance
ARITHMETIC GEOMETRIC MEDIAN ARITHMETIC ARITHMETICMEAN, ALL MEAN, ALL ALL MEAN MEANSUBJECTS SUBJECTS SUBJECTS SUBGROUP I SUBGROUP II
INT. A .84 .87 .83 .75 .76
AVE. A .83 .82 .82 .83 .54
PEAK A .83 .81 .81 .82 .55
MAX. A .84 .84 .83 .80 .65
INT. B .50 .55 .48 .32 .81
AVE. B .70 .71 .67 .58 .76
PEAK B .63 .65 .60 .49 .76
MAX. B .70 .72 .67 .57 .79
INT. C .38 .44 .37 .18 ,78
AVE. C .55 .59 .53 .37 .81
PEAK C .59 .63 .58 .42 .82
MAX. C .63 .68 .63 .47 .84
INT. D .79 .83 .79 .67 .82
F AVE. D .85 .83 .83 .83 .59
PEAK D .83 .81 .81 .79 .62
MAX. D .85 .85 .84 .78 .71
IPNL K .71 .76 .71 .56 .86
PPNL K .81 .81 .78 .73 .71
EPNL K .87 .87 .85 .83 .68
EPNL F .72 .77 .71 .58 .86
PPNL F .83 .82 .81 .78 .67I. 8

.4A
4 .Z:.
4c &. 0
41 IL, V
U&~hI = 0-001111 00 I lILz I- - W
-Z k(
1.- 00 6n-z6 to 0
3E r- 0 sV
0 7,-0 Z z
40~,. 0Z zIS, 0- 0
~~,j =
w 0 0 ~ -
99

diagram of these two variables. The regression equation for these datais y = .084 + .42x. This regression line does not pass through thepoint corresponding to equal subjective rating at equal integrated A-weighted level; it is displaced to the left. Thus, at the same inte-grated A-weighted level, the helicopters were rated as relatively moreannoying than the C-47. Adding 2 dB to the helicopter levels as apenalty would shift this line so that when the helicopters are ratedequally as annoying as the C-47, the corrected A-weighted level wouldpredict equivalence. This would suggest a penalty of only 2 dB.
Consideration of the slope of this regression line indicates thatthe subjective annoyance doubles for every 7-dB increase in noiselevel. The sensitivity factor calculated as described by Young(1976) is 7.16 dB, a rate of growth somewhat greater than the 10 dBreported by Young (1976) for fixed-wing aircraft. However, thelimited range of helicopter noise levels (less than 20 dB) shouldbe considered in interpreting this slope difference. It can alsobe seen in Figure 2 that the A-weighted levels for each type of air-craft tended to cluster together. The total range of levels is largelyaccounted for by differences in aircraft. This limitation on thedata resulted from attempts to optimize the flight patterns forphysical measurements instead of psychophysical scaling.
Since the range of helicopter types used in this study spansthe largest to the smallest, it was hoped that any differences in thepredictive power of the various predictors would be evident. Since,in general, there seemed to be little oifference in how well severalmeasures correlated to the subjective ratings, the question ofcorrelation among the predictors arose. If the predictors correlatehighly, then their correlations to the criterion variable must besimilar. Table IV contains the intercorrelation matrix for thepredictors used in the subject correlations of Table III. It isapparent that the A-weighted, D2-weighted and PNL predictors are allhighly correlated. This correlation is further evidence that thepredictive powers of these measures provide little basis upon whichto choose between them.
The preceding analysis omitted any specific correction forblade slap of the helicopters. Several attempts were made to find ablade slap characteristic on which to base a correction. None ofthese proved to be very promising. The first measure examined wasthe ratio of peak instantaneous pressure to RMS pressure. The air-craft with maximum blade slap (UH-I1H) and the aircraft with mimimumslap (C-47) exhibited little difference in this measure.
10

TABLE IV
Product Moment Correlations Between Twenty-One Predictors of Annoyance
INT. AVE. PEAK MAX. INT. AVE. PEAK MAX.A A A A B B B B
INT. A 1.0 .80 .78 .86 .74 .75 .72 .80
AVE. A .80 1.0 .97 .97 .44 .79 .73 .78
PEAK A .78 .97 1.0 .97 .46 .81 .78 .81
MAX. A .86 .97 .97 1.0 .56 .83 .81 .86
INT. B .74 .44 .46 .56 1.0 .79 .79 .82
AVE. B .75 .79 .el .83 .79 1.0 .97 .97
PEAK B .72 .73 .78 .81 .79 .97 1.0 .98
MAX. B .80 .78 .81 .86 .82 .97 .98 1.0
INT. C .62 .30 .32 .43 .98 .71 .73 .75
AVE. C .69 .51 .53 .61 .91 .89 .88 .88
PEAK C .71 .56 .59 .66 .88 .89 .91 .90
MAX. C .76 .62 .64 .72 .88 .91 .91 .94
INT. D .96 .75 .75 .84 .86 .81 .79 .86
AVE. D .78 .97 .96 .94 .48 .85 .79 .82
PEAK D .76 .94 .98 .95 .52 .87 .85 .86
MAX. D .84 .94 .96 .98 .62 .89 .87 .91
IPNL K .91 .66 .66 .76 .93 .81 .81 .86
PPNL K ,76 .90 .93 .92 .60 .91 .91 .91
EPNL K .88 .76 .75 .81 .63 .69 .63 .73
EPNL F .91 .66 .66 .76 .93 .82 .81 .87
PPNL F .76 .92 .95 .93 .57 .91 .88 .89
11

TABLE IV (Cont)INT. AVE. PEAK MAX. INT. AVE. PEAK MAX.
c c c c D D D D
INT. A .62 .69 .71 .76 .96 .78 .76 .84
AVE. A .30 .51 .56 .62 .75 .97 .94 .94
PEAK A .32 .53 .59 .64 .75 .95 .98 .96
MAX. A .43 .61 .66 .72 .84 .94 .95 .98
INT. B .98 .91 .88 .88 .86 .48 .52 .62
AVE. B .71 .89 .89 .91 .81 .85 .87 .89PEAK B .73 .88 .91 .91 .79 .79 .85 .87
MAX. B .75 .88 .90 .94 .86 .82 .86 .91INT. C 1.0 .91 .87 .86 .76 .34 .40 .49
AVE. C .91 1.0 .97 .97 .80 .57 .61 .68
PEAK C .87 .97 1.0 .98 .80 .62 .67 .72
MAX. C .86 .97 .98 1.0 .85 .67 .71 .78
INT. D .76 .80 .80 .85 1.0 .74 .75 .84
AVE. D .34 .57 .62 .67 .74 1.0 .97 .96
PEAK D .40 .61 .67 .71 .75 .97 1.0 .97
MAX. D .49 .68 -72 .78 .84 .96 .97 1.0
IPNL K .86 .86 .86 .89 .97 .66 .68 .78
PPNL K .50 .71 .78 .79 .77 .94 .97 .96EPNL K .52 .61 .64 .69 .87 .74 .73 .79
EPNL F .87 .86 .87 .90 .98 .67 .69 .78j PPNL F .46 .69 .75 .77 .76 .96 .98 .96
12
j _ __ ___

TABLE IV (Cont)
IPNL K PPNL K EPNL K EPNL F PPNL F
INT. A .91 .76 .88 .91 .76
AVE. A .66 .90 .76 .66 .92
PEAK A .66 .93 .75 .66 .95
MAX. A .76 .92 .81 .76 .93
INT. B .93 .60 .63 .93 .57
AVE. B .81 .91 .69 .82 .91
PEAK B .81 .91 .63 .81 .88
lAX. B .86 .91 .73 .87 .89
INT. C .86 .50 .52 .87 .46
AVE. C .86 .71 .61 .86 .69
PEAK C .86 .78 .64 .97 .75
MAX. C .89 ,79 .69 .90 .77
INT. U .97 .77 .87 .98 .76
AVE. D .66 .94 .74 .67 .96
PEAK D .68 .97 .73 69 .98
MAX. D .78 .96 .79 .78 .96
! IPNL r 1.0 .73 .80 .99 .71
PPNL K .73 1.0 .71 .73 .98
EPNI K .80 .71 1.0 .81 .72
EPNL F .99 .73 .81 1.0 .72
PPNL F .71 .98 .72 .72 1.0
13
.... w
.4I
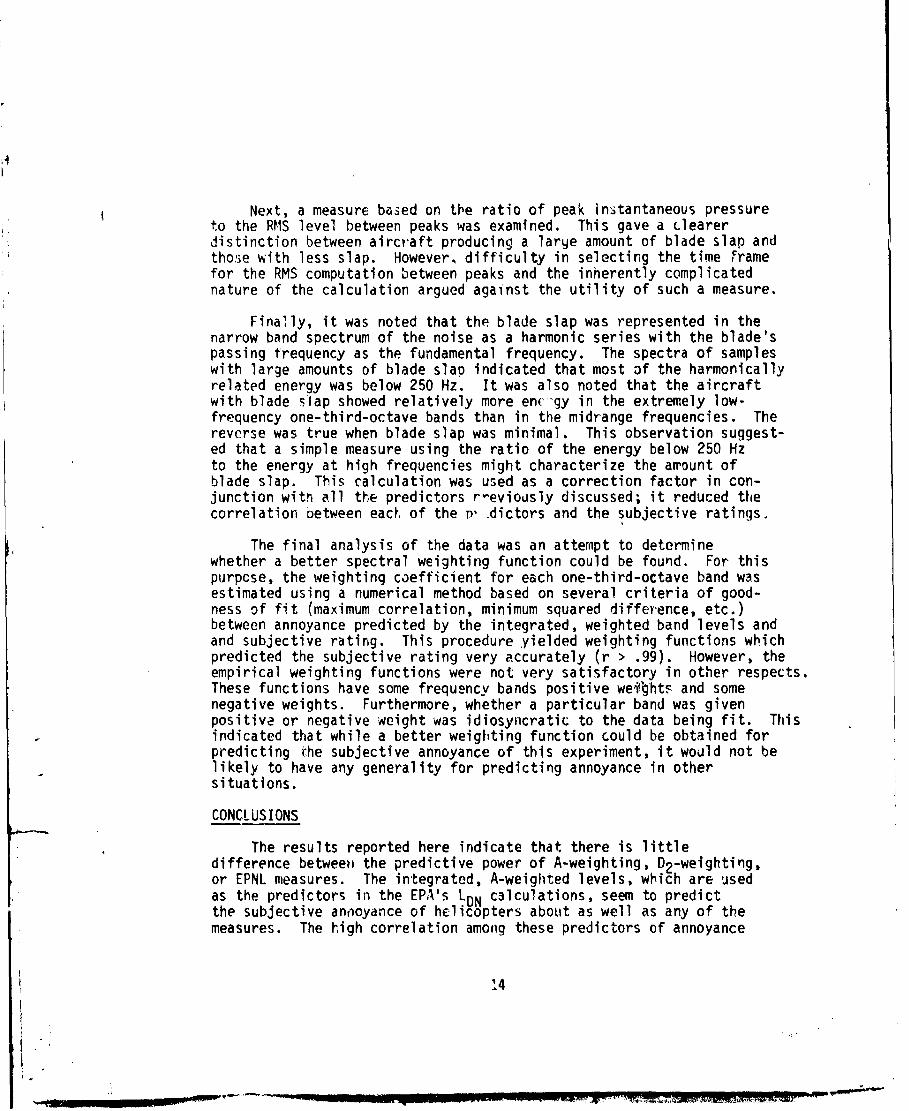
Next, a measure based on the ratio of peak instantaneous pressureto the RMS level between peaks was examined. This gave a clearerdistinction between aircraft producing a larye amount of blade slap andthose with less slap. However, difficulty in selecting the time Framefor the RMS computation between peaks and the inherently complicatednature of the calculdtion argued against the utility of such a measure.
Finally, it was noted that the blade slap was represented in thenarrow band spectrum of the noise as a harmonic series with the blade'spassing frequency as the fundamental frequency. The spectra of sampleswith large amounts of blade slap indicated that most of the harmonicallyrelated energy was below 250 Hz. It was also noted that the aircraftwith blade slap showed relatively more enc gy in the extremely low-frequency one-third-octave bands than in the midrange frequencies. Thereverse was true when blade slap was minimal. This observation suggest-ed that a simple measure using the ratio of the energy below 250 Hzto the energy at high frequencies might characterize the amount ofblade slap. This calculation was used as a correction factor in con-junction with all the predictors r-eviously discussed; it reduced thecorrelation between eac, of the p-.dictors and the subjective ratings.
The final analysis of the data was an attempt to determinewhether a better spectral weighting function could be found. For thispurpose, the weighting coefficient for each one-third-octave band wasestimated using a numerical method based on several criteria of good-ness of fit (maximum correlation, minimum squared difference, etc.)between annoyance predicted by the integrated, weighted band levels andand subjective rating. This procedure yielded weighting functions whichpredicted the subjective rating very accurately (r > .99). However, theempirical weighting functions were not very satisfactory in other respects.These functions have some frequency bands positive weibhts and somenegative weights. Furthermore, whether a particular band was givenpositive or negative weight was idiosyncratic to the data being fit. Thisindicated that while a better weighting function could be obtained forpredicting the subjective annoyance of this experiment, it would not belikely to have any generality for predicting annoyance in othersituations.
CONCLUSIONS
The results reported here indicate that there is littledifference between the predictive power of A-weighting, D2-weighting,or EPNL measures. The integrated, A-weighted levels, which are usedas the predictors in the EPA's LDN calculations, seem to predictthe subjective anooyance of helicopters about as well as any of themeasures. The high correlation among these predictors of annoyance
14

makes any attempt to show the superiority of one over another unlikelyto succeed. These conclusions are based on the average of a group ofsubjects. It should be noted that there were individuals wnoseratings of annoyance were more consistent with C-weighted andB-weighted levels.
No correction for blade slap was found which improves the predictionof annoyance. However, a small (2 dB) penalty for helicopters was indi-cated by the results. The 2 dB value is p;'obably of little practicalsignificance considering the variability of subject data and thediscriminatory capability of an individual subject.
4
15
powo,-

4
REFERENCES
1. American National Standards Institute. American NationalStandard Specification for Audiometers, ANSI S3.6--1969.
2. Air Installation Compatible Land Use Zones (AICUZ) Program 1973(revised 1976).
3. DOD Construction Criteria Manual No. 4270.1-M, 1972.
4. Federal Aviation Administration Noise Standards, Title 14, Code ofFederal Regulations, Chapter I, Part 36, 34 FR 1864,November 1969 (amended).
5. Kryter, K. D. The Effect of Noise on Man. Academic Press, 1970.
6. Schomer, P. D., Averbuch, A. J. and Homans, B. L. Test Plan forthe Acquisition of Rotary Wing Aircraft Acoustic and Perfor-mance Data. US Army Construction Engineering ResearchLaboratory, Champaign, IL, 1974.
7. US Environmental Protection Agency. Information on Levels ofEnvironmental Noise Requisite to3Protect Public Healthand Welfare with an Adequate Margin of Safety, Washington,
1974.
8. Young, J. R. Measurement of the Psychological Annoyance ofSimulated Explosion Sequences (second year), Final ReportSRIroject 316, Stanford Research Institute, Menlo Park,M7, 976.
9. Sternfeld, H., Hinterkauser, E. G., Hackman, R. B., and Davis, J.Acceptibility of VTOL Aircraft Noise Determined byAbsolute Subjective Testing. NASA CR 2043, June 1972.
10. Berry, B. F. and Robinson, D. W. A Proposal for Rating theAnnoyance due to the Pulsating Character of HelicopterNoise. C*respondence to ISO/TC43/SCIWG2, Noise rromATircraft, 30 August 1974.
16
---- -----

APPENDIX A

INSTRUCTIONS FOR MAGNITUDE ESTIMATION JUDGMENTS OF NOISINESS
The purpose of the tests to be conducted is to determine therelative acceptability and telerability of noises and various types ofhelicopters and helicopter maneuverings to people when in or near theirhome. You may like or dislike any of the noises you hear, but we wantyou to judge the noises relative to a reference noise.
You will be asked to listen to the sounds of aircraft flyingover. You are to judge how disturbing or unacceptable the sounds wouldbe if heard regularly, as a matter of course, in your home. We wouldlike for you to make judgments of the noises you will hear as though youwere listening to these noises near your home when engaged in typicaleveryday activities such as reading, conversing with friends, members ofthe family, etc. It is important that you keep this in mind and attemptto judge each of the noises you will hear as though you were near yourhome and engaged in similar activites for each of the exposures. It isalso important that you judge how the noise would affect you in itstotality from its beginning to end as an overall noise occurrence if youwere near your home.
The first sound you will listen to is a standard or referencesound made by a C-47. All other sounds will be judged relative to thisstandard. Thus, you w-ill give the standard sound a rating of "10" or aratio of "I". Remember your job is to rate each of the other soundsrelative to this standard. The first line on your answer sheet is forrating the C-47. Listen carefully to its sound and fix it in your mind.Give this sound a mid-scale rating. Then on each succeeding sounddetermine how much more or less annoying you would find it and markthe appropriate scale (marking to the left is less objectionable, tothe right is more objectionable). For example, if the second soundis half as objectionable, mark "5" or a ratio of "1/2" on line 2.If you find it twice as objectionable, mark "20" or a ratio of "2"on line 2. Remember it is your subjective impression that is im-portant. There are no right or wrong answers, nor do we expectthere to be, necesssarily, agreement among the subjects. We expectpeople to differ. It is your opinion alone that is desired, butkeep in mind, again, that you are to judge, relative to thereference noise, how each of the succeeding noises would affect youif you were exposed to it when near your home and engaged in typicaleveryday activities.
A-i

4
APPENDIX B
j'I
-. I _____ ____________

NAME: TIME: DATE:-
AIRCRAFT TYPE: TAPE NO:
SEQUENCE CODE:- SET NO:
.63 1.25 2.5 5 10 20 40 80 1601. -f------ ----- ------ f ------ ----- . ----- f ----- -. --
1/16 1/8 1/4 1/2 1 2 4 8 16
.63 1.25 2.5 5 10 20 40 80 1602. - ----- ---- 1--.- ---- ----..-- f...- . .- --
1/16 1/8 1/4 1/2 1 2 4 8 16
.63 1.25 2.5 5 10 20 40 80 1603. ------ f....- -I -- 4----- ----- I ----- + - - -.----
1/16 1/8 1/4 1/2 1 2 4 8 16
.63 1.25 2.5 5 10 20 40 80 1604. -.---- -t ----- t ----- f ----- t ----- -.f ----- -..- 4 - 4 - 4--
1/16 1/8 1/4 1/2 1 2 4 8 16
.63 1.25 2.5 5 10 20 40 80 1605. -------------.-- ... t . .-. - . ..--
1/16 1/8 1/4 1/2 1 2 4 8 16
.63 1.25 2.5 5 10 20 40 80 1606. ------------- - --f - --.- .--- - --- -- 4--
1/16 1/8 1/4 1/2 1 2 4 8 16
.63 1.25 2.5 5 10 20 40 80 1607.- ------ - ---..- i ---. -j --- t- --.---.--- --
1/16 1/8 1/4 1/2 1 2 4 8 16
.63 1.25 2.5 5 10 20 40 80 1608. -* ...... f ..... - f -----4- .-. --.-.... ---.. - - -.---
1/16 1/8 1/4 1/2 1 2 4 8 16
NOTE: Original answer sheet had 10 response lines per page.
B-1
II

4
APPENDIX C
r
I
K] __________________________

DEFINITIONS
xij jth one-third octave band level at the ith .4-second time bin(numbers proportional to power; not in dB).
aj :A-weighting coefficient for the jth one-third octave band.
bj : B-weighting coefficient for the jth one-third oc -/e band.
cj :C-weighting coefficient for the jth one-third octave band.
dj :D 2-weighting coefficient for the jth one-third octave band.
N number of .4-second time intervals which are within 10 dB ofthe peak weighted level.
FORMULAS
PEAK A = max [E ajxi] . where the maximum is calculatedj with respect to i.
MAX A = aj max [xij] where the maximum is calculatedj ~with respect to i.
INT A = E ajxij i is summed over all intervalsi j within 10 dB of PEAK A
AVE A = (1/N) Z ajxij i is summed over all intr,rvalsi 1j within 10 dB of PEAK A
PEAK B = max [E bjxij] where the maximum is calculatedji with respect to i.
MAX B = E bj max [xij] where the maximum is calculatedbi [xwith respect to i.
INT B E b xi i is summed over all intervalsi j within 10 dB of PEAK A
AVE B = (1/N) E b x i is summed over all intervalsi j within 10 dB of PEAK A
PEAK C = max [cjxij] where the maximum is calculated31 with respect to i.
C-1

MAX C =JE cj max [xij] where the maximum is calculatedwith respect to i.
INT C = Z E cjxij i is summed over all intervalsii within 10 dB of PEAK A
AVE C = (1/N) Z E cjxij i is summed over all intervalsi 3 within 10 dB of PEAK A.
PEAK D max [E djxij] where the maximum is calculated[ dwith respect to i.
MAX D E dj max [xij] where the maximum is calculatedSd [with respect to i.
INT D F djxij i is summed over all intervalsi j within ]0 dB of PEAK A.
AVE D (I/N) E Z djxi i is summed over all intervalsi within 10 dB of PEAK A
PPNL K = peak PNL calculated by formulas givenin Kryter (1970)
IPNL K = integrated PNL calculated by formulasgiven in Kryter (1970)
ENPL K* = effective PNL calculated by formulasgiven in Kryter (1970).
PPNL F = peak PNL calculated by formulasgiven in FAA Noise Standards (1969)and corresponds to PNLTM in thatdocument.
*While tone correction procedures are involved in these calculations, the
tone correction was found to be zero for all aircraft flyby data usedin this study.
C-2
L | iIIDga'eP- .".. n ~ Nmdm a gnBmam.w mmaln imqm

4
)
APPENDIX D
I.1
V

PRODUCT MEAN CORRELATIONS BETWEEN INDIVIDUAL SUBJECTIVERATINGS AND TWENTY-ONE PREDICTORS OF ANNOYANCE
s1 S2 s3 54 a sa
INT. A .46 .73 .05 71 .76 .73 .78 .54
AVE. A .37 .80 .14 .48 .62 .65 .74 .39
PEAK A .34 .78 .12 .47 .63 .62 .72 .42
MAX. A .41 .76 .11 .57 .69 .66 .74 .50
INT. B .42 .28 .01 .60 .75 .34 .68 .77
AVE. B .44 .53 .02 .57 .78 .44 .61 .72
PEAK B .40 .44 .04 .56 .76 .38 .56 .73
MAX. B .46 .51 .05 .61 .79 .46 .61 .73
INT. C .39 .14 -.01 .56 .69 .23 .54 .76
AVE. C .46 .33 -.02 .61 .75 .34 .62 .80
PEAK C .45 .38 -.00 .65 .78 .38 .63 :77
MAX. C .49 .42 .01 .66 .79 .42 .62 .78
INT. D .49 .64 .03 .71 .80 .66 .79 .66
AVE. D .40 .78 .14 .53 .67 .63 .73 .45
PEAK D .40 .74 .13 .54 .68 .58 .71 .50
MAX. D .47 .73 .13 .62 .74 .64 .74 .58
IPNL K .49 .51 .05 .72 .81 .56 .77 .73
PPNL K .43 .67 .11 .59 .76 .57 .71 .59
EPNL K .39 .76 .03 .63 .69 .68 .80 .50
EPNL F .50 .53 .04 .70 .81 .56 .77 .73
PPNL F .43 .72 .10 .56 .73 .57 .71 .56
D-1

S9 510 511 Si2 S13 S14 S15 S16
JNT. A .63 .67 .39 .63 .51 .45 .41 .69
AVE. A .80 .60 .41 .52 .58 .44 .40 .72
PEAK A .81 .61 .35 .53 .56 .46 .41 .72
MAX. A .76 .67 .36 .59 .53 .45 .41 .71
INT. B .24 .76 .91 .57 .06 .17 .37 .34
AVE. B .58 .63 .21 .62 .29 .25 .33 .55
PEAK B .49 .64 .12 .60 .20 .22 .31 .48
MAX. B .54 .71 .17 .63 .25 .26 .36 .54
INT. C .10 .76 -.00 .52 -.06 .09 .26 .23
AVE. C .32 .81 .08 .60 .09 .17 .29 .40
PEAK C .36 .78 .09 .62 .13 .20 .29 .44
MAX. C .41 .82 .12 .63 .16 .22 .33 .48
INT. D .55 .72 .35 .66 .41 .40 .44 .63
AVE. D .83 .56 .42 .58 .57 .43 .41 .73
PEAK D .80 .59 .34 .58 .51 .44 .40 .71
MAX. D ,76 .66 .37 .65 .49 .43 .41 .70
IPNL K .44 .78 .29 .67 .29 .32 .43 .54
PPNL K .73 .59 .30 .65 .45 .40 .37 .66
EPNL. K .72 .58 .45 .58 .63 .53 .48 .75
EPNL F .46 .76 .29 .67 .31 .34 .41 .55
PPNL F .79 .59 .33 .63 .49 .40 .37 .71
D- 2

S17 Si S19 S20 S21 S22 S23 S24
INT. A .38 .60 .79 .66 .62 .73 .73 .78
AVE. A .36 .66 .63 .78 .82 .77 .76 .65
PEAK A .29 .66 .62 .79 .79 .75 .73 .63
MAX. A .37 .65 .69 .74 .76 .75 .74 .68
INT. B .46 .38 .62 .25 .32 .37 .32 .78
AVE. B .31 .58 .65 .53 .69 .57 .53 .61
PEAK B .28 .53 .61 .46 .61 .50 .44 .54
MAX. B .36 .58 .67 .51 .63 .58 .53 .64
INT. C .46 .30 .54 .11 .22 .25 .18 .72
AVE. C .38 .44 .61 .29 .44 .42 .36 .73
PEAK C .33 .49 .62 .35 .51 .44 .39 .66
MAX. C .40 .53 .64 .39 .51 .51 .45 .71
INT. D .43 .58 .77 .58 .57 .68 .65 .79
AVE. D .30 .69 .63 .78 .84 .76 .75 .66
PEAK D .27 .66 .62 .75 .81 .73 .70 .63
MAX. D .35 .67 .69 .71 .77 .74 .71 .70
IPNL K .48 .53 .74 .45 .48 .59 .54 .79
PPNL K .27 .66 .62 .68 .80 .69 .64 .63
.. EPNL K .32 .63 .72 .77 .68 .?3 .82 .72
EPNL F .43 .55 .74 .48 .50 .60 .55 .79
PPNL F .27 .70 .64 .73 .82 .72 .69 .64
D-3

S25
INT. A .82
AVE. A .82
PEAK A .79
MAX. A .80
I NT. B .41
*AVE. B .58
PEAK B .51
MAX. B .59
I NT. C .28
AVE. C .42
*PEAK C .48
MAX. B .52
I NT. D .74
AVE. D .78
PEAK D .74
MAX. D .76
IPNL K .64
PPNL K .70
EPNL K .84
EPNL F .66
PPNL F .74
D-4

4
DISTRIBUTION LIST FOR USAARL LABORATORY REPORTS
1) Five (5) copies to - HQDA (SGRD-RP)WASH DC 20314
2) Twelve (12) copies to - Defense Documentation CenterAlexandria, VA 22324
3) One (1) copy to - US Army Combat Developments CommandMedical Department Agency, BAMCFort Sam Houston, TX 78234
FT UCK= 087339
. I

4,4,C a,
4. w' 4, 4. 04 4-0u 4-'4 U( 4 U 4) 41 4 " "
Lu n. *.4,-J4'U 4- 44 .- t, '4- 3t >
~ c) ) A 0 0 4 , 4 ) ' 4 4 ,4 I t4 4 , 0 0 4 04 4o. ,
fl >.t''r >1- I - fl >04L 7.S
4... 0.-ON 4,' 4- 4, 41 -0c , 4-' 0 4c0
4. 4-' 4. 2.- Q) 4-' > l
L4-'4) a.4 -0 .- 04, C 4
J ".) L 4'.. (LflO v .
V, -j 0 N - 0 4 C -
.4 - v z 30 o3 4- , .- - 3
0 t4. 04 W7 oloa.4 L
4, 4, 0Q .1 u w,
0 LJ-4
44 n44 4.- W ~4 el c-''4L-45
L,44 M %- . o 41 m o'41L ,
w-.4 0 - r0 -- 344.44.. 4- L- 4- w,4 >0 ,4 4.4 LL 4,3 >
o,444 t >- , 0 -4'00 a.04 ' 1) 4 1 o,,~..0
28..4. w4'v, (L- > ' >04 ,440it- 4,4.4 _ 0 u0.' WXu u j1
.0 Q)., -4,V 0.. ,~ , -i44,4.4 4. ,.. .4 3444.4 Q)- 4. 4
LJ.. 04- 00 4.1 -V 4. ol.4 4. 00 44-.Z 4.00 CL->i , M. 4.-'.mO o4)-4.-
.0>74 m,- V,4. g,~ 0,4-4 m 4,.- 9
c,4 L. W,4 M7. M,- 41
4, 4,4 t 4- C,~0 &'4
- o4,,4 m to. ' a a w ~ . 4,4,4.-X
4..0- 01' 0o44. 01 a ,. 4, Cn o,.--
4,L- c0 1 M c a x- 0,,~ - 4 .
m >,I'v o a) a 'V C> m 0341~0'- 4,0
LI; :3 b. > a0I; c . v ,. .0 W, 4 CU4
4, m,. 4.3 44, 3,4 4.4u 4wQ) 4 , 4 f 0 11 4, W4 a4,4 U4
-DU 4.4- U( M,- .4,C'W.404.- -~. M 4407, 4. O >'440'_j4 4,4 m , 00 '-4 4. o,, 0 0 044.cc 04-00 m .4.4s.4 - 440, 4.4.-..
L. >-0 L m,~ 4- M n-04I£IS>n4.) 0.- , 4-' .4 W0 4) C.0 ,0 o- u 4. Q s04u-0 u - 4, C Aj 0.Q .- 'A'.- M-7,3
v) cQ l 0 ,.. ,- >140 ,4.m C,4 al 4- -') wV) >--04 '4 u.-04
m m 4.4 2n
a. C4. IL a 4c.,
4,L. 41>- -
. ~ ~ a 4J w0444 lo 07 7,344-444-'a, s-- w 30 3 4-4 .4. *,0 4Z
4,>-1D N44 41 a.-4 o4 0 L.--04 44-4
m 0M . 4 4(0
c " w 4- 1- W.-n .0. w400 c 44
.5 l4 4' 4'0 4
>4Lu 0) 1 1 L4-,-440 a4
u 0 4,44--444-1.440 L4- 44.L3. M-- oLO4.L4
c.3, a) L,4m434
14 -).4. 04- 0 w04'- o4o ~ a. 0'
. 4' -a44 QR~0 0.4.4 * 444 M.0. 4, *4, c4,-4C R
r-~4.4 4)-. 0 Z-0 33;j 0 L 4,4r- >41 Zk4-m .040.4 w- 04-0 3 c
a) -,- ,444 41 r'4r a04:4-L. w- .M 4
u -u - 4 1 .. 4 . 0
o ol 0~ L.n4J o Q4.. % W 0ol I
'Z 0 CD L61 T-,- m-. 4, 0 Co.- - Z4.-m 'a4 L
L. 4 w1 . I+-4,I - I4-' 444' ~-rC 4' o04 1w 7 ' ov/4 0444 4,0 4-i 4.t24' >.5 0 o'3
*41 4',4. 'U 0. -4-.. '4' 4',,
4100 4,4 414, 0.o.41 Q. .04, u o