Embed Size (px)
Citation preview

U.S. Shopping CenterQ3 2018
MARKETBEAT
cushmanwakefield.com | 1
Retail Lives
Economic fundamentals continue to strengthen in the U.S., a trend that is expected to endure through mid-2019. With continued wage growth acceleration and consumer confidence near an 18-year high, the retail marketplace has registered solid spending. Inflation-adjusted consumer expenditures show a steady 2.5-3% year-over-year (YOY) growth pattern since the beginning of 2016. eCommerce sales accounted for approximately 11.5% of retail sales (excluding auto sales) in 2017. While we expect that penetration rate to climb to 14.0% by 2019, physical stores remain vital to retailer survival in this evolving retail climate. Despite what the media would lead you to believe, the overall retail industry is still posting gains even while it faces secular challenges.
Retailer bankruptcy announcements have continued in 2018; as of early October, the year-to-date (YTD) total is 14, compared to 36 total filings in 2017. Although these bankruptcies have led to a significant number of store closures, a recent report by IHL Group indicates store openings are outnumbering closures in 2018, with an estimated positive net gain of 3,835 stores nationally. Although bankruptcies impact all classes of shopping centers, Class A centers are in the best position to quickly backfill the vacancies. While the delta in performance between Class A and other retail product is widening— particularly for malls, all shopping center types are affected – including the relatively stable neighborhood and community centers which typically comprise a necessity- and service-oriented tenant mix.
Cooling Temperatures
Occupancy growth has continued for non-mall shopping centers overall, although the pace has notably cooled from the post-recession average. Net absorption reached nearly 5.7 million square feet (msf) in the third quarter of 2018, bringing the YTD total to 16.2 msf. This compares to 19.9 msf in the first three quarters of 2017 and 29.7 msf over the same period in 2016. The Pacific and Mountain regions account for 45% of the YTD demand with net absorption totaling 3.9 msf and 3.6 msf, respectively, for first three quarters. Houston and Phoenix have the strongest YTD occupancy growth of all individual markets with a combined total of nearly 2.9 msf.
U.S. SHOPPING CENTER
Availability by Type % OF TOTAL SPACE AVAILABLE IN THE U.S.
Rent Rate vs. Overall Vacancy
Market IndicatorsQ3 17 Q3 18 12-Month
Forecast
Vacancy Rates 7.0% 6.5%
Net Absorption 4.8M 5.7M
Under Construction 18.7M 16.9M
Average Asking Rent (NNN, Annual) $16.45 $17.10
Economic IndicatorsQ3 17 Q3 18* 12-Month
Forecast**
GDP Growth 2.3% 3.1%
CPI Growth 2.0% 2.8%
Consumer Spending Growth 2.4% 2.7%
Retail Sales Growth 4.5% 6.1%
Source: CoStar, Cushman & Wakefield Research
0%
2%
4%
6%
8%
10%
12%
$10
$12
$14
$16
$18
2010 2011 2012 2013 2014 2015 2016 2017 2018Q3
Asking Rent, $ PSF Overall Vacancy Rate
69%
15%
12%2%
Neighborhood & Community
Strip Center
Power & Regional Mall
Lifestyle
*Q3 18 Estimates. Values represent year-over-year change. **Forecast by Cushman & Wakefield

U.S. Shopping CenterQ3 2018
MARKETBEAT
cushmanwakefield.com | 2
A recent report by IHL Group indicates store openings are outnumbering closures in 2018, with an estimated positive net gain of 3,835 stores nationally. . . .
The vacancy rate for non-mall shopping centers ended the third quarter of 2018 at 6.5%, unchanged from the previous quarter, but down from 6.7% at year-end 2017. The Pacific and Northeast regions both have vacancy rates under 6.0%, led by Boston and San Jose which boast the lowest shopping center vacancy rates in the nation at just 3.4% and 3.8%, respectively. Raleigh/Durham, Miami and Charleston follow closely, all with vacancy rates of 3.9%.
Construction activity in the retail marketplace is adjusting to the weaker demand. At the close of the third quarter of 2018, only 11.4 msf of new inventory had been delivered YTD across the U.S. This year’s
quarterly average of 3.8 msf of new supply falls well behind the 5.5 msf quarterly average the market has maintained since 2010. In addition, 16.9 msf remains under construction at the end of the quarter, a 10% decline from the development activity one year ago and a 36% decline from the third quarter of 2016. New shopping center inventory delivered in 2018 is led by Houston (1.1 msf), Dallas (nearly 1.0 msf) and the New York Metro/Greater Tri-State area (approximately 913,000 square feet (sf)), all of which are among the top three MSAs for residential growth, according to the U.S. Census Bureau and Moody’s Analytics. Going forward, much of the retail development activity will be focused on mixed-use projects with substantial housing, office, medical and/or hospitality where retail plays a crucial role as a necessary amenity.
The majority of the occupancy growth year-to-date has taken place among neighborhood/community centers. Net absorption for this sector totaled 11.8 msf for the first three quarters of 2018. The vacancy rate
for neighborhood/community centers declined to 7.1% in the third quarter of this year, down ten basis points (bps) from the previous quarter and down from 7.4% at year-end 2017. Occupancy among power centers reflects the estimated closures of 800 Toys R Us stores, with negative absorption of almost -1.1 msf since June 2018. This brought the vacancy rate back up to 5.0% in the third quarter of 2018, identical to the year-end 2017 figure. However, year-to-date net absorption in the power center sector remains positive for 2018—at 586,589 sf—and there are a handful of mid-to-big-box tenants in expansion mode, particularly among fitness/health, and entertainment and off-price categories.
Secular Challenges
The top contraction categories continue to be department and apparel stores, which are typically concentrated in malls. Drug stores also fell into the consolidation column this year, largely due to the expected closings of 600 redundant store locations resulting from Walgreens’ purchase of 1,932 Rite Aid stores in 2017. Grocery stores, however—particularly
those of the discount, organic or ethnic variety—continue to expand and have an ideal size requirement to fill these drug store vacancies, as do superstores that are expanding with a smaller-focused footprint.
Restaurants remain in expansion mode, but plans are tapering off after eight years of robust growth across the sector. According to IHL Group’s findings, more retail locations are opening in 2018 than restaurants, a flip from 2017 when restaurant openings outpaced retail openings three to one.
Dollar stores, discounters and off-price apparel concepts also continue aggressive growth. Value is a top deciding factor for purchases, especially when most shoppers have a price comparison tool at their fingertips. What started as a necessity during the recession years, remains a priority for most consumers today, and the treasure hunt aspect of off-price shopping creates an experience that draws customers to physical stores.
New Construction (msf)
Source: CoStar, Cushman & Wakefield Research
Post-Recession Avg.
0
5
10
15
20
25
30
2011 2012 2013 2014 2015 2016 2017 2018YTD
U/C
U.S. Shopping CenterQ3 2018
MARKETBEAT
cushmanwakefield.com | 3
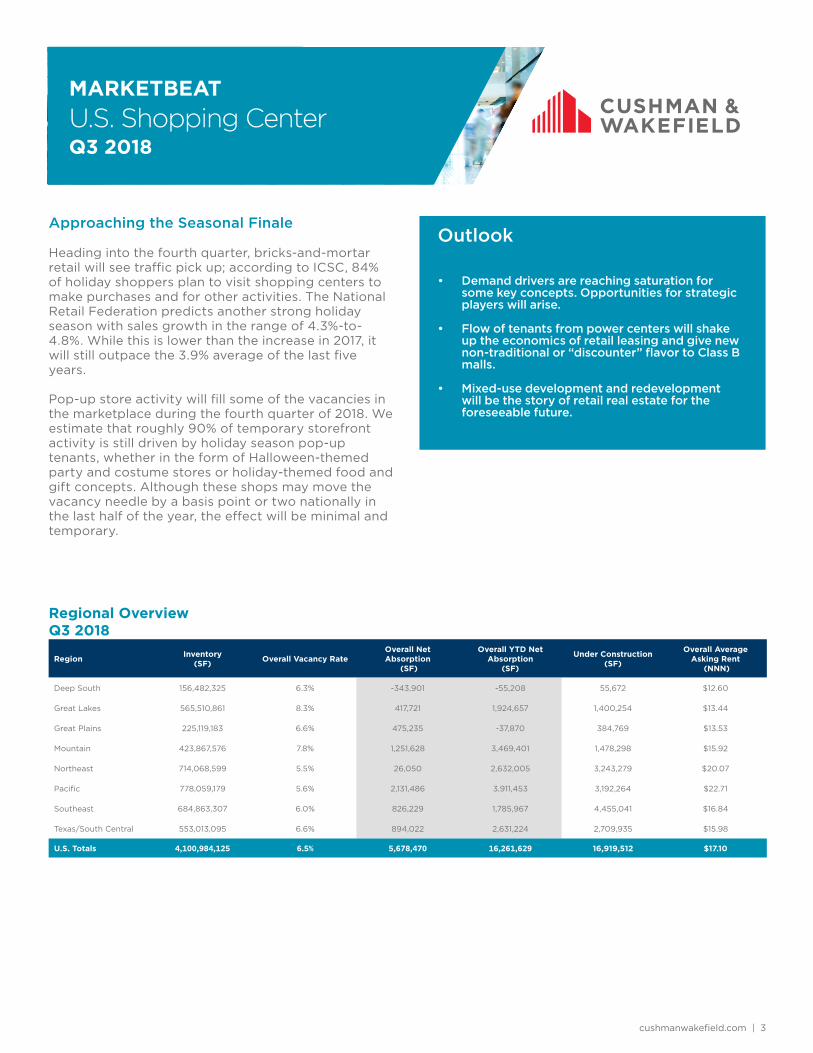
Approaching the Seasonal Finale
Heading into the fourth quarter, bricks-and-mortar retail will see traffic pick up; according to ICSC, 84% of holiday shoppers plan to visit shopping centers to make purchases and for other activities. The National Retail Federation predicts another strong holiday season with sales growth in the range of 4.3%-to-4.8%. While this is lower than the increase in 2017, it will still outpace the 3.9% average of the last five years.
Pop-up store activity will fill some of the vacancies in the marketplace during the fourth quarter of 2018. We estimate that roughly 90% of temporary storefront activity is still driven by holiday season pop-up tenants, whether in the form of Halloween-themed party and costume stores or holiday-themed food and gift concepts. Although these shops may move the vacancy needle by a basis point or two nationally in the last half of the year, the effect will be minimal and temporary.
Outlook
• Demand drivers are reaching saturation for some key concepts. Opportunities for strategic players will arise.
• Flow of tenants from power centers will shake up the economics of retail leasing and give new non-traditional or “discounter” flavor to Class B malls.
• Mixed-use development and redevelopment will be the story of retail real estate for the foreseeable future.
Region Inventory (SF) Overall Vacancy Rate
Overall Net Absorption
(SF)
Overall YTD Net Absorption
(SF)
Under Construction (SF)
Overall Average Asking Rent
(NNN)
Deep South 156,482,325 6.3% -343,901 -55,208 55,672 $12.60
Great Lakes 565,510,861 8.3% 417,721 1,924,657 1,400,254 $13.44
Great Plains 225,119,183 6.6% 475,235 -37,870 384,769 $13.53
Mountain 423,867,576 7.8% 1,251,628 3,469,401 1,478,298 $15.92
Northeast 714,068,599 5.5% 26,050 2,632,005 3,243,279 $20.07
Pacific 778,059,179 5.6% 2,131,486 3,911,453 3,192,264 $22.71
Southeast 684,863,307 6.0% 826,229 1,785,967 4,455,041 $16.84
Texas/South Central 553,013,095 6.6% 894,022 2,631,224 2,709,935 $15.98
U.S. Totals 4,100,984,125 6.5% 5,678,470 16,261,629 16,919,512 $17.10
Regional Overview Q3 2018
MarketBeat U.S. Shopping Center Q3 2018 cushmanwakefield.com | 4
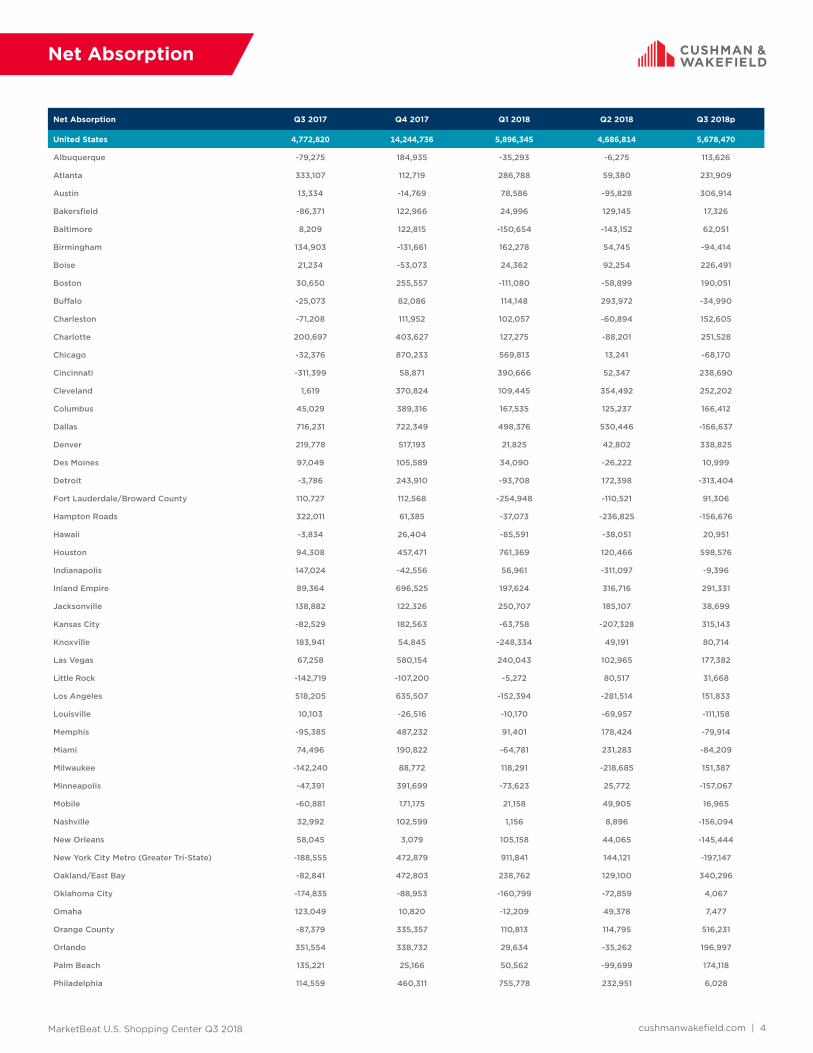
Net Absorption Q3 2017 Q4 2017 Q1 2018 Q2 2018 Q3 2018p
United States 4,772,820 14,244,736 5,896,345 4,686,814 5,678,470
Albuquerque -79,275 184,935 -35,293 -6,275 113,626
Atlanta 333,107 112,719 286,788 59,380 231,909
Austin 13,334 -14,769 78,586 -95,828 306,914
Bakersfield -86,371 122,966 24,996 129,145 17,326
Baltimore 8,209 122,815 -150,654 -143,152 62,051
Birmingham 134,903 -131,661 162,278 54,745 -94,414
Boise 21,234 -53,073 24,362 92,254 226,491
Boston 30,650 255,557 -111,080 -58,899 190,051
Buffalo -25,073 82,086 114,148 293,972 -34,990
Charleston -71,208 111,952 102,057 -60,894 152,605
Charlotte 200,697 403,627 127,275 -88,201 251,528
Chicago -32,376 870,233 569,813 13,241 -68,170
Cincinnati -311,399 58,871 390,666 52,347 238,690
Cleveland 1,619 370,824 109,445 354,492 252,202
Columbus 45,029 389,316 167,535 125,237 166,412
Dallas 716,231 722,349 498,376 530,446 -166,637
Denver 219,778 517,193 21,825 42,802 338,825
Des Moines 97,049 105,589 34,090 -26,222 10,999
Detroit -3,786 243,910 -93,708 172,398 -313,404
Fort Lauderdale/Broward County 110,727 112,568 -254,948 -110,521 91,306
Hampton Roads 322,011 61,385 -37,073 -236,825 -156,676
Hawaii -3,834 26,404 -85,591 -38,051 20,951
Houston 94,308 457,471 761,369 120,466 598,576
Indianapolis 147,024 -42,556 56,961 -311,097 -9,396
Inland Empire 89,364 696,525 197,624 316,716 291,331
Jacksonville 138,882 122,326 250,707 185,107 38,699
Kansas City -82,529 182,563 -63,758 -207,328 315,143
Knoxville 183,941 54,845 -248,334 49,191 80,714
Las Vegas 67,258 580,154 240,043 102,965 177,382
Little Rock -142,719 -107,200 -5,272 80,517 31,668
Los Angeles 518,205 635,507 -152,394 -281,514 151,833
Louisville 10,103 -26,516 -10,170 -69,957 -111,158
Memphis -95,385 487,232 91,401 178,424 -79,914
Miami 74,496 190,822 -64,781 231,283 -84,209
Milwaukee -142,240 88,772 118,291 -218,685 151,387
Minneapolis -47,391 391,699 -73,623 25,772 -157,067
Mobile -60,881 171,175 21,158 49,905 16,965
Nashville 32,992 102,599 1,156 8,896 -156,094
New Orleans 58,045 3,079 105,158 44,065 -145,444
New York City Metro (Greater Tri-State) -188,555 472,879 911,841 144,121 -197,147
Oakland/East Bay -82,841 472,803 238,762 129,100 340,296
Oklahoma City -174,835 -88,953 -160,799 -72,859 4,067
Omaha 123,049 10,820 -12,209 49,378 7,477
Orange County -87,379 335,357 110,813 114,795 516,231
Orlando 351,554 338,732 29,634 -35,262 196,997
Palm Beach 135,221 25,166 50,562 -99,699 174,118
Philadelphia 114,559 460,311 755,778 232,951 6,028
Net Absorption
MarketBeat U.S. Shopping Center Q3 2018 cushmanwakefield.com | 5
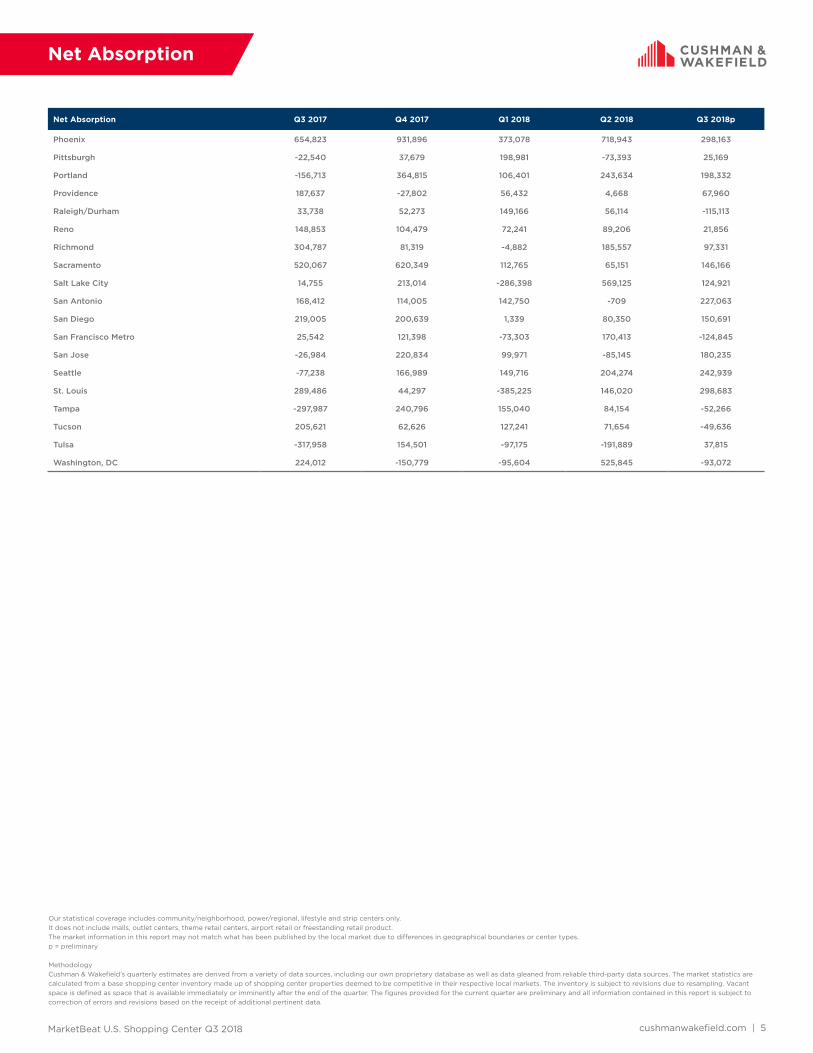
Net Absorption Q3 2017 Q4 2017 Q1 2018 Q2 2018 Q3 2018p
Phoenix 654,823 931,896 373,078 718,943 298,163
Pittsburgh -22,540 37,679 198,981 -73,393 25,169
Portland -156,713 364,815 106,401 243,634 198,332
Providence 187,637 -27,802 56,432 4,668 67,960
Raleigh/Durham 33,738 52,273 149,166 56,114 -115,113
Reno 148,853 104,479 72,241 89,206 21,856
Richmond 304,787 81,319 -4,882 185,557 97,331
Sacramento 520,067 620,349 112,765 65,151 146,166
Salt Lake City 14,755 213,014 -286,398 569,125 124,921
San Antonio 168,412 114,005 142,750 -709 227,063
San Diego 219,005 200,639 1,339 80,350 150,691
San Francisco Metro 25,542 121,398 -73,303 170,413 -124,845
San Jose -26,984 220,834 99,971 -85,145 180,235
Seattle -77,238 166,989 149,716 204,274 242,939
St. Louis 289,486 44,297 -385,225 146,020 298,683
Tampa -297,987 240,796 155,040 84,154 -52,266
Tucson 205,621 62,626 127,241 71,654 -49,636
Tulsa -317,958 154,501 -97,175 -191,889 37,815
Washington, DC 224,012 -150,779 -95,604 525,845 -93,072
Net Absorption
Our statistical coverage includes community/neighborhood, power/regional, lifestyle and strip centers only.It does not include malls, outlet centers, theme retail centers, airport retail or freestanding retail product.The market information in this report may not match what has been published by the local market due to differences in geographical boundaries or center types.p = preliminary
MethodologyCushman & Wakefield’s quarterly estimates are derived from a variety of data sources, including our own proprietary database as well as data gleaned from reliable third-party data sources. The market statistics are calculated from a base shopping center inventory made up of shopping center properties deemed to be competitive in their respective local markets. The inventory is subject to revisions due to resampling. Vacant space is defined as space that is available immediately or imminently after the end of the quarter. The figures provided for the current quarter are preliminary and all information contained in this report is subject to correction of errors and revisions based on the receipt of additional pertinent data.

MarketBeat U.S. Shopping Center Q3 2018 cushmanwakefield.com | 6
Vacancy Rates
Overall Vacancy Rate Q3 2017 Q4 2017 Q1 2018 Q2 2018 Q3 2018p
United States 7.0% 6.7% 6.6% 6.5% 6.5%
Albuquerque 7.7% 7.2% 7.7% 8.0% 7.4%
Atlanta 7.7% 7.7% 7.5% 7.4% 7.3%
Austin 5.1% 5.1% 5.0% 5.2% 4.6%
Bakersfield 9.7% 8.7% 8.8% 7.9% 7.8%
Baltimore 5.4% 5.4% 5.7% 6.0% 5.8%
Birmingham 9.0% 9.4% 7.0% 6.8% 7.3%
Boise 7.9% 8.2% 7.8% 7.3% 6.1%
Boston 3.4% 3.3% 3.5% 3.6% 3.4%
Buffalo 7.0% 6.6% 5.6% 4.1% 4.3%
Charleston 5.7% 5.1% 4.5% 4.9% 3.9%
Charlotte 6.1% 5.8% 5.8% 6.1% 5.8%
Chicago 10.3% 9.9% 9.4% 9.4% 9.6%
Cincinnati 9.1% 9.0% 8.6% 8.5% 8.2%
Cleveland 8.7% 8.3% 7.3% 7.0% 7.0%
Columbus 6.1% 5.2% 5.2% 4.9% 4.6%
Dallas 7.4% 7.2% 7.2% 7.0% 7.1%
Denver 7.3% 6.8% 6.9% 6.9% 6.6%
Des Moines 5.1% 4.2% 3.7% 3.9% 4.1%
Detroit 9.1% 8.9% 9.0% 9.1% 9.5%
Fort Lauderdale/Broward County 4.5% 4.4% 5.1% 5.4% 5.3%
Hampton Roads 6.6% 6.5% 6.6% 7.2% 7.5%
Hawaii 5.1% 5.0% 6.2% 6.4% 6.4%
Houston 7.0% 6.9% 6.4% 6.5% 6.4%
Indianapolis 7.5% 7.6% 6.7% 7.4% 7.4%
Inland Empire 9.0% 8.5% 8.9% 8.8% 8.7%
Jacksonville 7.5% 7.2% 6.7% 6.4% 6.4%
Kansas City 8.0% 7.7% 7.9% 8.3% 7.9%
Knoxville 5.0% 4.7% 7.3% 7.1% 6.7%
Las Vegas 9.3% 8.5% 8.3% 8.2% 8.0%
Little Rock 6.4% 7.1% 7.4% 6.8% 6.8%
Los Angeles 4.8% 4.6% 4.8% 5.0% 4.9%
Louisville 4.8% 4.9% 4.8% 5.1% 5.5%
Memphis 8.7% 7.4% 7.2% 6.8% 7.0%
Miami 3.9% 3.7% 3.9% 3.7% 3.9%
Milwaukee 9.8% 9.5% 8.6% 9.2% 8.8%
Minneapolis 5.9% 5.3% 5.0% 5.0% 5.3%
Mobile 13.3% 10.5% 10.7% 9.9% 9.6%
Nashville 4.6% 4.3% 4.1% 4.1% 4.6%
New Orleans 5.3% 5.3% 5.0% 4.8% 5.7%
New York City Metro (Greater Tri-State) 6.3% 6.2% 6.1% 6.1% 6.2%
Oakland/East Bay 5.7% 5.0% 5.1% 4.9% 4.5%
Oklahoma City 8.6% 8.9% 9.1% 9.3% 9.3%
Omaha 7.6% 7.6% 8.1% 8.0% 8.0%
Orange County 5.2% 5.0% 4.8% 4.7% 4.1%
Orlando 6.5% 6.2% 6.3% 6.4% 6.0%
Palm Beach 5.7% 5.7% 5.6% 5.9% 5.5%
Philadelphia 7.1% 6.9% 6.3% 6.1% 6.2%

MarketBeat U.S. Shopping Center Q3 2018 cushmanwakefield.com | 7
Vacancy Rates
Overall Vacancy Rate Q3 2017 Q4 2017 Q1 2018 Q2 2018 Q3 2018p
Phoenix 10.5% 9.8% 9.5% 9.0% 8.9%
Pittsburgh 4.2% 4.3% 3.9% 4.0% 4.0%
Portland 6.6% 5.8% 5.4% 5.1% 4.8%
Providence 6.7% 6.9% 6.5% 6.5% 6.0%
Raleigh/Durham 4.3% 4.2% 3.7% 3.6% 3.9%
Reno 9.7% 9.0% 8.5% 8.1% 8.0%
Richmond 7.8% 7.7% 7.9% 7.6% 7.4%
Sacramento 9.3% 8.7% 9.0% 8.9% 8.7%
Salt Lake City 6.8% 6.5% 7.5% 7.4% 7.2%
San Antonio 6.5% 6.3% 5.7% 5.9% 5.5%
San Diego 4.9% 4.7% 4.7% 4.5% 4.4%
San Francisco Metro 4.2% 4.0% 4.1% 4.1% 4.4%
San Jose 4.6% 4.1% 3.7% 3.9% 3.8%
Seattle 6.3% 6.0% 5.6% 5.3% 5.0%
St. Louis 7.4% 7.4% 7.3% 7.1% 6.7%
Tampa 7.3% 7.0% 6.4% 6.2% 6.3%
Tucson 8.6% 8.3% 7.7% 7.7% 7.9%
Tulsa 7.3% 6.7% 7.3% 8.0% 7.9%
Washington, DC 5.1% 5.3% 5.1% 4.6% 4.7%
Our statistical coverage includes community/neighborhood, power/regional, lifestyle and strip centers only.It does not include malls, outlet centers, theme retail centers, airport retail or freestanding retail product.The market information in this report may not match what has been published by the local market due to differences in geographical boundaries or center types.p = preliminary
MethodologyCushman & Wakefield’s quarterly estimates are derived from a variety of data sources, including our own proprietary database as well as data gleaned from reliable third-party data sources. The market statistics are calculated from a base shopping center inventory made up of shopping center properties deemed to be competitive in their respective local markets. The inventory is subject to revisions due to resampling. Vacant space is defined as space that is available immediately or imminently after the end of the quarter. The figures provided for the current quarter are preliminary and all information contained in this report is subject to correction of errors and revisions based on the receipt of additional pertinent data.

MarketBeat U.S. Shopping Center Q3 2018 cushmanwakefield.com | 8
Asking Rents
Average Asking Rent Q3 2017 Q4 2017 Q1 2018 Q2 2018 Q3 2018p
United States $16.45 $16.61 $16.77 $17.03 $17.10
Albuquerque $13.39 $14.08 $14.03 $13.89 $15.45
Atlanta $13.46 $13.60 $13.81 $13.93 $13.72
Austin $20.71 $20.94 $21.30 $21.51 $21.51
Bakersfield $13.24 $13.21 $13.92 $16.71 $16.94
Baltimore $17.77 $18.17 $18.77 $20.36 $20.79
Birmingham $10.72 $10.53 $10.76 $11.21 $10.84
Boise $11.95 $12.31 $12.00 $11.84 $11.68
Boston $19.95 $19.52 $18.87 $19.16 $18.86
Buffalo $10.27 $10.60 $10.66 $10.16 $10.28
Charleston $19.73 $18.75 $18.13 $19.31 $18.89
Charlotte $15.10 $15.06 $14.57 $14.76 $14.46
Chicago $14.98 $15.16 $15.40 $15.66 $15.59
Cincinnati $11.03 $12.23 $11.22 $11.46 $11.21
Cleveland $10.61 $10.80 $10.85 $10.94 $11.07
Columbus $11.00 $11.32 $11.11 $11.49 $11.68
Dallas $15.25 $15.76 $15.28 $15.84 $16.05
Denver $16.62 $16.77 $16.97 $16.99 $17.14
Des Moines $10.73 $12.77 $12.11 $12.47 $13.59
Detroit $12.96 $13.01 $12.92 $12.87 $12.97
Fort Lauderdale/Broward County $19.42 $19.87 $22.67 $20.67 $20.31
Hampton Roads $13.98 $14.01 $14.25 $14.29 $14.45
Hawaii $39.11 $36.74 $36.20 $35.14 $35.11
Houston $16.10 $16.51 $16.65 $16.80 $16.94
Indianapolis $12.74 $12.86 $13.26 $13.23 $13.17
Inland Empire $17.75 $17.87 $17.72 $19.30 $19.28
Jacksonville $13.00 $14.01 $14.01 $14.15 $14.51
Kansas City $13.17 $13.35 $13.69 $13.81 $14.26
Knoxville $13.15 $13.48 $12.68 $13.19 $14.05
Las Vegas $17.03 $16.74 $16.72 $17.00 $16.91
Little Rock $12.12 $12.17 $12.85 $12.92 $12.53
Los Angeles $27.50 $26.79 $26.13 $26.17 $26.22
Louisville $12.08 $11.84 $11.17 $11.76 $11.87
Memphis $10.96 $10.97 $10.76 $10.79 $11.82
Miami $29.56 $29.44 $29.98 $29.64 $29.52
Milwaukee $12.20 $12.18 $12.33 $12.53 $12.43
Minneapolis $14.44 $14.99 $15.04 $15.06 $14.17
Mobile $9.07 $9.12 $10.03 $10.60 $10.65
Nashville $16.20 $16.17 $15.75 $15.93 $16.05
New Orleans $15.44 $13.69 $13.76 $14.15 $14.03
New York City Metro (Greater Tri-State) $20.40 $20.77 $21.23 $21.40 $21.64
Oakland/East Bay $24.39 $23.74 $24.02 $22.47 $23.13
Oklahoma City $11.90 $12.93 $13.36 $13.08 $13.10
Omaha $12.83 $12.76 $12.88 $13.02 $12.70
Orange County $25.57 $25.42 $25.17 $25.23 $25.55
Orlando $16.77 $17.59 $18.68 $19.20 $19.23
Palm Beach $19.96 $20.31 $20.44 $21.76 $22.38
Philadelphia $15.27 $15.90 $16.95 $17.39 $16.69

MarketBeat U.S. Shopping Center Q3 2018 cushmanwakefield.com | 9
Asking Rents
Rental rates reflect triple net asking $psf/annually for all tracked shopping center types. This metric reflects currently available space across all class and size ranges foreach respective shopping center type. Our statistical coverage includes community, neighborhood, power and lifestyle centers only. Rental rates are weighted.It does not include malls, outlet centers, theme retail centers, airport retail or freestanding retail product.The market information in this report may not match what has been published by the local market due to differences in geographical boundaries or center types.p = preliminary
MethodologyCushman & Wakefield’s quarterly estimates are derived from a variety of data sources, including our own proprietary database as well as data gleaned from reliable third-party data sources. The market statistics are calculated from a base shopping center inventory made up of shopping center properties deemed to be competitive in their respective local markets. The inventory is subject to revisions due to resampling. Vacant space is defined as space that is available immediately or imminently after the end of the quarter. The figures provided for the current quarter are preliminary and all information contained in this report is subject to correction of errors and revisions based on the receipt of additional pertinent data.
Average Asking Rent Q3 2017 Q4 2017 Q1 2018 Q2 2018 Q3 2018p
Phoenix $14.70 $14.99 $14.81 $15.23 $15.31
Pittsburgh $14.56 $14.47 $15.36 $15.50 $14.63
Portland $18.84 $19.51 $19.06 $18.81 $18.77
Providence $12.36 $12.61 $13.36 $13.53 $14.01
Raleigh/Durham $17.23 $17.24 $17.62 $17.91 $17.89
Reno $14.87 $14.68 $14.58 $16.19 $15.76
Richmond $15.07 $14.59 $15.20 $16.16 $17.44
Sacramento $16.39 $16.27 $16.37 $16.80 $17.05
Salt Lake City $15.41 $15.30 $14.83 $14.50 $16.51
San Antonio $14.94 $14.94 $15.01 $15.46 $15.97
San Diego $23.02 $23.01 $22.76 $22.98 $23.03
San Francisco Metro $23.41 $23.37 $24.27 $24.86 $24.59
San Jose $31.20 $30.80 $32.45 $33.16 $33.30
Seattle $19.42 $19.64 $19.77 $19.68 $20.10
St. Louis $12.46 $12.47 $12.54 $12.71 $12.61
Tampa $14.57 $14.94 $14.43 $14.77 $15.18
Tucson $15.46 $15.15 $15.37 $15.05 $14.98
Tulsa $11.01 $11.04 $11.26 $11.28 $11.22
Washington, DC $28.33 $27.74 $27.18 $27.63 $27.09
*Due to a methodology change, rental rates quoted herein may not match previously reported trends.

MarketBeat U.S. Shopping Center Q3 2018 cushmanwakefield.com | 10
Inventory
Inventory Deliveries YTD 2018 Under Construction as of Q3 2018
United States 4,100,984,125 11,393,908 16,919,512
Albuquerque 20,191,480 64,485 163,787
Atlanta 140,240,656 135,877 705,051
Austin 49,646,246 111,547 328,560
Bakersfield 11,445,802 38,434 37,169
Baltimore 50,608,405 24,620 569,245
Birmingham 27,298,880 65,534 2,550
Boise 18,098,795 10,966 116,000
Boston 68,588,898 69,381 11,000
Buffalo 20,539,613 0 0
Charleston 15,619,905 0 130,813
Charlotte 67,647,808 376,292 220,014
Chicago 190,239,648 313,218 390,343
Cincinnati 69,523,691 40,093 76,826
Cleveland 86,797,980 379,218 562,519
Columbus 46,159,173 9,900 0
Dallas 190,503,689 994,794 483,685
Denver 84,577,654 249,161 221,593
Des Moines 12,057,705 33,106 0
Detroit 87,562,152 297,330 233,443
Fort Lauderdale/Broward County 56,696,586 217,665 908,048
Hampton Roads 53,982,576 120,874 89,334
Hawaii 23,940,005 147,265 157,824
Houston 166,125,214 1,108,006 855,005
Indianapolis 48,092,124 42,192 111,029
Inland Empire 103,240,746 651,123 795,840
Jacksonville 42,990,048 87,712 366,074
Kansas City 58,666,202 151,700 209,025
Knoxville 19,618,656 21,975 0
Las Vegas 70,192,839 209,112 256,711
Little Rock 15,963,882 32,670 0
Los Angeles 191,504,912 315,772 413,023
Louisville 27,167,025 22,400 0
Memphis 38,478,677 6,024 0
Miami 57,073,183 156,014 768,002
Milwaukee 37,136,093 92,904 26,094
Minneapolis 65,231,985 61,079 27,760
Mobile 5,990,606 0 0
Nashville 37,928,481 12,240 53,122
New Orleans 16,201,592 81,870 0
New York City Metro (Greater Tri-State) 274,346,205 913,438 1,717,553
Oakland/East Bay 51,921,377 244,152 379,405
Oklahoma City 32,321,756 18,935 114,437
Omaha 21,553,774 45,800 27,984
Orange County 84,131,126 6,600 143,477
Orlando 53,068,040 108,507 654,771
Palm Beach 43,842,348 27,153 48,680
Philadelphia 140,792,062 483,903 461,480

MarketBeat U.S. Shopping Center Q3 2018 cushmanwakefield.com | 11
Inventory
Our statistical coverage includes community, neighborhood, power and lifestyle centers only. Rental rates are weighted.It does not include malls, outlet centers, theme retail centers, airport retail or freestanding retail product.The market information in this report may not match what has been published by the local market due to differences in geographical boundaries or center types.p = preliminary
MethodologyCushman & Wakefield’s quarterly estimates are derived from a variety of data sources, including our own proprietary database as well as data gleaned from reliable third-party data sources. The market statistics are calculated from a base shopping center inventory made up of shopping center properties deemed to be competitive in their respective local markets. The inventory is subject to revisions due to resampling. Vacant space is defined as space that is available immediately or imminently after the end of the quarter. The figures provided for the current quarter are preliminary and all information contained in this report is subject to correction of errors and revisions based on the receipt of additional pertinent data.
Inventory Deliveries YTD 2018 Under Construction as of Q3 2018
Phoenix 137,091,762 312,206 298,346
Pittsburgh 55,316,417 52,200 39,474
Portland 46,879,242 205,186 95,737
Providence 14,626,380 0 0
Raleigh/Durham 46,230,477 36,400 225,232
Reno 14,962,714 42,322 0
Richmond 38,416,653 95,507 298,842
Sacramento 60,827,568 345,393 253,755
Salt Lake City 53,721,624 606,294 421,861
San Antonio 56,978,977 132,048 862,848
San Diego 67,984,268 115,694 252,133
San Francisco Metro 41,030,947 191,708 68,600
San Jose 37,437,995 198,936 408,306
Seattle 57,715,191 88,995 186,995
St. Louis 67,609,517 10,056 120,000
Tampa 69,055,027 108,160 40,180
Tucson 25,030,708 87,344 0
Tulsa 25,271,739 6,000 65,400
Washington, DC 89,250,619 158,418 444,527

About Cushman & Wakefield
Cushman & Wakefield (NYSE: CWK) is a leading global real estate services firm that delivers exceptional value by putting ideas into action for real estate occupiers and owners. Cushman & Wakefield is among the largest real estate services firms with 48,000 employees in approximately 400 offices and 70 countries. In 2017, the firm had revenue of $6.9 billion across core services of property, facilities and project management, leasing, capital markets, valuation and other services. To learn more, visit www.cushmanwakefield.com or follow @CushWake on Twitter.
©2018 Cushman & Wakefield. All rights reserved. The information contained within this report is gathered from multiple sources believed to be reliable. The information may contain errors or omissions and is presented without any warranty or representations as to its accuracy.
Garrick BrownVice President Head of Americas Retail ResearchTel: +1 916 329 1558Fax: +1 916 376 [email protected] cushmanwakefield.com
Pamela Flora Director Americas Retail ResearchTel: +1 858 558 5634Fax: +1 858 452 [email protected] cushmanwakefield.com