Embed Size (px)
Citation preview

ANNUAL REPORT
2007
Wyoming Game and Fish Department

WYOMING GAME AND FISH DEPARTMENT
5400 Bishop Blvd. Cheyenne, WY 82006
Phone: (307) 777-4600 Fax: (307) 777-4610
Web site: http://gf.state.wy.us
GOVERNOR DAVE FREUDENTHAL
DIRECTOR TERRY CLEVELAND COMMISSIONERS BILL WILLIAMS, DVM – President JERRY GALLES – Vice President CLARK ALLAN CLIFFORD KIRK FRED LINDZEY RON LOVERCHECK ED MIGNERY
March 14, 2008 The Honorable Dave Freudenthal Governor, State of Wyoming Capitol Building Cheyenne, WY 82002 Dear Governor Freudenthal:
In accordance with Section 23-1-503 of Wyoming Statutes, it is my pleasure to present to you the Game and Fish Department’s 2007 Annual Report. The report was prepared at the direction of the Game and Fish Commission and covers the period July 1, 2006 through June 30, 2007.
We appreciate your support on the many issues facing wildlife and wildlife habitat in Wyoming. While there are many challenges facing us, I would encourage you to note the many successes our agency has experienced in the past year. These successes are the products of a dedicated agency workforce and an enlightened public.
Sincerely,
Bill Williams, DVM, President Wyoming Game and Fish Commission

2007 ANNUAL REPORT
Wyoming Game and Fish Department


2007 ANNUAL REPORT Table of Contents
PAGE
Commissioner Message to the Governor........................................................................................... Message from the Director............................................................................................................... i Director’s Office and Commission Photographs ........................................................................... iii Organizational Chart........................................................................................................................v Director’s Summary...................................................................................................................... vii INTRODUCTION AND DIVISION REPORTS Introduction..........................................................................................................................1 Fiscal Division .....................................................................................................................3 Fish Division........................................................................................................................5 Services Division .................................................................................................................9 Wildlife Division ...............................................................................................................13 PROGRAM-LEVEL REPORTS Aquatic Wildlife Management...........................................................................................17 Bird Farms .........................................................................................................................21 Conservation Education .....................................................................................................23 Conservation Engineering..................................................................................................26 Customer Services .............................................................................................................30 Department Administration ...............................................................................................36 External Research ..............................................................................................................40 Feedgrounds.......................................................................................................................42 Financial Management.......................................................................................................47 Habitat................................................................................................................................51 Habitat and Access Management.......................................................................................59 Habitat Protection ..............................................................................................................66 Information ........................................................................................................................69 Information Technology ....................................................................................................75 Legislatively Mandated Expenses......................................................................................84 Personnel Management......................................................................................................85 Property Rights (Lands) Management ...............................................................................89 Regional Information and Education Specialist ................................................................95 Regional and Terrestrial Wildlife Management ..............................................................100 Specialized Statewide Law Enforcement.........................................................................105 Statewide Terrestrial Wildlife Management ..............................................................112 Strategic Management .....................................................................................................128 Support Facilities and Personnel......................................................................................130 Wildlife Health Laboratory Services ...............................................................................133

APPENDIX A INDIVIDUAL MANAGEMENT REPORTS BIG GAME Pronghorn............................................................................................................ A-1 Elk ....................................................................................................................... A-2 Mule Deer ........................................................................................................... A-3 White-tailed Deer................................................................................................ A-4 Moose.................................................................................................................. A-5 Bighorn Sheep..................................................................................................... A-6 Rocky Mountain Goat......................................................................................... A-7 Bison ................................................................................................................... A-8 TROPHY GAME Black Bear........................................................................................................... A-9 Grizzly Bear ...................................................................................................... A-10 Mountain Lion .................................................................................................. A-11 SMALL GAME
Cottontail........................................................................................................... A-13 Snowshoe Hare ................................................................................................. A-14 Squirrel.............................................................................................................. A-15
UPLAND GAME
Pheasant ............................................................................................................ A-17 Gray Partridge................................................................................................... A-18 Chukar............................................................................................................... A-19 Sage Grouse ...................................................................................................... A-20 Sharp-tailed Grouse .......................................................................................... A-21 Blue Grouse ...................................................................................................... A-22 Ruffed Grouse................................................................................................... A-23 Mourning Dove................................................................................................. A-24 Turkey ............................................................................................................... A-25
WATERFOWL
Duck.................................................................................................................. A-27 Goose ................................................................................................................ A-28 Sandhill Crane................................................................................................... A-29 Rail, Snipe, Coot ............................................................................................... A-30
FISHERIES
Sport Fisheries .................................................................................................. A-31 Commercial Fisheries ....................................................................................... A-32
FURBEARERS
Bobcat ............................................................................................................... A-33 Other Furbearers ............................................................................................... A-34
RAPTORS..................................................................................................................... A-35

NONGAME AND NON-LICENSED USES PROGRAMS ........................................ A-37 APPENDIX B HUNTER AND ANGLER EXPENDITURES
Summary of 2006 Expenditures by Hunters and Anglers ...................................B-1 Restitution Values of Game Animals ..................................................................B-3
APPENDIX C BUDGET AND FINANCIAL SUMMARIES
FY 2008 Budget Summary .................................................................................C-1 Detail Budget, Strategic Plan (Excluding Reimbursement Projects and Mitigation) ......................................................................................C-2 WGF Commission FY08 Budget – Trust Fund Projects ....................................C-4 Maintenance and Operations (FY 07-FY 08) ......................................................C-6 Statement of Assets, Liabilities and Fund Balances ............................................C-7 Statement of Revenue and Expenditures .............................................................C-8 Schedule of Expenditures by Strategic Plan Objectives ......................................C-9 Statewide Five-Year Comparison of License Sales...........................................C-10 Expenditure Allocations by Program.................................................................C-17 Agency Expenditure by Species......................... .............................................. C-19 Agency Expenditures by Program Basis Five-Year History .............................C-20 Agency Expenditures by Activity Basis ............................................................C-23 Landowner Coupons and Damage Claims.........................................................C-27
REFERENCES ..................................................................................................................................


i
A Message from the Director When Wyoming became a state in 1890, wildlife populations had been decimated due to unregulated hunting and trapping. Thanks to far-sighted legislators and committed hunters, anglers and other conservationists, over the years wildlife numbers have rebounded and Wyoming now hosts an abundance and diversity of wildlife species and wild places. The tradition of maintaining Wyoming's premier wildlife resource continues at the Wyoming Game and Fish Department, as you will see compiled in this, the 2007 Annual Report. In this report, you will find annual progress reports for each major division and program administered by the Department, as well as species summaries and financial information. However, this report can only tell part of the story. I hope that you will take the time to dig a little deeper to understand how the Game and Fish Department under the leadership of the Wyoming Game and Fish Commission is working to conserve wildlife and serve people with our many other available sources of information, such as public meetings, the Wyoming Game and Fish Department website, Wyoming Wildlife magazine, news releases, the monthly E-newsletter or reports and summaries from individual divisions. Today there are many new challenges facing our wildlife: habitat loss as a result of continuing drought; housing and other development; oil, gas and mineral production; diseases; invasive species and much more. However, no matter the issue, I am certain the State of Wyoming and the dedicated Wyoming Game and Fish Commission and Game and Fish staff, as well as hunters, anglers and other committed citizens, will be able to face the challenges of the future and help keep Wyoming a place of abundant wildlife and wild places. Sincerely,
Terry Cleveland Director

ii

Governor Dave Freudenthal
Terry Cleveland Director
John Emmerich Deputy Director
Gregg Arthur Deputy Director
iii

COMMISSION
Bill Williams, DVM Commission President
Veterinarian from Thermopolis. Represents Park, Big Horn, Hot Springs and Washakie counties.
Ronald “Jerry” Galles Commission Vice-President
Business owner from Casper. Represents Converse, Natrona and Fremont counties.
Clark Allen Deputy County Attorney in Teton County from Jackson. Represents Teton, Sublette, Lincoln and Uinta counties.
Clifford Kirk Banker from Gillette. Represents Sheridan, Johnson and Campbell counties.
Fred Lindzey Retired Biologist. Professor Emeritus, University of Wyoming, from Laramie. Represents Sweetwater, Carbon and Albany counties.
Ron Lovercheck Real Estate/Rancher from LaGrange. Represents Platte, Goshen and Laramie counties.
Ed Mignery Electric Cooperative Engineering Support Supervisor from Sundance. Represents Crook, Weston and Niobrara counties.
iv

v

vi

vii
Director's Summary New Commissioners Wyoming Governor Dave Freudenthal appointed two new Wyoming Game and Fish Commissioners: Fred Lindzey of Laramie and Ed Mignery of Sundance. Fred Lindzey is a retired University of Wyoming professor and assistant leader for the Wyoming Cooperative Fish and Wildlife Research Unit and was appointed to District #2, representing Sweetwater, Albany and Carbon County. Ed Mignery is an electric cooperative engineering support supervisor. He was appointed to District #6, representing Crook, Weston and Niobara County. Commissioners Lindzey and Mignery replaced outgoing Commissioners Linda Fleming and Kerry Powers, respectively. Leadership Development In the Wyoming Game and Fish Department, numerous employees in nearly all staff-level positions and throughout the Department are currently eligible for retirement, or will be in the next three years. The Department created a Leadership Development Program for emerging leaders with a desire to move or advance into positions of formal leadership. Twenty-one participants, including representatives from each division, were selected for the first program class. Each Level 1 session will last about one year, and will include elements of assessment, training, mentoring, assignments and short-term team experiences. The program will be administered by the Services Division under the direction of the Division Chief and the Leadership Development Program Steering Committee. Wolf Management Update Following passage of legislation in early 2007 directing future wolf management in Wyoming, in May 2007, Wyoming and the U.S. Fish and Wildlife Service reached an agreement that allows Wyoming to be included in the final gray wolf delisting rule that was published in the Federal Register on February 27, 2008. A revised Wyoming wolf management plan was adopted by the Wyoming Game and Fish Commission in November 2007 and approved by the U.S. Fish and Wildlife Service in December 2007. Wyoming’s new wolf plan designates wolves as trophy game animals in a larger portion of northwest Wyoming than did Wyoming’s original plan. Wolves will be protected in Yellowstone National Park and adjoining lands included in the national park system. In the remainder of the state, outside of the trophy game area, wolves will be classified as predatory animals. Wyoming will manage for at least 15 breeding pairs of wolves in the State. A minimum or 7 breeding pairs will be managed for outside the national park system in the state, and the remaining breeding pairs will be in the national parks in northwestern Wyoming. The states of Wyoming, Montana, and Idaho will assume full management authority for wolves on March 28, 2008. However, a number of groups have filed a 60-day notice of intent to file a lawsuit challenging the Service’s delisting rule, and it is possible that the transition to state management could be delayed as a result of a lawsuit. The 2008 Wyoming Legislature appropriated $2.4 million of general fund money to the Department for wolf management over the next two fiscal years. The Department will use that money to hire four additional personnel responsible for wolf monitoring, wolf management, and wolf/livestock conflict resolution.

viii
Grizzly Bears The U.S. Fish and Wildlife Service proposed to delist grizzly bears in the Yellowstone ecosystem in November 2005. The proposal was reviewed at four open houses and two public hearings; more than 193,500 public comments were received. In March 2007, the U.S. Department of Interior announced it would remove the Yellowstone population of grizzly bears from its status as threatened on the list of threatened and endangered species. Effective in late May, 2007 grizzly bears in Wyoming are no longer listed and are under state management. Current litigation may impact the delisting decision. Four other grizzly populations in the lower 48 states will continue to be protected as threatened species under the act. Grizzly bear numbers in the Yellowstone ecosystem have increased from an estimated population of 136 to 312 when they were listed as threatened in 1975, to more than 600 bears today. Yellowstone grizzly bears will now be managed under Wyoming’s 2005 Grizzly Bear Management Plan. The conservation strategy incorporates the best available science and allows state and federal agencies to adjust management in response to new scientific information or environmental and bear population changes. State and federal managers will continue to work cooperatively under this framework to manage and maintain healthy grizzly bear populations throughout the Greater Yellowstone area. Grizzly Bear/Wolf Documentary The Department produced a one-hour documentary examining the implications of grizzly bear and wolf populations in the Yellowstone ecosystem and in Wyoming specifically. This production focuses on the benefits and challenges posed by recovered populations of these predators and features numerous interviews with people who live, work, and recreate in wolf and grizzly bear country. The documentary will air on the Versus Network in March 2008. Mule Deer Initiative Across the west and in Wyoming, mule deer numbers have declined since the 1950s and 1960s for a variety of reasons, including habitat loss, weather and predation. Because mule deer are so important to the state, the Game and Fish created the Mule Deer Initiative, a strategic plan to address the many factors affecting this important species. The Mule Deer Initiative focuses on six conservation goals: conserve, enhance and restore mule deer habitat; manage wildlife populations to sustain productive habitat conditions and populations through a hunting framework; apply the best available science to monitor deer populations and habitat conditions; develop cooperative working relationships with other agencies and organizations to conduct applied research; inform and educate the public regarding issues affecting the conservation of mule deer; and enhance funding and public support for mule deer management. Department personnel conducted a series of open houses on the Mule Deer Initiative in March and April. The Mule Deer Working Group and other personnel will continue to inform and educate the public about the initiative and ways they can help get involved in the ongoing effort.

ix
Sage Grouse Wyoming’s eight local sage grouse working groups are continuing their efforts to develop local conservation plans. Each working group has 10-15 members, including representatives from agriculture, industry, conservation and government. These eight working groups cover the entire sage grouse habitat in Wyoming. Priorities for each group are determined locally. Seven conservation plans have been completed and approved by the Wyoming Game and Fish Commission. The Wyoming legislature appropriated $1.1 million in general funds in 2007-2008 for local sage grouse working group efforts. Governor Dave Freudenthal hosted a sage grouse summit in Casper in June, to supplement the working groups' efforts. Following the summit, a statewide sage grouse implementation team was formed and tasked with promoting collaborative management and planning sage grouse conservation from a state level. Bighorn Sheep In January, the Wyoming Game and Fish Department conducted its third bighorn sheep transplant in recent years. This time the transplant occurred in Laramie Peak area near Wheatland. Forty-two bighorns from Near Plains, Montana, were released in the Laramie Peak area, to supplement the current herd of 200. The transplant is also part of a long-term study of habitat that burned in a 2002 wildfire. GPS collars were fitted on 30 of the bighorns, and their movements will be tracked using GIS technology. Maps will be created to analyze habitat use, daily and seasonal movement, adult survival, lambing locations and reproductive rates. The total project cost was $103,000 and was funded through donations from state and national chapters of the Foundation for North American Wild Sheep, the Wyoming Governor’s Big Game License Coalition and Dooley Oil in Laramie. Chronic Wasting Disease Chronic Wasting Disease (CWD) was identified in five additional hunt areas in Wyoming in 2006, including deer hunt area 4 in the Black Hills, deer hunt area 11 in Weston and Niobrara counties, and elk hunt areas 16 in the Shirley Basin, area 22 in northwest Carbon county and area 14 south of Encampment. Wyoming Game and Fish Department personnel expanded testing in early 2007 to include most areas in western Wyoming; CWD was not detected in those locations. Note: As of the publication date of this report, CWD was identified in seven additional hunt areas. A statewide surveillance conducted in 2007 revealed CWD in deer hunt area 12 in eastern Niobrara county; deer hunt area 23 in Sheridan county; deer hunt area 87 in Carbon and Natrona counties, deer hunt area 122 in Bighorn county; deer hunt area 125 in Hot Springs and Washakie counties; and deer hunt area 163 in southwestern Johnson county, as well as elk hunt area 110 in southeastern Carbon county. Brucellosis The Wyoming Game and Fish Department continues to implement all of the wildlife recommendations of the Governor’s Brucellosis Coordination Team. Brucellosis Management Action Plans for all herd units in northwest Wyoming have been completed.

x
For the second year, Wyoming Game and Fish personnel trapped elk in January 2007 as part of the Muddy Creek feedground test-and-removal pilot project. Personnel captured 79 adult cow elk, 13 of which tested seropositive for brucellosis. Biologists recently classified the Muddy Creek feedground and determined that there were a total of 383 elk on the feedground, with 228 being adult female test eligible animals. All seropositive elk were transported to an Idaho USDA processing facility. Meat from the elk was donated to a Wyoming food bank for donation to families in need. In addition to the removal of seropositive elk, there is also research in brucellosis management evolving from this project. Tissue samples were collected from all 13 seropositive elk and will be cultured to determine if the animals were actually infected and capable of transmitting the disease. There is also cooperative research being conducted with the U.S. Geological Survey on the relationship between parasites, such as lungworms, and rates of brucellosis infections on feedgrounds. Some evidence suggests that parasites may play a role in disease transmission. Wyoming regained its Brucellosis Class Free status in September 2006. Ongoing research is part of the effort to reduce brucellosis in wildlife and maintain Wyoming’s brucellosis free status. Avian Influenza The Game and Fish Department completed its first year of surveillance for highly pathogenic avian influenza (HPAI), subtype H5N1, with all samples testing negative for the disease. Wyoming Game and Fish personnel collected a total of 532 samples from live-captured and hunter-killed birds. Samples of waterfowl and shorebirds, including sandpipers, geese and teal were collected. With assistance from the Wyoming Livestock Board, samples were also collected from pheasants at the Department’s pheasant farms. The Department’s results were part of a larger surveillance and outreach effort in Wyoming, involving the Wyoming Livestock Board, Wyoming State Veterinary Laboratory, Wyoming Department of Health and USDA-APHIS Wildlife Services. More than 1,600 samples were collected in Wyoming – 532 from Game and Fish, 681 from Wildlife Services and 408 from the Livestock Board. All tested negative for HPAI H5N1. Game and Fish, along with these partners, created a frequently asked questions sheet on avian influenza. Press releases along with additional news on radio, television and in Wyoming Wildlife Magazine are being used to keep public abreast of the avian influenza situation. Legislative Efforts Game and Fish developed several proposals for the 2007 session of the Wyoming State Legislature to address Department funding needs, including a proposal for alternative funding for programs such as wildlife habitat and sensitive species. The Legislature approved a 20 percent increase on most Game and Fish licenses to keep on par with inflationary increases to take effect in 2008. This increase will generate approximately $5.6 million annually. The Legislature also approved compensation to the Game and Fish Commission in the amount of approximately $1 million annually for licenses issued free of charge or at reduced rates based upon past legislative action. The Legislature also again provided capital facilities funding to the Department, which

xi
helped the Department acquire a new Regional Office building in Pinedale as well as continue renovations at fish hatcheries. The Department submitted a proposal for nongame program funding for the 2008 Wyoming Legislative session. The Legislature granted $1.82 million for sensitive species and nongame work, which allows the entire sensitive species program to be funded via general funds. An additional $609,000 was given to the Department to begin sensitive species work. There is ongoing work to obtain additional funding, especially for threatened and endangered species, and other species in need of special attention. Fishing Regulations Public meetings to discuss revisions for the 2008-2009 Wyoming fishing regulations were held across the state, including an initial round of public scoping meetings followed by a second round of more formalized public meetings. The goals of the revised regulations were to clarify and shorten the fishing regulations while providing diverse fishing opportunities and conserving aquatic resources. Major changes included separate trout limits on many rivers and streams. There is also a separate daily limit for brook trout. Walleye and sauger have separate creel limits, and changes were made to live baitfish regulations and spear fishing. Watercraft regulations were also modified, with the most significant change requiring anyone 12 years and younger to wear a life jacket when the watercraft is underway. This new language makes Wyoming’s regulations consistent with U. S. Coast Guard regulations. Colorado River Cutthroat Trout The Game and Fish worked to provide in-depth comments that supported a U.S. Fish and Wildlife Service status review and 12-month finding for Colorado River cutthroat trout. The multi-state conservation agreement, range-wide coordination efforts and ongoing management and conservation activities were crucial in the support of the Service's decision that listing of the Colorado River cutthroat trout under the Endangered Species Act is not warranted. The Department completed another year of work on the LaBarge Creek restoration project, treating 58 stream miles to remove all the fish from the drainage. The goal of the project is to restore the entire upper reaches of the LaBarge Creek drainage to the Colorado River cutthroat trout, the only trout native to the Green River drainage. Fish managers determined that, at the end of the August 2006 treatments, they had finally removed all the nonnative fish in the drainage, paving the way for restocking with hatchery raised Colorado River cutthroats in late summer 2007. Energy Development With Wyoming’s energy boom continuing, wildlife and wildlife habitat in oil and gas development areas continues to be a high priority of Game and Fish. The Department will continue to work closely with the Governor’s Office, Oil and Gas Commission, Bureau of Land Management, Forest Service, environmental organizations, industry representatives and local communities to address concerns for wildlife and develop strategies for mitigating impacts to wildlife and habitat across the state.

xii
Electronic Licensing In January 2007, the Game and Fish launched the online hunting license application system, offering hunters the opportunity to apply for limited quota deer, elk, antelope, bighorn sheep, mountain goat, moose and turkey licenses. Online applicants certify their residency using an electronic oath form, and have the option of applying individually or as a party. Hunters can also pay for their license using a credit card and donate to AccessYes or search and rescue upon checkout. To date, about 35 percent of all limited quota applicants are using the online system. The online hunting application system will be combined with the Department’s electronic point of sale system that will be test-run by license selling agents beginning in 2008. The end result will be an integrated electronic licensing system that not only meets the ever-changing needs of the agency, but more importantly, meets the needs of hunters and anglers in an efficient, convenient and user-friendly system. Wyoming Landscape Conservation Initiative The Wyoming Landscape Conservation Initiative (WLCI) is a long-term science based collaborative effort to ensure Wyoming’s wildlife and their habitats are fully considered and addressed in the face of increasing land use pressures in Wyoming. This is a multi-agency effort involving the Game and Fish, BLM, U.S. Fish and Wildlife Service, U.S. Geological Survey, Forest Service and others. The goal of the WLCI is to conserve Wyoming’s wildlife resources and facilitate responsible development of critical energy resources. The WLCI will initially focus on 15 million acres of mostly public lands in southwest Wyoming. This area is estimated to contain approximately 85 trillion cubic feet of recoverable natural gas. The area also has a rich wildlife resource with 100,000 deer, 40,000 elk, 100,000 pronghorn antelope, 8,000 moose, 1,400 bighorn sheep and the highest density of sage grouse within their western range. Wildlife Heritage Summit The Wildlife Heritage Foundation of Wyoming hosted the Wildlife Heritage Summit May 11-12 in Casper, Wyoming. The summit brought together representatives from conservation groups, hunters, anglers and state and federal agencies to discuss current and future wildlife priorities. About 200 people participated, hearing presentations and panel discussions on global climate change, energy development, economic and demographic changes in Wyoming and open spaces.

INTRODUCTION
DIVISION REPORT NARRATIVES


1
INTRODUCTION This report covers the progress and financial status of the Wyoming Game and Fish Department during Fiscal Year 2007. The information documents progress toward objectives stated in the Wyoming Game and Fish Department’s Four-Year Plan (FY 07-FY 11), September 2006. During FY 2007 a total of 3,531431 hunting and fishing recreation days were provided to the public. Based on hunting and fishing expenditure surveys conducted in Wyoming since 2001, hunters, anglers, and trappers expended approximately $684,109,000 in pursuit of their sport. At the end of the period covered by this report (June 30, 2007), the Department was comprised of 405 permanent full-time employees and 58 temporary or seasonal workers. A summary of Department activities by respective division follows.

2

3
FISCAL DIVISION Rich Reynders, Chief
In FY 07 the Fiscal Division spent significant hours and resources with various automated projects, employee agency wide training, and legislative issues. The division oversees all financial operations of the Department, including budget development, financial reporting, accounts payable, purchasing, asset management, federal funds (grant) management, contract management, revenue collection and licensing. Additionally, the division is responsible for the operation and maintenance of various automated systems for licensing, revenue reporting, cost accounting, vehicle management, credit card payments and other accounts payable, landowner coupons and time reporting. In FY 07, the Department was involved in significant changes in its licensing systems. Internet applications were made available for the first time in January 2007 with a 30 percent subscription rate for the Department’s major big game draws. The use of the Internet and changing of the preference point period to July 1 through September 30 allowed the Department, even with an overall license application increase of 6 percent over the previous fiscal year, to reduce the number of temporary man-hours and related personnel costs by approximately 33 percent. The current license draw system is being rewritten and will be moved to a server environment sometime in the spring of 2008, further reducing operating costs. The division continued to work on the point-of-sale licensing system to automate license selling agents. Implementation of the system was delayed by approximately one year, due to management changes with the Department’s vendor, Outdoor Central. It is anticipated that by late fall 2007, rollout of the system to regional offices will begin with automation at the external agent level beginning in spring 2008. While the majority of the system design was accomplished with external vendors, the Department will be managing and maintaining the system in-house. This trend reflects the majority of other state wildlife agencies, who either have or are in the process of pulling their systems in-house due to escalating vendor rates and instability in the vendor market for licensing systems. This new system will provide simplified and improved reporting of license information for license selling agents, harvest surveys, federal aid and financial information in addition to allowing customers to consolidate many of their licenses on one form. Progress was also made on the continued replacement of several internal financial systems. The last system to be rewritten, the cost accounting system, had to be delayed due to implementation by the State Auditor of a new accounting system July 1, which impacted many of the Department’s operations and necessitated updates to other existing financial interfaces. The cost accounting system rewrite should be complete by the end of FY 08. The division also made several appearances before the legislature and legislative committees regarding funding issues. In 2007, the Department was successful in receiving a license fee increase based on inflation over the last four years effective January 1, 2008 in addition to a $1.1 million appropriation to replace lost revenue for licenses that the Department issues for free or reduced prices, in accordance with statutory requirements. The Department also began work on a 2009-2010 legislative general fund budget request in addition to preparing the Commission budget, which is developed on an annual basis and presented to the Commission for review and authorization each April.

4
The number of grants that the division administers continues to grow, with the Department now receiving over 25 percent of its revenue from federal and private grants. The Department receives grants from more than ten federal agencies (U.S. Fish and Wildlife Service, Forest Service, Bureau of Land Management, Bureau of Reclamation, Natural Resources Conservation Service, U.S. Coast Guard, Department of Homeland Security, Environmental Protection Agency, U.S. Geological Survey, USDA-APHIS) in addition to a number of state and local government entities and non-for-profit organizations. The Fiscal Division is the primary source of financial information for the Department and the point of contact for all internal and external state government financial audits.

5
FISH DIVISION Mike Stone, Chief
The Fish Division is responsible for management of all aquatic wildlife including fish, mollusks, crustaceans, amphibians and reptiles. We continue to strive to meet the dual purpose of conserving native species and maintaining high-quality sportfishing opportunities. In FY 07, the Fish Division accomplished some noteworthy achievements including:
• Capital facilities renovations continued this year following the official dedication
of Wigwam and Dubois facilities. This year we initiated the $10.5 million Speas Fish Hatchery renovation and enlargement. The new water line from the well and water conditioning equipment was installed. When complete, the modernized and enlarged Speas will revolutionize our fish culture program.
• This year a team of division employees authored a series of simplified fishing regulations changes designed to be more angler and enforcement staff friendly. Also substantially changed were many portions of our live baitfish regulations designed to protect aquatic resources but provide anglers with greater availability of bait. The public provided good input to adjust the regulation package prior to review and adoption by the Commission.
• The LaBarge Creek Barrier was repaired and modified and the stream treated one last time prior to reintroduction of Colorado River cutthroat trout. The scope, success and importance of the reintroduction effort at LaBarge Creek made it one of the “Top-10 Waters to Watch” in the United States.
• Fulfillment of vacant key positions was an on-going effort throughout the year. Fortunately, we continue to find superb replacements to key personnel. This year, four of the nine fish staff positions were fulfilled, two each in Fish Management and Aquatic Habitat. Additionally, we replaced four assistant hatchery superintendents, five fish culturists, and our information technology position.
Hydrologic drought conditions continued to persist over much of the state. Laramie River, North Platte River and Green River basins have been particularly afflicted. As a consequence, sport fisheries in the plains lakes area demonstrated significant population declines. In the Laramie and Casper Region we experienced both winter and summer kills. Energy development in the Sheridan, Pinedale and Green River regions continues to shift work priorities so we can address impacts to aquatic wildlife from exploration and production activities. The work of our biologist/energy liaison in Sheridan has been effective working with industry, state and federal agencies engaged in energy concerns in the Powder River Basin. Our goals were to help these entities better understand the potential impacts associated with discharged water and how to avoid or mitigate those impacts on the native aquatic wildlife in the Powder River basin. Unfortunately, we have been unable to find additional support or funding for positions similar to this in the Atlantic Rim and Moxa Arch gas field developments.

6
Despite the chronic drought, fishing license sales recorded a modest increase for the first time in five years. This is partly attributable to our fisheries managers’ on-going efforts to provide diverse, quality fisheries and angling opportunities. For instance, golden trout were once again stocked in our high mountain, wilderness lake areas; the first time in nine years. High Savery Reservoir showed promise as a cutthroat trout, tiger trout and kokanee fishery. In fact, over one million eggs were produced by early run kokanee from High Savery Reservoir. Population estimates and creel surveys on the Hoback River show Snake River cutthroat trout are responding favorably to the recent change as a wild trout fishery. Our aquatic wildlife diversity program funded primarily through State Wildlife Grants demonstrated remarkable progress. A partial list of the work concluded or initiated is provided in order to demonstrate the level of commitment the division has for meeting obligations written in the Comprehensive Wildlife Conservation Strategy, as follows:
• Completion of the native bluehead sucker, flannel mouth sucker, and roundtail chub surveys for the entire Green River basin. A genetic evaluation is pending before the completion report can be finalized;
• Completion of the Powder River herpefauna study which produced sampling protocols for amphibian calling surveys and turtle trapping;
• Completion of the survey of spawning populations and habitat for Yellowstone cutthroat trout in the upper Yellowstone/Thorofare rivers;
• Initiation of the first of a two-year comprehensive survey of Green River Region herpefauna;
• Initiation of a two-year survey of native fishes and habitats in the warm water streams of the Bighorn Basin;
• Initiation of Cooperative Wildlife Research Unit studies to better understand the conservation status and need for protection of flannelmouth suckers in the Big Sandy River and burbot in the Wind River;
• Initiation of level one assessment for leatherside chub in the Bear River drainage. • Completed chemical treatments on several sections of Muddy and Littlefield
creeks to remove non-native, nongame fishes in preparation for reintroduction of the full native fish assemblage back into the Muddy Creek drainage.
Our hatcheries and rearing stations raised and stocked 311,825 pounds of fish during the year. This is close to our five-year average and an increase of over 18,295 pounds from FY 06 mainly due to completion of capital facility projects at the Dubois Hatchery and Wigwam Rearing Station. Without the general fund appropriations our ability to renovate and modernize our facilities would be severely restricted. With the funds we have effectively increased trout quality and quantity. Work to provide captive brood stocks for Colorado River cutthroat trout was successful though taxing for our spawning crew and the personnel at Wigwam Rearing Station and Daniel Hatchery. This year’s drought and a very early snowmelt precluded taking golden trout eggs from our sources in the Wind River Mountains. Our quest for an egg source is due to the popularity of golden trout with our alpine anglers; however, finding a reliable egg source has proven difficult.

7
The effectiveness of our aquatic habitat team continues to be hampered due to the lack of federal partners available for anything other than resource plan writing or energy development work. Despite this, we continue to be productive; examples of projects initiated or completed in FY 07 include a cooperative fish passage monitoring study on low head diversion rehabilitation project on Clear Creek using tagging and electronic sensors; inventory and planning for replacement of grade control structures on the drains of Ocean Lake; fish entrainment evaluation for diversion ditches on the Spence/Moriarity Wildlife Management Area (WMA); removal of a fish migration blocking culvert on lower Clear Creek; warm water stream assessments were completed in the Laramie River and South Platte River basins; aspen, willow and mountain shrub trend monitoring sites were established to monitor prescribed burn and grazing effects; and the third phase of the Flat Creek/Salt River project was completed to restore native cutthroat trout habitat. Additionally, fish passage has gained widespread interest and funding support. In the next several years we expect our work with fish passage to increase dramatically as we improve the contracting of projects with private sector interests.

8

9
SERVICES DIVISION John Kennedy, Chief
The Services Division is committed to achieving the Department’s mission by increasing public awareness of all Wyoming’s wildlife issues, strengthening support for the Department, conserving and enhancing wildlife habitat, providing increased access for recreational opportunities, maintaining healthy wildlife populations, and providing technical support critical to the success of the Department. The division is administered by the Division Chief, Assistant Division Chief for Habitat/Technical Support, and Assistant Division Chief for Information & Education. The Assistant Division Chiefs are responsible for the administration of nine work units through two distinct sections. The division’s Habitat/Technical Support Section includes Lands Administration; Conservation Engineering; Game and Fish Laboratory; Habitat & Access Maintenance; and Information Technology/GIS. The Information & Education Section includes: Conservation Education; Regional Information & Education; Information/Publications; and the Customer Service (Telephone Information) Center. During FY 07, the Services Division Administration continued to focus on providing consistent leadership and improving communication within the division and between the division and other work units in the agency. Priorities for each work unit in the division were established. The division administrators and branch supervisors attended other division and regional coordination team meetings to improve communication, discuss priorities and expectations, and communicate management strategies specific to future administration of the division. Division Administration will continue to focus on improving internal communication and developing priorities that are responsive to the other work units and consistent with the Director’s goals/objectives and the agency’s mission.
FY 07 Services Division Administration priorities: • Continue to recruit and promote the best-qualified candidates for positions within the
division; administration will be directly involved in all hiring processes. • Work with the regions, Property Rights Team, and Commission on high-priority access
projects and conservation easements; improve the acquisition process. • Continue work with the Fiscal Division on the Electronic License Issuance Project. • Improve agency credibility and public support through information, education, and outreach. • Further define the Public Information Officer role and responsibilities. • Implement goals, objectives, and strategies of the Strategic Habitat Plan. • Continue work to establish a Department television program/documentary. • Improve processes and individual work unit performance in the division. • Coordinate major conservation education efforts and agency programs, including the Hunting
and Fishing Heritage Expo. • Participate on committees of the Association of Fish and Wildlife Agencies and Western
Association of Fish and Wildlife Agencies. During FY 07, Services Division Administration accomplished several major projects, including: • Coordination with the Director’s Office, other division administrators and the regions to
discuss and establish priorities for Services Division Administration and all work units in the division.

10
• Work with the regions, Property Rights Team, and Commission to clarify and implement the regulation and policy guidelines for acquiring fee title and less than fee title property rights. Coordinated and facilitated Property Rights Team meetings on a regular basis.
• Played a key role on the agency’s Strategic Habitat Plan, Water Rights, Access, IT Oversight, and Budget committees.
• Completed reorganization of the Conservation Education Branch to be more responsive to hunters and anglers.
• Completed Information and Education work planning/prioritization processes and established priorities; continued work to improve coordination and communication among all the I&E work units through the Information and Education Leadership Team.
• Continued to coordinate and implement strategic information/media plans for a variety of high-priority issues, including: the agency’s mission, funding constraints, chronic wasting disease, brucellosis, the Strategic Habitat Plan, wolves, grizzly bears, and energy development.
• Developed alternative funding proposals for capital construction projects. • Implemented new policy guidelines for management of Commission-owned lands and waters
in accordance with Chapter 23; established the Habitat & Access Maintenance Branch as the Department’s lead on Commission-owned and administered lands.
• Completed work with the U.S. Fish and Wildlife Service-Federal Assistance to resolve several complicated real property audit findings involving Commission-owned lands and waters.
• Reorganized the Regional I&E Program to include a program supervisor stationed in Laramie.
• Continued to represent the Commission on the Board of Outfitters and Professional Guides. During FY 07, the division’s Habitat/Technical Support Section accomplished several major projects, including: • Made several major process improvements and developed strategies to increase the
effectiveness and efficiency of the agency’s land acquisition program and property rights monitoring program.
• The Lands Administration Branch completed the sale of 209 acres at the Commission’s Medicine Lodge Wildlife Habitat Management Areas (WHMA); finalized agreements with the Bureau of Reclamation for management of the Ocean Lake and Sand Mesa WHMAs; completed an agreement with Wyoming Department of Transportation to provide public fishing access along the Big Horn River; and corrected easements along the Salt River to provide hunting and fishing access along the river in perpetuity.
• Continued direct involvement on state IT committees that are responsible for the oversight, policy development, and overall IT business processes for all state government.
• Continued to provide substantial IT support to the development of the agency’s electronic licensing point of sale system.
• Developed an on-line application system for the resident and nonresident big game license drawings. We received 68,599 applications resulting in over $17,000,000 from January 1 through June 30, 2007.
• The Habitat & Access Maintenance Branch completed six comfort station improvement projects on WHMAs and Public Access Areas (PAAs; funded by the legislature); completed

11
winter range habitat projects on 1,125 acres on the Kerns, Whiskey Basin, and Spence/Moriarity WHMAs; completed annual maintenance on 36 WHMAs, 97 PAAs and 22 feedgrounds, which included 883 miles of fencing, 148 comfort stations, 89,382 feet of car barrier, 300 cattle guards, 7,500 signs, 95 wetlands, 5,000 acres of irrigated land, 65 boat ramps, 29 bridges, 1,163 miles of roads, and 410 parking areas; and completed 23 project requests from other divisions, which included habitat work on 600 acres of sagebrush habitat near Lander, 200 acres near Pinedale, and work on the Bates Hole Restoration Project and at the hatchery in Dubois.
• The Game and Fish Lab hosted the American Fisheries Society’s fish health section meeting in Jackson; helped develop and perform a critical step in the process to use Aquaflor for treatment of bacterial coldwater disease in our hatcheries; improved the tooth staining process for big game aging; and implemented new procedures, trained new clients, and logged-in database standards in order to broaden our customer base.
• Completed engineering construction projects at the Speas Fish Rearing Station, which included major water treatment facilities and a pipeline from a recently completed water well.
• Coordinated the completion of boating access projects at Lake DeSmet-Barkey Draw; Buffalo Bill-Gibbs bridge; Ocean Lake-Dickenson Park; Seminoe Reservoir-Medicine Bow Arm; and Viva Naughton-Dempsey Point.
• Completed major boundary surveys on the Spence/Moriarity WMA and Medicine Lodge WHMA and on Department-managed lands near Saratoga Lake.
• The Conservation Engineering-Drafting Section completed 3,143 signing projects; continued to provide support to the PLPW Program; and created GIS maps for division administration and the Director’s Office for work with the Commission, wolf management issues, and energy development.
During FY 07, the division’s I&E Section accomplished several major projects, including: • Developed and implemented new processes for establishing I&E program priorities that are
consistent with the Director’s goals and objectives and the agency’s mission. The division’s I&E Leadership Team continued to work on improving communication and coordinating work plans among all the I&E work units.
• The Regional I&E personnel continued to facilitate the seven local sage grouse working groups as they finalized their draft conservation plans.
• Continued development and distribution of our new e-newsletter, with nearly 10,000 subscribers, making it a cost-effective I&E tool.
• Completed installation and training on a new video editing system, which will help improve production quality and distribution effectiveness.
• Played a lead role in planning, conducting and supporting the agency’s efforts on the Wyoming Hunting and Fishing Heritage Expo and coordinated Hunter Education, Project WILD, Outdoor Recreation Education Opportunities, and aquatic education programs throughout the state.
• Continued work with Orion Multimedia to produce a one-hour TV documentary on grizzly bear and wolf issues in Wyoming. This documentary will reach a national audience through multiple broadcasts on the Versus Network.
• Provided substantial Customer Service (Help Desk) support to the development of the agency’s electronic licensing system.

12
• The Customer Service Center handled approximately 85,000 telephone calls and provided information through approximately 10,050 mailings to primarily resident and nonresident hunters and anglers.

13
WILDLIFE DIVISION Jay Lawson, Chief
During FY 07, the Wildlife Division completed a number of major management plans and projects. The Mountain Lion Management Plan and Black Bear Management Plan were adopted by the Commission and are now being implemented. A new Grassland Conservation Plan was developed and is available on our web site. It is also being used as guidance for our Landowner Incentive Program (LIP). The division conducted a Large Carnivore/Human Conflict workshop for Western Association of Fish and Wildlife Agencies (WAFWA) state personnel. There was significant interest in the training and feedback from attendees was very positive. A new Mule Deer Initiative has been developed and implementation will begin in the coming year. Initial emphasis will be placed on the Wyoming Range mule deer herd. Grizzly bear delisting was a major accomplishment and the division played a major role in developing the state plan, which was accepted by the U.S. Fish and Wildlife Service. An outdoor survival class was conducted for Department personnel. Restitution funds from major wildlife cases were used to cover expenses. Habitat inventories were conducted on nine large landscapes. Satellite imagery and shrub/steppe change detection were used on some very large areas in the Casper, Sheridan, Pinedale/Jackson, Green River, and Lander Regions and completed in the Laramie region. A total of 122 terrestrial habitat projects were implemented and 37 additional habitat projects were planned this period. The division interacted with the BLM in the development of four Resource Management Plans and several major Environmental Impact Statements relative to oil and gas development and we continue to explore partnerships with industry to help offset habitat loss. The division was involved in several ongoing research projects including a moose study in the Snowy Range and in the Jackson area, a mule deer study on the Pinedale Anticline as well as the Atlantic Rim area relative to gas development, a pronghorn study on the Pinedale Anticline to look at impacts from gas development, an elk study to look at movements and habitat use near Fossil Butte, an elk study to evaluate calving relative to brucellosis, and a white-tailed deer study looking at the implications of Chronic Wasting Disease as well as several others. Landowner easement payments for the Hunter Management and Walk-in Programs have reached the total amount of AccessYes donations received by the Department. The Department is actively pursuing ways to increase AccessYes funds at this time.

14
Hunter participation continues to increase on Walk-in and Hunter Management Areas. The most notable addition being the Rattlesnake Grazing Association west of Casper with 21,300 private acres for waterfowl, sage-grouse, rabbit, antelope, deer, and elk. Surveys revealed 79.6 percent of hunters and anglers were either satisfied or very satisfied with the opportunity provided through the PLPW Access Program. The Wildlife Investigative Unit is actively involved in several ongoing undercover investigations and unit projects. One such project involves comparison of our license database with the states of Colorado and Utah, which has yielded hundreds of possible violators who are claiming residency in both states. The unit was able get back up to a full compliment of investigators. The Cody and Jackson Region investigator positions were both filled after nearly a year of vacancy. Notable accomplishments of the unit include cases such as the Rusty Crayfish case where large illegal importations of invasive species were discovered. This case is nearly complete and the suspected violators are ready to settle the case even before the federal indictment is handed down. This case will likely include large fines and restitution. A new law enforcement Case Management System was put into operation. This is designed to limit the input of invalid or incorrect data while collecting additional suspect information. The system is running well and feedback from the field has been very positive. The Interstate Wildlife Violator Compact System has been readied for a comparison with the hunting and fishing license database. The compact currently has over 17,000 entries of which Wyoming is honoring almost 10,000. Wyoming has contributed approximately 600 wildlife violator names to the compact. Two sets of simunition training equipment were purchased. This is state-of-the-art equipment designed to closely simulate force on force. Recent court cases have found law enforcement departments negligent in providing appropriate and adequate training when the training did not closely and adequately represent real life situations. Current Wyoming Game and Fish Commission Use of Force policy directs that officers presented with a use of force situation must take into consideration whether the suspect is a threat, if the suspect is actively resisting arrest, if the circumstances are tense, uncertain, rapidly evolving, the severity of the crime, if the suspect is attempting to evade seizure by flight, and if there is a lawful objective for taking action. This equipment when used in real life scenarios trains officers in decision making skills and marksmanship skills that are in line with both the recent court decisions and Department policy. The second year of the Brucellosis Test and Removal Project at the Muddy Creek feedground resulted in the capture of 174 elk. A total of 79 cow elk were tested resulting in 13 seropositive animals being shipped to the USDA-approved slaughter facility in Idaho. The 3,009 pounds of boxed elk meat was provided to the Rocky Mountain Food Bank for distribution to food banks throughout Wyoming.

15
Permanent law enforcement personnel worked 4,260 man-days and drove 480,607 miles on law enforcement activities. This effort resulted in the issuance of 1,650 citations, 1,499 warnings, and documentation of 260 incidences involving unknown suspects. In FY 07, division personnel expended 1,294 man-days and drove 146,424 miles on activities to prevent wildlife from causing damage to private property. They expended 495 man-days and drove 19,520 miles investigating, processing and handling damage claims and landowner coupon redemptions. A total of 131 damage claims in the amount of $322,153 were filed and the Department paid $267,525. In addition, personnel spent 1,659 man-days and drove 150,928 miles responding to nuisance wildlife issues that were not considered wildlife damage under W.S.§ 23-1-901. The Wildlife Division conducted a major revision of its aerial line transect survey technique, developing improved methods and software and incorporating better equipment. The system was tested and implemented on a limited basis during the spring of calendar year 2007. The Department’s Information and Technology section initiated a revision of the big game job completion report software and continues to work closely with the Wildlife Division on this project. The revision is expected to be completed and ready for use in early spring of 2008. The Nongame Section continued to implement the state’s Comprehensive Wildlife Conservation Strategy. It conducted surveys and inventories of a variety of Species of Greatest Conservation Need. The section conducted black-footed ferret surveys and release of captive-reared animals again in FY 07. This year, captive-reared animals were released at sites north and south of the main reintroduced population to begin two new populations. The new release sites are intended to provide some insurance against risks a single population might face in the short-term and to create other subpopulations that will hopefully expand and join with the original population in the future. Section members represented the Department on the Pacific and Central Flyway Nongame Technical Committees. Through these committees and separately, the Department participated in implementing post-delisting monitoring of the peregrine falcon and bald eagle and assisted in implementing the provisions for taking peregrine falcons. Biological Services conducted the full range of harvest surveys in FY 07. The Department’s IT Section assisted in completing internet capabilities for the harvest surveys conducted internally, including turkey and small and upland game. Other ‘in-house’ surveys (e.g., bighorn sheep, moose, furbearer) were prepared for internet capability next year. The database for compiling the bobcat CITES tagging information was revised in FY 07, and the tagging notebooks for field personnel, including the tagging report forms, were revised for distribution in FY 08. The section also significantly revised format of the CITES report to the U.S. Fish and Wildlife Services in FY 07. Staff biologists assisted the Director’s Office and the State’s Attorney General on document reviews and document preparation in its negotiations with the federal government on wolf delisting. The division participated in the formative stages of the Wyoming Landscape Conservation Initiative, including the WLCI Workshop and the Science Technology Advisory Committee review of the WLCI draft science plan.

16
The Wyoming sage-grouse habitat management guidelines were finalized for publication. Most sage-grouse local working groups completed their regional management plans. The sage-grouse coordinator was involved in a number of interagency and interdisciplinary workshops and meetings regarding research project findings, sage-grouse conservation and impacts of oil and gas development on the species. The Landowner Incentive Program (LIP) coordinator completed the first full year of developing and submitting project proposals for approval, funding, and implementation. Many LIP promotional materials were developed, including an information website where interested parties can view and download LIP materials (including applications and forms), and/or read about LIP focus species and habitats. Presentations were held regarding LIP and its use as a funding source for habitat improvement projects. The ten LIP projects proposed and selected in FY 07 brings the total number of projects in motion since the inception of the effort the previous year to16. Traditional waterfowl surveys were conducted. Mourning dove trapping was tested to prepare for participation in a multi-year Central Flyway mourning dove banding effort beginning in calendar year 2008. Results were poor, and the department will evaluate whether it can afford to devote its limited manpower to this very labor-intensive effort next year. The Migratory Game Bird Section continued to represent the Department on the Pacific and Central Flyway Study Committees and coordinate migratory game bird management and hunting season setting between the flyway councils and agency field personnel. Pronghorn fawn transplants from Wyoming to Mexico have been tremendously successful with several fawn captures from F.E. Warren Air Force Base and the surrounding area since 2000. This project was undertaken again in June of 2007 with a large volunteer effort. A total of 159 pronghorn fawns were captured and transported to Mexico in an effort to enhance their captive breeding program. A standard capture, handling and feeding protocol is being developed for use in future operations.

PROGRAM-LEVEL REPORTS


17
Program: Aquatic Wildlife Management Division: Fish Mission: Conserve and enhance all aquatic wildlife, reptiles, amphibians and their habitats for current and future generations. We will provide diverse, quality fisheries resources and angling opportunities. Program Facts: The Aquatic Wildlife Management program is made up of seven sub-programs, listed below with number of staff and 2007 (FY 07) budget: Sub-programs # FTEs* 2007 Annual Budget Fish Hatcheries and Rearing Stations 41.6 $3,972,889 Regional Aquatic Wildlife Mgmt. 33.5 2,575,520 Boating Access 0.0 928,000 Statewide Aquatic Wildlife Mgmt. 6.5 444,858 Fish Spawning 2.7 207,608 Fish Distribution 0.0 205,883 Fish Wyoming 0.0 0 TOTAL 84.3 $8,334,758 * Includes permanent, contract, and temporary positions authorized in FY 07 budget. Any positions added during the budget cycle require Wyoming Game and Fish Commission authorization or must be funded from supplemental grants. This program was previously two separate programs: Aquatic Wildlife Management and Fish Culture (Strategic Plan FY 04-FY 06). The Water Management sub-program is no longer part of the Aquatic Wildlife Management portion. It has since been relocated to the Habitat program. The program is located across the state in eight regional offices, Cheyenne headquarters, and ten remotely located fish hatcheries and rearing stations. Primary Functions of the Aquatic Wildlife Management Program: • Conserve and enhance all aquatic wildlife, amphibians and reptiles by
scientifically assessing populations at both local and watershed levels, control exotic species where necessary, and where ecologically and economically feasible reintroduce native species into suitable habitats in order to conserve these taxa for future generations.
• Provide diverse, quality fisheries resources and angling opportunities through a system of fish management that attempts to first manage wild fisheries where possible, but relies upon an evaluation-based fish stocking program. The program meets angler desires by stocking salmonids (trout, grayling and Kokanee) that come from egg sources within Wyoming and are reared using modern fish culture practices. Non-salmonid (walleye, bass, catfish, etc.) fisheries are maintained through trades of

18
excess eggs with federal and other state agencies. The efforts of the program will balance the productive capacity of habitats with public desires.
Performance Measure #1: Number of stream and lake surveys completed
0
100
200
300
400
500
600
700N
umbe
r of S
urve
ys
Com
plet
ed
FY 03 FY 04 FY 05 FY 06 FY 07
Story behind the performance: The quality of Wyoming’s fisheries is a direct reflection of the quality of Wyoming’s lakes, rivers and streams. Stream and lake surveys are conducted to determine the condition of fisheries. Until recently, surveys have been targeted towards evaluating the need to change management approaches, primarily for native and introduced sport fishes. The survey strategy now includes more intensive surveys that emphasize watershed-level fishery evaluations. In FY 07, a total of 661 streams and lakes were surveyed. This is substantially higher than the five-year average of 587 surveys per year. Since last year, one change that increased sampling intensity was the need to identify the extent and magnitude of several illegal fish introductions in the Green River and Bear River basins, specifically for burbot and walleye. Also, a portion of the increase is due to surveys conducted for native species of concern as identified in the Comprehensive Wildlife Conservation Strategies in the Big Horn and Green River basins. State Wildlife Grants and other third party funds funded many of these surveys. Native species that were surveyed included native trout, suckers, minnows, mollusks and herpefauna, using a watershed-scale or assemblage approach. Besides increasing in number, the surveys conducted were more intensive, resulting in an improved understanding of biological productive capacity of aquatic systems and sustainability of populations for recreation, scientific and educational purposes. The reorganized Aquatic Assessment Crew was fully staffed and operational and contributed significantly to the work completed this year. Besides the increase over the average performance, it should be noted that the types of surveys on streams have become more extensive or larger in scale, often encompassing watersheds instead of stream reaches, as conducted previously. The primary management plans guiding fisheries management survey work are called Basin Management Plans. In FY 07, the format and content templates for the basin plans were changed. Three regions submitted initial draft plans as a test to evaluate the new goals and objectives driven plans. It is anticipated that all 111 Basin Management Plans will be rewritten in the next three years. The new plans should provide better communication with the public and

19
other agencies. But surveys will continue to be used as a primary tool to evaluate the management goals for these plans. What has been accomplished: New Basin Management Plan formats were fully tested this year in preparation for basin plan modifications in FY 08. Several plans per region are expected to be completed next year. Thereafter the pace should accelerate to meet the 2009 deadline. We continue to integrate the Strategic Habitat Plan priorities into the Basin Management Plans. Energy demands served to refocus our attention towards basins where intensive energy developments are causing some concern for aquatic wildlife. These often would not be the basins we would consider the most important in terms of diversity and quantity of wildlife, but the presence of species of concern caused us to reprioritize our work accordingly. In order to meet data needs that were identified for aquatic species in the Comprehensive Wildlife Conservation Strategy (CWCS), the program is in the continual process of surveying streams and lakes. The purpose of this plan is to manage species of greatest conservation need in Wyoming and reduce the need to list species under the federal Endangered Species Act. Funding continues to be provided partially through the State Wildlife Grants program. Our efforts to secure legislative funding failed narrowly this year. Additional funding initiatives will again be proposed as part of the Wyoming Game and Fish Department’s alternative funding proposals. The program continues to work with the Wyoming Cooperative Research Unit (COOP Unit) to meet continuing research needs. In FY 07, the COOP Unit conducted six fisheries-related research projects. Because COOP Unit staffing has been reduced by 33 percent, we arranged to have some research conducted at Colorado State University. We continue to look forward to the COOP Unit returning to a full complement of research staff in the future. What we propose to improve performance in the next two years: • Continue to monitor the effectiveness and refine, as needed, the duties and activities
of the newly restructured Aquatic Assessment Crew (AAC). Performance showed an increasing trend for the past three years and was the highest since 2001. The anticipated increases in performance with stability and maturity of the AAC and regional fishery crews were realized. The realignment of the AAC proved effective in terms of increasing sampling productivity (numbers of streams and lake surveyed) but also afforded the opportunity to focus more attention on native fish, amphibians and reptiles. Anticipated result in the next several years is to maintain the number of stream and lake surveys conducted in FY 07 while still working to assess status of multiple species and taxa at watershed levels. Also, we expect to initiate an improved survey of crayfish that is modeled after the 1985-1987 crayfish survey in order to fulfill CWCS objectives relative to crustaceans. If the crew experiences turnover as in the past, reduced productivity in terms of number of surveys completed will again be seen.
20
• Assist Aquatic Habitat Section with prioritizing fish passage and habitat restoration needs for native fish. Data and data layers that spatially depict prioritization of work for species of greatest conservation need (SGCN, as identified in Wyoming’s CWCS) need to be developed. Stream survey work is especially needed in the Bighorn and Wind River basins to complete SGCN prioritization work.
• Streams and lakes are surveyed also to conduct evaluations of sport fish stocking programs and to update and improve brood stock management plans. Over the next two years assessments are needed for recent Colorado River cutthroat trout and Firehole rainbow trout stocking activities to aid in the brood stock evaluation for each species.
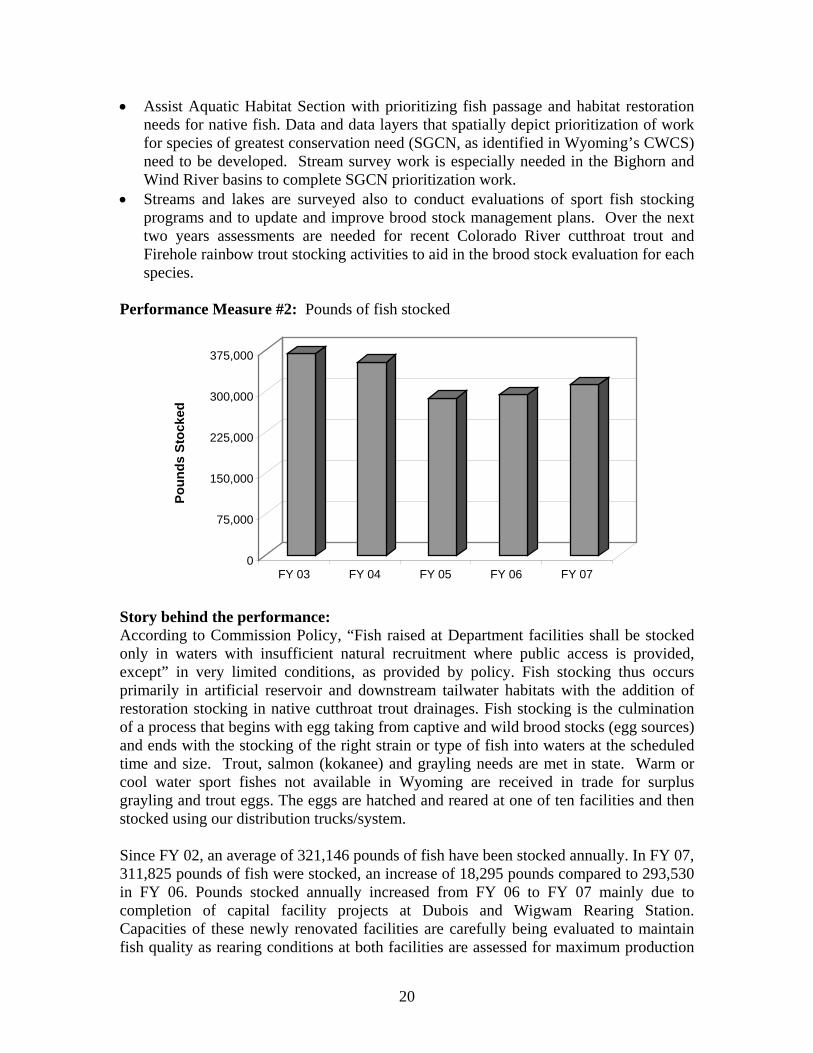
Performance Measure #2: Pounds of fish stocked
0
75,000
150,000
225,000
300,000
375,000
Poun
ds S
tock
ed
FY 03 FY 04 FY 05 FY 06 FY 07
Story behind the performance: According to Commission Policy, “Fish raised at Department facilities shall be stocked only in waters with insufficient natural recruitment where public access is provided, except” in very limited conditions, as provided by policy. Fish stocking thus occurs primarily in artificial reservoir and downstream tailwater habitats with the addition of restoration stocking in native cutthroat trout drainages. Fish stocking is the culmination of a process that begins with egg taking from captive and wild brood stocks (egg sources) and ends with the stocking of the right strain or type of fish into waters at the scheduled time and size. Trout, salmon (kokanee) and grayling needs are met in state. Warm or cool water sport fishes not available in Wyoming are received in trade for surplus grayling and trout eggs. The eggs are hatched and reared at one of ten facilities and then stocked using our distribution trucks/system. Since FY 02, an average of 321,146 pounds of fish have been stocked annually. In FY 07, 311,825 pounds of fish were stocked, an increase of 18,295 pounds compared to 293,530 in FY 06. Pounds stocked annually increased from FY 06 to FY 07 mainly due to completion of capital facility projects at Dubois and Wigwam Rearing Station. Capacities of these newly renovated facilities are carefully being evaluated to maintain fish quality as rearing conditions at both facilities are assessed for maximum production

21
levels. While pounds are easily tracked or measured, the quality of the fish stocked continues to be emphasized. This is done by not overstocking facilities and incorporating modern fish health practices that stress optimum not maximum production levels. The main emphasis of the stocking program is to release high quality fish for the greatest return in native species restoration and sport fishing opportunities. The Fish Culture sub-program continues to meet the program’s internal goal of producing +/- 10% of the requests made from regional aquatic wildlife managers. What we propose to improve performance in the next two years: • Through Legislative funding, renovate Speas Rearing Station to increase fish
production capability for large reservoirs and southeastern Wyoming stocking requests. By the end of FY 09, the total capacity of Speas will increase from 110,000 pounds to approximately 300,000 pounds under a protected environment with improved rearing conditions.
• Renovate Story Hatchery brood stock facilities through Legislative funding to reduce fish health issues and improve rearing conditions. Improved brood facilities at Story will remove stressful conditions and augment needed rainbow trout eggs for the Speas expansion.
• An extensive capital facility infrastructure is maintained and required to meet stocking responsibilities and maintain captive brood stock populations. Further evaluations are planned for the existing fish rearing and support facilities/equipment to set management priorities for FY 09 – FY 19 under new priorities to augment those outlined in FY 98 – FY 08. Planning will emphasize developing a progressive sub-program to meet needs thirty years into the future.
• Continue to seek funding to remodel facilities in order to eliminate or greatly reduce the threat from Whirling Disease and other fish health concerns to brood stocks, hatcheries and rearing stations.
• Continue to maintain and further develop captive brood stocks of native cutthroat species in protective refuges.
• Continue to incorporate and maintain high genetic integrity in brood stocks and broaden the scope and sources of our wild genetic sources of native and introduced trout species internally to maintain a disease free supply for sub-programs.
• Continue to seek and evaluate technological methods that allow a more efficient use of available water at fish culture facilities. In conjunction with technology, incorporate new techniques to reduce the impact of bacterial coldwater disease and other fish health issues inherent in fish culture operations throughout the western United States.
Program: Bird Farms Division: Wildlife Mission: Enhance pheasant hunting opportunity in Wyoming.

22
Program Facts: The Bird Farms Program is made up of one major sub-program, listed below with the number of staff and 2007 (FY 07) budget. Sub-program # FTEs* 2007 Annual Budget Bird Farms 5.4 $ 474,362 * Includes permanent, contract and temporary positions authorized in the FY 07 budget. Any positions added during the budget cycle require Wyoming Game and Fish Commission authorization or must be funded from supplemental grants. Bird farm facilities are located in Sheridan and Yoder. Primary Function of the Bird Farm Program: • Enhance pheasant hunting opportunity in Wyoming through the production and
release of high quality pheasants. Performance Measure #1: Number of pheasants released annually
25,00026,00027,00028,00029,00030,00031,00032,000
Num
ber o
f Ph
easa
nts
2002 2003 2004 2005 2006
Calendar Year
Story behind the performance: Due to continued loss of pheasant habitat in Wyoming and increased demand for pheasant hunting, pheasants being produced at the Department Bird Farms have become an important part of the hunters’ “bag” in recent years. Continuing drought, poor habitat conditions and stable or increasing demand for pheasant hunting will result in continued demand into the future. Pheasants have been produced for recreational hunting at the Sheridan facility since 1937 and the Yoder facility since 1963. Annual bird production and survival is related to weather conditions including losses from occasional hail, snowstorms and excessive heat that may slow the growth of young pheasants. Bird farm personnel coordinate release schedules with regional personnel to maximize the efficiency of bird distribution during the months of October, November and December of each year. The vast majority of Wyoming’s pheasant hunting occurs in Goshen County in the southeastern part of the state. Established pheasants throughout the state are supplemented by releases from the Department’s Downar and Sheridan Bird Farms.

23
Between 2002 and 2006, the number of pheasants released ranged from 27,249 to 31,367, with the average being 29,693 pheasants. The number released in calendar year 2006, was slightly higher than the average at 30,909. Birds were released on Department lands, private lands enrolled in the Private Lands Public Wildlife (PLPW) program, and private lands where landowners allow public hunting access. What has been accomplished: Personnel at Sheridan Bird Farm continued with pen upgrades, installed an automatic watering system for part of the facility and did a remodel project in the kitchen at the assistant’s house that addressed electrical and plumbing concerns. Personnel help the Region personnel with check stations, Chronic Wasting Disease monitoring and fish spawning projects. Downar Bird Farm personnel were involved with facility upgrades, ongoing habitat projects on local Wildlife Habitat Management Areas, local extension services and involvement with a local Coordinated Resource Management (CRM) weed management project. What we propose to improve performance in the next two years: • Personnel at the Bird Farms will continue to seek the most cost effective and
efficient methods of rearing pheasants. • Efforts are being made to improve the genetics of the pheasants being raised to
ensure a quality product will be available for hunting. • The existing facilities are at maximum production at this time. Personnel will
explore all avenues to continue this production level. Program: Conservation Education Division: Services Mission: Provide learning and participation opportunities relating to wildlife management, both aquatic and terrestrial, wildlife conservation, wildlife related skills and lawful and ethical behavior. Program Facts: The Conservation Education program is made up of two major sub-programs, listed below with number of staff and 2007 (FY 07) budget: Sub-programs #FTEs* 2007 Annual Budget Hunter Education 1.0 $ 159,527 Conservation Education 5.0 417,392 TOTAL 6.0 $ 576,919 * Includes permanent and contract positions authorized in FY 07 budget. Any positions added during the budget cycle require Wyoming Game and Fish Commission

24
authorization or must be funded from supplemental grants. These programs do require statewide responsibilities, travel and assistance from Regional personnel. The Conservation Education program is located in the Department Headquarters Office in Cheyenne. Primary Functions of the Conservation Education Program: • Provide learning and participation opportunities to youth and adults in outdoor
skills, and as required by State Statute, we continue to offer hunter education so that hunters engage in ethical, lawful and safe actions.
• Create awareness in youth and adults of the importance for the planned management practices of wildlife and their habitats within their specific ecosystems.
Performance Measure #1: Number of educational opportunities offered and number of people reached annually through Conservation Education efforts.
0
50
100
150
200
250
300
Tota
l Pro
gram
O
ppor
tuni
ties
FY 05 FY 06 FY 07
Conservation Education Opportunities
Story behind the performance: Educational opportunities are offered on an annual basis in the form of Project WILD Workshops, Wild about OREO Educator Workshops, Fishing Clinics held statewide, Youth Conservation Camp, Becoming An Outdoors Woman Workshops, Hunter Education classes, writing and distribution of Wyoming Wildlife Wild Times publication to schools, Shotgun clinics, the Hunting & Fishing Heritage Expo, and various Conservation Education programs offered in schools and other venues. These programs are aimed at a variety of audiences, including youth, adults, new and experienced sportsmen, women, and others. The number of educational opportunities is limited to the number of personnel, conflicting schedules, workloads, new and on-going wildlife related issues, number of volunteers and budget restrictions. In FY 07, there were 240 program opportunities available. From the number of programs offered, the number of participants reached in FY 07 was 25,391 that are about equal to the three-year average of 25,894 participants a year. Continued increase in program participation indicates that the quality of the programs is remaining high. Program opportunities vary a great deal, some opportunities, such as the EXPO, reach large numbers of people for a limited amount of time and with a limited amount of information. Other programs, like Youth Camp and Becoming An Outdoors Woman,

25
reach smaller audiences for a longer period with more comprehensive information and presentations. Further, our educational efforts must be flexible and dynamic to meet the ever-changing needs of our constituents. What we propose to improve performance in the next two years: • Continue to evaluate programs to meet the participation needs of the public,
recognizing the numbers alone are not an indication of an effective educational program.
• Continue to modify programs to incorporate the Department’s priorities. • Continue to evaluate the Hunter Education instructor and student program to provide
effective instruction. • Continue to collaborate with conservation organizations, Department of Education,
local, state, and federal agencies and natural resource agencies, community organizations, businesses and individuals to build effective educational programs.
Performance Measure #2: Percentage of participants rating conservation programs as “meets expectations”
88
90
92
94
96
98
100
% M
eetin
g Ex
pect
atio
ns
FY 05 FY 06 FY 07
Story behind the performance: Conservation education programs are evaluated using a basic feedback form filled out by participants. Programs for which this feedback is collected include Project Wild workshops, Wild about OREO programs, Becoming An Outdoors Woman workshops, Youth Camp, EXPO, Archery in the Schools workshops, and Wyoming Wildlife Wild Times publications. For the past few years the evaluation forms for the various programs have not had consistent measurements, the forms simply allow participants to rate the overall program as “meets expectations” or “does not meet expectations” and an opportunity to provide input towards future programming. From fiscal year 2005 to 2007, the average of participants that believed the programs met expectations was 99.0 percent. By incorporating input of participants, program formats were adjusted and improvements in satisfaction were realized in FY 06 when the “meet expectations” rating rose to 100 percent and remained high at 99 percent in FY 07.

26
What we propose to improve performance in the next two years: • Evaluate and update participant feedback forms to provide more uniform and
qualitative information/measurement that also allows for improved participant response.
• Continue to modify existing programs based on participant feedback • Create new programs to address participant areas of interest. Program: Conservation Engineering Division: Services Mission: Provide engineering technical support to aid in conserving wildlife and providing access with the public. Program Facts: The Conservation Engineering program is made up of one major sub-program, listed below with number of staff and 2007 budget:
Sub-program # FTEs* 2007 Annual Budget
Conservation Engineering 7.0 $ 535,905 * Includes permanent positions authorized in FY 07 budget. Any positions added during the budget cycle require Wyoming Game and Fish Commission authorization or must be funded from supplemental grants. This program consists of Engineering, Surveying, and Drafting and is located in the Department Headquarters Office in Cheyenne. Primary Functions of the Conservation Engineering Program: • Engineering technical support is provided through engineering, surveying, and
drafting to maintain the Department’s physical structure of offices, housing, hatcheries, research facilities and Wildlife Habitat Management Areas, boating access facilities, and Public Access Areas often using private sector consultants.
• Engineering technical support is provided by acting as caretaker of the Department’s water rights statewide and routinely make water rights filings for new permits, alterations, or research problems that arise.
• Engineering technical support is provided by the Drafting section for the Department’s statewide signage with design, purchase, and coordination with field personnel and WYDOT in the installation of said signs.
• Engineering technical support is provided through the Drafting section in most of the Department’s mapping, including herd unit maps, floating access, public access, and maintaining the Department’s land status maps.
• Engineering technical support is provided through the Survey section for boundary surveys of all Commission-owned properties.

27
• Engineering technical support for all major new construction projects is provided through the Civil Engineer for design, bid, and construction management using in-house professionals and private sector consulting firms.
• Engineering technical support through the Drafting section provides many types of displays for all Divisions and some outside agencies for use at various functions such as Commission meetings, Expo, Private Lands Public Wildlife, court displays, and public meetings.
Performance Measure #1: Percent of employees satisfied with the level of courteousness and professionalism
Story behind the performance: Annually, the Internal Client Satisfaction survey is distributed to permanent personnel. The survey provides the opportunity for employees to measure the overall performance of 14 Department programs. In many respects, the ability of the Department to provide services to the external clients depends on the ability of employees to satisfy the needs of their internal clients. Conservation Engineering has struggled with appropriate manpower since the 1995 reduction in force. The workload has increased with major hatchery projects, Private Lands Public Wildlife, and the EXPO added to routine projects. Recruitment of a surveyor and draftsman after their retirement has been difficult. Conservation Engineering is a service to wildlife management employees and wildlife recreationists. Being a small core of specialists, performance is greatly affected by personnel and the workload, as can be seen in the satisfaction chart. Getting a new surveyor on board and a firm customer-friendly leadership base is believed to have improved employee satisfaction. In FY 06, 85.6 percent of Department employees were satisfied with the level of courteousness and professionalism, which is the second year in which the five-year average of 83.1 percent was surpassed. What we propose to improve performance in the next two years: • Engineering has hired an assistant Chief Engineer during the second half of FY 07
which has spread the work load and made it easier in dealing with clients on a daily basis and provide more continuity in communication. With the replacement of the
0
20
40
60
80
100
% E
mpl
oyee
s Sa
tisfie
d
FY03 FY04 FY05 FY06 FY07

28
Chief Engineer and the filling of the now vacant assistant Chief Engineer position expected in early winter of 2008, the level of courteousness and professionalism is expected to climb back over the 80 percent satisfaction rate. With a single engineer available for most of FY 07 to handle a full workload of projects for the entire Department, this performance measure rating has shown a slight reduction. Personnel changes, an additional engineer, and draftsmen added should aid in a rebound in FY 08.
Performance Measure #2: Percent of employees satisfied with the level of attention and timeliness provided
0
20
40
60
80
100
% E
mpl
oyee
s Sa
tisfie
d
FY03 FY04 FY05 FY06 FY07
Story behind the performance: Annually, the Internal Client Satisfaction survey is distributed to permanent personnel. The survey provides the opportunity for employees to measure the overall performance of 14 Department programs. In many respects, the ability of the Department to provide services to the external clients depends on the ability of employees to satisfy the needs of their internal clients. Conservation Engineering lost a surveyor and draftsman due to retirement and struggled to fill the position. Administrative changes also left the Services Division without good leadership. Again, fulfilling the surveyor position and good division leadership has improved our relationship with other employees. Engineering went from a low of 73.6 percent in FY 03 to 97.7 percent in FY 07, indicating Department employees who interact with Conservation Engineering staff appreciated efforts towards attention and timeliness. What we propose to improve performance in the next two years: • With a full compliment of employees on board and responsive leadership in the
Services Division, the Engineering Branch has made strides toward being attentive and timely to their clients in 2007 and will continue to improve over the next two years by having all positions filled in the Conservation Engineering Branch.

29
Performance Measure #3: Percent of employees satisfied with services provided
0
20
40
60
80
100
% E
mpl
oyee
s Sa
tisfie
d
FY03 FY04 FY05 FY06 FY07
Story behind the performance: Annually, the Internal Client Satisfaction survey is distributed to permanent personnel. The survey provides the opportunity for employees to measure the overall performance of 14 Department programs. In many respects, the ability of the Department to provide services to the external clients depends on the ability of employees to satisfy the needs of their internal clients. From the graph, the percent of employees satisfied with the Conservation Engineering services fell with the loss of two employees who retired. Hiring a surveyor and a stable division leadership with customer service in mind brought Engineering services back to 77.3 percent in FY 06. In FY 07 there was a drop in satisfaction to 67.3 percent. This can be attributed to outside influences associated with the energy boom making projects difficult to construct due to inflated costs, lack of interested contractors, resulting in no bids received and project completion delays. What we propose to improve performance in the next two years: • Response with good Services Division leadership, a good surveyor on board has lifted
the quality of our services in 2005. In the next two years the addition of the draftsman position being filled in FY 08 and an Assistant Chief Engineer will provide quality service to our clients pushing their satisfaction above the five-year average of 76 percent.
• Continue to send professional representatives to national organizations to stay up-to-date on conservation engineering trends (States Organization for Boating Access and the Association of Conservation Engineers).

30
Program: Customer Services Division: Services Mission: To effectively respond to customer requests and provide guidance to hunters, anglers, and non-consumptive users. Program Facts: The Customer Services program is made up of four sub-programs, listed below with number of staff and 2007 (FY 07) budget: Sub-programs # FTEs* 2007 Annual Budget Supervisor 1.0
Telephone Information Center 5.5 $ 247,798 Telecommunications Services 0.5 Alternative Enterprises 1.5 50,000 TOTAL 9.0 $ 297,798
* Includes permanent and contract positions authorized in FY 07 budget. Any positions added during the budget cycle require Wyoming Game and Fish Commission authorization or must be funded from supplemental grants. The Telephone Information Center sub-program was previously in the Information program (Strategic Plan FY 04-FY 07, November, 2003). To improve efficiency and services, the current assemblage of sub-programs was created and grouped under the new program, Customer Services. This Customer Services program is located in the Department Headquarters Office in Cheyenne. Primary Functions of the Customer Service Program: • Serve external customers by providing regulation and other agency information via
telephone and mailings. • Serve internal customers by providing telecommunications, mailroom and staffing
assistance. • Serve people and wildlife by offering products and publications that generate
revenue that contribute to the support of Department programs.

31
Performance Measure #1: Volume of customer contacts
010,00020,00030,00040,00050,00060,00070,00080,00090,000
100,000
Num
ber o
f Con
tact
s
FY 04 FY 05 FY 06 FY 07
Mailings Phone Calls
Story behind the performance: The Department's license issuance process, associated statutes, regulations and other responsibilities are complex. A main point of contact serves as an important resource for the customer. These contacts are typically done by telephone although many contacts are also made in person and via mail. Volume is tracked through Avaya's weekly report of incoming calls volume. The mail requests are tracked using a database. The volume of customer contacts is not likely to change as our current staff is overburdened with calls during peak times, such as license application deadlines and when license drawing results are made available. Should there be a decrease in staffing levels we will expect the incoming call volume to decrease due to inaccessibility. In FY 07, we saw a decrease in mailings. More and more customers are directed to the Department’s website to retrieve applications and other information. We saw an increase in calls for FY 07. This is likely due to the new preference point application period and the online application system. Calls were also generated by various correspondences from the Department. Most calls are currently related to: 1. Application procedure 2. Hunt area demand, land status and harvest information 3. Request for regulations, applications 4. Drawing results 5. Fishing information 6. Watercraft related questions 7. Alternative Enterprise orders 8. Hunter Safety information 9. General regulations

32
Since FY 04, the average annual number of mailings has been 12,664. The average annual number of phone calls has been 78,826. In FY 07, the Customer Service staff managed 10,053 mailings and 85,263 phone calls. What we propose to improve performance in the next two years: • Continue to serve our customers via telephone and mailings while seeking additional
ways to meet the changing needs of our customers. As technology advances, we expect that changes will also evolve in the manner in which our customers receive their information.
• Advocate for the customer by continuing to proactively communicate with the Information Technology (IT) section to optimize customer benefit. Awareness of website changes will allow efficiency in assisting customers navigate the website and provide feedback to IT to facilitate productive changes.
Performance Measure #2: Number of Departmental telecommunication requests handled
0
100
200
300
400
500
Num
ber o
f Req
uest
s
FY 05 FY 06 FY 07
Story behind the performance: In 2002, the Telecommunication Liaison duties were a full time permanent position. Upon that employee's retirement, the Department assigned the liaison duties to an existing position within the Customer Service Center. Currently, one customer service employee staffs this sub-program as part-time duties. The employee's main duties are serving as the customer service center lead worker. As the Telecommunication Liaison, this employee serves as the point of contact for Department employees, Information Technology Division, and private vendors for all telecommunication related issues. This sub-program has been relied on more than in the past due to the rapid pace of the cellular environment. This is expected to continue as the cellular industry moves away from support of analog cellular service in 2008. The main PBX switch is on-site at the Department of Transportation (WYDOT) in Cheyenne where WYDOT telecommunication staff is devoted to programming and other service needs of the switch. The Department utilizes their staff as part of a Memorandum of Understanding (MOU) with DOT. In the past year, the DOT has increasingly referred the liason to an outside vendor through their Information Technology Division (ITD) for telecommunication needs, which has the tendency to slow the completion of a telecommunication request.

33
In FY 07, the number of telecommunication requests (TC1) from Department employees was 397. The number TC1 submitted to the Department of Administration and Information, ITD via state TPX network was 177. What we propose to improve performance in the next two years: • On-going training of the Telecommunication Liaison on Avaya Site Administration
software to increase the ability of the Department to be more self-sufficient by having a person onsite with the access and the knowledge to make minor changes in the PBX switch. These minor changes include activating and deactivating existing lines, programming some extension moves, changing telephone displays, cover paths and pick up groups. Assuming no turnover in this position, this is likely to be accomplished by July 2008.
Performance Measure #3: Number of products sold to customers
01,0002,0003,0004,0005,0006,0007,0008,0009,000
10,000
Num
ber P
rodu
cts
Sold
FY 03 FY 04 FY 05 FY 06 FY 07
Story behind the performance: The products offered by Alternative Enterprise (AE) feature the logo "Wyoming's Wildlife Worth the Watching" and the Departments new "Official Gear" line introduced in FY 06. The distribution of products help promote the Department's brand as well as build awareness and approval of the Department's mission and work while providing an opportunity for all persons to financially contribute to the Department's conservation efforts. The products sold relate to wildlife, the Department and its programs, so the number of products sold is an indication of how successful this program is at promoting the Department to the public. The products are sold above cost so an increase in number of products sold will also reflect in the profit generated. The target market includes residents, nonresidents, consumptive and non-consumptive users. The profit generated by product sales is used exclusively for habitat restoration and conservation, hunting and fishing access and other wildlife programs. Since FY 03, the average number of products sold annually was 8,305. In FY 07, the number of products sold in was 8,289. This number is actually higher than expected

34
since the annual catalog was not produced due to a decision to work on a higher quality 2008 product catalog. A major focus is on the product photographs that will be used in various marketing and require coordination between the Department’s graphic designer, the product sales staff and a professional product photographer. Advertisement in the Department’s monthly magazine continues to generate sales. The product sales section is continuing work on the “Official Gear” logo. The Department’s product selection process will broaden once we have a trademarked logo to seek alternative vendors. In FY 07, a new online store generated over $40,000 in gross sales. In an effort to liquidate existing inventory, a tent sale of discounted items was held at Cheyenne Headquarters. The sales generated over $3,000 in revenue over the course of three days. During the year nine new products were introduced. What we propose to improve performance in the next two years: • Identify new products to increase sales and promote the Department brand. • Products are currently available at the Headquarters in Cheyenne and the Lander
Regional office. We intend to have the products available at regional offices and initiate the opportunity for License Selling agents to sell our products in their stores.
• Identify stipulations for affiliate programs and explore tracking methods by July 2008.
• Accommodate for additional staffing and secure permanent status for current staff when sales increase by 50 percent.
Performance Measure #4: Percent of general public that are satisfied with how their information needs have been handled
0
20
40
60
80
100
% P
ublic
Sat
isfie
d
FY 03 FY 04 FY 05 FY 06 FY 07

35
Story behind the performance: The Customer Service Center (CSC) staff is often the only contact the customer has with the Department until they meet a warden or biologist in the field. Their opinion of the Department and the Department’s credibility are formed as a result of the contact. The information given to hunters and anglers by the customer service representative needs to be accurate, current and communicated in a professional manner. Annually, the External Client Satisfaction survey is distributed to randomly selected members of the public that had purchased hunting and fishing licenses the previous year. The survey provides the opportunity for the public to measure the performance of select Department programs. Since FY 02, an average of 88.6 percent of the public that had interacted with the CSC staff were satisfied with how their information needs had been handled. These needs often included questions related to drawing odds, application requests and assistance in filling out the application. Annually, percent of the public that were satisfied ranged from 88.0 percent (FY 05) to 91.7 percent (FY 02). When the number of residents that utilize the CSC services is compared to nonresidents, we find that between FY 02-FY 04, more nonresidents utilized our services (annual average of sample: 68 residents vs. 160 nonresidents). Beginning in FY 05, the number of residents that utilized the services surpassed the number of nonresidents. This recent increase in use by residents is likely due to questions associated with the implementation of a new Preference Point System. In regards to satisfaction levels, the percent of people satisfied was slightly higher among nonresidents in each year, and 2007 was no exception (2007 results: 84.8 percent residents satisfied vs. 96.9 percent nonresidents satisfied). While nonresidents typically require assistance filling out their applications, resident callers respond to media reports or issues that surpass the general information provided by CSC staff. With representatives required to learn a great deal about the new Electronic Licensing System in addition to turnover, it is likely that FY 08 results will be similar. Appendix A. New proposed performance Measure As mentioned in 2006, a new performance measure was proposed to track man hours and will be available for FY 08. By completing various mailing projects throughout the year, the CSC provides needed support to various sections within the Department. The assistance has long been provided but previously not tracked. We propose introducing a new performance measure to track this effort by the number of man-hours serving internal customers. By recording man-hours worked on other projects a clear picture will develop on whether there is room to solicit more projects or simply determine whether the staffing levels affect the Department in ways other than "dropped calls".

36
Program: Department Administration Division: Office of the Director Mission: Provide leadership for wildlife conservation in Wyoming. Program Facts: The Department Administration program is made up of three major sub-programs, listed below with number of staff and 2007 (FY 07) budget:
Sub-programs #FTEs* 2007 Annual Budget Office of the Director 5.0 $ 680,575 Commission 0.8 96,388 Division Administration 22.0 2,426,168 Policy and Development 3.0 338,950 TOTAL 30.8 $ 3,542,081
*Includes permanent, contract and temporary positions authorized in the FY 07 budget. Any positions added during the budget cycle require Wyoming Game and Fish Commission authorization or must be funded from supplemental grants. This program is located in the Department Headquarters Office in Cheyenne. Primary Functions of the Department Administration program: • Provide leadership for wildlife conservation in Wyoming by establishing strategic
direction, empowering people, aligning Department programs and systems, and modeling high personal and professional integrity.
• Serve people by advocating for wildlife, coordinating with entities and representing the people of Wyoming as stewards of their wildlife resources.
• Provide policy-level support for wildlife by implementing the policies and decisions of the Wyoming Game and Fish Commission regarding wildlife and wildlife habitat management, including scientific data collection, law enforcement, wildlife/human conflict management, research, habitat conservation and wildlife health services.
Performance Measure #1: Internal satisfaction with performance (courteous and professional treatment).
80
82
84
86
88
90
FY 03 FY 04 FY 05 FY 06 FY 07
% E
mpl
oyee
s S
atis
fied

37
Story behind the performance: These data are taken from the Strategic Internal Client Survey conducted annually. In any given year, approximately 60-65 percent of WGFD employees indicate that they have some interaction with at least one sub-program within this program. Most (approximately 80 percent) indicate they interact with the Director’s Office. Only about 35-40 percent indicated that they interacted with Policy and Development. Internal constituent satisfaction with the courteous and professional treatment they received from the Department Administration program is high. The graph above summarizes mean scores of the Directors Office, Division administration (all divisions) and Policy and Development sub-programs. What we propose to improve performance in the next two years: • Continue monitoring internal constituent satisfaction of the courteous and
professional treatment they receive from sub-programs within the Department Administration program. This valuable measure of constituent satisfaction is important as an indicator of professional leadership. Consideration should be given to administering this survey using Internet survey technology.
Performance Measure #2: Internal satisfaction with performance (attention and timeliness)
80
82
84
86
88
90
FY 03 FY 04 FY 05 FY 06 FY 07
Story behind the performance: Internal constituent satisfaction with the attention and timeliness they received from the Department Administration program is high. The graph above summarizes mean scores of the Directors Office, Division administration (all divisions) and Policy and Development sub-programs. These data are taken from the Strategic Internal Client Survey conducted annually. In any given year, approximately 60-65 percent of WGFD employees indicate that they have some interaction with at least one sub-program within this program. Most (approximately 80 percent) indicate they interact with the Director’s Office. Only about 35-40 percent indicated that they interacted with Policy and Development.
% E
mpl
oyee
s S
atis
fied

38
What we propose to improve performance in the next two years: • Continue monitoring internal constituent satisfaction of the attention and timeliness
they receive from sub-programs within the Department Administration program. This valuable measure of constituent satisfaction is important as an indicator of professional leadership.
Performance Measure #3: Internal satisfaction with performance (overall direction)
60
65
70
75
80
85
2003 2004 2005 2006 2007
Story behind the performance: Approval of the Department’s overall direction, as expressed by WGFD employees, is between 70 and 80 percent. With stable leadership and clear direction, despite the turbulent nature of wildlife conservation in Wyoming, confidence in the overall direction of the agency is solid. Current approval of overall Department direction is high, but future leaders will determine the Department’s future direction. Most of the current leadership of the agency are or soon will be eligible for retirement. The problem is not simply that of developing leaders. More precisely, the agency must develop many leaders at the same time because of the number of existing leaders who will be eligible to retire at the same time. Further, the Department should develop workforce/succession plans. What we propose to improve performance in the next two years: • Continue to focus on maintaining the integrity and respect essential to the leadership
of the agency, including providing a clear sense of overall direction, empowering people to carry out their responsibilities as defined and implementing appropriate systems of compensation and performance review.
• Implement a leadership development program to identify, prepare and provide incentives for the next generation of leaders in the WGFD.
• Develop succession plans, especially for leadership positions within the Department.
% E
mpl
oyee
s S
atis
fied

39
Performance Measure #4: Number of days in the field by hunters and anglers
0
1,000
2,000
3,000
4,000
5,000N
umbe
r of D
ays
FY 02 FY 03 FY 04 FY 05 FY 06
Hunter Days (x 1,000)Angler Days (x 1,000)
Story behind the performance: Declines in the number of available deer and antelope licenses, especially nonresident licenses, in years prior to FY 04 have reduced the number of hunter days from long-term averages. Reductions in available licenses are largely attributable to factors outside the control of the Program, especially reduced fawn production related to the ongoing drought and habitat conditions. Angler days have also declined, as water conditions in Wyoming’s lakes and rivers are affected by drought. This trend may be stabilizing. However, long-term projections do not indicate any meaningful increases. Angler days and hunter days will likely remain stable in 2007, given habitat conditions. Long-term declines in available access for hunting and fishing are being slowed through the Department’s Private Lands Public Wildlife (PLPW) program, but overall declines continue. What we propose to improve performance in the next two years: • Continue the PLPW program. Acres enrolled in Walk-In Areas increased in calendar
year 2006 by approximately 14 percent to 578,691 acres, and privately owned acres enrolled in Hunter Management Areas increased 20 percent to 810,926 acres. The program now has 273 lake acres and 101 stream miles enrolled. This program represents an important effort in serving hunters and anglers in Wyoming.
• Continue to provide access and related facilities for hunters, anglers and other wildlife users on wildlife habitat management areas and public access areas.
• Continue to manage wildlife populations as needed through elk feedgrounds, fish hatcheries and bird farms. Implement procedures as recommended by the Brucellosis Task Force on selected feedgrounds to test disease reduction potential. Continue to update capital facilities at hatcheries to reduce potential for disease transmission.

40
Program: External Research Division: Office of the Director Mission: Conduct timely, applied research on fish and wildlife management issues. Program Facts: The scientific investigations are conducted typically by researchers associated with the Wyoming Cooperative Fish and Wildlife Research Unit, universities and independent researchers. The external research program funds no Department personnel by agreement, $40,000/year is used to help fund administration of the Wyoming Cooperative Fish and Wildlife Research Unit; listed below is the 2007 budget:
Sub-program # FTEs 2007 Annual Budget External Research/ Coop 0 $ 386,910
The External Research program was formerly referred to as the Coop Unit Research Program (Strategic Plan FY 04-FY 07, November 2003). Primary Functions of the External Research Program: • Conduct research to provide answers to wildlife management questions or issues
that require rigorous, scientific study by developing research proposals and budgets in cooperation with the Department, hiring and overseeing researchers and/or graduate students to conduct research that is designed to have immediate application by fish and wildlife managers.
Performance Measure #1: Department employee satisfaction with the quality of the research conducted by or overseen by the Wyoming Cooperative Fish and Wildlife Research Unit
0
20
40
60
80
100
% E
mpl
oyee
s Sa
tisfie
d
FY 03 FY 04 FY 05 FY 06 FY 07
Story behind the performance: The Department is responsible for developing proposals for applied research projects to improve future management of Wyoming’s wildlife resources. However, with increased costs associated with conducting research, Department personnel develop the applied research projects in cooperation with the Wyoming Cooperative Fish and Wildlife Research Unit (Coop Unit) and other researchers. These proposals are ranked and

41
prioritized by Fish and Wildlife Divisions for funding. With the exception of some wildlife veterinary research, all Department research is outsourced to the Coop Unit, universities and other contracted researchers. Therefore, we rigorously seek qualified researchers to assist us with our research questions. Typically, the majority of the research funding has gone to funding researchers hired or directed by the Coop Unit. Annually, the Department evaluates the research product in terms of quality, especially whether the research product is applicable to current wildlife management questions and in fact addressed the wildlife management questions posed in our proposals. This evaluation is conducted via the Internal Client Satisfaction survey, which is distributed to permanent personnel. Starting with the FY 03 survey, two separate questions were created to recognize the distinction between quality and quantity. Since FY 03, an average of 83 percent of Department employees who had interacted with the members of the Coop Unit were satisfied with the quality of research conducted or completed. The percentage was highest in FY 05 (90 percent) and lowest in FY 04 (76 percent). In FY 07, 86 percent of Department employees were satisfied with the quality of research conducted or completed. In the past several years, the Coop Unit lost the services of two experienced and renowned researchers, one of which specialized primarily in big and trophy game, and the other in nongame. The Coop Unit replaced one of these positions, which will focus on big game, in early 2007. The Coop Unit and the Department are working on filling a contract Academic Research Professional position to address nongame bird and mammal research. The Department is also doing less applied research because funds available for research have declined $24,090 since FY 03. Based on these various factors, average employee satisfaction with quantity of research conducted was 78 percent for FY 03-FY 07. In FY 07, 76 percent of Department employees were satisfied with the quantity of research conducted or completed in FY 07. What has been accomplished: The Snowy Range Moose project was funded for the final year. The project focused on developing and validating a prediction model for identifying potential winter moose habitat; describing winter food habits; evaluate preferred forage production and utilization of winter habitat and estimate potential habitat carrying capacity. The final year of the Jackson Moose Study was funded. This project documented movement patterns of Jackson moose adjacent to U.S. highway 287/26 using global positioning system (GPS) collars to identify roadway characteristics that facilitate or impede wildlife movements prior to and during construction. Funding was provided for the Buffalo Valley Elk project, which would identify spatial distribution of abortion and births and selection of parturition habitat by winter free-ranging elk for comparison to feedground-dependent elk. The Salt River Spawning project was funded for the third and final year. The project will assess spawning by wild Snake River cutthroat trout in the Salt River. The Green River

42
Catostomidae project was funded for the second year of a three-year project. The project will obtain information on movements and habitat associations of blue head, flannel mouth, and white suckers needed to develop conservation strategies for the native sucker species tributary systems. Two new projects were approved which include the Wind River Burbot and the Colorado River Cutthroat (CRC) in the North Fork of the Little Snake River (NFLSR) drainage. The Burbot project will identify the current status of burbot populations in the lakes and reservoirs in the Wind River watershed and factors that may affect abundance and structure of the burbot populations. The Colorado River Cutthroat project will estimate the abundance of CRC in isolated, headwater stream segments and relate this estimate to existing guidelines for ensuring long-term viability and genetic diversity in fish populations; relate density and length frequency patterns of CRC to the spatial distribution of habitat conditions; compare densities above and below water collection structures to determine how population isolation has affected CRC and identify management options for the eight streams isolated by water diversion structures in the NFLSR. What we propose to improve performance in the next two years: • Seek to recover funding needed for applied research in the fields of native species of
concern, wildlife diseases, big game, game bird and sport fisheries. • Fill the third research position in the next few months while continuing to broaden the
number of researchers and expertise available to us by seeking to increase the number of research projects that are conducted by the faculty from University of Wyoming and other institutions. Focus of this additional research capacity will be through State Wildlife Grant funding and any legislative Comprehensive Wildlife Conservation Strategy implementation funding.
Program: Feedgrounds Division: Wildlife Mission: Maintain Commission population objectives and control elk distribution in an effort to minimize conflicts with human land uses. Program Facts: The Feedgrounds program operates 22 feedgrounds and is made up of one sub-program, listed below with number of staff and 2007 (FY 07) budget: Sub-program # FTEs* 2007 Annual Budget
Feedgrounds 2.0 $ 1,470,014 * Includes permanent positions authorized in the FY 07 budget. Any positions added during the budget cycle require Wyoming Game and Fish Commission authorization or must be funded from supplemental grants

43
This program is uniquely organized in that it is statewide, but located in the Jackson-Pinedale Region. Personnel are assigned in Pinedale and Etna. The program is supervised by the Jackson-Pinedale Regional Wildlife Supervisor in Pinedale. Primary Function of the Feedground Program:
• Maintain elk population objectives and control elk distribution by providing supplemental feed. Supplemental feeding will assist in the prevention of damage to personal property and assist in the prevention of commingling with livestock to reduce opportunities of disease transmission.
Performance Measure #1: Amount of hay purchased to feed elk on state feedgrounds
5,000
6,000
7,000
8,000
9,000
10,000
11,000
12,000
13,000
Tons
of H
ay
2002 2003 2004 2005 2006
Calendar Year
Story behind the performance: Feeding has been an elk management tool in northwestern Wyoming since winter elk feeding began in Jackson Hole in 1910. Elk feedgrounds in northwestern Wyoming are managed to compensate for the loss of historic winter range, limit landowner damage claims, and reduce commingling of elk and cattle. Thus, elk are attracted and fed at designated elk feedgrounds during winter. The amount of hay needed is determined by factors that cannot be accurately predicted in advance of each winter period. The Wyoming Game and Fish Commission’s policy on elk feeding established the upper limit for elk numbers for all 22 state operated feedgrounds at 14,934 elk. However, the number of elk that attend a feedground, the length of the feeding season, the severity of the winter weather, and the effect wolves will have on elk distribution cannot be predicted. The amount of hay needed depends on the four variables mentioned above, none of which are controlled by feedground managers, but can be predicted to a certain degree based on past experience. Given existing elk populations and the variables, beginning hay inventories should be between 12,000 tons and 13,000 tons. While it is not possible to predict exact hay needs in advance, it is generally better to have too much hay rather than too little hay. Hay is produced and hauled by independent contractors from June through November, and administering and monitoring these contracts comprise much of the summer work for feedground personnel. When hay shortages occur during winter, costs

44
increase because of reduced market hay availability and the extensive snow removal that must occur for hauling into remote locations. A total of 10,998 tons of hay were stored at feedgrounds prior to the winter of 2006-2007, which is less than the average of 12,302 tons. A total of 7,407 tons of hay were fed in winter 2006-2007 to 16,560 elk. The amount of hay fed is consistent with the five-year average of 7,465 tons. This can be attributed to the higher than average elk numbers and possible drought conditions suppressing forage production. In order to reduce damage/commingling conflicts and prevent excessive starvation, about 89 percent of the all elk in the Region were fed. What has was been accomplished: The feedgrounds program purchased 7,390 tons of hay. What we propose to improve performance in the next two years: • Continue to meet with terrestrial wildlife biologists and game wardens during the big
game hunting season-setting process to set elk seasons that manage elk populations within Commission set population objectives and feedground quotas.
• Visit periodically with terrestrial wildlife biologists and game wardens to update them on the number of elk that attend each feedground to better formulate strategies for herd reductions when necessary. Request budgets adequate to purchase hay amounts necessary to feed elk when numbers exceed expected levels and/or the feeding season is longer in duration.
• Purchasing excessive amounts of hay impacts budgets and sometimes wastes hay. Existing sheds cannot protect surplus hay. Request budgets capable of funding additional hay sheds to protect surplus hay supplies.
• Allowing elk to migrate into areas where damage and commingling with cattle occurs creates unnecessary and sometimes unsolvable conflict. Continue to ensure that elk feeders and feeding equipment are in place and ready for operation prior to elk migrations.
• Continue to manage hay quality during purchase, storage, and feeding to ensure good quality hay is available during critical periods when elk may otherwise leave a feedground and cause conflicts.
• Continue to participate in the preparation and implementation of Brucellosis Management Action Plans and develop strategies to provide adequate separation between elk and livestock between February 1 and June 15, which is believed to be the most critical transmission period.

45
Performance Measure #2: Number of elk attending feedgrounds
-
2,000
4,000
6,000
8,000
10,000
12,000
14,000
16,000
18,000
Num
ber o
f Elk
2002-2003 2003-2004 2004-2005 2005-2006 2006-2007
Winter
Story behind the performance: Elk feedgrounds have been an important management tool since the early 1900s. Elk conflicts with agriculture, such as damage to stored hay and feedlines, risk of cattle exposure to brucellosis due to commingling, deep snow accumulations, and loss of native ranges to development significantly impact the ability of elk to utilize native ranges without conflict. During most winters, elk feedgrounds maintain a significant percentage of the total elk populations, while native ranges support relatively few elk. Wyoming constituents are accustomed to the increased elk hunting opportunities afforded by high elk numbers that are possible because of feeding. In addition to helping support elk population numbers in northwest Wyoming and hunting opportunities, elk attendance on feedgrounds provides an opportunity to vaccinate elk for brucellosis and reduce conflict with private landowners. About 16,560 elk were fed during the winter of 2006-2007. This is 1,109 more than the average since winter 2002-2003. The increase may be attributed to the drought conditions suppressing forage production along with growing elk populations. The number of elk attending the feedgrounds has ranged between 13,041 elk (winter 2002-2003) and 17,140 elk (winter 2005-2006). In order to reduce damage, commingling conflicts and prevent excessive starvation, about 89 percent of all elk in the Region were fed. Western Wyoming has been under the influence of drought conditions for the past 10 to15 years. Winter conditions during 2006-2007 were less than normal, which resulted in decreased snowfall from previous winters. Wolves chase elk from and between feedgrounds. These factors can influence the number of elk counted on feedgrounds and/or fed. The Patrol Cabin feedground had 2,845 elk; Alkali, 55 elk; Fish Creek, 22 elk; South Park, 1,249 elk; Horse Creek, 1,626 elk; Dog Creek, 1,016 elk; Camp Creek, 1,119 elk; Dell Creek, 297 elk; McNeel, 598 elk; Alpine, 583 elk; Forest Park, 900 elk; Jewett, 777 elk; North Piney, 0 (550 elk before they left for Bench Corral); Finnegan, 239 elk; Bench Corral, 385 elk prior to N. Piney elk arriving; Franz, 620 elk; Green River

46
Lakes, 545 elk; Black Butte, 616 elk; Soda Lake, 856 elk; Fall Creek, 529 elk; Scab Creek, 750 elk; Muddy Creek, 383 elk. Between 73 percent and 89 percent of the elk in the Region are fed each year because adequate native range is not available. These locations are selected as feedgrounds because elk can be attracted to the areas. Feeding at these locations assists in keeping elk away from potential commingling/damage situations. While elk attend feedgrounds, they are fed adequate hay (quantity and quality) to reduce starvation. Public acceptance for elk mortality on feedgrounds is low. Long–term average mortality from all causes do not exceed 1.5 percent on all feedgrounds combined. Mortality resulting from old age, hunter crippling, wolf predation, vaccination, and elk trapping cannot be prevented by feedground management techniques. Other causes of mortality (goring, some diseases, malnutrition) may be related to feedground management. Feedground managers should utilize available techniques to minimize those causes of mortality that may be attributed to feedground management. Percent winter mortality for 2006-2007 was 0.6 percent, which was also the average mortality for winters 2001-2006. What has been accomplished: • Winter 2006/2007 was mild with feeding starting later and ending earlier. The
feeding season averaged 113 days in length for all feedgrounds combined. This is 13 days less than the long-term average.
• Feedgrounds were attended by 89 percent of the elk in the Region. • The mortality rate on the feedgrounds was less than one percent. • Wolves caused elk mortality at eight of the 22 feedgrounds. There were 35 elk
documented by elk feeders to have been killed by wolves. What we propose to improve performance in the next two years: • Continue to work with terrestrial wildlife biologists and game wardens during their
winter survey effort to obtain accurate feedground counts to compare to elk counted on native ranges.
• During the annual fall orientation briefing, direct elk feeders to record all deaths and to attempt to determine the cause of death. Continuing to document and identify the major causes of winter elk mortality on feedgrounds is helpful in addressing public concerns and helps feedground personnel improve management efforts, thus resulting in more productive feeding efforts.
• Keep the public informed of situations that may lead to unfavorable public opinion. Feedground personnel, game wardens, and terrestrial wildlife biologists need to be aware of situations that have the potential of causing public concern and take the lead in developing a media approach.
• Be prepared to quickly notify and work with the Department’s Veterinary Services if disease issues are causing unexpected numbers of elk to die.
• Forest Park and Green River Lake feedgrounds do not serve to prevent damage and commingling with livestock. Their sole purpose is to prevent excessive winter elk losses. Feeding strategies can be adjusted at these locations to feed less hay to save on feeding costs and reduce potential intra-specific disease transmission.

47
Program: Financial Management Division: Fiscal Division Mission: Ensure accountability of all Department assets to the Department’s publics, including financial compliance with federal and state requirements and assist in management planning and decision-making by providing financial information. Program Facts: The Financial Management Program is listed below with number of staff and 2007 (FY 07) budget: Sub-programs # FTEs* 2007 Annual Budget Revenue Collection & Licensing** 20.2 $ 1,713,388 Asset Management 2.5 574,365 Disbursements 4.0 214,662 Financial Systems 1.5 146,107 TOTAL 28.2 $ 2,648,522 *Includes permanent, contract and temporary positions authorized in the FY 07 budget. Any positions added during the budget cycle require Wyoming Game and Fish Commission authorization or must be funded from supplemental grants. **Includes one ¾ fiscal specialist position. This program is located in the Department Headquarters Office in Cheyenne. Primary Functions of the Financial Management Program: • Ensure accountability and compliance by being responsible for billing, collecting,
and accounting for all Department revenues and administering the systems to accommodate administration of all Department revenues including issuance of personal hunting and fishing licenses, permits, tags and stamps, watercraft registration, commercial hatchery, taxidermist and bird farm licenses, and federal, state, local and private grants and donations, to include receipts in excess of $50 million annually. In addition, we initiate, review and process in excess of 50,000 payment transactions in accordance with state requirements.
• Ensure accountability and compliance by maintaining and updating the financial records of all Department fixed assets to include personal property (vehicles, office and shop equipment, leasehold improvements) and real property (buildings, infrastructure, land improvements).
• Assist in Department management planning and decision-making by developing and monitoring the Department’s annual budget to ensure compliance with state requirements. In addition, we provide monthly and annual financial reports to agency personnel and external publics.

48
Performance Measure #1: Timeliness of Processing Payment Transactions and Depositing License Draw receipts
343638404244
(thou
sand
s)
FY 03 FY 04 FY 05 FY 06 FY 07
# of Payment Transactions
0
2
4
6
(day
s)
FY 03 FY 04 FY 05 FY 06 FY 07
Average # of daysto process payment transactions
1020304050
( mill
ions
)
FY 03 FY 04 FY 05 FY 06 FY 07
License Draw Receipts
Story behind the performance: In the last two years, the volume of payment transactions stabilized within the disbursements section, changing less than two percent. However, an increasing number of license applicants applying for and receiving refunds for medical disability and military orders during that same period, meant that the section had to spend time on a function that was extremely marginal in the past. This development meant there was a slight increase in turn-around time from four to almost five days for processing payment documents. However, we believe that a turnaround time of approximately four to five days from the receipt of a transaction until processing is complete at the Department is still a very reasonable time frame.

49
In the area of receipts, the License Draw section saw a decrease in manual applications of almost 30 percent from the previous year as the Department implemented an Internet application process utilizing credit cards. The total number of applications also decreased due to the change in the preference point purchase period to July 1 to September 30, which resulted in a reduced number of FY 07 applicants as they could purchase preference points for 2006 in either FY 06 or FY 07. This factor will only have the effect of reducing applications for preference points for FY 07, not subsequent years. While the total number of license applications actually increased slightly, the dollar amount of receipts requiring manual processing decreased 36 percent. This allowed the Section to decrease their temporary help by approximately 25 percent, with the turn around time to deposit funds reduced from 17 to 10 days. What we propose to improve performance in the next two years: • In the area of disbursements, as part of the Department’s rewrite of our license draw
system, we will be initiating an interface to reduce entry time for revenue refunds for the majority of license refunds. We will also be reinstating fiscal training for field personnel to reduce the number of payment documents that must be corrected prior to entry due to incomplete data or errors.
• In the License Draw area, we anticipate that the volume of internet applicants will continue to increase, with a 50 percent subscription rate within the next two years. Increased media efforts have been directed in this respect. Additionally, some procedural changes are being initiated in FY 08 on a trial basis to include depositing funds for manual applications prior to any application review.
Performance Measure #2: Number of External Customer License Inquiries resulting in Department correction of errors
190200210220230240250260
(thou
sand
s)
FY 03 FY 04 FY 05 FY 06 FY 07
# of Applications Processed

50
0
20
40
60
80
100
(cor
rect
ions
)FY 03 FY 04 FY 05 FY 06 FY 07
# of Key Punch Errors
Story behind the performance: The license draw section receives approximately 225,000 license applications annually most of which are received in a five month window. This short time frame requires the use of a large number of short-term temporary personnel, which makes the entire process extremely challenging from both a deadline and accuracy standpoint. In hunt year 2006, due to the adoption of nonresident preference points, application forms changed, resulting in more questions and errors by applicants. Additionally, in hunt year 2006, volume increased. The Department responded by initiating online internet applications for hunt year 2007 and changing the period to purchase preference points to after the license application period. The Department believes that the number of keypunch errors is still extremely low compared to the number of applications and while training and review can help to keep this error level low, it cannot completely eliminate human error. What we propose to improve performance in the next two years: • Continue to perform quality control by reviewing all applications entered prior to
running the draw and issuing licenses • Encourage applicants through media and mailings to apply through the internet which
has edits to help reduce errors made by applicants in completing applications. Performance Measure #3: Employee satisfaction with service level provided by Financial Management
4.2
4.3
4.4
4.5
4.6
4.7
4.8
1 (P
oor)
5
(Exc
elle
nt)
FY 03 FY 04 FY 05 FY 06 FY 07
Internal Customer Satisfaction
Courtesy
Timeliness
Accuracy

51
Story behind the performance: The Fiscal Division is responsible for providing customer service to Department employees while insuring compliance with federal and state requirements. Additionally, it must interface its financial systems with those mandated by the State Auditor, State Personnel, State Purchasing and the State Budget Office. Accordingly, much of the Division’s ability to meet the needs of agency personnel is dependent on the directives of these other entities while still ensuring that the agency’s financial records provide accountability and auditability. To meet these objectives, the Division believes that its primary focus should be on courtesy to individuals, timeliness of information and ability to answer questions (completeness), as these items are indicative of the service level that all of the employees within the Division are providing. The above graph is a composite (mean) of the individual results of the four sub-programs. The reporting information changed somewhat in 2007 as there was no differentiation in results between very satisfied and somewhat satisfied, which may have caused the results to show slightly lower when compiled then in the previous years. However, we continue to believe that an indicator of four or above (somewhat satisfied) on a one to five satisfaction scale demonstrates that an acceptable level of service is being provided, while still being cost efficient. What we propose to improve performance in the next two years: • We propose to continue to maintain service levels where employees can be provided
assistance in a timely, complete and courteous manner. This may be a challenge in FY 08 due to the adoption of a new State Accounting system that has delayed some transaction processing and report availability. We will need to expand training to field personnel in the next year to assist in utilizing the new system.
Program: Habitat Division: Fish and Wildlife Mission: Holistically manage, preserve, restore and/or improve habitat to enhance and sustain Wyoming’s fish and wildlife populations for current and future generations. Program Facts: The Department Habitat program is made up of three major sub-programs, listed below with number of staff and 2007 (FY 07) budget: Sub-programs # FTEs* 2007 Annual Budget Terrestrial Habitat Management 14.5 $ 1,334,634 Aquatic Habitat Management 13.4 1,294,791 Water Management 2.6 211,000 TOTAL 30.5 $ 2,840,425

52
* Includes permanent, contract and temporary positions authorized in FY 07 budget. Any positions added during the budget cycle require Wyoming Game and Fish Commission authorization or must be funded from supplemental grants. The Habitat program formerly included the Habitat and Access Management sub-program (Strategic Plan FY 04-FY 07, November 2003). While this sub-program has since been removed, the Habitat program has incorporated the Water Management sub-program (formerly a sub-program in Aquatic Wildlife Management program). The Habitat program has statewide responsibilities. Permanent personnel are located in Buffalo (1), Casper (3), Cheyenne (4), Cody (3), Green River (2), Jackson (2), Lander (2), Laramie (3), Pinedale (2) and Sheridan (2). Primary Functions of the Habitat Program: • Manage, preserve and restore habitat for long-term sustainable management of
fish and wildlife populations by inventorying wildlife habitat conditions, determining where conditions are limiting, and planning and implementing projects at watershed and landscape scales in order to conserve and restore habitat quality. This is accomplished by integrating various land uses while involving the general public, private landowners and land management agencies.
• Increase fish and wildlife based recreation through habitat enhancements that increase productivity of fish and wildlife populations by designing and implementing habitat improvement projects in cooperation with private landowners and/or public land managers.
Performance Measure #1: Terrestrial Habitat Management – Percent of terrestrial habitat goals completed that addressed habitat conservation or restoration activities for wildlife within priority areas and/or habitat types
0
20
40
60
80
100
% H
abita
t C
onse
rvat
ion/
Res
tora
tion
Act
iviti
es C
ompl
eted
FY 03 FY 04 FY 05 FY 06 FY 07
Story behind the performance: This performance measure is a meaningful and measurable habitat preservation or restoration goal that is tied to accomplishments of Department habitat personnel. Prior to

53
each fiscal year, habitat personnel develop work schedules and performance goals consistent with the Strategic Habitat Plan (SHP). These goals are then tracked individually and reported collectively in terms of accomplishing a percentage of the performance desired for the fiscal year. This performance measure is based on the annual SHP report for calendar year 2006, annual performance appraisal evaluations during the fiscal year, daily activity reports, annual and monthly activity highlights and used to document performance and FY07 accomplishments. There are many examples of habitat conservation or restoration activities related to this performance goal as cited below. Tracking of performance goals improves the Department’s ability to measure the habitat program success and quality of habitat treatments over time, sometimes decades, for long-term conservation and restoration efforts over large-scale landscapes projects. In this way the Department is better able to measure success and quality of habitat treatments and restoration activities. In FY 07, 83 percent of the terrestrial habitat goals that addressed habitat conservation or restoration activities were completed. The increase in FY 07 over the long-term average of 79.7 percent (FY 03-FY 07) is mostly related to increased implementation of shrub-steppe and aspen projects, additional funding sources, personnel focus on large scale, long-term projects and following planning, coordination, and funding, implementation of these large projects. Projects not completed or implemented were largely beyond immediate control due to circumstances including weather, outside partners, other administrative priorities and timelines, and insufficient number of personnel. What has been accomplished: Approximately 83 percent of the terrestrial habitat goals addressing habitat conservation or restoration activities were completed in FY 07. A few examples of accomplishments by terrestrial habitat personnel during FY 07 are discussed in the material that follows. Sheridan habitat personnel worked with the Lake DeSmet Conservation District, Natural Resources Conservation Service, other funding partners and private landowners to fund sagebrush restoration projects and design livestock grazing programs in northern Johnson County. Habitat personnel provided wildlife-related inventories for planning and project implementation on 17 large ranches totaling approximately 275,000 acres that are enrolled in the program. Habitat personnel in the Jackson area were able to help negotiate a successful allotment retirement and forage reserve on approximately 178,000 acres of crucial wildlife habitat in the Gros Ventre drainage with the grazing permittee, USDA Forest Service and various partners. Various partners and the Wyoming Legislature through the Wyoming Wildlife and Natural Resources Trust (WWNRT) successfully funded two large watershed projects involving the Bates Creek watershed and the Lander Front. Habitat personnel designed whole-ranch domestic livestock grazing management plans to benefit wildlife on approximately 50,700 acres during the fiscal year. Various habitat treatments were accomplished on over 16,800 acres in cooperation with federal and state land managers,

54
various conservation partners and private landowners. These included prescribed fire, sagebrush mowing, removal of conifers from aspen stands, removal of juniper encroachment in mountain shrub and sagebrush habitats, range pitting, Lawson aeration and seeding projects, herbicide application to improve plant diversity and manage invasive plant species, wheat stubble management, planting trees and shrubs and developing wildlife food plots among others. In addition, 21.5 acres of new wetlands were established along with the restoration of several acres of ponds, reservoirs and existing wetland. Terrestrial habitat personnel also developed 19 springs and guzzlers to benefit a variety of wildlife during the fiscal year. What we propose to improve performance in the next two years: • Continue implementation of the Department’s SHP. The primary purpose of the SHP
is to identify important habitats for wildlife to maintain or increase wildlife populations. Funding is provided in existing budgets and through partnerships with other agencies, private landowners and conservation groups.
• In coordination with the SHP oversight committee and the implementation team, annually evaluate and update habitat priorities by region, habitat type, crucial wildlife habitat areas, species of greatest concern habitats, and assist with completion, update and revision of the SHP.
• During the Department budget process, continue to develop additional proposals to submit for funding to the Wyoming Wildlife and Natural Resources Trust, Wyoming Landscape Conservation Initiative Team, U.S. Department of Agriculture (USDA) Farm Bill Program and other funding source partners. Additional funds will allow for the funding of more conservation and restoration projects.
Performance Measure #2: Terrestrial Habitat Management – Percent of terrestrial habitat goals completed that address habitat enhancements within priority areas and/or priority habitat types to improve the quantity or quality of wildlife
0
20
40
60
80
100
% E
hanc
emen
t Goa
ls
Com
plet
ed
FY 03 FY 04 FY 05 FY 06 FY 07
Story behind the performance: This is a meaningful and measurable habitat enhancement goal that is tied to annual accomplishments of Terrestrial habitat personnel. Prior to each fiscal year, habitat personnel develop work schedules and performance goals consistent with the SHP. This
55
performance measure is based on the annual SHP report for calendar year 2006, performance appraisal evaluations during the fiscal year, daily activity reports, annual and monthly activity highlights, and used to document performance and FY 07 accomplishments. There are many examples of habitat enhancement activities related to this performance goal as cited below. These goals are then tracked individually and reported collectively in terms of accomplishing a percentage of the performance and work schedule goals. Examples of habitat enhancement related performance goals include seeking funding and contracting trappers to transplant more than 30 beavers to unoccupied suitable habitats on the Bighorn National Forest to improve riparian/wetland habitat. Tracking of performance goals improves our ability to accommodate habitat quality performance concerns not easily included in measures such as actual acres treated or number of projects accomplished. Habitat extension positions tend to be the most prolific in terms of implementing habitat enhancement projects. Recent reductions can be traced directly to the fairly constant turnover and prolonged vacancy experienced for one of our three habitat extension positions. Habitat biologists have also lost productivity due to the lead role they play in the mitigation of habitats disturbed from energy development, Resource Management Plan activities and Forest Service Plan revisions. Besides reducing time available for planning and implementing on-the-ground habitat enhancement projects, biologists have had less time to seek funding and develop partnerships with landowners and land managers. In FY 07, 81 percent of the terrestrial habitat goals that addressed habitat enhancements were completed. This was an increase from the average 73.3 percent (FY 03-FY 07). What has been accomplished: Approximately 81 percent of the habitat enhancement goals were completed in FY 07. The Terrestrial Habitat Section was able to negotiate a new extension biologist position in Gillette with the Natural Resource Conservation Service cost share agreement and fill the Bighorn Basin position. A few examples of accomplishments by terrestrial habitat personnel during FY 07 are discussed and were also cited in Performance Measure #1. Various habitat enhancements were accomplished on over 16,800 acres in cooperation with federal and state land managers, various conservation partners and private landowners. These included prescribed fire, sagebrush mowing, removal of conifers from aspen stands, removal of juniper encroachment in mountain shrub and sagebrush habitats, range pitting, Lawson aeration and seeding projects, herbicide application to improve plant diversity and manage invasive plant species, wheat stubble management, planting trees and shrubs and developing wildlife food plots among others. In addition, 21.5 acres of new wetlands were established along with restoration of several acres of ponds, reservoirs and existing wetland. Terrestrial habitat personnel also developed 19 springs and guzzlers to benefit a variety of wildlife during the fiscal year. The Sheridan habitat biologist oversaw the

56
trapping and transplanting of 21 beavers to enhance watersheds, wet meadow complexes and fisheries. Habitat extension positions tend to be more prolific in terms of implementing habitat enhancement projects with private landowners using the USDA Farm Bill programs and other funding partners. The terrestrial habitat extension and habitat biologist positions contacted and worked with many private landowners resulting in 53 habitat enhancement projects being accomplished during the fiscal year. What we propose to improve performance in the next two years: • Continue implementation of the Department’s SHP. The primary purpose of the SHP
is to identify important habitats for wildlife to maintain or increase wildlife populations. Funding is provided in existing budgets and through partnerships with other agencies, private landowners and conservation groups.
• In collaboration with the Natural Resource Conservation Service (NRCS), continue to seek funding for additional habitat extension positions as prioritized by location in the SHP.
• During the Department budget process, continue to develop additional proposals to submit for funding to the WWNRT, Wyoming Landscape Conservation Initiative Team, USDA Farm Bill Program and other funding source partners. Additional funds will allow for the funding of more conservation and restoration projects.
Performance Measure #3: Aquatic Habitat – Percentage of watershed restoration and habitat enhancement activities accomplished annually
60
65
70
75
80
85
% W
ater
shed
En
hanc
emen
t/Res
tora
tion
Goa
ls C
ompl
eted
FY 03 FY 04 FY 05 FY 06 FY 07
Story behind the performance: This performance measure tracks progress in terms of goals that are identified prior to each fiscal year to meet habitat management, restoration and enhancement goals. These include number of trust fund (internal and external) projects and grants developed, number of watersheds surveyed, partnerships initiated or developed, and number of projects planned, funded or implemented. Both designed and implemented projects are tracked because often a project is planned and designed, but is not implemented for reasons beyond our control (for example, funding, loss of partners, weather conditions, etc). The work is important to track even if it does not immediately result in on-the-ground projects because often the work done and plans developed become the catalyst for

57
future projects. Also, we often plan, design, and fund habitat restoration efforts but a third party may be responsible for implementation. Hence, implementation is not an accurate measure of all that is done to accomplish habitat restoration at the watershed scale. In FY 07, productivity was affected by bureaucratic processes (i.e. Bureau of Land Management Resource Management Plans and energy development commenting). Also, negotiations with private landowners regarding liability, access and water management delayed implementation of major fish passage projects (i.e. Kendrick, Trout Creek, etc.) Regardless, an overall increase in projects implemented or completed was realized in FY 07. What has been accomplished: Approximately 85 percent of the habitat enhancement goals were initiated or completed in FY 07. Examples of projects initiated or completed in FY 07 include a cooperative fish passage monitoring study on low head diversion rehabilitation project on Clear Creek using tagging and electronic sensors; inventory and planning for replacement of grade control structures on the drains of Ocean Lake; fish entrainment evaluation for diversion ditches on the Spence/Moriarity Wildlife Habitat Management Area (WHMA); removal of a fish migration blocking culvert on lower Clear Creek; warm water stream assessments were completed in the Laramie River and South Platte River basins, Watershed Habitat Assessment Method (WHAM) level one surveys were completed for several stream segments around the state; utilization of imagery to prepare ArcView maps depicting vegetation communities for prescribed burns in cooperation with USDA Forest Service, Terrestrial Habitat and Wildlife personnel; aspen, willow and mountain shrub trend monitoring sites established to monitor prescribed burn and grazing effects; and completion of the third phase of the Flat Creek/Salt River project to restore native cutthroat trout habitat. What we propose to improve performance in the next two years: • Work output should increase from our fish passage initiative as the habitat biologist
in Cody, who leads the fish passage program, works out methods to improve contracting projects with the private sector and other agencies. There is widespread interest and funding for fish passage work, man-power and time is the greater limitation.
• The WWNRT is a great source of non-federal project funds. Coordination with existing partners that include private landowners, land managers, Conservation Districts and conservation organizations has improved, but continued improvement is needed. In some instances we need to identify and solicit the cooperation of new partners in order that mutual benefits are met using these limited funds. This should result in a greater number of funded projects. Leveraging these funds for watershed scale habitat improvement via conservation easements should be encouraged.
• We need to better utilize USDA Farm Bill funding to benefit our priority watersheds as this program comes up for reauthorization. We have begun to work more closely with the NRCS over the last couple of years. They have adopted our priority watersheds and have shown interest in and funding for our fish passage initiative. We need to continue to build on this firm foundation. Discussions will continue with the NRCS to look at the feasibility to jointly fund aquatic habitat extension positions.

58
• Inventory of watershed resources and identification of management alternatives in priority watersheds is expected to increase since an At-Will Employee Contract position was filled in early FY 08. This activity is identified under goal one, objective one of the Strategic Habitat Plan (SHP).
• In coordination with the SHP agency habitat oversight committee and the implementation team, annually evaluate and update habitat priorities by region, habitat type, crucial aquatic wildlife habitat areas, species of greatest concern habitats, and assist with completion, update and revision of the SHP.
Data development agenda: Aquatic Habitat Section is revamping our basic planning instrument, Basin Management Plan (BMP), to be goal and objective driven. The goals and objectives for each priority watershed have been identified and will be incorporated into our work schedule and BMPs. Following completion of regional BMPs and the revision of the SHP, slated for summer 2008, the current performance measure will be split into two and replaced by the following measures: “Percentage of Basin Management Plan habitat objectives for priority watersheds implemented/completed”; and “Number of priority watersheds with habitat conservation or restoration activities implemented”. Performance Measure #4: Water Management/Instream Flow – The number of applications for instream flow water rights filed
0
1
2
3
4
5
# of
App
licat
ions
File
d
FY 03 FY 04 FY 05 FY 06 FY 07
Story behind the performance: One of the primary responsibilities of Water Management is the filing of applications for instream flow water rights. The applications are the culmination of many years studying the interrelationship between physical habitat and hydrology of individual stream segments. This measure shows the number of instream flow water rights applications that are filed with the State Engineers Office. In FY 07, no instream flow water rights were filed. The decline in filing activity was a result of the field crew leader accepting a promotion within the Department. What we propose to improve performance in the next two years: • Continue to work closely with regional personnel in all Divisions and assist with
water right and management decisions to make certain the water use maintains and protects the water rights and overall property rights of the Game and Fish Commission.
59
• Public awareness of instream flow needs and issues is lacking. Continue to provide information regarding the benefits of instream flows to the general public and private landowners via articles, presentations. Work is already underway to improve the section’s web page so visitors to the site can better grasp the accomplishments and challenges faced by this section.
• The instream flow biologist position will be filled and training will occur so that filings will resume.
Appendix A. New proposed performance measure: Besides instream flow water rights that are actually held by the state, the Commission holds water rights, the use of which should be protected or enhanced to maintain and improve the quantity and quality of fish and wildlife habitat or fish production at fish hatcheries. Types of water rights that are managed solely by the Department or in cooperation with other agencies include water rights for irrigation, wetlands, fish production, instream flow, minimum/conservation reservoir pools and tailwater discharge rates maintained by agreement with federal and state agencies. Changes of use will be only be done with Commission approval to convert existing water rights to an alternative beneficial use that enhances wildlife and fish habitat but does not compromise the original purpose of our WHMAs or fish culture facilities. This will continue to be a multi-divisional effort that is lead by the Fish Division’s Water Manager. Program: Habitat and Access Management Division: Services Mission: Manage and protect commission property rights for the benefit of the Commission, Department and people of Wyoming. Wildlife Habitat Management and Public Access Areas are managed in a cost-effective and efficient manner while technical knowledge and habitat development services are provided to the Department. Program Facts: The Habitat and Access Management program manages and administers Wildlife Habitat Management Areas and Public Access Areas for the Wyoming Game and Fish Department. In addition, the branch will complete project requests for other divisions within any single fiscal year. Listed below are the number of staff and 2007 budget: Sub-program # FTEs* 2007 Annual Budget
Habitat and Access Management 25.0 $ 2,384,062 * Includes permanent, contract and temporary positions authorized in FY 2007 budget. Any positions added during the budget cycle require Wyoming Game and Fish Commission authorization or must be funded from supplemental grants.

60
The Habitat and Access Management program was formerly a sub-program in the Habitat program (Strategic Plan FY 04-FY 07, November 2003). The program is located statewide with personnel in Jackson, Pinedale, Cody, Lovell, Sheridan, Laramie, Yoder, Lander, Dubois and Casper. Primary Functions of the Habitat and Access Management Program: • On behalf of the Commission, we manage and protect commission property
rights for the benefit of the Commission, Department and people of Wyoming by facilitating wildlife conservation through conserving and improving wildlife habitat on Wildlife Habitat Management Areas. We serve the public by providing for safe and reasonable public recreation of the wildlife resource on Wildlife Habitat Management Areas while maintaining a balance between habitat conservation and public recreation on those lands.
• On behalf of the Commission, we manage and protect commission property rights for the benefit of the Commission, Department and people of Wyoming through providing for safe and reasonable public access and recreation of the wildlife resource on Public Access Areas.
• Provide technical knowledge and development services to the Department by working on project requests, which, conserve wildlife habitat through the Department’s Strategic Habitat Plan and increase public recreational opportunities within the state.
• Operate in a cost-effective and efficient manner through the balance of private sector contracts and trained Department crews.
Performance Measure #1: Percent of work plan elements achieved
0
20
40
60
80
100
% E
mpl
oyee
s Sa
tisfie
d
FY 03 FY 04 FY 05 FY 06 FY 07
Story behind the performance: The program is responsible for administering and managing 36 unique Wildlife Habitat Management Areas (WHMAs) and 97 Public Access Areas (PAAs). The WHMAs and PAAs are managed according to the Managed Land and Access Summary (MLAS)

61
developed for each individual area. The work plans are developed prior to each fiscal year in an attempt to address major anticipated needs and requirements of the MLAS for administering and managing the WHMAs and PAAs. The percent of work plan elements achieved is considered to be excellent because the majority of priorities and necessary services (86 percent) are being provided. As illustrated above, this has been fairly consistent for the last five years and 2007 is no exception. However, there are two reasons that a higher percentage of work plan elements are not achieved annually. The first is the program addresses Department priorities foremost and not program priorities. Numerous higher priority Department projects (project requests) develop after the work plan is completed, and therefore some elements initially planned within the work plan are canceled or delayed. Finally the program has had substantial turnover of employees in the last three years. This has impacted the ability of all program personnel to accomplish work plan elements because of open positions, lost time to recruiting efforts, lower productivity due to extensive training requirements, and a steep learning curve for new personnel. What we propose to improve performance in the next two years: • Concentrate on hiring and promoting quality personnel to help with the long-term
stability, integrity and services provided by the program. • Complete the procedure manuals, which were initiated in 2005, to guide and assist
employees with their job responsibilities, duties and tasks. The procedure manuals will provide task guidance through detailed descriptions of techniques and duties. In addition, the manuals will contain a calendar of deadlines to facilitate planning and preparation. The procedure manuals should be completed by May of 2008.
• Continue efforts to work on Department priorities and not just program priorities. The program must stay flexible to continue to provide the people of Wyoming the best possible wildlife habitat and recreational opportunities possible.
• Increase communication efforts with Division administration by scheduling quarterly meetings to clarify operational priorities.
Performance Measure #2: Percent of project requests completed
50
60
70
80
90
100
% R
eque
sts
Com
plet
ed
FY 03 FY 04 FY 05 FY 06 FY 07
% informal completed
% moderate completed
% major completed
Story behind the performance: The Habitat and Access program is requested to assist or provide services for other programs within the Department. On average, 125 (95 percent) of these requests will be completed yearly. In order to track, schedule and complete the requests (project requests)

62
they are broken into three categories: informal, moderate and major project requests. Informal requests take less than two employee days to complete, moderate project requests will take up to ten employee days to complete and major projects are projects which require more than ten employee days. The vast majorities of requests are major and address the Department’s Strategic Habitat Plan. The project requests are for assistance or services that only this program can provide within the Department. Project requests vary from large-scale habitat manipulation projects, such as aspen and sagebrush treatments, to minor heavy equipment work on a hatchery. The percent of project requests completed has been fairly consistent and considered “very good” within the constraints of manpower and budget capacity. The percent of project requests completed has been consistent between 2001 and 2007 with an average of 91.5 percent of all informal, 96.5 percent of moderate and 93.75 percent of all major projects requests being completed. Results for 2007 varied minimally from this average with 91 percent of informal, 97 percent of moderate and 94 percent of major project requests being completed within the year. However, there are three reasons that a higher percentage of project requests are not completed. The first is the program addresses Department priorities foremost and not individual program priorities. It is extremely important for the program to stay flexible in order to accommodate Department priority projects that may develop after the initial project requests are scheduled. Second, in order to accommodate as many project requests as possible, schedules are developed utilizing 100 percent of all possible personnel time. If a project request is delayed, canceled or changed by the requestor, it affects the percent of project requests completed. The final reason is personnel turnover. The program has had substantial turnover of employees in the last three years. This has resulted in impacting all program personnel’s ability to complete projects because of open positions, lost time to recruiting efforts, lower productivity due to extensive training requirements and a steep learning curve for new personnel. What we propose to improve performance in the next two years: • Concentrate on hiring and promoting quality personnel to help with the long-term
stability, integrity and services provided by the program. • Continue to work closely with terrestrial and aquatic habitat sections to receive more
complete information for project requests so that the percentage delayed, canceled or changed by the requestor is decreased.
• Continue efforts to work on Department priorities and not just program priorities. The program must stay flexible to continue to provide the people of Wyoming the best possible wildlife habitat and recreational opportunities possible.
• Complete the procedure manuals, which were initiated in 2005 to guide, and assist employees with their job responsibilities, duties and tasks. The procedure manuals will provide task guidance through detailed descriptions of techniques and duties. In addition, the manuals will contain a calendar of deadlines to facilitate planning and preparation. The procedure manuals should be completed by May of 2008.
• Increase communication efforts with Division administration by scheduling quarterly meetings to clarify operational priorities.

63
Performance Measure #3: Percent of public and Department employees satisfied with the management and maintenance of facilities on Wildlife Habitat Management Areas and Public Access Areas
0
20
40
60
80
100
% S
atis
fied
FY 03 FY 04 FY 05 FY 06 FY 07
% Satisfied Internal% Satisfied External
Story behind the performance: Annually, the Internal Client Satisfaction survey is distributed to permanent personnel. The survey provides the opportunity for employees to measure the overall performance of 14 Department programs. In many respects, the ability of the Department to provide services to the external clients depends on the ability of employees to satisfy the needs of their internal clients. Similarly, the External Client Satisfaction survey is distributed annually to randomly selected members of the public that had purchased hunting and fishing licenses the previous year. The survey provides the opportunity for the public to measure the performance of selected Department programs. The majority of Wyoming residents, non-residents and Department employees appreciate the efforts of the Department on providing opportunities to access hunting and fishing within the state. Average percent of Department employees that were satisfied with the maintenance of facilities on Department land and access areas is 80 percent. Average percent of satisfied public is 67.1 percent. The program has received relatively consistent marks among the public for its efforts on managing and maintaining facilities such as roads, restrooms, parking areas, signs and fences on the WHMAs and PAAs – with a narrow range of 65.5 percent (FY 05) to 68.1 percent (FY 06). Also, an interesting point worth mentioning is that satisfaction related to WHMAs is lower than PAAs. In FY 06, as was seen consistently for each year, satisfaction level among the public for WHMAs was slightly lower (66 percent) than PAAs (70 percent). Internal satisfaction improved from FY 04 to FY 07 (70 percent to 86 percent), and is believed to be a result of an increased effort to communicate with Department employees about the program. However, the general public or Department employees do not always understand management objectives on WHMAs or PAAs. Those objectives should be better communicated to the public and within the Department. In addition, with numerous state and federal agencies providing recreational opportunities across the state, the majority of public is confused as to whether the area is managed by the Department or by another agency. A high turnover rate within the personnel of the branch also affects the overall

64
condition of the areas. The branch has been in a constant hire and train mode for the last several years. What we propose to improve performance in the next two years: • With the completion of the Managed Land Access Summary, the management of
each area will be better defined. An effort will be implemented to educate Department personnel and the public on the management objectives of each WHMA or PAA. This will be done in cooperation with the Department’s Information and Education Program.
• An increased effort will be made to better define Department WHMAs and PAAs through signing and maps. Area entrances and signs will be standardized throughout the state. In addition, a distinctive look will be developed in conjunction with the Department’s Information and Education Program to differentiate Department areas from other areas managed by different agencies. This effort is on going with the anticipated distribution date of the first signs to be in July of 2008.
• Concentrate on hiring and promoting quality personnel to help with the long-term stability, integrity and services provided by the program.
• Complete the procedure manuals, which were initiated in 2005 to guide, and assist employees with their job responsibilities, duties and tasks. The procedure manuals will provide task guidance through detailed descriptions of techniques and duties. In addition, the manuals will contain a calendar of deadlines to facilitate planning and preparation. The procedure manuals should be completed by May of 2008.
Data development agenda: While the public survey provides valuable information, there is a high probability that the public is commenting on areas, which are not managed by the Department. A method to survey only the public that actually utilizes Department areas is being investigated and hopefully implemented in 2007. Performance Measure #4: Percent of employees satisfied with the services provided
0
20
40
60
80
100
% E
mpl
oyee
s Sa
tisfie
d
FY 03 FY 04 FY 05 FY 06 FY 07

65
Story behind the performance: Annually, the Internal Client Satisfaction survey is distributed to permanent personnel. The survey provides the opportunity for employees to measure the overall performance of 14 Department programs. In many respects, the ability of the Department to provide services to the external clients depends on the ability of employees to satisfy the needs of their internal clients. Annually, the Internal Client Satisfaction survey is distributed to permanent personnel. The survey provides the opportunity for employees to measure the overall performance of 14 Department programs. In many respects, the ability of the Department to provide services to the external clients depends on the ability of employees to satisfy the needs of their internal clients. The program prides itself on addressing Department priorities, while striving to provide the best service to the wildlife resource, public and the Department. The program could very easily be inundated by working on only the assigned duties (management and maintenance of WHMAs and PAAs) but feels that it should be flexible and constantly striving to address Department priorities. The program accomplishes this by providing technical knowledge and development services to the rest of the Department through project requests. The majority of assistance is for habitat development projects that address the Strategic Habitat Plan. Only 15 percent of the program’s efforts are project requests and this performance measure relates to that 15 percent. There are problems in that some project requests are poorly designed, delayed or canceled by the requestor. It has been extremely difficult to address additional project requests with the personnel turnover that has been associated with this program. Both of these conditions directly relates to the satisfaction of the program by other Department personnel. Overall, the average for the last fours years has been that 88 percent of the Department personnel are satisfied with the program’s services. In FY 07, 87 percent of Department personnel were satisfied with the program. What we propose to improve performance in the next two years: • Concentrate on hiring and promoting quality personnel to help with the long-term
stability, integrity and services provided by the program. • Complete the procedure manuals, which were initiated in 2005 to guide, and assist
employees with their job responsibilities, duties and tasks. The procedure manuals will provide task guidance through detailed descriptions of techniques and duties. In addition, the manuals will contain a calendar of deadlines to facilitate planning and preparation. The procedure manuals should be completed by May of 2008.
• Continue to work closely with terrestrial and aquatic habitat sections to receive more complete information for project requests so that the percentage delayed, canceled or changed by the requestor is decreased.
• Continue efforts to work on Department priorities and not just program priorities. The program must remain flexible to continue to provide the public the best possible wildlife habitat and recreational opportunities possible.

66
• Educate Department employees on program priorities and limitations through presentations and discussions at FY 08 and FY 09 Wildlife, Fish and Services Supervisors meeting and at the region Coordination Team meetings.
Data development agenda: While the percent satisfaction is important data, future internal survey will be modified to be more specific to employee satisfaction of the handling and completion of project requests. Therefore, the future data should relate to project requests. Program: Habitat Protection Division: Office of the Director Mission: Coordinate reviews and evaluations of land use plans and projects within our agency and with other agencies, and develop and negotiate planning and mitigation strategies. Program Facts: The Habitat Protection program is made up of one major sub-program, listed below with number of staff and 2007 (FY 07) budget: Sub-program # FTEs 2007 Annual Budget
Habitat Protection Program 4.0 $ 304,607 This program is located in the Department Headquarters Office in Cheyenne. Primary Functions of the Habitat Protection Program: • Coordinate Department review and evaluation of land use plans, projects, policies,
and activities that affect fish, wildlife, and their habitats, and make recommendations consistent with Department and Commission policies, position statements, and strategies.
• Develop and negotiate planning and mitigation strategies regarding energy development.

67
Performance Measure #1: Performance appraisals
0
20
40
60
80
100
% M
eets
or E
xcee
ds
Expe
ctat
ions
FY 03 FY 04 FY 05 FY 06 FY 07
Story behind the performance: The Department is responsible for conserving over 800 species of fish and wildlife for the benefit of the citizens of Wyoming. Most of the management focus for maintaining viable populations of these species depends on availability of suitable habitat. The Department actively manages only a very small percentage of that habitat, and thus a large part of our responsibility toward maintaining and supporting our citizens’ fish and wildlife resource entails advising the land use actions of other parties so that negative impacts on species and habitats can be avoided, minimized, or mitigated, and positive affects are supported and enhanced. Review and evaluation of land use actions, active liaison with other parties that have authorities and roles in those actions, formulation of strategies to minimize negative impacts, and active negotiation to assure implementation of those strategies are key action items of the Department. Support of these functions by the Office of the Director is necessary for their successful implementation, and Performance Appraisals of program personnel are the key Department measure of the success of the program. The Performance Appraisals include items that the Office of the Director uses to describe and reflect program effectiveness with other agencies, based on their awareness of our relationship and positive communication with those agencies. These include Performance Standards #1 (policies, procedures, and planning), #3 (teamwork), #5 (quantity), #7 (communication), and #11 (program organization and output). An average rating of “meets expectations” or “exceeds expectations” for the three professional positions within Habitat Protection Program will indicate satisfactory performance in addressing the Primary Functions of the program. Since FY 02, the three professional positions have consistently had a score of 100 percent - where all categories met or exceeded expectations. What we propose to improve performance in the next two years: • The Habitat Protection program will need to expand if it is to adequately continue its
current function. Energy development is currently the major land use impact for fish and wildlife in Wyoming, is increasing at an unprecedented rate, and is expected to continue at a high rate for at least the next 20 years. Additional personnel will be necessary to adequately evaluate the numerous energy-related plans that will be

68
prepared in the near future, provide meaningful input to lead agencies, and formulate and negotiate development plans that minimize impacts to fish and wildlife.
Data development agenda: The Office of the Director’s evaluation of the effectiveness of the program’s input into land use actions through the use of Performance Standards in Performance Appraisals is necessarily qualitative, as the influence of our input on eventual management decisions is very difficult to quantify. However, the need does exist for a more definitive feedback on the value and effectiveness of our input to other parties in influencing land use decisions regarding fish and wildlife habitat. This would allow the Department to focus on and provide the most effective input. Performance Measure #2: Percent of employees satisfied with program’s process to make assignments, obtain comments and recommendations, and provide feedback/assistance
0
20
40
60
80
% E
mpl
oyee
s Sa
tisfie
d
FY 03 FY 04 FY 05 FY 06 FY 07
Story behind the performance: The ability to adequately conserve fish and wildlife for the citizens of Wyoming requires input on many land use actions from a number of Department personnel throughout the state. The process of effectively and efficiently disseminating information about land use actions, gathering and collating input, and providing Department recommendations regarding the fish and wildlife resources requires a streamlined and effective system of communication among Department personnel. The effectiveness of this system is best determined by the people who work with it. Thus, the Department’s Internal Survey is used as a measure of that effectiveness. Distributed annually to permanent personnel, the Internal Client Satisfaction survey provides the opportunity for employees to measure the overall performance of 14 Department programs. Specific to the Habitat Protection program, Question #4 in the Internal Survey, “How satisfied were you with the process that the Habitat Protection Program staff uses to make assignments, obtain comments and recommendations, and provide feedback/assistance?” is a direct measure of the satisfaction and workability of program process within the Department. Since FY 03, an average of 69.6 percent of Department employees who had interacted with the Habitat Protection program and responded to the question were satisfied with program’s process to make assignments, obtain comments and recommendations, and provide feedback/assistance. Among all five years, the percentage was lowest in FY 07.

69
The reason for this decline in employee satisfaction is likely due to additional work loads associated with the federal planning process, especially the federal energy planning process. Based on information previously not required and not seen prior to the current energy boom, additional work has been delegated to Department personnel - many of whom are already taxed in their duties. In FY 07, 54.5 percent of Department employees that had interacted with the Habitat Protection program and responded to the question were satisfied with program’s process. What we propose to improve performance in the next two years: • Continue using the Internal Survey to gauge the level of satisfaction among
Department personnel with our current process of providing input into land use actions.
• Encourage additional comments from field personnel and staff in the Internal Survey to improve feedback and effectiveness of the Internal Survey information.
Program: Information Division: Services Mission: Disseminate information to promote public understanding and support for wildlife, wildlife habitat, wildlife conservation and the Department’s management programs. Program Facts: The Information program is made up of three major sub-programs, listed below with number of staff and 2007 (FY 07) budget: Sub-programs #FTEs* 2007 Annual Budget
Information 5.0 $ 212,644 Publications 4.0 426,818 Mailroom 1.0 645,926
TOTAL 10.0 $ 1,285,388
* Includes permanent positions authorized in FY 07 budget. Any positions added during the budget cycle require Wyoming Game and Fish Commission authorization or must be funded from supplemental grants. To improve efficiency, this program was created in FY 06. The Information program includes the following sub-programs: Information (formerly Customer Service), Publications, and Mailroom (formerly its own program). This program is located in the Department Headquarters Office in Cheyenne.

70
Primary Functions of the Information Program: • Disseminate information to promote public understanding and support for
wildlife, wildlife habitat, and wildlife conservation through audio, video, print and other media, and personal contact with constituents. These efforts to provide wildlife-related information facilitate the development of informed support for Department programs.
• Encourage involvement and cooperation of the Department’s management programs through proactive outreach strategies, including three external publications that encourage interest in wildlife and wildlife habitat and provide information on current Department management practices. These publications, provided consistently throughout the fiscal year, facilitate the development of informed support for Department programs.
• Serve people by providing wildlife, hunting and fishing related information through the news media.
Performance Measure #1: Number of radio news, television news, public service announcements and print news releases produced
300
310
320
330
340
350
360
370
380
# of
New
s/Pu
blic
Ser
vice
A
nnou
ncem
ents
Pro
duce
d
2002 2003 2004 2005 2006
Calendar Year
Story behind the performance: The Information program produces and distributes weekly print, radio and television news. The weekly radio program includes a 10 minute, 3 minute and 30 second program. Radio stories are produced in digital format and available for download via the Department Web site. Currently, approximately 17 radio stations around the state utilize the program, reaching an audience of more than 100,000 each week. Weekly television news programs air on two Wyoming and one Nebraska network and cable stations, reaching an audience of more than 150,000 weekly. Video public service announcements air on approximately nine Wyoming and two out-of-state stations. The video editing system was upgraded this fiscal year. The new system is offers a high-definition format, as well as the capability to generate on-screen graphics and burn DVD copies of news and video features. The new system should improve production quality and distribution methods.

71
Print news release packets are prepared and distributed weekly via an e-mail distribution list and traditional mail to each of Wyoming’s 43 local newspapers, representing 175,000 Wyoming households. The packet is also distributed to the Associated Press, radio stations and participating license vendors. The packet can be viewed on the Department’s Web site. The average information dissemination for the last six years is 341 individual print, radio or television news releases or public service announcements distributed. In 2006, the number of news and public service announcements distributed was 364. This number decreased by about 16 news announcements from 2005. The number of news releases distributed will fluctuate depending on the issues and challenges the Department faces each year. For example, because of personnel changes affecting work units such as Regional I&E and Conservation Education, Information personnel were often called upon to assist with projects and efforts other than disseminating information. We have also seen an increase in the number of news releases distributed by the Regional I&E specialists at a more regional level, making issuing those same news releases statewide unnecessary. While the Information work unit distributes a great deal of the Department’s news and information, it is not the only work unit or division developing news. One challenge is to coordinate our public outreach efforts, to ensure the Department maintains a consistent position on issues and covers all issues efficiently. Additionally, the audio/visual news of the Department is distributed by two FTEs. Because of their schedules and need to disseminate news on a weekly basis, it is often hard to schedule field time to cover projects or accumulate stock footage. Some of the key issues and events addressed through news, radio and television stories in 2006 included energy development and wildlife, wildlife habitat, and sensitive species. What we propose to improve performance in the next two years: • Identify regional television stations with Wyoming audiences and evaluate
opportunities for producing additional television news stories of interest to these stations to expand audience size and locations reached.
• Continue efforts in strategic media planning to identify the most efficient use of staff, resources and medium to disseminate information to the external public.
• Expand video feature production to provide Game and Fish news and feature videos in a web-based format. This will allow us to increase the reach of our video news programs, as well as provide a low-cost method to distribute our shorter feature length videos.

72
Performance Measure #2: Paid subscriptions of Wyoming Wildlife magazine and Wyoming Wildlife News
30,000
31,000
32,000
33,000
34,000
35,000
36,000
37,000
38,000
Ann
ual P
aid
Subs
crip
tions
2002 2003 2004 2005 2006
Calendar Year
Story behind the performance: The Publications sub-program produces two regular publications, Wyoming Wildlife magazine a monthly, 4-color publication; and Wyoming Wildlife News, a semi-monthly tabloid newspaper. Current readership for the magazine is more than 30,000 and distribution of the News is approximately 30,000 per issue, including a high of 1,582 paid subscribers. Both publications are tools used by the Department to raise awareness of Departmental and wildlife news and issues. The Wyoming Wildlife News target audience is sportsmen and women and other outdoor enthusiasts. The focus of the News is hunting, fishing and trapping information, along with sections on fish and wildlife management. The News is distributed free of charge at Game and Fish offices, license selling agents and other vendors across Wyoming, and also through subscriptions. The Wyoming Wildlife magazine target audience is largely wildlife advocates and enthusiasts who may or may not be active hunters or anglers. The magazine offers lengthier feature articles than the News or our weekly news releases to provide a more in-depth analysis of wildlife species, habitat or issues. These two publications are the only Department public relations tools that defray much of their own cost. New subscribers ensure the Department’s messages are being communicated to as large and as wide a base as possible and maximize the efficiency of publication production. In 2006, a subscription card was included in each issue of Wyoming Wildlife magazine to help recruit new subscriptions and retain existing subscribers. While subscribers to the magazine renew at a very high rate, there is still a slow loss of long-term subscribers. Including a subscription renewal card in the magazine allows for an easy method of renewal for subscribers.

73
The average for both the newspaper and the magazine over the last five years is 36,000 paid subscriptions per year. Subscriptions for 2006 were slightly below average at 35,569. Subscriptions for Wyoming Wildlife magazine increased in 2006, with an average circulation of 31,962, slightly above the total last year of 31,000, but subscriptions to Wyoming Wildlife News have fallen slightly. Because of a lack of funding, no research has been conducted on subscription renewal rates or potential subscriber interest, making it difficult to pinpoint the reasons for varied subscription rates from year to year. The Publications Section relies on freelance articles and photographs for the Wyoming Wildlife Magazine and Wyoming Wildlife News, resulting in increased costs related to purchasing articles and photos, and an out-of-date photo file. Additionally, there is a need for additional funds for a survey tool to understand readers’ desires and opinions, and marketing funds to increase circulation. What we propose to improve performance in the next two years: • Given adequate funding, implement a readership survey to assess current subscriber
satisfaction and demographics of both Wyoming Wildlife magazine and Wyoming Wildlife News. This will provide the Department with baseline data on our readership and give hard data to determine how adjusting the focus, content, delivery or price of either publication will affect current readership.
• Given adequate funding, implement a direct mail campaign to add new subscribers to Wyoming Wildlife News and Wyoming Wildlife magazine. A direct mail campaign would increase the visibility of both publications among potential subscriber audiences and attract new and different audiences to the publications.
• Given adequate funding, secure digital film equipment for the editors of both Wyoming Wildlife News and Wyoming Wildlife magazine. Shooting supporting photos in a digital format would save staff time be eliminating the need to scan prints manually for inclusion in the publications, and would reduce budget expenditures on film, film processing and print reproduction.
• Cross-promote all publications to increase visibility and expand potential subscriber base. Articles, photographs and teasers for both publications will appear in the monthly E-Newsletter. Wherever possible, print and radio news releases should include mention of Wyoming Wildlife magazine and Wyoming Wildlife News.
• Create and maintain a web presence of both publications. With the E-newsletter receiving more than 1,300 subscribers through its first four months of publication, it appears a significant number of the Department’s constituents visit the Web site and gather information electronically. A web presence would further increase visibility of the magazine and expand the potential subscriber base.

74
Performance Measure #3: Percent of employees satisfied with mailroom services provided
Story behind the performance: Mailroom personnel are responsible for handling approximately 1.2 million pieces of incoming and outgoing mail each year. This includes thousands of UPS packages, priority and express mail. In 2006, more than 95,000 licenses were mailed in just over five working days using three FTEs, resulting in 15 man-days to process the licenses. This mailing of the resident and nonresident deer and antelope licenses and resident elk licenses is the largest annual individual mailing this work unit handles. Mailroom services are provided by one FTE. In FY 07 an additional FTE from the customer service section was trained to serve as backup mailroom support to ensure minimized disruption in services provided and large mailings are accomplished as quickly as possible to provide the highest level of customer satisfaction. Annually, the Internal Client Satisfaction survey is distributed to permanent personnel. The survey provides the opportunity for employees to measure the overall performance of 14 Department programs. Since FY 02, an average of 81 percent of employees that had interacted with Mailroom personnel were satisfied with the services provided. What we propose to improve performance in the next two years: Continue ongoing discussions with Postal Service representatives to improve mail delivery and reduce costs. Currently a committee is discussing methods of tracking packages by the USPS as a more cost-effective alternative to shipping via Fed-Ex or UPS. Appendix A. New proposed performance measures: Currently, both publications are produced and managed by three FTEs. Because of limited staff and resources, the magazine is often delayed in production, sometimes for as many as three weeks. Beginning July 2006, the mail date for magazine subscribers was collected and may become a future performance measure.
0
20
40
60
80
100
% E
mpl
oyee
s Sa
tisfie
d
FY 03 FY 04 FY 05 FY 06 FY 07

75
With the creation of the e-newsletter, the Department has an additional information tool to disseminate information. Subscription rates for the e-newsletter are easily tracked, and should serve as a future outcome measure for the Information sub-program. At the end of FY 06, the e-newsletter had 1,682 subscribers, and at the end of FY 07, the e-newsletter had 3,005 subscribers Program: Information Technology Division: Services Mission: Provide high quality, secure technology solutions, services and support to the Wyoming Game and Fish Department and external constituents to allow for sound fiscal and management decisions. Program Facts: The Information Technology program is made up of one major sub-program, listed below with number of staff and 2007 (FY 07) budget: Sub-program # FTEs* 2007 Annual Budget
Information Technology 18.0 $ 2,000,254 * Includes permanent, contract and temporary positions authorized in FY 07 budget. Any positions added during the budget cycle require Wyoming Game and Fish Commission authorization or must be funded from supplemental grants. Payroll for two of these FTE and two AWEC positions is currently funded out of the 2F15 Electronic License System budget, however we anticipate that once this application has been developed and goes into a maintenance mode, funding for these positions will be included in the FY 10 IT budget. The Information Technology program was previously referred to as the Information Technology Systems (Strategic Plan FY 04-FY 07, November 2003). In addition, the Information Technology sub-program was previously referred to as the Management Information Services sub-program. The current program is made up of administration and three sections: Application Development, Operations and Support, and Geographic Information Systems. This program is located in the Department Headquarters Office in Cheyenne. Primary Functions of the Information Technology Program: • Provide high quality, secure technology solutions to the Department that support
the overall mission and empower personnel to achieve completion of their workload through the use of technology in a successful, efficient, timely and cost effective manner.
• Provide services and support to ensure data integrity and security.

76
• Provide support to external constituents by providing and supporting an Internet hardware and software framework to facilitate better Department communication with our constituents and to provide a means for dynamic interaction between the Department and the general public.
• Facilitate sound fiscal decisions by evaluating technology to identify the best solution to a given problem, challenge, or situation and leverage Information Technology network architecture, hardware and software to identify opportunities for cost savings.
• Facilitate sound management decisions by developing and maintaining Department data standards and applications to support Department-wide centralization of data; identifying and developing technical options for resolving application or system problems; researching new technology and making recommendations on the adoption of new methods or the acquisition of new technical hardware and software tools to improve agency operations; and monitoring emerging technologies to effectively evaluate opportunities to improve current agency operations by incorporating or migrating to viable new hardware, software, and technology implementations.
Performance Measure #1: Percent of employees satisfied with IT/GIS program
Level of courteousness and professionalism:
0
20
40
60
80
100
% E
mpl
oyee
s Sa
tisfie
d
FY 03 FY 04 FY 05 FY 06 FY 07

77
Level of attention and timeliness:
0
20
40
60
80
100
% E
mpl
oyee
s Sa
tisfie
d
FY 03 FY 04 FY 05 FY 06 FY 07
Quality of services:
0
20
40
60
80
100
% E
mpl
oyee
s Sa
tisfie
d
FY 03 FY 04 FY 05 FY 06 FY 07
Story behind the performance: Since the mid-1970s, the Department has utilized both computers and associated electronic information systems and networks to facilitate the efficient exchange of information both among employees and between employees and outside entities. Originally, specific computer expertise was not necessary and many technically savvy Department personnel wrote their own computer applications. Since that time, computers and computerized equipment have been used to expand and enhance the volume and variety of tasks that can be performed by individual employees and/or groups of employees. As this capacity has grown and permeated every facet of the Department’s operations, a broad array of responsibilities has developed that must be addressed at every level of the Department’s hierarchy.

78
In 1996, the Geographic Information Systems (GIS) Section was organizationally combined with Information Technology (IT) to form what is now called the IT/GIS Branch. Then in early 2004, due to the increased workload, an increasingly clear division of labor, and statewide IT Governance initiatives, the IT portion of this branch was split into two distinct sections with a separate supervisor over each. With this change, the IT/GIS Branch is now made up of three separate subsections (Operations and Support, Application Development, and GIS), in addition to branch administration. These subsections are responsible for managing 25 servers and 500 personal computers located in the headquarters office and eight regional offices throughout Wyoming; developing and supporting 45 mission critical applications; and maintaining approximately 50 layers of statewide GIS data and associated GIS applications. They are also responsible for procurement and support of a wide range of peripheral devices ranging from printers to digital cameras, GPS units and all related software. To make effective technology strategy recommendations, IT/GIS personnel must maintain a thorough understanding of the Department’s goals, objectives, and methods by which the Department’s various programs intend to reach these. Continual changes to the environment in which the applications operate (interfaces to other applications, changes to hardware, software, and operating systems; new data from users) requires a dedicated team of informed operations specialists, application developers, and GIS analysts working cooperatively to maintain and improve these systems. System and service failures can rapidly impact large numbers of customers, suppliers, and internal staff. Network outages, server failures, e-mail downtime, and broken desktop computers can significantly reduce the productivity of the entire Department. Thus, reduced or failed service of even one day can influence employee perception of the IT/GIS program, especially if this occurs during critical work periods. Conversely, when the operations team is executing effectively and achieving the most success, it is invisible since the technology is performing as employees expect. An example of this was seen in July of 2004 and July of 2005 when serving up Big Game License Draw results via our Internet Website. While systems had been running seamlessly throughout the years, they were not able to handle a significant increase in traffic generated by hunters and outfitters looking for draw results. This contributed to an overload of phone calls to the Department Telephone Information Center, resulting in unsatisfied internal and external customers. Since that time, IT personnel conducted extensive research, testing and revamping of our systems and telecommunications lines in order to make this application stable for 2006. This work, along with rewriting the License Draw Results Application using Microsoft .NET technologies, has significantly enhanced the performance of this system, resulting in significant application up time especially during critical big game license application periods. This improved customer satisfaction and has illustrated that the entire Department Internet site needs to be rewritten in the same technologies to permanently resolve this issue.

79
In addition to this work, the Application Development section developed an On-Line Application System for the resident and non-resident big game license drawings. We received 68,599 applications, resulting in $17,477,469 taken in through this system from the time it went on-line on January 1 through June 30, 2007. IT/GIS Branch personnel face another challenge with integrating and centralizing many Department computer applications, specifically related to keeping them running. This challenge came with a large number of applications originally developed by Department employees and ultimately integrated into a centralized system. Several employees still want to retain the ability to make changes to these applications, many of which have caused the applications to fail and warranted someone within IT/GIS to troubleshoot and fix the problems. Not only has this reduced customer satisfaction with applications not working, but these situations take a considerable amount of IT support time that could be put towards helping to improve customer satisfaction by developing new applications. In addition to system failures, the IT help desk and IT governance (the rules and regulations under which an IT department functions and a mechanism put in place to ensure compliance with those rules and regulations) are large drivers of internal customer satisfaction. The help desk interacts with Department personnel on a constant basis and there are few, if any other entities within the Department that regularly interact with and impact virtually every employee daily. Response time, courtesy of the representative, level of follow-up/follow-through, and resolution speed are all factors that drive customer satisfaction. Similar to service failure, a single mistake by IT/GIS personnel can impact the reputation of the entire program because of the potential actual and perceived ramifications of the error. Several other areas that affect the user base include user administration, capacity planning, disaster recovery, and security. When looking at the IT Operations Section, which houses the IT help desk, 90.0 percent of the respondents indicated satisfaction with services provided, up from 83.4 percent in the previous year. We added two At-Will employees to our help desk staff during the last fiscal year in preparation to support the forthcoming Electronic License System. In addition, we added a help desk call tracking software package to better track and address help desk calls. These two changes to our IT help desk, along with more concentration on customer service, have resulted in much more timely responses to help desk calls and improved the capability of the team to correct problems and minimize potential for recurrence, which in turn has led to a significant increase in internal customer satisfaction. Regarding the IT governance aspect, during the 2002 budget session the Wyoming Legislature created a state Chief Information Officer position and we began to see significant affects to the Department beginning in 2003. With this position came a statewide Information Technology Governance Structure, which began implementation of centralized common IT services throughout state government and included technology procurement. This process has also required a significant amount of effort and time

80
commitment, especially for the Department IT Manager, which in turn has reduced time available to address Department specific IT issues. This, along with agency conformance to the statewide governance structure and accompanying changes in IT policy and technology procurement methods (initially driven by this initiative) has undoubtedly had a negative impact on Department employee satisfaction in quality of services in previous years. We anticipate that this will continue to require a large amount of time in order to ensure that Department interests are considered throughout the IT Governance Structure. Another factor that has affected customer satisfaction since early 2003 is an Electronic Licensing System we are working to develop in conjunction with Fiscal Division and an outside contractor. Aside from mission critical applications, this project is the number one priority for the IT subsections within our branch. Due to the time and effort dedicated to this project, many other Department projects have been placed on hold until this work is completed and undoubtedly this has had an affect on internal customer satisfaction. A similar effort driving customer satisfaction can be seen in the centralization and reduced fragmentation of GIS work throughout the Department. We have seen some negative reactions towards this initiative, specifically with resistance to centralizing GIS data and applications. This may be due to some individuals who originally developed data feeling a loss of control of that data. The GIS working group was created to help address agency-wide GIS consolidation and has already seen successes with recent budget approval to begin building the framework for this project. At the same time, Department-wide demand for GIS work has risen significantly over the past year. Examples of these demands include mapping of elk feedgrounds based on formal legal descriptions researched from Department records and organized using aerial photography as backdrops, and committee assignments such as the Wyoming Landscape Conservation Initiative's Data Committee (WLCI). We anticipate that as more efforts are initiated to address concerns associated with species and their habitats (WLCI, sage-grouse implementation recommendations, CWCS implementation, etc.), all of which base data needs, analyses and products on GIS technologies, such impacts will only increase. With these additional Department priorities, our ability to address projects and activities planned at an earlier date will be delayed as priorities are reevaluated, thus customer perceptions of our service in this area will undoubtedly decline. Annually, the Internal Client Satisfaction survey is distributed to permanent personnel. The survey provides the opportunity for employees to measure the overall performance of 14 Department programs. Since FY 03, the average percent of employees satisfied with the level of IT/GIS’s courteousness and professionalism was 87.4 percent, the level of satisfaction with attention and timeliness was 77.7 percent, and satisfaction with quality of services provided was 77.0 percent. In FY 07, the level of satisfaction for courteousness and professionalism was 91.3 percent, 88.1 percent for attention and timeliness, and 86.2 percent for quality of services provided.

81
We expect that splitting the IT portion of this branch into two distinct subsections was a primary cause for the increase in employee satisfaction beginning in 2004 and reflected in the FY 05 survey results. By implementing this organizational change, we have spread out the day-to-day administrative workload and subsection supervisors now oversee the routine efforts within their work units. This has enhanced our ability to regularly address user requirements and allowed more time for branch evaluation, communications, planning, administration, and focus on customer service throughout the IT/GIS Branch, thus helping us to provide better service to our customers and increase employee satisfaction. What we propose to do to improve performance in the next two years: • Continue refinement of our problem tracking system to further identify trends in an
effort to increase the capability of the team to correct problems and minimize potential for recurrence, thereby lowering overall IT support costs in the future. We have now implemented this in the IT/GIS Branch and plan to gradually expand the use of this software to other entities throughout the Department. Our ability to accomplish this expansion will be largely dependent on time allocated to bringing up the new ELS Internet Point-of-Sale system, which has been given our number one priority.
• Define and document the application architecture (the description of all software applications and how they interface with each other) in order to prioritize applications, maintenance and development on a Department-wide basis.
• Rewrite the Department Internet site in Microsoft .NET technologies to permanently improve performance, especially during critical use times.
• Continue to prioritize the GIS workload and work closely with Services Division and Department Administration to find ways to address the increasing demand for GIS technologies.
• Promote information sharing across the Department and other state agencies by actively working with personnel to integrate and centralize their applications and data. We have been centralizing databases into our SQL database server on a continual basis and we plan to continue this work as a part of our promotion and facilitation of agency-wide data sharing.
• Because communication is possibly the single most important task we can do to affect the perception of performance, we will proactively engage in public relations efforts to highlight our successes and ensure that our efforts are recognized by Department personnel. This will include compiling a packet of technology related information specifically pertinent to new employees (IT/GIS Branch structure, policies, procurement process, how-to’s, a description for help information that is available on the Intranet) that they should find helpful when beginning employment.
• Continue participation in the statewide IT Governance process to ensure that the Department interests are considered throughout the IT Governance development. This will help ensure that mandates that may negatively impact Department employee work are kept to a minimum, thus helping to improve internal satisfaction.
• Utilize administrative assistants more regularly and where appropriate to assist us with paperwork and documentation.

82
• Use the comments section of the annual survey to glean specific information on areas of concern to the Department and act on them accordingly. Depending on the level of action taken, make employees aware of our recognition of the problem/concern and actions taken.
Data development agenda: In the past, we have based measurement of our progress towards strategic plan objectives solely on the annual employee internal satisfaction survey. While this input still provides valuable information, as serving internal constituents remains a high priority of the IT Branch, it fails to describe how the IT/GIS Branch is satisfying the overall technology requirements of the Department and constituents in order to accomplish the Department’s mission. With additional functions for which this branch is now responsible, it may be reasonable to use additional metrics and possibly separate and track performance by subsection to determine how each subsection is doing in relation to our strategic plan goals. Examples include measuring response time, reaction to help desk/trouble tickets, and employee assistance measures. In addition, starting with the 2006 Internal Customer Service Survey, the questions relating to the IT/GIS Branch have been separated out to distinguish satisfaction level with specific subsections of the Branch. We believe that this change to the format of the survey will allow for a greater understanding of subsection strengths and weaknesses, facilitating the ability to make improvements where deemed feasible and necessary. Performance Measure #2: Percent of employees satisfied with computer equipment
0
20
40
60
80
% E
mpl
oyee
s Sa
tisfie
d
FY 03 FY 04 FY 05 FY 06 FY 07
Story behind the performance:
Initially driven by the statewide Information Technology Governance Structure, the Department centralized technology budgeting and procurement in October of 2003. Prior to this, Department employees were at liberty to purchase any technology item (under $500) without any kind of oversight. While this change in policy may be considered an inconvenience to individuals within the Department, the ongoing purpose of a centralized technology budget has been to allow administration the ability to oversee the direction of

83
technology throughout the agency and to manage technology expenditures, which have increased significantly over the past several years. Over time, technology has evolved and become increasingly more complex. The practice of gathering and storing data on local PCs and networks has also changed with the need for sharing of programs and data across the entire Department. While Department personnel have become accustomed to purchasing the technology they deemed necessary to accomplish their work, technical support of these various technologies has become overwhelming for the limited number of support personnel in the IT Branch, thus a need for standardization has become essential for all technologies throughout the Department. To address these issues, the Information Technology Oversight Committee was created early in 2000. This working group is made up of one Deputy Director, Assistant Division Chiefs and the Information Technology Manager, who meet quarterly to approve Department technology purchases and make decisions regarding the direction of technologies. We have found that technology procurement greatly influences internal customer satisfaction. Since FY 03, the average percent of employees satisfied with the computer equipment provided was 70.1 percent. In FY 07, based on the number of people that responded to the specific question, the level of satisfaction was 67.3 percent, which is up slightly from the lowest figure since FY 02 of 63.6 percent last year. As seen in the graph above, employee satisfaction with available computer equipment began decreasing in 2003. We believe there are two main reasons for this decline. During the 2002 Budget Session, the Wyoming Legislature created a state Chief Information Officer position and we began to see significant affects to the Department beginning in 2003. With this position came a statewide Information Technology Governance Structure, which began implementation of centralized common IT services throughout state government and included technology procurement. This process has also required a significant amount of effort and time commitment, especially for the Department IT Manager, which in turn has reduced time available to address Department specific IT issues. This, along with agency conformance to the statewide governance structure and accompanying changes in IT policy and technology procurement methods has undoubtedly had a negative impact on Department employee satisfaction related to computer equipment. The IT Manager, along with Services Division Administration and IT/GIS Branch personnel has taken a proactive approach to further educate Department personnel on the technology budgeting and procurement process, which we believe is responsible for the upward trend in this metric during FY 07. What we propose to do to improve performance in the next two years: • Help guide agency IT investment priorities by continuing to work with the IT
Oversight Committee on the direction of technologies and accompanying budget. • Continue to communicate with Department employees through individual
discussions, regular attendance at regional team meetings, and various other avenues to keep abreast of employee technology needs, as well as work to help them

84
understand technology procurement methodologies and procedures. Through better communication, we hope to improve overall employee satisfaction related to equipment needed to do their work.
• Continue working with the Department GIS working group, which consists of representatives from Services, Fish and Wildlife Divisions to compile recommendations by which Department administration can address increasing future GIS demands. This group developed an initial plan to begin eliminating fragmentation of GIS work during the past year. We have budget approval to purchase servers, software and licenses to begin implementation of this plan.
• Continue to prioritize the GIS workload and work closely with Services Division and Department Administration to find ways to address the increasing demand for GIS technologies.
• Continue to evaluate, purchase and implement improvements to the Department network infrastructure to facilitate better Department internal communication and to provide a means for dynamic interaction between the Department and the general public.
Program: Legislatively Mandated Expenses Division: Fiscal Division Mission: Ensure funding availability and statutory compliance on those programs that the Department is required to earmark funds to meet Wyoming statutory provisions. Program Facts: The Legislatively Mandated Expenses program is listed below with the FY 07 budget: Sub-programs #FTE’s 2007 Annual Budget Damage Claims 0 $ 500,000 Landowner Coupons 0 535,000 Cost Allocation 0 700,000 Retiree Assessment 0 90,444 Salec 0 252,000 TOTAL $ 2,077,444 This program is administered in the Department Headquarters Office in Cheyenne. Primary Function of the Legislatively Mandated Expenses Program: • Ensure funding availability and statutory compliance by establishing and
monitoring specific budgets and processing all payments that are required for these programs in accordance with Wyoming state statutory and/or regulatory requirements.

85
Performance Measurement #1: Commission approved budget is sufficient to meet annual payments
0
500
1000
1500
2000
2500
(thou
sand
s)
FY 03 FY 04 FY 05 FY 06 FY 07
Legislatively Mandated Costs
Budget
Payments
Story behind the performance: During the past five years, these costs have escalated approximately 22 percent, from $1.4 million in FY 03 to $1.7 million in FY 07, which is more than the rate of inflation, and accordingly, the Department has had to increase that portion of its overall budget to accommodate these increases. These payments are non-discretionary as the payment amounts are either set by legislation, regulation or are pass-through costs of other state agencies. However, in FY 07, while costs for landowner coupons increased beyond original estimates, there was a decrease in cost allocation for the first time in four years. What we propose to improve performance in the next two years: The Department, based on concurrence of the Governor and Legislature in the 2007 Legislative session requested and received a moratorium on paying cost allocation for FY 08-FY 10, which will allow the Department to use those savings on projects that benefit wildlife enthusiasts, rather than on administrative overhead. Program: Personnel Management Division: Office of the Director Mission: Institute and administer policies, procedures and programs that facilitate recruitment and retention of effective and productive employees to meet the needs of the Commission, Department and Citizens of Wyoming. Program Facts: The Personnel Management program is made up of one sub-program, listed below with number of staff and 2007 (FY 07) budget: Sub-program # FTEs* 2007 Annual Budget
Personnel Management 3.5 $202,127 * Includes permanent and contract positions authorized in FY 07 budget. Any positions added during the budget cycle require Wyoming Game and Fish Commission authorization or must be funded from supplemental grants.

86
This program is located in the Department Headquarters Office in Cheyenne. Primary Functions of the Personnel Management Program: • Facilitate recruitment and retention of effective and productive employees,
Personnel Management conducts recruitment activities, training, compensation analysis, benefit administration, payroll services, discipline guidance, performance appraisal training, rule and law advice and general counsel to employees and administrators of the Department.
• Develop and maintain effective and productive employees through recommendation and implementation of policies, procedures, programs and practices developed with employee and managerial input.
Performance Measure #1: Percent of employees satisfied with level of courteousness and professionalism
0
20
40
60
80
100
% E
mpl
oyee
s Sa
tisfie
d
FY 03 FY 04 FY 05 FY 06 FY 07
Story behind the performance: Annually, the Internal Client Satisfaction survey is distributed to permanent personnel. The survey provides the opportunity for employees to measure the overall performance of 14 Department programs. In many respects, the ability of the Department to provide services to the external clients depends on the ability of employees to satisfy the needs of their internal clients. A total of 91.8 percent of all permanent employees who were surveyed and responded, indicated they had interacted with Personnel Management staff. Internal constituent satisfaction with the courteous and professional treatment they received from the Personnel Management Program is one of the highest in the Department. Since FY 03, an average of 95.9 percent of Department employees that had interacted with the Personnel Management staff were satisfied with the level of courteousness and professionalism. For FY 06 95.7 percent of all respondents indicated they had been treated courteously and professionally. Personnel Management’s mission to recruit and retain effective and productive employees can only be met if employees and administrators feel valued and respected. Providing professional courteous treatment is a critical factor in conveying value and

87
respect to the individual employee and is believed to weigh heavily in overall employee effectiveness and productivity. What we propose to improve performance in the next two years: • Continue to monitor internal constituent satisfaction in the area of courteous and
professional treatment to determine how improved communication and education efforts impact this measurement.
• The impending retirement of the Human Resource Officer will provide the opportunity to review the form and function of the Personnel Management section. Sweeping changes in the statewide administration of human resource functions will necessitate a review and realignment of duties and responsibilities.
Performance Measure #2: Percent of employees satisfied with level of attention and timeliness provided
0
20
40
60
80
100
% E
mpl
oyee
Sat
isfa
ctio
n
FY 03 FY 04 FY 05 FY 06 FY 07
Story behind the performance: A total of 91.8 percent of all permanent employees who were surveyed and responded, indicated they had interacted with Personnel Management staff. Internal constituent satisfaction with the level of attention and timeliness they received from the Personnel Management Program is one of the highest in the Department. Since FY 03, an average of 94.1 percent of Department employees that had interacted with the Personnel Management staff were satisfied. For FY 07, 96.7 percent of all respondents indicated they were satisfied with the level of attention and timeliness. An effective and productive workforce relies on timely receipt of information and responses to questions in keeping with the self-prescribed expectations in their work behaviors. Employees who, through experience, develop a confidence in the attention and timeliness they can expect from Personnel Management significant positive impacts result in the employee’s productivity and effectiveness. What we propose to improve performance in the next two years: • Continue to monitor levels of internal constituent satisfaction with the attention and
timeliness they received in regard to their contacts with Personnel Management staff.

88
• Increased uses of web based technology to deliver Personnel Management products and information will be pursued. This will be specific to the areas of vacancy recruitment announcements, training and applicant selection.
• Expanded uses of technology within the Personnel Management work unit will be implemented to better provide timely delivery of information and services to employees and administrators.
Performance Measure #3: Percent of employees satisfied with services provided
0
20
40
60
80
100
% E
mpl
oyee
s Sa
tisfie
d
FY 03 FY 04 FY 05 FY 06 FY 07
Story behind the performance: A total of 91.8 percent of all permanent employees who were surveyed and responded indicated they had interacted with Personnel Management staff. Internal constituent satisfaction with the services they received from the Personnel Management Program in FY 07 was 95.7 percent. Since FY 03, an average of 93.4 percent of Department employees who had interacted with the Personnel Management staff were satisfied with the services provided. What we propose to improve performance in the next two years: • Continue to monitor levels of internal constituent satisfaction with the services they
receive from the Personnel Management Staff to insure, at a minimum, the current high level of satisfaction with service delivery.
• Improvements in the use of technology for delivery of services will be implemented in the next two years. This includes videoconference training for a number of subjects that are required such as defense driving, supervisor performance appraisal training and sexual harassment prevention. Reduced travel time and ease of attendance for employees will be achieved through this improvement.
• Human Resource Manager will attend various Department employee meetings to obtain direct feedback on service delivered by the Personnel Management work unit.

89
Program: Property Rights (Lands) Management Division: Services/Wildlife Mission: To administer and monitor currently owned Wyoming Game and Fish Commission property rights. To acquire property rights to restore and conserve habitat to enhance and sustain wildlife populations now and in the future. To acquire property rights, provide public access and public recreation, such as hunting and fishing access on private and landlocked public land. Program Facts: The Property Rights Management program is made up of two major sub-programs, listed below with number of staff and 2007 (FY 07) budgets. Sub-programs #FTEs* 2007 Annual Budget
Property Rights (Lands) Admin. ** 2.0 $ 362,550 PLPW Access sub-program 7.5 1,121,136 ***
TOTAL 9.5 $ 1,483,686 * Includes permanent, contract and temporary positions authorized in FY 07 budget. Any
positions added during the budget cycle require Wyoming Game and Fish Commission authorization or must be funded from supplemental grants.
** Includes Property Rights Administration and Strategic Habitat Plan. *** Includes personnel, operations and easement payments. Property Rights Administration sub-program is located in Services Division and is based out of the Department Headquarters in Cheyenne. The Private Lands Public Wildlife (PLPW) Access sub-program is located in the Wildlife Division and is based out of the Casper Regional Office. Primary Functions of the Property Rights Management Program: • Administer Commission property rights by providing support and technical
expertise to Staff and Commission members on all real property rights management issues and address requests for assistance and information.
• Administer Commission property rights by providing assurance that all real property rights issues follow state and federal laws, rules, guidelines and policies.
• Monitor Commission property rights by annual physical inspections to evaluate possible encroachments and provide recommendations for Commission action.
• Acquire property rights to restore and conserve habitat by assisting in the implementation of the Strategic Habitat Plan to identify wildlife habitats where habitat quality should be preserved through fee title acquisitions, conservation easements, leases, and agreements; by acquiring public access and public recreations rights, and by seeking funding partners.
• Acquire property rights which provide public access and public recreation by maintaining and enhancing public hunting and fishing access on private and public lands through Hunter Management and Walk-in Areas.
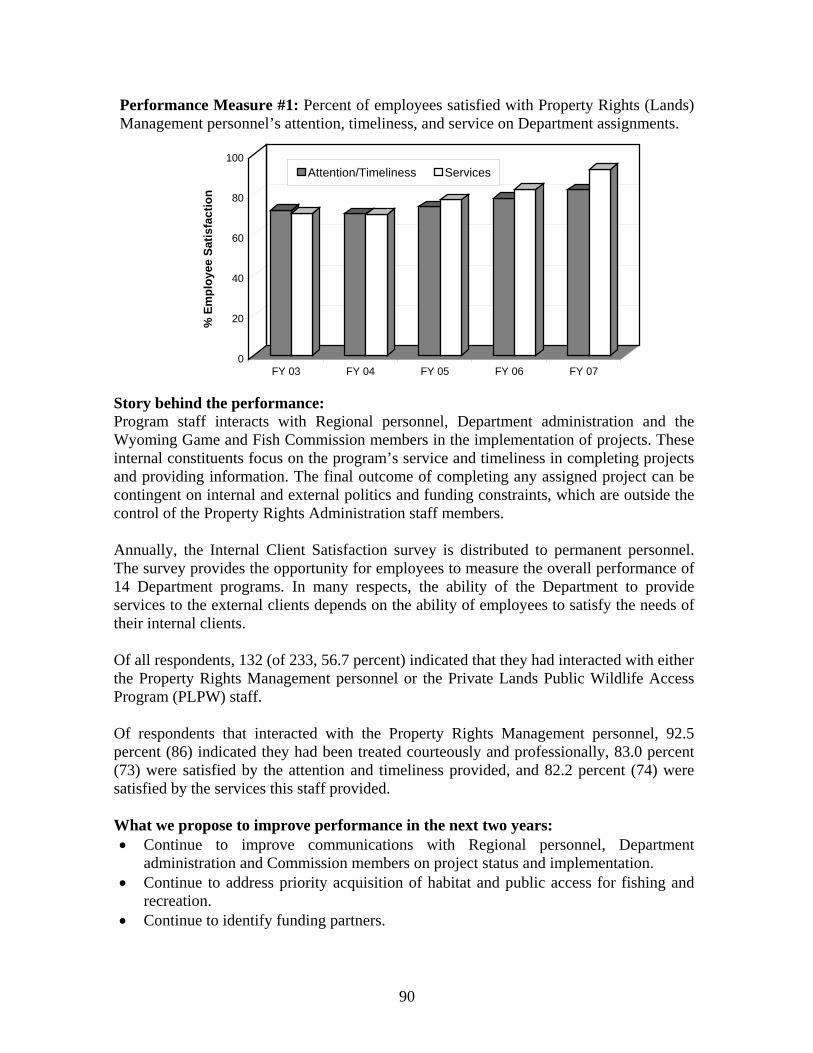
90
Performance Measure #1: Percent of employees satisfied with Property Rights (Lands) Management personnel’s attention, timeliness, and service on Department assignments.
0
20
40
60
80
100
% E
mpl
oyee
Sat
isfa
ctio
n
FY 03 FY 04 FY 05 FY 06 FY 07
Attention/Timeliness Services
Story behind the performance: Program staff interacts with Regional personnel, Department administration and the Wyoming Game and Fish Commission members in the implementation of projects. These internal constituents focus on the program’s service and timeliness in completing projects and providing information. The final outcome of completing any assigned project can be contingent on internal and external politics and funding constraints, which are outside the control of the Property Rights Administration staff members. Annually, the Internal Client Satisfaction survey is distributed to permanent personnel. The survey provides the opportunity for employees to measure the overall performance of 14 Department programs. In many respects, the ability of the Department to provide services to the external clients depends on the ability of employees to satisfy the needs of their internal clients. Of all respondents, 132 (of 233, 56.7 percent) indicated that they had interacted with either the Property Rights Management personnel or the Private Lands Public Wildlife Access Program (PLPW) staff.
Of respondents that interacted with the Property Rights Management personnel, 92.5 percent (86) indicated they had been treated courteously and professionally, 83.0 percent (73) were satisfied by the attention and timeliness provided, and 82.2 percent (74) were satisfied by the services this staff provided. What we propose to improve performance in the next two years: • Continue to improve communications with Regional personnel, Department
administration and Commission members on project status and implementation. • Continue to address priority acquisition of habitat and public access for fishing and
recreation. • Continue to identify funding partners.

91
• Continue real property inspections and monitoring to ensure compliance of permitted use(s) and potential encroachments that may cause loss of control of Commission-owned or administered lands or waters.
Performance Measure #2: Percentage of general public satisfied with the amount of critical habitat acquired in the state and the percentage of general public satisfied with the amount of public and recreation access acquired in the state Amount of Habitat Acquired Amount of Access Acquired
0
10
20
30
40
50
% P
ublic
Sat
isfie
d
FY 03 FY 04 FY 05 FY 06 FY 07
Story behind the performance: The Wyoming Game and Fish Commission owns 165,470 acres and administers another 244,000 acres of federal, state and private lands, which conserve and sustain wildlife populations and provides public access and recreation. In addition, the Game and Fish Commission has acquired permanent public access to over 121 miles of streams and rivers around the state. The performance measures the general public’s attitude for the amount of habitat available for wildlife and the amount of public access in the state. This information is collected in an annual survey that is distributed randomly to residents and nonresidents who purchased hunting and fishing licenses in the previous year. In regards to the amount of habitat acquired since FY 02, an average of 45.1 percent of the sampled public was satisfied. In regards to the amount of access acquired, an average of 44.5 percent of the public was satisfied. Results for FY 07, sampled from license holders, were slightly higher. Given the narrow range in satisfaction levels across the years, it is doubtful that the general public satisfaction will ever be much higher than indicated over the last five years. These consistent results may be due in part to lack of familiarity with the volume of habitat and access that the Property Rights (Lands) Management program acquires every year. What we propose to improve performance in the next two years: • Continue with implementation of the Department’s Strategic Habitat Plan (SHP) by
providing technical expertise to conserve and enhance wildlife habitat through fee title acquisitions, conservation easements, leases, and agreements.
• Continue with implementation of Commission priorities in acquiring public access for fishing and recreation.
• Continue to identify funding partners.

92
• Continue real property inspections and monitoring to ensure compliance of permitted use(s) and potential encroachments that may cause loss of control of Commission-owned or administered lands or waters.
Performance Measure #3: Hunting and fishing access to private and public land
Number of Private Hunting Acres in Hunter Management and Walk-in Areas.
Number of Fishing Acres and Stream Miles in Walk-in Fishing Areas.
0
50
100
150
200
250
300
2002 2003 2004 2005 2006
Calendar Year
Lake Acres Stream miles
Acr
es a
nd M
iles
0100,000200,000300,000400,000500,000600,000700,000800,000900,000
Acr
es
2002 2003 2004 2005 2006
Calendar Year
HMA WIAH

93
Story behind the performance: In 2001, the Wyoming Game and Fish Commission adopted the Private Lands Public Wildlife (PLPW) Access Program as a permanent part of the Department. The PLPW Access sub-program works with Wyoming’s private landowners to maintain and enhance hunter and angler access onto private and landlocked public lands. With the assistance of field biologists and game wardens, the PLPW Access sub-program continues to provide extensive areas to hunt and fish. The enrollment in each program for 2006 are Hunter Management, 810,926 acres; Walk-in Hunting, 563,530 acres; Walk-in Fishing lake acres, 273 acres; and Walk-in Fishing stream miles, 89 miles. The average enrollment in each program for 2002-2006 is Hunter Management, 659,287 acres; Walk-in Hunting, 480,208 acres; Walk-in Fishing lake acres, 224 acres; and Walk-in Fishing stream miles, 83 miles. Enrollment in either a Walk-in or Hunter Management Area is dependent on the amount of available AccessYes funds. During 2007, easement payments almost reached AccessYes donation total collected by the Department. The number of acres and stream miles will remain fairly constant and be dependent on AccessYes funds unless additional funds are not obtained. What has been accomplished: Combined with public lands that were associated with the enrolled private lands, the PLPW Access Program provided around 2.8 million acres of hunting access for the fall 2006/spring 2007 hunting seasons. Fishing opportunities are continually sought out for increased opportunity. What we propose to improve performance in the next two years: • Continue to encourage AccessYes donation from hunters and anglers by working
with License Selling Agents and an advertising program. • Continue to foster cooperative relationships with Department employees for increased
assistance with the program. • Continue to evaluate new funding sources. • Continue to pursue an additional Regional PLPW Access Coordinator to alleviate the
workload on current employees and improve the quality of services offered to Department personnel and the general public.

94
Performance Measure #4: Percent of employees satisfied with PLPW program
0
20
40
60
80
100
% E
mpl
oyee
s Sa
tisfie
d
FY 04 FY 05 FY 06 FY 07
Attention/Timeliness Courteous/Professional Services
Story behind the performance: Annually, the Internal Client Satisfaction survey is distributed to permanent personnel. The survey provides the opportunity for employees to measure the overall performance of 14 Department programs. The success of this program, and thus the ability to provide hunters and anglers with recreational access, is contingent on the cooperation and effectiveness of the Department’s employees. Many employees interact directly with landowners, while others assist the program with the creation of maps. In the 2007 Departmental survey (second in a series of PLPW related surveys), the most common forms of assistance selected by personnel included “Providing assistance/information to hunters and/or anglers regarding Walk-In and/or Hunter Management Areas”, “Monitoring use of Walk-In Areas”, and “Enforcing compliance with wildlife laws and regulations on Walk-In and/or Hunter Management Areas.” Thus, the results from the annual Internal Client Satisfaction survey serve as valuable feedback on the effectiveness of the PLPW program. In FY 07, the percent of employees satisfied with level of attention/timeliness was 85.9 percent, 91.7 percent for courteousness and professionalism, and 89.9 percent for services provided by the PLPW staff. The PLPW Access Program continually strives to increase services provided. What has been accomplished: The high percentage of Department employees that were either somewhat satisfied or very satisfied indicate the effectiveness of the PLPW Access Program staff in interacting with the rest of the Department. The PLPW staff continually strives to work with and assist fellow Department members to ensure the program runs efficiently and effectively. What we propose to improve performance in the next two years: • Continue to pursue an additional Regional PLPW Access Coordinator to alleviate the
workload on current employees and improve the quality of services offered to Department personnel and the general public.

95
Appendix A. New proposed performance measure: In addition to direct assignment of projects from Department administration, the Lands Administration sub-program receives numerous requests for information and assistance on current projects as well as historical information regarding past property rights transactions and data. Requests come from regional Department personnel, other government agencies, private landowners, realtors, appraisers, lawyers, private sector companies and others. With the increase of mineral development in the state, additional demands will be placed on the sub-program to address requests for the use(s) and occupancy of Commission-owned or administered lands, which will also create an increased need to monitor for compliance and encroachments. Mitigation for loss of habitat due to future mineral development will increase the program’s workload in providing technical expertise to Department personnel. The amount of services supplied to address additional assignments and provide information may serve as another appropriate performance measure in the future. Program: Regional Information and Education Specialist Division: Services Mission: Work cooperatively with Department personnel to increase understanding and appreciation of Wyoming’s wildlife resources. Provide media outreach and wildlife conservation education programs for students, teachers, and other citizens of Wyoming. Program Facts: The Regional Information and Education Specialist program consists of a single sub-program, listed below with number of staff and FY 07 budget:
Sub-program # FTEs* 2007 Annual Budget
Regional Information & Education 7.0 $ 507,511
* Includes permanent positions authorized in FY 07 budget. Any positions added during the budget cycle require Wyoming Game and Fish Commission authorization or must be funded from supplemental grants. This program is located statewide. One Regional Information and Education Specialist (RIES) is assigned to each of the Department’s seven regional offices. Both the Laramie and Lander positions resigned (August and October, 2006, respectively). Through subsequent reorganization, the Laramie position now has divided responsibilities: primarily, that of Supervisor of the RIES work unit, Laramie RIES. Both the Laramie and Lander positions were filled in April 2007. The period of time these two positions were vacant and the changed nature of the Laramie position should be taken into consideration when reviewing performance goal data.

96
Primary Functions of the Regional Information and Education Specialists Program: • Work cooperatively with Department personnel to increase understanding and
appreciation of Wyoming’s wildlife resources by providing information and education support to other branches within the Services Division and other divisions within the Department. The RIES program supports the Department’s Information Branch by contributing to the E-newsletter, Wyoming Wildlife Newspaper, Wyoming Wildlife Magazine, and Regional News web pages. The RIES program also assists the Conservation Education Branch in the instruction of hunter education courses, Becoming an Outdoors Woman, teacher and youth conservation camps, youth fishing days, and the annual Hunting and Fishing Heritage Exposition.
• Provide regional and statewide media outreach by developing and distributing news releases, conducting media tours designed to provide the media and public with detailed information on important issues facing wildlife, conducting radio programs and interviews, and television public service announcements.
• Provide regional wildlife conservation education programs in the form of presentations and hands-on workshops to students, civic groups, and others.
Major Accomplishments for the period July 1, 2006 – June 30, 2007: 1) Included staff and regional information and education outreach priorities into regional
I&E work plans and successfully addressed these priorities throughout the year. 2) Completed our three-year facilitation commitment to the seven local sage-grouse
working groups as they finalized their draft Sage-grouse Conservation Plans. 3) Assisted the Conservation Education program with Wyoming Hunting and Fishing
Heritage EXPO, Hunter Education, Project WILD, Outdoor Recreation Education Opportunities and aquatic education programs throughout the state.
4) Reorganized RIES program to include a program supervisor stationed in Laramie. Performance Measure #1: Percent of employees satisfied with information and education services provided
0
20
40
60
80
100
% E
mpl
oyee
s Sa
tisfie
d
FY 03 FY 04 FY 05 FY 06 FY 07

97
Story behind the performance: The Regional Information and Education Specialists are responsible for working collaboratively with Department personnel in their respective region. The Department’s Internal Client Survey is conducted annually to assess the level of satisfaction regional personnel have with various aspects of the RIES work duties. Specifically, the survey asks respondents to rate their level of satisfaction with services provided by the RIES in particular regions. Due to the different number of responses for each region, calculations are based on weighted average percent satisfied normalized by the region with the largest sample size. The survey is voluntary and typically does not represent all those who request and receive services. Each year, survey recipients are asked to identify their level of satisfaction with the services provided by each of the seven RIES. On average, where each employee's response receives equal weight, 87.3 percent of employees were satisfied with the services provided by I&E Specialists. Where each region received equal weight, percent of satisfied personnel with specific regional Specialists ranged from 74.3 percent (Lander) to 98.0 percent (Green River). Annually, Department personnel are asked to identify and prioritize regional issues requiring information and education outreach. These priorities, in conjunction with statewide priorities established by staff, are used as the basis for the development of detailed RIES work plans. Works plans are discussed and reviewed at the Regional Coordination Team (RCT) level and help to identify monthly work tasks for regional personnel. On average, where each employee’s response receives equal weight, 83.3 percent of employees were satisfied with the I&E Specialists ability to address regional priorities. Where each region received equal weight, percent of satisfied personnel with specific regional Specialists ranged from 73.7 percent (Jackson/Pinedale) to 93.9 percent (Green River). What we propose to improve performance in the next two years: • Continue to communicate monthly with the Regional Information and Education
Specialist supervisor through teleconferencing to ascertain Divisional directives and planning goals.
• In January and/or February of each year, request a prioritized list of statewide issue related outcomes from Department Staff and Divisional I&E priorities within each region to be used in creating detailed work plans.
• Participate in an all I&E Branches planning meeting to review I&E priorities and implement the most effective communications outreach when disseminating messages to Wyoming citizens.
• Update regional personnel at RCT meetings on actions by RIES staff to address regional issues.

98
Performance Measure #2: Number of media interviews, news releases, radio programs, radio interviews, and television public service announcements provided.
Story behind the performance: Many issues affect Wyoming’s wildlife. In holding with the Department’s mission of serving people, it is important to keep the state’s citizens informed of these various issues. This is done through a variety of communication programs and activities. With the implementation of formal work plans in 2005, additional effort was put into the development of media outreach using common tools such as opposite the editorial (op-ed) articles, news releases, meeting announcements, public service announcements, interviews and on-site field trips. This effort is primarily focused on identified Department, Division, and Regional information and education priorities. The decrease in numbers from the previous year is reflective of personnel changes within the work unit. The Laramie position was vacant for nine months, the Lander region for seven. As previously stated, the Laramie position now serves the dual function of being both a RIES and the statewide supervisor of the RIES work unit. Future media outreach efforts from this position are not expected to be similar in performance to those of the other regions. Work units from within the Information Branch will assist the Laramie Regional I&E Specialist with media outreach responsibilities. What we propose to improve performance in the next two years: • Continue to use a monthly record spreadsheet by the lead worker to improve RIES
record keeping. • Continue to improve regional work plans to focus on Department priorities and link
our accomplishments to the Services Division monthly reporting process. • Pursue in-service training opportunities to improve media outreach skills. • Meet with the I&E Leadership Team each Spring to coordinate work schedules.

99
Performance Measure #3: Number of wildlife conservation education programs
0
40
80
120
160
200
240
# of
Pro
gram
s
FY 03 FY 04 FY 05 FY 06
Story behind the performance: The regional information and education specialists work collaboratively with Education Branch personnel to provide conservation education programs to the public. Those programs include; Hunter Education, Aquatic Education, Becoming An Outdoors Woman Workshop, WILD About O.R.E.O. (Outdoor Recreation Education Opportunities) Teacher and Youth camps, Staying Safe in Bear, Lion, and Wolf Country seminars, Wyoming Hunting and Fishing Heritage Exposition, Youth Fishing Clinics, and 4-H Outdoor Skills Competition. The regional information and education specialists also provide outdoor skills training, field trips, tours of Department education centers, and conservation education programs to schools, civic clubs, and youth groups within their respective regions. In 2004, the RIES position was removed from the Conservation Education program and reorganized as a separate program, supervised by the Services Division, Information and Education Assistant Division Chief. Prior to reorganization, the data regarding programs were sometimes reported in aggregate. This inconsistency in reporting is reflected in the performance measure graph above. The numbers reported for FY 04 (n=50) and FY 05 (n=50) should be considered minimums. In July 2006, the RIES lead worker implemented a more rigorous documentation process to more accurately document the regional conservation education efforts. This action will provide data that is consistent over time. What we propose to improve performance in the next two years: • Continue to use a monthly record spreadsheet to improve RIES record keeping. • Meet with the Conservation Branch personnel each spring to plan outreach efforts and
coordinate work schedules. • Balance work unit information outreach and conservation education outreach in
annual RIES work plans.

100
Program: Regional Terrestrial Wildlife Management Division: Wildlife Mission: Coordinate management of terrestrial wildlife and enforce laws and regulations to ensure long-term health and viability of terrestrial wildlife for the people of Wyoming, while providing recreational opportunity and minimizing conflicts. Program Facts: The Regional Terrestrial Wildlife Management program is made up of three major sub-programs, listed below with the number of staff and 2007 (FY 07) budget. Sub-programs # FTEs* 2007 Annual Budget Regional Terrestrial Wildlife Administration 11.1 $ 1,449,341 ** Regional Terrestrial Wildlife Biologists 27 2,610,248 Regional Game Wardens 54 5,344,301 TOTAL 92.1 $ 9,403,890 * Includes permanent positions authorized in FY 07 budget. Any positions added during the budget cycle require Wyoming Game and Fish Commission authorization or must be funded from supplemental grants. ** Does not include federal cost share dollars (50 percent) that support eight wildlife technician positions. The sub-programs that comprise the Regional Terrestrial Wildlife Management program were previously part of the Terrestrial Wildlife Management program (Strategic Plan FY 04-FY 07, November 2003). The Regional Terrestrial Wildlife Management program is located statewide. Primary Functions of the Regional Terrestrial Wildlife Management Program: • Coordinate Management of Terrestrial Wildlife, to collect and analyze data,
ensure big game management strategies are designed to achieve population objectives, review projects with potential to impact wildlife and their habitats, coordinate with other state and federal agencies and to educate, inform, and seek public input on wildlife management issues. Support, training and leadership are provided to ensure regional objectives and goals are being met.
• Enforce laws and regulations to ensure viable wildlife populations and public safety, inform and educate the public about wildlife laws, regulations and their necessity, and to address wildlife damage and wildlife/human conflict complaints. Support, training and leadership are provided to ensure the efficient enforcement of state laws, regulations, and to address wildlife damage and wildlife/human conflict complaints.

101
Performance Measure #1: Percent of big game herds within 10 percent of population objective
0
5
10
15
20
25
30
Perc
ent o
f Her
d U
nits
(%)
2002 2003 2004 2005 2006
Biological Year
Story behind the performance: While the Department is responsible for managing over 800 species of wildlife in Wyoming, many of our constituents are focused on the management of big and trophy game species. In addition, most of the Department’s annual income is derived from license sales for those species. Management of these species is the responsibility of the regional terrestrial wildlife biologists, regional game wardens and the regional terrestrial wildlife administration. The species included in this performance measure include pronghorn, white-tailed deer, mule deer, elk, moose, bighorn sheep, mountain goat, and bison. Values are based on individual species values taken from annual Big Game Hunting Season Recommendation Summaries. Hunting seasons and harvest quotas developed by the Department are the primary tools for managing big and trophy game species. Hunting seasons and harvest quotas are designed to manage herds for population objectives and desired male to female ratios. On one hand, public access to hunt areas, especially in eastern Wyoming, limits the Department’s ability to obtain desired harvest levels, which often allows herds to remain above their population objectives. On the other hand, loss of habitat to development and other disturbances continues to impact the Department’s ability to maintain terrestrial wildlife populations at historic levels. Since 2002, an average of 28 percent of big game herds across Wyoming were within 10 percent of their population objectives. Though the percentage was lower in 2006 (25 percent), the number between years ranged from 25 percent to 30 percent. Of the total 150 big game herds in Wyoming in 2006, 37 herds were at objective (+/- 10 percent) and 23 herds had incomplete data. Weather conditions (drought, severe winters) limit productivity of many deer and pronghorn herds. A number of these populations remain below objective. Elk populations are, in general, near objective after increasing cow harvest in recent years.
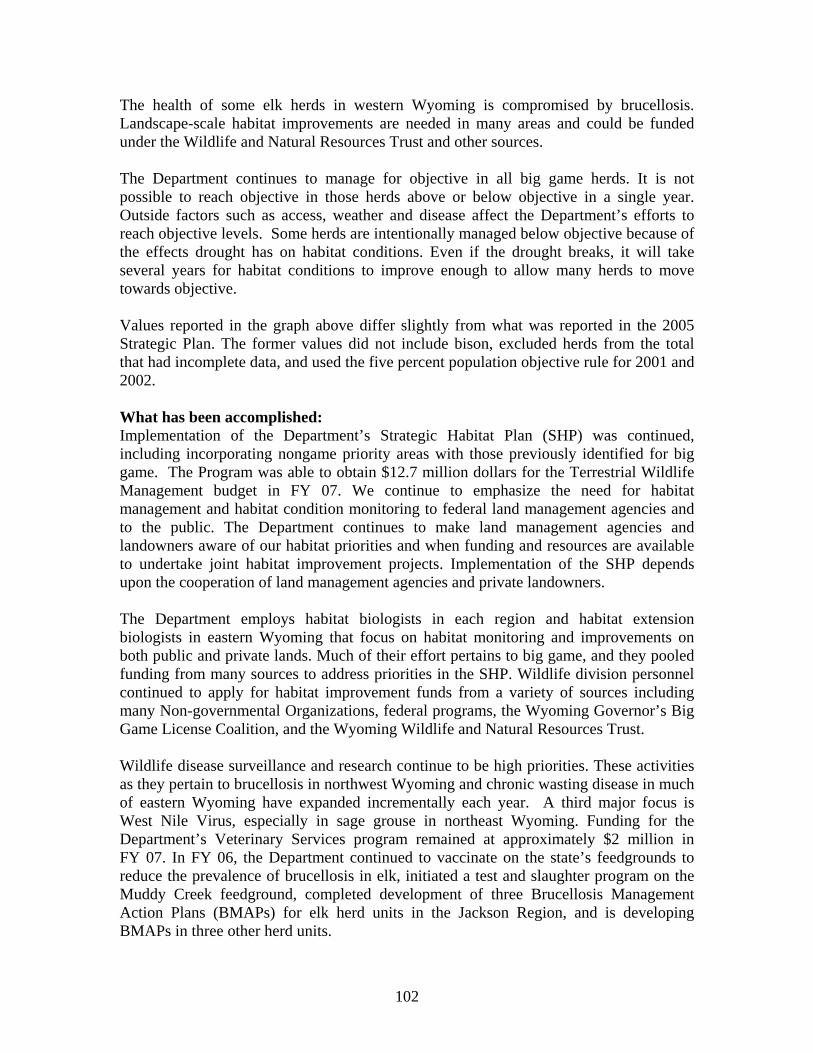
102
The health of some elk herds in western Wyoming is compromised by brucellosis. Landscape-scale habitat improvements are needed in many areas and could be funded under the Wildlife and Natural Resources Trust and other sources. The Department continues to manage for objective in all big game herds. It is not possible to reach objective in those herds above or below objective in a single year. Outside factors such as access, weather and disease affect the Department’s efforts to reach objective levels. Some herds are intentionally managed below objective because of the effects drought has on habitat conditions. Even if the drought breaks, it will take several years for habitat conditions to improve enough to allow many herds to move towards objective. Values reported in the graph above differ slightly from what was reported in the 2005 Strategic Plan. The former values did not include bison, excluded herds from the total that had incomplete data, and used the five percent population objective rule for 2001 and 2002. What has been accomplished: Implementation of the Department’s Strategic Habitat Plan (SHP) was continued, including incorporating nongame priority areas with those previously identified for big game. The Program was able to obtain $12.7 million dollars for the Terrestrial Wildlife Management budget in FY 07. We continue to emphasize the need for habitat management and habitat condition monitoring to federal land management agencies and to the public. The Department continues to make land management agencies and landowners aware of our habitat priorities and when funding and resources are available to undertake joint habitat improvement projects. Implementation of the SHP depends upon the cooperation of land management agencies and private landowners. The Department employs habitat biologists in each region and habitat extension biologists in eastern Wyoming that focus on habitat monitoring and improvements on both public and private lands. Much of their effort pertains to big game, and they pooled funding from many sources to address priorities in the SHP. Wildlife division personnel continued to apply for habitat improvement funds from a variety of sources including many Non-governmental Organizations, federal programs, the Wyoming Governor’s Big Game License Coalition, and the Wyoming Wildlife and Natural Resources Trust. Wildlife disease surveillance and research continue to be high priorities. These activities as they pertain to brucellosis in northwest Wyoming and chronic wasting disease in much of eastern Wyoming have expanded incrementally each year. A third major focus is West Nile Virus, especially in sage grouse in northeast Wyoming. Funding for the Department’s Veterinary Services program remained at approximately $2 million in FY 07. In FY 06, the Department continued to vaccinate on the state’s feedgrounds to reduce the prevalence of brucellosis in elk, initiated a test and slaughter program on the Muddy Creek feedground, completed development of three Brucellosis Management Action Plans (BMAPs) for elk herd units in the Jackson Region, and is developing BMAPs in three other herd units.

103
What we propose to improve performance in next two years: We are recommending big game populations, especially deer and pronghorn, be reduced temporarily to levels that can be supported by drought-stressed rangeland habitats. The Department also continues to promote hunter access to private lands in order to obtain adequate harvests. Access is declining and has become a significant impediment to management of big game herds in parts of the state. Access fees and outfitters monopolizing access are additional problems. The Department continues the Private Lands Public Wildlife program in an effort to improve access to hunting for the general public.
Performance Measure #2: Number of law enforcement investigation reports (LEIRs, Total cases entered annually into the case management system)
0
1,000
2,000
3,000
4,000
5,000
6,000
Num
ber o
f Vio
latio
ns
2002 2003 2004 2005 2006
Calendar Year
Story behind the performance: Enforcing wildlife and watercraft safety statutes and regulations is an integral component of terrestrial and aquatic wildlife management. Formal attempts at case management and law enforcement reporting systems have been used by the Department since the late 1970’s. Beginning in 1996, records began to be computerized. However, the system was quite cumbersome to use and to keep updated. A new case management system (CMS) went online in May of 2007. It is more user-friendly and has data-entry parameters that help prevent entry errors. The new system allows enforcement personnel to have access to all closed cases statewide. Individual cases are downloaded to the main system and the statewide cases are uploaded to the individual during a one-step synchronization process. Common violations include fishing without a license, failure to tag a big or trophy game animal, overlimits of big game or fish, trespass, shoot from the road, take big game out of season, and failure to provide proper safety equipment on watercraft. In 2006 law enforcement personnel discovered 5,092 violations. Increasing demands on game warden time and rapid growth in human populations in some areas of the state make it increasingly difficult to ensure adequate compliance with current wildlife and boating statutes and regulations. What has been accomplished: • A new CMS system was implemented.

104
What we propose to improve performance in the next two years: • Continue to evaluate the location of game wardens and wildlife technicians to ensure
enforcement needs are being addressed. • Continue to use a task force approach to address chronic, high profile or newly
emerging enforcement issues. • Continue to evaluate game warden and wildlife technician duties to ensure wildlife
violations are investigated each year. • Develop the ability to compare data in the Wildlife Violator Compact with our license
information. Performance Measure #3: The number of damage claims received/processed each year in accordance with Wyoming statutes and Commission regulations
0
50
100
150
Num
ber o
f Cla
ims
FY 03 FY 04 FY 05 FY 06 FY 07
Story behind the performance: Wyoming statutes require that the Department, through regional terrestrial wildlife personnel, address damages by big game, trophy game and game birds. Addressing damage is completed by several methods including providing damage prevention materials, moving or removing the offending wildlife, setting seasons to reduce the number of animals in an area, doing habitat improvement projects or paying monetary compensation for damages caused by the wildlife. Damage prevention and evaluation work by regional terrestrial wildlife personnel varies statewide and is greatly influenced by species present and environmental conditions. Since FY 03, an average of 113 damage claims have been addressed annually. Of years displayed above, FY 05 (n=82) had the lowest number of claims and FY 03 (n=139) had the highest number of claims submitted. Damage claim numbers fluctuate yearly based on many factors including weather severity, drought, population levels and mitigation measures by the Department. What has been accomplished: Considerable efforts were made by Department personnel to prevent damage including hazing, zon guns, providing materials for stackyard fences, relocating trophy game animals, increasing harvest, depredation seasons, and as a last resort, “kill” permits. Department personnel continue to work to educate landowners and process damage

105
claims. Training was provided to personnel at the “Professional Management of Conflicts between Human and Large Carnivores” workshop in methods of investigating predation of livestock and animal handling. What we propose to improve performance in the next two years: Continue to work with landowners to mitigate damages by providing damage materials, moving or removing the offending animals, educating landowners, and processing damage claims. Program: Specialized Statewide Law Enforcement Division: Wildlife Mission: To provide support for Boating Safety and Stop Poaching programs throughout the state. To provide for specialized wildlife law enforcement investigations, issuance of permits and record keeping to all wildlife regions. Program Facts: The Specialized Statewide Law Enforcement program is made up of two major sub-programs, listed below with number of staff and 2007 (FY 07) budget: Sub-programs # FTEs* 2007 Annual Budget Law Enforcement Administration & Boating Safety 2.0 $ 211,093** Law Enforcement Investigative Unit 8.0 796,779 TOTAL 10.0 $ 1,007,872 * Includes permanent positions authorized in FY 07 budget. Any positions added during the budget cycle require Wyoming Game and Fish Commission authorization or must be funded from supplemental grants. ** Does not include federal cost share dollars. The program is located statewide with personnel in Jackson, Green River, Cody, Sheridan, Laramie, Lander, Casper, and Cheyenne. These positions coordinate all the law enforcement programs and law enforcement reporting systems and administer the boating safety and stop poaching programs for the Department. Primary Functions of the Specialized Statewide Law Enforcement Program: • Provide support for Boating Safety Education and Enforcement by providing
boating safety courses for the public and providing boating safety enforcement on the State’s waterways
• Provide support for the Stop Poaching Program by increasing public involvement in detecting and reporting wildlife violators and by providing rewards for information relating to crimes against.

106
• Provide for specialized Wildlife Law Enforcement Investigations through the detection, apprehension and prosecution of wildlife law violators via complex multi-suspect, multi-jurisdictional investigations.
• Provide for overall Law Enforcement Administration by handling permits, law enforcement record keeping, and routine law enforcement administration.
Performance Measure #1: Number of boating safety violations documented by law enforcement personnel by calendar year
0
250
500
750
1000
1250
Num
ber o
f Wat
ercr
aft
Viol
atio
ns
2002 2003 2004 2005 2006
Calendar Year
Story behind the performance: The Program is responsible for providing boating safety and education information to the public. Wyoming experiences boater fatalities each year as a result of cold water/hypothermia or lack of life jacket use. Wyoming boaters are spread out among large reservoirs, rivers, small lakes and ponds across this state making it difficult to address all their boating safety needs. Limitations on law enforcement personnel time, and sometimes location, create a unique situation in addressing boating safety and education on a statewide basis. Responsibility for educating the public about boating safety, and the enforcement of boating safety laws and regulations, lies with the regional game wardens, trainees, wildlife technicians, and wildlife administration. Information and Education personnel assist with public service announcements and news articles. During 2006, up to eight wildlife technicians each spent approximately five man-months of time on watercraft safety and enforcement duties. Funding is received annually from the U.S. Coast Guard to assist with this effort. In addition to the wildlife technicians, regional game wardens spend time on watercraft safety and enforcement throughout the summer months. Since 2002, an average of 1,005 watercraft violations have been handed out annually. Both 2004 and 2005 were below the average, with law enforcement personnel documenting 779 in 2004 and 784 watercraft violations in 2005. Low water levels and understaffing were the main contributors to the decrease in the number of violations in 2004 and 2005. During 2006, water levels were somewhat higher, staffing problems were addressed, and violations increased to 1,111, slightly above the five-year average. The most frequent watercraft violations detected continue to be failing to provide adequate

107
personal flotation devices for all individuals on board, operating a motorboat with improper or no registration, and underage operators of watercraft. What has been accomplished: • Four wildlife technicians were hired and assigned to watercraft enforcement. • Four wildlife technicians received training at the Marine Patrol Officer Course in
Charleston, South Carolina. The U.S. Coast Guard operates the facility and provides the instructors and curriculum.
• Two Game Wardens attended a boat accident investigation class. This class is facilitated through the U.S. Coast Guard, National Association of Boating Law Administrators (NASBLA) and Underwriter’s Laboratory.
• Two boating education curriculum programs were approved for use in Wyoming. Both of these programs are provided through the Internet.
• Special permit authorization letters were issued for nine watercraft events. The events included such things as regattas and parades. The boating safety of both the participants and the public was evaluated before granting any request.
• Enforcement officers spent a total of 7,850 hours on boating safety. This includes time spent on law enforcement, safety and education programs, and search and rescue events.
What we propose to improve performance in the next two years: • Continue to increase the availability of boating safety courses to the public by
utilizing Internet course providers. • Continue to administer a proactive boating safety program through public service
announcements, boating education courses and enforcement programs. • Coordination with United States Coast Guard to continue funding provided for the
Department’s recreational boating safety program. • Evaluate the new Vessel Identification System (VIS) proposed by the United States
Coast Guard. • Annual evaluations are conducted on our boating safety program to maximize our
education and enforcement efforts. Wildlife Technicians compile annual reports and statistics covering their boating season enforcement efforts.

108
Performance Measure #2: Number of wildlife law enforcement actions taken as a result of Stop Poaching tips from the public and associated fines/restitution in calendar year
0
75
150
225
300
375
450
525
Num
ber o
f Rep
orts
and
Act
ions
2002 2003 2004 2005 2006
Total Reports Law Enforcement Actions
0
20,000
40,000
60,000
80,000
100,000
120,000
140,000
Dol
lar A
mou
nt
2002 2003 2004 2005 2006
Fines/Restitutions Rewards Paid
Story behind the performance: Wildlife crimes often go undetected due to the remote locations where they take place. Wildlife law enforcement officers conduct routine patrols for violators, but cannot be in every location to prevent all of these crimes. The wildlife of this state belongs to the people of this state, and it is paramount the public assist our officers in apprehending wildlife violators. The Stop Poaching program is based on a calendar year. Since 2002, an average of 523 poaching reports have been received, 250 cases closed, $57,584 in fines/restitutions paid, and $2,770 in rewards paid annually. These reports and subsequent cases are all a direct result of the Department’s Stop Poaching Hotline. During 2006, there were a total of 563 stop poaching reports received. Of these reports, enforcement actions resulted in 404

109
closed cases. A total of $73,450 in fines/restitutions was paid to county courts and $2,850 in rewards was paid to informants during 2006. The Department has increased efforts, in the last several years, to close all cases by insuring that all reports are returned from the field. This effort has been successful and has resulted in a greater number of closed cases. This past year, a database was developed to aid in tracking the cases, the associated statistics, and any open cases. Fines and restitution vary widely from year to year due to the severity of the crimes committed and the sentences handed out by the courts. On occasion, a single case will result in several thousand dollars being paid out in fines/restitution. What has been accomplished: • A new Stop Poaching number with an easy to remember acronym was put into
operation. The new number is 1-877-WGFD-TIP. • Decals advertising the new Stop Poaching phone number are being placed on wildlife
division vehicles. What we propose to improve performance in the next two years: • Continue to provide a 24-hour information hotline for the public to report wildlife
violators. • Continue to provide monetary rewards and certificates of appreciation for those
people who turn in wildlife violators. • Calendars will be printed and distributed to advertise the Stop Poaching program and
toll free hotline. Other promotional items with the Stop Poaching number will also be distributed.
Performance Measure #3: Number of hours expended working cases by the Investigative Unit
2,0002,5003,0003,5004,0004,5005,0005,5006,0006,500
Inve
stig
atio
n H
ours
FY 03 FY 04 FY 05 FY 06 FY 07
Story behind the performance: The Law Enforcement Investigative Unit is comprised of six full-time Wildlife Investigators stationed at or near regional offices. The Unit is supervised by one supervisor/investigator stationed at the Casper Regional Office. Unit members operate with unmarked vehicles and typically out of uniform. Personnel are equipped with modern evidence, surveillance, tracking, and other equipment.

110
The Unit initiates many cases, but the bulk of cases are referred from District Wardens and other sources. The Unit conducts investigations that are generally complex, long-term wildlife violation cases utilizing specialized methods and equipment and beyond the time commitment Wardens can devote. Cases may be overt or covert in nature and are selected based on established priorities. The Unit also carries a large “assisted” caseload. They assist Wardens from Wyoming as well as other jurisdictions including the U.S. Fish and Wildlife Service. Most of these cases take a great deal of time and can be active for several years. Each case may contain many defendants and many charges/violations. The Unit also has a large number of cases that are not worked due to time constraints and priorities. Since FY 03, an average of 5,366 investigative hours have been completed annually. In FY 07, the Unit was involved in hundreds of cases of all sizes. Several undercover cases have also been worked. Investigators spent 4,659 hours investigating cases in FY 07. What has been accomplished: • Six Wildlife Investigators and one Investigator Supervisor were able to spend 4,659
hours working to solve wildlife crime even though two positions were vacant for a time.
• Many cases have progressed including several covert cases. • Investigators have received more training to accomplish their work assignments. What we propose to improve performance in the next two years: • Continue to aggressively investigate wildlife violations. • Develop and utilize innovative techniques and technology to assist with the mission
of the Program. • The unit will seek updated surveillance equipment for investigations and provide
training to investigators in information technology based crime. The unit will also work with the electronic licensing program in this regard.
• Continue to evaluate Investigator duties and focus on major investigations through supervision and quarterly Investigative Unit meetings.
Performance Measure #4: Number and type of permits issued in calendar year for importation, possession, education and scientific purposes regarding wildlife within the boundaries of Wyoming
0100200300400500600
# of
Per
mits
Is
sued
2002 2003 2004 2005 2006
Importation/Possession (CH10)Scientific/Educational (CH33)

111
Story behind the performance: Wyoming state statutes and Commission Regulations require a thorough review and evaluation of all wildlife to be imported, collected and/or possessed in the state. In recent years, there has been a substantial increase in the public interest to possess exotic wildlife, which raises concern for the overall welfare of native species in Wyoming. Several areas of concern include: hybridization, predation, competition and habitat destruction. The collection/possession of wildlife for scientific and educational purposes is closely monitored by the Department to assure protection of the native species of Wyoming. Prior obtaining a scientific/educationa1 permit, applicants must convey the expected benefits to science, research, education and/or department management goals. Research projects are coordinated with Department personnel as well as with individuals from higher institutions from around the country. Permit holders are required to submit an annual report on or before January 31 for the preceding calendar year in which the permits were valid. The annual report includes a summary of educational permit activities or collection information (i.e. species, sex, age, disposition, location, etc.). Since 2002, an average of 435 importation/possession permits and 173 scientific/educational permits have been issued. In 2006, a total of 406 importation/possession permits and 193 scientific/educational permits were issued. The majority of importation/possession permits issued in 2006 were for game birds/waterfowl, which are primarily used for dog training and field trials. Scientific permits were issued for all major fish and wildlife classes, to include birds, mammals, fish, amphibians and reptiles. Educational permits were issued for the display of live wildlife as well as the exhibition of mounts and/or miscellaneous wildlife parts (pelts, feathers, skulls, horns/antlers, etc.) What has been accomplished: All scientific collection permit holders were required to submit their annual report/data electronically. The electronic reporting reduced processing time for all Department employees involved in the reporting process and also provided a simple format in which to download the provided information into the Wildlife Observation System. Multiple committees were formed to evaluate and comment on one or several aspects of the existing permitting process to improve overall effectiveness. What we propose to improve performance in the next two years: • Create an online/internet-based reporting template any scientific, educational or
special purpose permit holder could access and complete to meet the reporting requirements.
• Continue to work on combining the Chapter 10 and 33 databases for a more effective issuance of permits due to current formatting differences in the permitting databases.

112
• Streamline the application and permitting processes to assure adequate information is provided prior to issuing permits. A single application form is being developed to facilitate this change and a uniform reporting date is being designed to assure research permits are received in a timely manner.
*Note - The importation/possession (Chapter 10) figures reported this year differ from those reported in previous years in that the numbers now reflect the number of permits issued within a specific calendar year. Previously reported figures included the number of permits issued in a calendar year and all “Life of the Animal” permits that were ever issued. Program: Statewide Terrestrial Wildlife Management Division: Wildlife Mission: Lead specialized, statewide conservation and management of native terrestrial wildlife species, and assist with regional management of resident game species. Program Facts: The Statewide Terrestrial Wildlife Management program is made up of seven major sub-programs, listed below with number of staff and 2007 (FY 07) budget.
Sub-programs # FTEs* 2007 Annual Budget Biological Services 6.3 $ 797,467 Terrestrial Nongame 7.3 570,676 Migratory Game Bird (Waterfowl) 1.0 132,203 Trophy Game Mgmt. & Research 4.8 352,417 Trophy Game Conflict Resolution 5.5 448,848 Sage-Grouse Conservation 2.0 669,905 Predator Management 0.0 100,000
TOTAL 26.9 $3,071,516 * Includes permanent and contract positions authorized in FY 07 budget. Any positions added during the budget cycle require Wyoming Game and Fish Commission authorization or must be funded from supplemental grants. The sub-programs that comprise the Statewide Terrestrial Wildlife Management program were previously part of the Terrestrial Wildlife Management program (Strategic Plan FY 04-FY 07, November 2003). The Migratory Game Bird sub-program was previously referred to as the Waterfowl sub-program. The Trophy Game Management and Research sub-program was previously referred to as the Trophy Game sub-program. In addition, the Sage-Grouse Conservation sub-program was created and added as its own sub-program. This program has statewide responsibilities that are based in various locations throughout the state.

113
Primary Functions of the Statewide Terrestrial Wildlife Management Program: • Assist with recovery and conservation of species that are threatened, endangered
or in greatest conservation need by developing and implementing plans and strategies, providing technical and financial assistance, collecting data, coordinating with other agencies and organizations, and conducting research.
• Participate in statewide terrestrial wildlife management by providing policy, data and environmental analyses, planning and evaluation, data collection, and trophy game conflict resolution; by compiling and administering statewide management data; and by representing the division or agency in multi-disciplinary and multi-organization conservation and management efforts.
• Some of the sub-programs contribute to harvest management of game species by conducting annual harvest surveys, compiling and analyzing harvest information; making recommendations on harvest strategies; and interstate coordination.
• Serve internal and external customers by providing and interpreting data, disseminating information about wildlife and its management, and providing additional related services.
Performance Measures #1: Biological Services - Major work plan elements achieved
0
20
40
60
80
100
% W
ork
Plan
Ele
men
ts A
chie
ved
(Bio
. Ser
vice
s)
FY 03 FY 04 FY 05 FY 06 FY 07
Story behind the performance: The number of major and minor work plan elements achieved continue to be the sole measure of Biological Services’ annual performance. In recent years, major work elements have ranged between 20 (FY 07) and 26 (FY 03) annually, and minor work elements have ranged between 12 (FY 03) and 19 (FY 05) annually. These work elements are selected based on the importance of these particular products and services to the Department and to external customers. They include harvest surveys, production and distribution of the major division annual publications, coordination of Convention on International Trade of Endangered Species (CITES) bobcat pelt tagging, technical assistance to the division and Department administrations, preparation of the Commission season setting notebook, representation of the Department on flyway council technical committees, preparation of sage-grouse habitat guidelines for Wyoming, compiling black

114
bear and mountain lion harvest data, maintaining the hunt area quota hotlines, and in FY 07 considerable time was spent by the Cheyenne Staff Biologist assisting the Director’s office and the WY Attorney General’s office with wolf delisting issues.
Over the past five years, the Biological Services sub-program has completed an average of approximately 96 percent of its major work plan elements. In FY 07, 100 percent (20 of 20) of the major work plan elements were completed. Completing all of them was a challenge because the section faced a number of unplanned, urgent or higher priority assignments delegated to it during the year by administration(s). The section’s personnel include some latitude in their annual schedules in anticipation of unplanned assignments. Unplanned assignments have become so much a part of the section’s routine that they can be anticipated, but their number and time demands in any given year cannot. In FY 07, significant unplanned work elements include the Cheyenne Staff Biologist being assigned to a number of tasks associated with wolf delisting that made him unavailable to the section for any work other than those tasks specifically assigned to that position in the section’s annual work schedule. He was also required to continue helping with the process of review and comment on the mitigation recommendations for oil and gas development as well as to do other policy, regulation and document reviews.
The major and minor work plan elements identified annually constitute a large percentage, but not all of, the duties and tasks for which the section is responsible. The major work plan elements listed are, for the most part, not expendable. Each is important to someone, and in some cases, is significant to a broad range of internal and external customers. What has been accomplished: All of the major and minor work plan elements were accomplished. The minor work plan elements include: maintain herd unit files; continue preparing legacy job completion reports for posting on the internet; assist regions with wildlife surveys, hunter check stations and chronic wasting disease surveillance; order and distribute supplies for tooth sampling in some big game herds; format and print documents; interagency coordination; fulfill Wildlife Observation System (WOS) report requests; policy and other analyses; document review and comment; Wyoming Bird Record Committee; Wyoming Natural Diversity Database Advisory Board; interagency coordination and outreach; intra-agency committees (Mule Deer Working Group, Pronghorn Working Group); develop databases and data transfers; maintain bird banding records and administration of Department’s banding permit; and assist other work units. What we propose to improve performance in the next two years: • Continue to plan the work schedules of section personnel to accomplish the tasks we
can anticipate and accommodate unplanned assignments (possibly at the expense of not completing some of the less critical work plan elements).
• Continue to clarify to administration the roles and responsibilities appropriate for the positions in Biological Services and the need for the sub-program to remain focused on its established purpose.

115
Data development agenda: While the number of work elements achieved annually provides some measure of success, it does not address the primary, overarching function of the Biological Services sub-program, which is providing information, assistance and technical support to internal and external customers. The number of work elements achieved is a measure of effort, but not of effect. Although no single performance measure adequately portrays the sub-program’s performance, by necessity only one must be selected. We propose to determine annually through the Internal Client Satisfaction Survey the level of satisfaction with the information and technical assistance provided by Biological Services. As a secondary measure, we will query internal clients regarding the timeliness of services received. The latter measure will be tracked primarily by the sub-program for our own, internal purposes; but it will discussed in “The Story Behind the Performance” section. The information gathered about this second measure may explain responses related to the satisfaction question associated with information and technical assistance. Questions about the section’s performance have been asked in last year’s and this year’s internal satisfaction survey. The anticipation is that next year, with three data points, a conversion to the performance measure of satisfaction can take place rather than the work elements achieved that have been used the preceding several years. Efforts to determine measures that better represent the broad responsibilities of the sub-program will continue. Performance Measure #2: Migratory Game Bird - Major work plan elements achieved
0
20
40
60
80
100
% W
ork
Plan
Ele
men
ts
Ach
ieve
d (M
igra
tory
G
ame
Bird
)
FY 03 FY 04 FY 05 FY 06 FY 07
Story behind the performance: This sub-program was formerly called “Waterfowl Management”. Major annual work plan elements for the Migratory Game Bird sub-program include: population surveys, harvest surveys, hunting regulation recommendations, Central and Pacific Flyway Technical Committee functions and responsibilities, Bump-Sullivan Managed Goose Hunt, budget preparation, dissemination of information, advocating protection/mitigation of migratory game bird habitat, annual completion reports, and management of goose nesting structures. Annual work plan elements are identified by program personnel prior to the fiscal year. The number of major work plan elements achieved has been the sole measure of the sub-program’s performance. Work plan elements reflect primarily the duties within the mission of the sub-program and are vital to manage migratory game birds at state and

116
interstate scales. Since FY 03, the Migratory Game Bird Management sub-program completed an average of 74 percent of its annual major work plan elements. In FY 07, 90 percent (nine of 10) of the major annual work plan elements (and 100 percent of the minor work plan elements) were completed. Of the 10 major work plan elements listed, one was not attainable due to drought and lack of water in Bump-Sullivan Reservoir. Duties for the Pacific Flyway are divided among the Central Flyway Migratory Game Bird Biologist, Jackson Nongame Biologist and the Alpine Staff Biologist. The Central Waterfowl Biologist and the Nongame Biologist conduct migratory game bird surveys. The Alpine Staff Biologist represents the Department at the Pacific Flyway Technical Committee meetings and is responsible for recommending migratory game bird seasons in the Pacific Flyway in collaboration with the Central Flyway Migratory Game Bird Biologist. Although banding remains a priority, no migratory game birds were banded during FY 07. The Migratory Game Bird Section is providing financial support to help fund the preseason duck banding effort being carried out in the Central Flyway. Another priority is to maintain and evaluate over 1,000 goose nesting structures throughout the state. In response to reductions in personnel and funding, and considering the breeding population of Canada geese in Wyoming has increased 32 percent over the past 20 years, the Department is evaluating the need and ability to annually replace bedding and maintain the structures. Less effective structures, in which geese don’t regularly nest are being eliminated where possible. The Migratory Game Bird Section participates in cooperative annual surveys to estimate waterfowl populations and provides information necessary for setting waterfowl seasons. These surveys include the September crane, mid-winter waterfowl, and Canada goose breeding surveys. In addition, a goose molting survey is conducted every third year. The Migratory Game Bird Section remains strongly involved in migratory game bird management, development and revision of management plans for the various migratory game bird populations, and annual season setting in both the Central and Pacific Flyways. These processes require representatives from Wyoming to participate in the Flyway Technical Committee meetings held in December/January, March and July. The Migratory Game Bird Section is also directly or indirectly involved in the management of migratory nongame birds in the two Flyways. For example, the section has been increasingly involved with trumpeter swan management. What has been accomplished: The Migratory Game Bird Biologist coordinated surveys to collect waterfowl and sandhill crane harvest and population data, analyzed the data, prepared recommendations for the migratory game bird hunting seasons, and represented the Department at the Central Flyway Technical Committee meetings. The Alpine Staff Biologist represented the Department at the Pacific Flyway Technical Committee meetings and, in

117
collaboration with the Central Flyway Migratory Game Bird Biologist, recommended migratory game bird seasons in the Pacific Flyway. Both biologists participated in the Wingbees for the respective flyways. The Migratory Game Bird Section participated in cooperative annual surveys to estimate migratory game bird populations and provide information necessary for setting hunting seasons. These surveys are done in cooperation with the U.S. Fish and Wildlife Service (USFWS) and included mourning dove, September crane, mid-winter waterfowl, and Canada goose breeding surveys. The Migratory Game Bird Section remains strongly involved in Central and Pacific Flyway administrative processes including migratory game bird management, development and revision of management plans, and setting annual hunting seasons. These processes require attendance at the Flyway Technical Committee meetings in December/January, March and July. The goose nesting structure database was updated with current information. The 2005 and 2006 annual completion reports were written and filed with Biological Services. Information and data were provided in response to all inquiries. The annual budget was prepared and funding support to the Central Flyway preseason duck banding effort was provided. That crew banded ducks in North Dakota during FY 07. Another spring light goose hunting season was conducted under the Arctic Tundra Habitat Emergency Conservation Act in the Central Flyway portion of the state. The Section advocated conservation of migratory game bird habitat through its involvement in the Intermountain West and Northern Great Plains Joint Ventures, and participation in the Statewide Wetland Strategy working group. The Section made additional headway with the breeding duck density project. Database and spreadsheet capabilities were used to rank breeding duck densities obtained from past breeding duck surveys in Wyoming. The preliminary results were depicted in geographic information system (GIS) format.
What we propose to improve performance in the next two years: • Prioritize work elements; some work simply will not get done due to staffing
limitations and other demands. • Improve coordination and communication with other Department personnel whose
duties may have some bearing on goals and objectives of the Migratory Game Bird Section, and with those personnel who are occasionally requested to assist with surveys, banding, and other functions.
• Submit a request for a student intern annually. • Investigate other pathways to increase technical and clerical assistance.

118
• Continue to justify the need for another full-time Migratory Game Bird biologist to cover the western (Pacific Flyway) portion of the state.
• Continue to plan work schedules to accomplish anticipated tasks and accommodate unplanned assignments, possibly by not completing some of the less critical work plan elements.
Data development agenda: While the number of work elements achieved annually is not an ideal measure of success, it seems to provide the most workable single measure of success given the diversity of duties within the sub-program. An alternative would be the number of (hunter) annual recreation days associated with migratory game birds. However, there are many things that influence that number, including bird reproduction and survival in other parts of the continent, weather during the migration period and changes in the federal regulatory frameworks, which are beyond the influence of the Migratory Game Bird sub-program personnel. As well, the number of recreation days is only one of the outputs that might be important to the external customers of this sub-program. Better performance measures for the sub-program will continue to be investigated. Performance Measure #3: Nongame – Major work plan elements achieved
0
20
40
60
80
100
% W
ork
Plan
Ele
men
ts
Ach
ieve
d (N
onga
me)
FY 03 FY 04 FY 05 FY 06 FY 07
Story behind the performance: This sub-program is responsible for monitoring, management and dissemination of information on over 300 species of birds and 100 species of mammals. Since FY03, the Nongame Section has consistently accomplished 100 percent of the major work plan elements identified prior to each fiscal year. Major work plan elements include strategy administration and planning; monitoring population trends of bald eagles, peregrine falcons, trumpeter swans, common loons, colonial nesting water birds; coordination of Partners in Flight and Wyoming Bird Records committee; black-footed ferret reintroduction and monitoring; inventory of bats and habitats associated with caves and mines; black-tailed prairie dog surveys; swift fox surveys; raptor surveys in eastern Wyoming; completion of State Wildlife Grants projects, and reports and dissemination of information. Grassland ecosystem monitoring

119
and management planning to assist with implementation of the State's Comprehensive Wildlife Conservation Strategy (CWCS) were added as major elements. We continue to plan and focus on a limited number of elements that can reasonably be completed with existing personnel. Funding will never be sufficient to address all species or management concerns and the strategy consistently faces a large discrepancy between work that needs to be accomplished and work that can be accomplished. The increase in the number of species proposed for listing and the need to work on many of these before listing has greatly increased workloads without adequate funding and personnel. New Federal appropriations such as State Wildlife Grants have provided additional funding and some assistance. However, the long-term effectiveness of additional funding is limited without additional permanent personnel and the short-term or inconsistent nature of Federal money. What has been accomplished: • As outlined in Appendix VII of the CWCS, the bird and mammal inventory and
monitoring plan was continued and includes several levels of monitoring intensity. In FY 07, annual monitoring of population trends was conducted on species such as American white pelican and other colonial nesters, bald eagle, Columbian sharp-tailed grouse, common loon, greater sage-grouse, sandhill crane, long-billed curlew, peregrine falcon, trumpeter swan, and black-footed ferret. Species with baseline data and repeat surveys every three to five years were surveyed and included American bittern, harlequin duck, mountain plover, upland sandpiper, black-tailed prairie dog, several species of bats, Canada lynx, pygmy rabbit, swift fox, white-tailed prairie dog, and wolverine. The Department coordinated monitoring efforts that serve as a coarse filter for early detection of species that may need to be included in Wyoming’s species of greatest conservation need (SGCN) list. This effort included 60 roadside breeding bird survey routes, 164 point count transects, and several riparian transects and one banding station. Cooperators and Department personnel also initiated baseline surveys for the brown-capped rosy finch, yellow-billed cuckoo, and three-toed and black-backed woodpeckers. In addition, over 2,700 records of SGCN were entered in the Department’s computerized Wildlife Observation System during FY 07.
• As identified in the CWCS, recovery efforts for the black-footed ferret continued and in FY 07 included habitat mapping; monitoring a portion of the ferret population (1033 personnel hours conducting spotlight surveys that identified over 193 individual ferrets in the core population); reintroduction (110 ferrets were released approximately 15 miles north of the recovering core population); and needed research was completed on population dynamics as it relates to habitat use and recovery efforts. One paper was published in Science on August 10, 2007 and is receiving much notoriety. For the week of August 13, Yahoo.com reported that it was one of the five most frequently e-mailed Science news articles of the week. Another paper has been completed and will be submitted to a professional journal. Both papers are likely to significantly change and improve the national paradigm of black-footed ferret recovery efforts.

120
• A conservation effort for sagebrush obligates and sage-grouse continue as outlined in the CWCS, the National Conservation Strategy and other state and local conservation planning documents. The massive effort includes: increased monitoring and improved databases, habitat mapping, and many projects implemented by cooperating entities with state and matching funded grants. Such projects include sage-grouse habitat improvements on public and private land willing landowners and high priority sage-grouse research that leads to improved management (applied research). Over 50 such projects were implemented across the state between 2005 and 2007.
• Progress continued on the Department’s Green River Basin Trumpeter Swan Summer Habitat Planning Project (State Wildlife Grant 2003-2004) to develop habitat for the expanding population that was established through release of captive-raised stock in the Green River drainage (1994-2004). Department personnel prepared and submitted three swan wetland habitat project proposals on private lands in the Green River basin to the Wyoming Wildlife and Natural Resource Trust Board (WWNRT). One project, to create a 12 acre shallow water wetland suitable for nesting swans, was awarded matching funds by WWNRT and the National Resource Conservation Service (NRCS) Wetlands Reserve Program; work will began on this project in fall 2007. Monitoring continues on the wetland project completed in 2006 on a private ranch in LaBarge (Wyoming Game and Fish Department Habitat Trust Fund project). A number of additional wetland project proposals were reviewed that could benefit swans.
• Exciting progress on implementing Wyoming’s Grassland Plan portion of the CWCS and Landowner Incentive Program (LIP) occurred during FY 07. A summary of this progress follows.
• We are halfway through the second year of the effort in which WGFD has earnestly worked with landowners to develop and submit LIP project proposals and use LIP funds to implement objectives of Wyoming’s Grassland Plan. Last year, there were four prairie dog proposals and two cheatgrass control and native reseeding projects, all in the Thunder Basin National Grasslands area. The prairie dog payments were made to landowners interested in maintaining prairie dogs, a LIP focus species, as part of a larger ecosystem management objective. Four landowners were contracted to receive incentive payments to maintain 487 acres of black-tailed prairie dogs. These landowners are also in the primary black-footed ferret release area for the Thunder Basin. Prairie dog incentive payments are particularly important in the Thunder Basin and Shirley Basin because of their importance to black-footed ferret recovery. The cheatgrass control projects, on two ranches totaling approximately 600 acres, are going to be followed up with LIP sponsored native species seeding and grazing rest. The cheatgrass control projects were selected in areas with good sagebrush cover that were located near known sage-grouse leks. This approach will result in immediate, tangible benefits to sage-grouse, as opposed to doing treatments with the hope that sage-grouse will begin using the treatment areas. These landowners are also associated with the Thunder Basin Grassland Prairie Ecosystem Association.
• Last year’s project proposals were few in number because there was not an aggressive effort to promote or develop more. The LIP committee felt that the first year and those few projects should be used to ‘test’ or ‘prove up’ the process (both the internal

121
WGFD project development and ranking process and our interactions with USFWS on LIP).
• This year seven Terrestrial LIP project proposals with five different landowners have been developed, evaluated and approved by WGFD. Those projects total more than 36,000 acres. Three of the LIP projects for this year are compensation for managing for prairie dogs in the Shirley Basin area, which is significant due to their proximity to the black-footed ferret population there. The prairie dog incentive payments will be made over a period of three years and will result in the maintenance of 5,401 acres of biologically significant white-tailed prairie dog colonies for at least the next three years.
• Two of these same three landowners in the Shirley Basin are participating in an additional LIP project. These LIP projects are part of a large-scale and ongoing resource management project focused on preserving, improving, and restoring the natural sagebrush-grassland and grassland ecosystems of the Shirley Basin. Participants, including private landowners and the Bureau of Land Management, are focused on implementing practices and providing tools necessary for sustaining the area in its natural state. Implementation and management tools include livestock grazing systems, wildlife habitat projects, and overall watershed management plans throughout the basin.
• Both of these LIP projects will employ a rest-rotation grazing system to increase the health and vigor of the sagebrush-grassland and increase heterogeneity among the pastures. Both landowners will rest for a full year at least 2,000 acres annually. Habitat heterogeneity and increased rangeland vigor and health are intended to improve the overall health of the ecosystem. There will also be benefits to wildlife, including increased forage production and greater avian and mammalian abundance and diversity. The projects will also increase the residual vegetation available for sage-grouse nesting cover.
• The first project is a five-pasture rest-rotation grazing system that includes resting one pasture annually for a full year to increase grassland heterogeneity on more than 11,000 acres. It will also involve installing pumping systems, solar units, tanks, pipeline, and troughs on existing wells; fencing out solar system units and storage tanks; and installing wildlife ramps. By increasing grassland heterogeneity, this project should also benefit two LIP focus species and nine other SGCN including, swift fox, upland sandpiper, ferruginous hawk, McCown’s longspur, mountain plover, short-eared owl, white-tailed prairie dog, olive-backed pocket mouse, plains pocket mouse, burrowing owl and prairie vole.
• The second project involves a rotational grazing strategy to increase the health and vigor of the sagebrush-grassland and increase heterogeneity among the pastures. The other aspect of the project focuses on rejuvenating decadent stands of sagebrush (chopping in a mosaic and zigzagging pattern to create one to 25 acre patches throughout a 9,000 acre allotment with a brush hog) to benefit greater sage-grouse (and other sagebrush species) by providing nesting and foraging areas and increasing forb and insect diversity and abundance.
• Another LIP project near Leo, WY is designed to provide at least 800-1,000 acres annually of sagebrush habitat with residual vegetation from the previous year through a rest-rotation grazing system. It involves rested pastures and described grazing

122
management that will restore the native herbaceous understory and provide improved nesting and foraging habitat. The project will add complexity and heterogeneity back into the local sagebrush system, provide two large (greater than two acres) sage-grouse watering areas and create important avian microhabitats by selectively shutting down a watering trough each year. In addition, the use of the rest/rotation grazing system will steadily improve the overall range condition on the ranch and the water developments will benefit the local sage-grouse population in addition to other avian and mammalian nongame species.
• The final LIP project for FY 07 will be completed near Lander, WY. The sagebrush stands on the project site are very decadent and therefore have a significantly reduced value to wildlife. Most of the area has a sagebrush density of at least 20 percent cover, which hinders sagebrush vigor and grass and forb production. The results of this dense landscape have caused limited suitable habitat for several LIP focus species including the greater sage-grouse, sage sparrow, Brewer’s sparrow and three additional SGCN including, the sage thrasher, sagebrush vole, and lark bunting, and is in eminent need of rehabilitation. The project will mow 105 acres and chemically thin 382 acres of dense sagebrush range this fall. The project will also create two riparian areas that will provide water, forage, and cover to greater sage-grouse and numerous songbird and amphibian species this fall by modifying two existing wells.
• In addition, the same four landowners in the Thunder Basin who were contracted with for incentive payments to maintain black-tailed prairie dog colonies will re-enroll this fall.
• The LIP program is building on relationships established with landowners in the Thunder Basin National Grassland, the Shirley Basin, and around the City of Cheyenne to develop LIP projects that promote grassland heterogeneity and restoration. In addition, LIP personnel are cooperating with scientists from the Agricultural Research Station and Environmental Defense to develop ideas and incentives to promote grassland heterogeneity on working ranches for the benefit of grassland wildlife. LIP personal are anticipating developing many great LIP projects for FY 09 after completing our fall outreach effort.
What we propose to improve performance in the next two years: • Increase efforts for implementation planning to assure that high priority major work
plan elements are attained while accommodating short-term projects. • Focus on writing proposals and attaining funding that is long-term and can be
appropriately planned. • Continue to seek additional permanent positions through legislative and other long-
term funding. • Continue to build a reliable base of volunteers and suitable projects through outreach
to conservation organizations and schools. Data development agenda: While the number of work elements achieved annually provides some measure of success, it does not adequately reflect accomplishments of the program that internal and external publics can readily evaluate. We are currently investigating better performance

123
measures and recommend that the number of SGCN that are monitored as described in Appendix VII of the CWCS for Wyoming be used as a new performance measure. Performance Measure #4: Trophy Game Management and Research – Major work plan
elements achieved
Story behind the performance: The primary measure of this sub-program’s performance has been the number of major work plan elements that have been achieved annually. These work plan elements include such things as annual grizzly bear surveys and research trapping; analysis of annual black bear and cougar harvest data and management of the databases for this information; participating on the Interagency Grizzly Bear Study Team (IGBST); fulfilling information requests; preparation of state management plans for black bears and mountain lions; and assisting as required on wolf related issues. All but one (95 percent) of the annual work plan elements have been met each year. In the past this section managed the nuisance wildlife-human interaction database. This database was modified and turned over to the Nuisance Branch. Several additional work elements were completed this fiscal year that were not initially identified. This branch has to contend with numerous unplanned higher priority assignments from the administration. There is typically little latitude to adjust section personnel’s assignments. While we do anticipate several unplanned events annually, the frequency and number cannot be predicted. What has been accomplished: • Management/Research trapping of grizzly bears. • Conduct and manage database for telemetry flight. • Conduct and coordinate observation flights. • Conduct numerous information and education programs. • Manage black bear and mountain lion harvest databases and prepare annual harvest
summaries. • Finalized the state’s black bear and mountain lion management plans. • Updated the aggressive wildlife-human interactions database and turn over to
Nuisance Branch. • Maintained black bear bait site database. • Participated in the IGBST, Yellowstone Ecosystem Subcommittee (YES), and
Interagency Grizzly Bear Committee (IGBC) committees.
0
20
40
60
80
100
% W
ork
Plan
Ele
men
ts
Ach
ieve
d (T
roph
y G
ame)
FY 03 FY 04 FY 05 FY 06 FY 07

124
• Assisted WGFD Administration on wolf issues as required. • Sampled two black bear den sites per ongoing fecundity study. • Initiated remote sensing study to count female grizzly bears with cubs of the year. • Prepared chapters for annual IGBST Report. • Obtained additional funding through the Yellowstone Grizzly Bear Conservation
Strategy to assist with data collection, nuisance management, and information and education efforts.
What we propose to improve performance in the next two years: • Continue to meet the major and minor work plan efforts annually. • Develop additional proposals through state and federal sources to ensure that
adequate funding exists to meet the need for expanded data collection efforts. Data development agenda: Because of the diversity of tasks this sub-program is expected to perform and the inability to determine a single alternate performance measure that satisfactorily represents the sub-program’s annual performance, we propose continuing to use work elements achieved as a performance measure. The number of work elements achieved does not address the performance of the sub-program that would be apparent or important to many of its publics, which is a fundamental criterion for establishing performance measures for this new strategic planning effort. We will continue to investigate measures that satisfy this criterion and will supplant the current one with something more appropriate if one can be found. Performance Measure #5: Sage-Grouse Conservation – Population status of sage-grouse relative to the objective as established in the WY Greater Sage-Grouse Conservation Plan (2003)
0
500
1000
1500
2000
# O
ccup
ied
Leks
2002 2003 2004 2005 2006
Biological Year

125
0
5
10
15
20
25
30
35
# C
ocks
Per
Lek
2002 2003 2004 2005 2006
Biological Year
Story behind the performance: Monitoring sage-grouse population trends requires knowledge of the location of all or most leks along with the average number of males attending the leks each year. While we suspect we know the location of most leks, new leks are discovered each year. In recent years the effort to monitor sage-grouse population trends has increased dramatically and therefore the number of known occupied leks has increased. However, we also know the numbers of inactive and unoccupied leks is increasing due to continued habitat disturbance and fragmentation primarily associated with increasing human infrastructure (subdivisions, roads, power lines, gas wells, compressor stations, etc.) and the activity associated with it. These impacts are being increasingly documented and quantified by research in Wyoming. The Wyoming Greater Sage-grouse Conservation Plan (2003) established an objective of a minimum of 1,650 known occupied leks and an average “count” of 28 males/lek. The average number of male sage-grouse observed on leks also indicates population trend if the number of leks is stable. From 2000-2004 the number of known occupied leks increased due to increased monitoring effort. At the same time the average number of males observed decreased, in large part to drought, but also due to increasing disturbance and fragmentation associated with natural gas development. In 2005 and 2006, the average number of males/lek greatly increased due to timely spring precipitation that resulted in larger hatches and high survival of chicks. Most of the increase occurred in habitats relatively undeveloped with human infrastructure. Some of the “new” leks documented in 2005 and 2006 were apparently the result of larger populations establishing new lek sites or reestablishing historical lek sites within suitable habitat. What has been accomplished: • The eight local sage-grouse working groups established in 2004 completed
preparation of their respective conservation plans in 2006 and 2007. The plans are currently being implemented utilizing a $1.1 million Wyoming General Fund appropriation together with other public and private funding sources. To date, nearly 50 individual projects have been implemented to benefit sage-grouse ranging from

126
on-the-ground habitat improvements, applied research, monitoring, and public outreach. While the recent sage-grouse population increases cannot be attributed to these projects, long-term monitoring will ultimately measure their effectiveness.
• The first annual statewide Job Completion Report for sage-grouse was prepared. This document is a compilation of sage-grouse population status and management reports from the eight conservation planning areas along with a statewide analysis. This document will aid in the analysis, interpretation and distribution of sage-grouse population and management information in Wyoming.
What we propose to improve performance in the next two years: • While weather events and the nation’s energy policy will greatly determine future
trends in Wyoming’s sage-grouse population, efforts to proactively manage sage-grouse and their habitats will continue via implementation of the eight local working group plans.
• In July 2007 Governor Freudenthal appointed a statewide Sage-grouse Implementation Team tasked to provide a list of actions that can be implemented quickly to benefit sage-grouse in Wyoming and provide additional justification for the USFWS to determine the Greater Sage-grouse is not warranted for listing under the Endangered Species Act of 1973 (ESA). This group has a more statewide perspective than the local working groups and will present its recommendations to the Governor in the fall of 2007. These recommendations and their implementation will affect the WGFD sage-grouse program and its priorities.
Data development agenda: While the number of occupied leks and average males/lek provide sage-grouse population trend information, it does not provide a statistically defensible population estimate. Efforts are underway within the Western Association of Fish and Wildlife Agencies Sage-Grouse Technical Committee to develop better population estimation techniques. Most of the outcomes of this sub-program are dependent on entities outside the Department’s control. These entities include a cadre of volunteers, Department employees outside the chain-of-command of this program, other State and Federal agencies and branches of government, corporations, and the weather.

127
Performance Measure #6: Trophy Game Conflict Management – Conflict response rate
0
20
40
60
80
100
Res
pons
e Pe
rcen
tage
2002 2003 2004 2005 2006
Calendar Year
Story behind the performance: The measure of this sub-program’s performance has been the response rate to the number of reported conflicts between trophy game animals and humans. Actions involved in responding to trophy game conflicts vary by incident type and severity, but may include relocating animals, removing animals, preventative measures, education, monitoring, investigation, or no action. Since 2002, the Trophy Game Conflict Management Section has responded to an average of 96 percent of the conflicts reported by the public. Some conflicts are reported well beyond the time when a response is appropriate and are only logged in the database. Because the section spends a great deal of time responding to conflicts, the number and nature of which are difficult to predict, personnel allow for a certain amount of uncommitted time in their annual work schedules, especially during the black and grizzly bear non-denning period. The number of conflicts managed annually constitutes a large percentage of, but not all, the duties and tasks for which the section is responsible. What has been accomplished: The section responded to 87 percent (n=145) of reported (n=166) conflicts between humans and black or grizzly bears during the reporting period. This response rate is nine percent less than the response rate during the five-year period from 2002-2006. The section investigated, managed or mitigated all conflicts where a response was appropriate. Some conflicts are reported long after the incident making a site response unnecessary. What we propose to improve performance in the next two years: • Continue to respond to and manage the majority of conflicts reported by the public. • Accommodate unplanned assignments. Data development agenda: We will continue to track the trend in number and types of conflicts as an index to response demand. The Conflict Management sub-program will determine its effectiveness by calculating the percentage of reported conflict situations responded to by section personnel.

128
Program: Strategic Management Division: Office of the Director Mission Statement: Facilitate the Department’s ability to make informed wildlife conservation decisions through improved future planning efforts and management effectiveness. Program Facts: The Strategic Management program is made up of one major sub-program, listed below with number of staff and 2007 (FY 07) budget: Sub-program # FTEs* 2007 Annual Budget
Strategic Management 1.0 $133,269 *Includes permanent and contract positions authorized in FY 07 budget. Any positions added during the budget cycle require Wyoming Game and Fish Commission authorization or must be funded from supplemental grants. This program is located in the Department Headquarters Office in Cheyenne. Primary Functions of the Strategic Management Program: • Facilitate the Department’s ability to make informed wildlife conservation
decisions through improved future planning efforts. By assisting in the development of strategic plans, we improve the Department’s ability to determine priorities and measure progress in achieving them.
• Facilitate the Department’s ability to make informed wildlife conservation decisions through improved management effectiveness. By applying social sciences to natural resource-related issues, we improve the Department’s ability to identify and understand a diverse group of stakeholders, thus leading to more informed and publicly supported management decisions.
Performance Measure #1: Percent of employees satisfied with services provided (Personnel in this program will work to ensure that at least 85% of employees are satisfied with the services provided).
0
20
40
60
80
100
% E
mpl
oyee
s Sa
tisfie
d
FY 03 FY 04 FY 05 FY 06 FY 07

129
Story behind the performance: The Strategic Management Coordinator works closely with other divisions within the Department to measure public satisfaction, Department effectiveness, public support, and trend forecasting. The Strategic Management Coordinator also assists management with the creation of and annual reporting on strategic plans. In addition, the Coordinator also assists with major Departmental tasks, such as public involvement. Receiving feedback from Departmental personnel regarding these services is critical in maintaining high quality products that meet the needs of the Department, and ultimately the demands of the public we serve. From July 2005 through September 2006, the permanent Strategic Management Coordinator was on Interagency Personnel Assignment with the U.S. Fish and Wildlife Service. During this period, a contract employee covered duties. Annually, the Internal Client Satisfaction survey is distributed to permanent personnel. The survey provides the opportunity for employees to measure the overall performance of 14 Department programs. In many respects, the ability of the Department to provide services to the external clients depends on the ability of employees to satisfy the needs of their internal clients. Since FY 03, an average of 88 percent of Department employees who had interacted with the Strategic Management Coordinator and responded to the question were satisfied with the services provided. During the given time period, FY 06 had the lowest satisfaction level among Department personnel in the past five years: 84 percent. In FY 07, that number rebounded, with 87 percent of employees who had interacted with the Strategic Management Coordinator indicating that they were satisfied with the services provided. The upswing in satisfaction in FY 07 is likely attributable to the return of the permanent Strategic Management Coordinator from the Interagency Personnel Assignment. Similar trends in results were also found relating to survey questions regarding (1) attention and timeliness and (2) courteousness and professionalism. For FY 07, both questions had slightly higher percentages of satisfied personnel, 91.8 percent and 92.1 percent respectively; both of which had higher five-year averages than related to services provided. The similarity in trend reflects the inter-relatedness of the questions and the influence that major workloads can have on the perceived performance of personnel. What we propose to improve performance in the next two years: • Establish a prioritized list of duties for each year, created jointly with administration.
When other tasks are assigned that were not originally on the prioritized list, examine their level of importance and reevaluate the list. Should it be determined that the proposed task not be a priority, in a timely and professional manner, clearly explain to requesting personnel the thought process behind the decision. This effort should improve communication between the Strategic Management Coordinator and Department personnel, reducing the potential for confusion and frustration.
• Create a streamlined process of submitting and compiling necessary information for both the Department’s Strategic Plan and Annual Report. By doing so, communication with the Strategic Management Coordinator should be improved,

130
adding to internal customer satisfaction both with that facet of collaboration and with overall services provided.
• Further identify the purview of the Strategic Management Coordinator to clarify the duties inherent to the position as well as anticipated time spent on each of the categories of duty in order to aid in the prioritization of project and recurring Departmental needs.
Program: Support Facilities and Personnel Division: Fiscal and Services Division Mission: Provide adequate administrative support services and workspace for Cheyenne headquarters and regional office personnel in Department facilities. Program Facts: The Support Facilities and Personnel Program is listed below with number of staff and 2007 (FY 07) budget: Sub-programs # FTEs* 2007 Annual Budget
Regional Office Management 19.5 $ 1,138,194 Headquarters and Regional Office Buildings 2.5 1,018,241
TOTAL 22.0 $ 2,156,435 *Includes permanent, contract and temporary positions authorized in the FY 07 budget. Any positions added during the budget cycle require Wyoming Game and Fish Commission authorization or must be funded from supplemental grants. This program is located in eight regional office locations statewide plus the Department Headquarters Office in Cheyenne. Primary Functions of the Support Facilities and Personnel Program: • Ensure administrative support levels at regional facilities to provide adequate
clerical, logistical and financial services for field personnel so that their primary functions can be satisfactorily completed.
• Ensure that office environments are adequate for Department employees by ensuring routine maintenance is performed and adequate office space is provided so employees can accomplish their primary job functions.
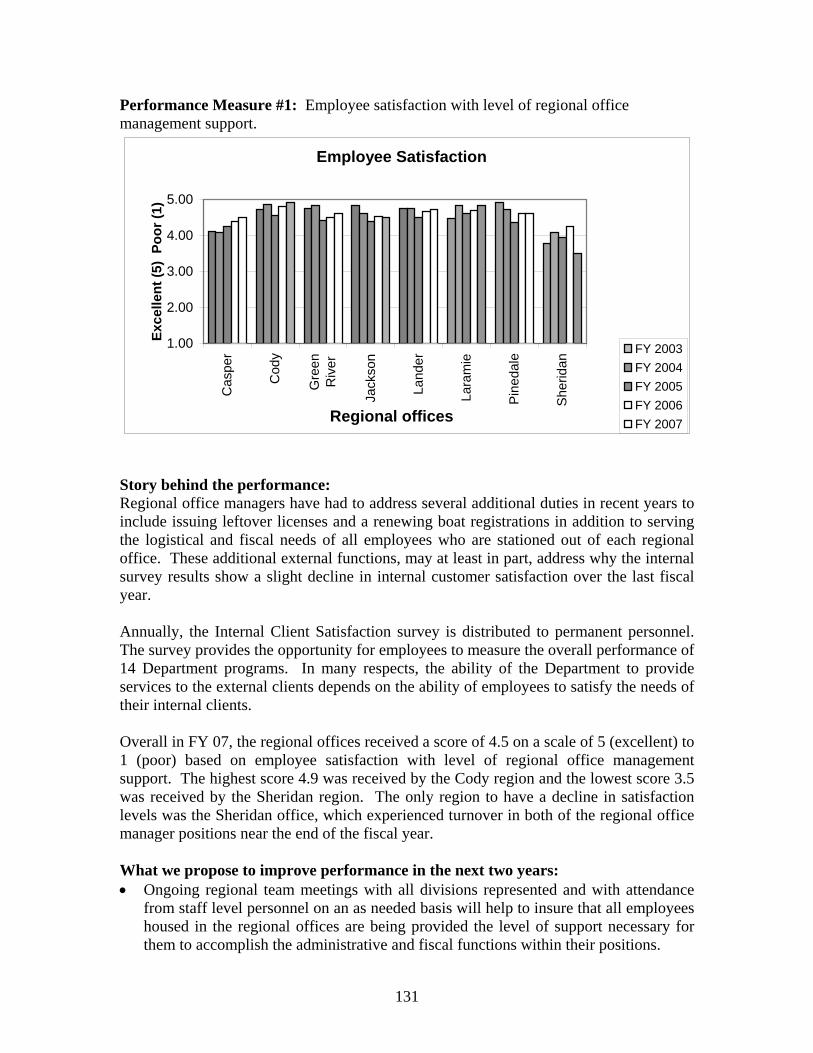
131
Performance Measure #1: Employee satisfaction with level of regional office management support.
Employee Satisfaction
1.00
2.00
3.00
4.00
5.00
Cas
per
Cod
y
Gre
enR
iver
Jack
son
Land
er
Lara
mie
Pin
edal
e
She
ridan
Regional offices
Exce
llent
(5)
Poor
(1)
FY 2003FY 2004FY 2005FY 2006FY 2007
Story behind the performance: Regional office managers have had to address several additional duties in recent years to include issuing leftover licenses and a renewing boat registrations in addition to serving the logistical and fiscal needs of all employees who are stationed out of each regional office. These additional external functions, may at least in part, address why the internal survey results show a slight decline in internal customer satisfaction over the last fiscal year. Annually, the Internal Client Satisfaction survey is distributed to permanent personnel. The survey provides the opportunity for employees to measure the overall performance of 14 Department programs. In many respects, the ability of the Department to provide services to the external clients depends on the ability of employees to satisfy the needs of their internal clients. Overall in FY 07, the regional offices received a score of 4.5 on a scale of 5 (excellent) to 1 (poor) based on employee satisfaction with level of regional office management support. The highest score 4.9 was received by the Cody region and the lowest score 3.5 was received by the Sheridan region. The only region to have a decline in satisfaction levels was the Sheridan office, which experienced turnover in both of the regional office manager positions near the end of the fiscal year. What we propose to improve performance in the next two years: • Ongoing regional team meetings with all divisions represented and with attendance
from staff level personnel on an as needed basis will help to insure that all employees housed in the regional offices are being provided the level of support necessary for them to accomplish the administrative and fiscal functions within their positions.

132
• Regional office managers can best handle workloads if administrators review and shift priorities, if needed, on an ongoing basis so that office managers can accommodate the level of support required.
Performance Measure #2: Employee satisfaction with the workspace provided by the facility in which employees are housed.
Employee Satisfaction
1.001.502.002.503.003.504.004.505.00
Cas
per
Cod
y
Gre
enR
iver
Jack
son
Land
er
Lara
mie
Pin
edal
e
She
ridan
Regional Office Facilities
Exce
llent
(5)
Poor
(1)
FY 2003FY 2004FY 2005FY 2006FY 2007
Story behind the performance: Department funding has been limited in recent years to address workspace issues at some regional offices. While most offices have been upgraded or replaced in the last fifteen years, the Pinedale office needs replaced and Cody office has limited storage and office space. It is believed that satisfaction levels at offices are directly proportional to the newness of the facility and amount of workspace provided employees. Annually, the Internal Client Satisfaction survey is distributed to permanent personnel. The survey provides the opportunity for employees to measure the overall performance of 14 Department programs. In many respects, the ability of the Department to provide services to the external clients depends on the ability of employees to satisfy the needs of their internal clients. Overall in FY 07, the regional offices received a score of 3.8 on a scale of 5 (excellent) to 1 (poor) based on employee satisfaction with the workspace provided by the facility in which they are housed. The highest score 4.8 was received by the Jackson region and the lowest score 2.0 was received by the Pinedale region.

133
What we propose to improve performance in the next two years: • Funds have been appropriated by the legislature to replace the Pinedale office.
Employees are scheduled to move into the larger and more updated facility in January 2008. Additionally, some repair work (flooring, carpeting and paint) was either done or planned for in 2008 in both the Cody and Sheridan offices, which had the next lowest scores.
• Office space needs in the Cheyenne office continue to be severe. While a study was conducted in 2002 to determine how these needs could be addressed, lack of Department funding has limited ability to implement these changes. The Department is requesting legislative funding in the 2008 session to both renovate and expand the existing facility.
Program: Wildlife Health and Laboratory Services Division: Services and Wildlife Mission: Use advanced technology and laboratory procedures to enhance and protect the integrity of Wyoming’s fish and wildlife resources. Program Facts: The Wildlife Health and Laboratory Services program is made up of two major sub-programs, listed below with number of staff and 2007 (FY 07) budget: Sub-programs # FTEs* 2007 Annual Budget Laboratory Services 7.5 ** $ 542,326 Veterinary Services 16.0 *** 1,433,241 TOTAL 23.5 $ 1,975,567 * Includes permanent, contract and temporary positions authorized in the FY 07 budget. ** Management Specialist is shared with Veterinary Services and is counted as one-half. *** Five of these positions are federally funded; the rest of the budget is paid for by general appropriations. The Laboratory Services sub-program was previously referred to as the Game and Fish Laboratory sub-program (Strategic Plan FY 04-FY 07, November 2003). Laboratory Services is located on the University of Wyoming campus. The Laboratory section of Veterinary Services is located at the Wyoming State Veterinary Lab. The headquarters and research unit is located at the Tom Thorne and Beth Williams Wildlife Research Unit at Sybille and numerous brucellosis biologists are located in Pinedale and Jackson. Primary Functions of the Wildlife Health and Laboratory Services Program: • Enhance and protect the integrity of Wyoming’s fish and wildlife resources by
monitoring, diagnosing, and reporting on diseases and implementing disease control

134
measures for wildlife and fish species the Department has statutory authority to regulate.
• Enhance and protect the integrity of Wyoming’s fish and wildlife resources through laboratory research, propagation, confinement, and confiscation facilities.
• Enhance and protect the integrity of Wyoming's fish and wildlife resources by providing timely and accurate information and essential laboratory and technological support in the areas of tooth aging, fish health, and wildlife forensics.
Performance Measure #1: Percent of employees satisfied with Laboratory sub-programs
Level of Courteousness and Professionalism:
0
20
40
60
80
100
% E
mpl
oyee
s Sa
tisfie
d
FY03 FY04 FY05 FY06 FY07
Fish Health Forensics Tooth Aging
Level of Attention and Timeliness:
0
20
40
60
80
100
% E
mpl
oyee
s Sa
tisfie
d
FY03 FY04 FY05 FY06 FY07
Fish Health Forensics Tooth Aging

135
Quality of Services:
0
20
40
60
80
100
% E
mpl
oyee
s Sa
tisfie
d
FY03 FY04 FY05 FY06 FY07
Fish Health Forensics Tooth Aging
Story behind the performance: Annually, the Internal Client Satisfaction survey is distributed to permanent personnel, providing employees the opportunity to measure the overall performance of Department programs. In many respects, the ability of the Department to provide services to the external clients depends on the ability of employees to satisfy the needs of their internal clients. For greater understanding of strengths and weaknesses and to facilitate the ability to make improvements where deemed feasible and necessary, questions related to the Laboratory sub-programs are divided into three sections: Fish Health, Forensics, and Tooth Aging. As most all of our clients are internal, this measure is one of the most important indicators of effectiveness of the Laboratory. The Laboratory provides big game tooth aging services to biologists. The Department uses this information for valuable population data and hunters are also made aware of the age of harvested animals. The Fish Health section maintains and improves the quality of fish health in the hatcheries and wild populations through annual inspections and vigilant attention to bacterial, viral and parasitic conditions of fishes. This also increases the wild and sport fishing opportunities in Wyoming, which aid in overall satisfaction of the public with the Department. Finally, Forensics aids in the conviction of suspected poachers by providing state of the art laboratory analysis of evidentiary items in the form of serological and DNA testing for species, gender identification, minimum number of animals and matching. In FY 07, among respondents that had interacted with personnel and responded to the specific questions, 100 percent of employees were either “Very Satisfied” or “Somewhat Satisfied” with the level of courteousness and professionalism exhibited by all three sections. When asked about the level of attention and timeliness, 96 percent of employees were either “Very Satisfied” or “Somewhat Satisfied” with Forensics, 96 percent with Fish Health, and 87 percent with Tooth Aging. Of those that had interacted

136
with the Laboratory personnel, 92 percent of employees were either “Very Satisfied” or “Somewhat Satisfied” with the quality of services offered by Forensics, 94 percent with Fish Health, and 80 percent satisfied with Tooth Aging. What has been accomplished: All three sections received a rating of 100 percent when internal customers were asked if they were treated courteously and professionally. This is the first time all three sections received 100 percent satisfaction in that area. Satisfaction with attention and timeliness was about the same for forensics and fish health but had declined slightly for tooth aging. All three sections had a lower than average result for the quality of services provided. The reduced level of satisfaction for tooth aging was not a surprise. During FY 07, the tooth aging coordinator hired in the fall failed to accomplish any work, fell behind schedule and was let go. As a result, the new coordinator came into the laboratory two months behind schedule. Although she did an excellent job of learning the techniques and there was assistance from other laboratory personnel in the process, the tooth results went out two weeks late. There was also some concern that the average age for moose was one year different than the last several years the teeth were aged. The cause of the decrease in the percentage of satisfaction in forensics and fish health is unknown. There are several suggestions for additional protocols our internal customers would like to see added to the laboratory protocols that are beyond our control, either due to large financial costs (e.g. our own ballistics laboratory) or scientific impossibility (e.g. genotyping on shed hairs). What we propose to improve performance in the next two years: • For the first time in several years, the laboratory is fully staffed with personnel who
have been in the laboratory a minimum of six to nine months. All personnel are well trained in their area of expertise and most have been crossed trained to some extent into all three sections. This should significantly decrease turn around time on analyses and increase internal client satisfaction. Due to increased salaries in all positions, permanent as well as At-Will Employee Contract (AWEC), the prospect of retaining trained technicians is greater.
• Two new molecular biology viral confirmatory tests on are currently being optimized. Performance Measure #2: Continuing education
0
50
100
150
200
250
300
350
400
Educ
atio
n U
nits
2003 2004 2005 2006 2007
Forensics (received) Forensics (given) Fish Health (received) Fish Health (given)

137
Story behind the performance: Due to the constant change of technology and available Laboratory services, it is of the utmost importance that Laboratory personnel stay up-to-date on all the latest techniques. This requires constant vigilance of current literature and continuing education classes/symposiums or seminars. In addition to the education of Laboratory personnel, it is important to educate the Laboratory’s customers on the technologies available and the best way to utilize the Laboratory’s services. This requires in-service training of Fish Health and Law Enforcement personnel. In the graph above, one unit of education is equal to one hour of instruction, given or received. Education units received and given were high in 2007 due to several facts, which are outlined in “What has been accomplished”. What has been accomplished: During FY 07, two students in the University of Wyoming’s self-directed forensic program utilized internships in the forensic section of the laboratory to acquire credits in order to receive their degrees. This required approximately 364 hours of training by forensic personnel, including; Dee Dee Hawk, Kim Sargeant, Ian Abernethy, and Justin Lairscey. The Fish Health Inspector, Hally Lukins was required to take two microbiology classes at the University of Wyoming to obtain the requirements for the American Fisheries Society certification as an inspector. Hally attended one four-hour class each semester of this fiscal year for a total of 196 hours. Kim Sargeant is currently enrolled in the Department’s education program and is enrolled in the University of Florida’s Forensic program. She obtained credits in two three-hour classes each semester this fiscal year. Fish health personnel also attended two in-service training meetings in FY 07 as well as the Fish Division Annual Meeting. The Fish Health Pathologist, Dave Money and the Fish Health Inspector, Hally Lukins gave presentations to Fish Division personnel at this meeting. Forensic personnel attended an in-service training at Black Hills State University in Spearfish, South Dakota. Dee Dee Hawk and Kim Sargeant also gave forensic presentations to Montana Fish Wildlife and Parks commissioned officers and all new law enforcement personnel of Wyoming Game and Fish Department as well as Colorado Division of Wildlife. What we propose to improve performance in the next two years: • Kim Sargeant, Program Manager of the Forensic section will continue her Masters in
DNA and Serology through the University of Florida. Anticipated graduation date is May 2009. With an increased knowledge of the capabilities of different forensic programs in the country, additional analyses may be evaluated and possibly brought on-line and made available to customers.
• Hally Lukins, in-training Fish Health Inspector, will be eligible for American Fisheries Society (AFS) certification by November 2007. In the process of her

138
training, she is working on becoming familiar with a diverse group of aquatic nuisance species.
• Education of the Department’s law enforcement personnel on the capabilities of the Laboratory will result in better utilization of the services provided. To accomplish this, every year we will provide training during orientation for new game warden trainees and wildlife technicians. In Fish Health, we will be on the agenda for orientation of all new Fish Division employees.
Performance Measure #3: Laboratory Productivity
Number of samples received:
0
200
400
600
800
FY03 FY04 FY05 FY06 FY07
Forensics
Forensics
02000400060008000
10000120001400016000
FY03 FY04 FY05 FY06 FY07
Fish Health
Fish Health
0
500
1000
1500
2000
2500
FY03 FY04 FY05 FY06 FY07
Tooth Aging
Tooth Aging

139
Number of tests performed:
0
2000
4000
6000
8000
10000
12000
FY03 FY04 FY05 FY06 FY07
Forensics
Forensics
0
5000
10000
15000
20000
25000
30000
35000
FY03 FY04 FY05 FY06 FY07
Fish Health
Fish Health
Story behind the performance: The number of samples submitted to the Laboratory is somewhat correlated to the efficiency and effectiveness of the Laboratory to the rest of the Department. As the number and types of procedures and protocols increase, and as we become more efficient, we can be of service to more and varied personnel and sections in the Department. The exception to the increase in procedures and protocols is Fish Health inspection. Those numbers will not change, unless hatcheries and feral populations are added or deleted. However, different procedures not directly correlated to hatchery inspections may increase the use of the Laboratory for more non-traditional applications. Law enforcement personnel submit the majority of samples received in the Forensic section. Samples come in the form of evidence, including, but not limited to, antlers, carcasses, hides, horns, clothing, arrows, bows, cans, or knives in a suspected poaching case. For the past ten years, there was a steady increase in the number of items submitted to the Forensic Section of the Laboratory as more law enforcement personnel became aware of the capabilities of the lab. The exception was 2004 when submissions actually decreased for an unknown reason, which resulted in fewer tests being performed. For the last three years, the number of submissions has remained relatively constant. It should be noted the manner in which tests were counted in Forensics changed in 2003 to more

140
closely correlate to the method used in Fish Health. Additional biological samples for species or gender identification are received in the Forensic section. Additional sample submission and tests conducted in this section should indicate an increase in assistance with law enforcement. This becomes important due to the potential for greater public awareness of the capabilities of the lab as a result of an increase in prosecution of poachers, thereby enabling assistance to the resource through deterrence. The majority of samples submitted to the Fish Health section of the Laboratory come from Laboratory personnel conducting fish health inspections at state and private hatcheries, as well as fish from feral spawning operations. These samples most often consist of kidney, spleen, ovarian or seminal samples, and fish heads. A small number of fish are submitted for necropsies. The number of inspections is set by Chapter 10 regulations of the Game and Fish Department and standards are set by the American Fisheries Society (AFS) Blue Book (the AFS Blue Book is a guide for Fish Health professionals which includes suggested procedures for the detection and identification of certain finfish and shellfish pathogens and USFWS/AFS-FHS standard procedures for aquatic animal health inspections including diagnosis of common bacterial, viral, parasitic, and mycotic infections). Therefore, this number remains relatively constant. In most instances, the number of tests conducted is directly correlated to the number of samples received in the Fish Health section. Both charts look similar because there is a small dip in the number of tests in 2002 and a large increase for 2004. The quality of the fish in the hatchery is affected by their disease status. If fish become sick or infected, they cannot be stocked out into the streams and lakes. This program is essential to maintaining the integrity of the fisheries in the state. It should be noted that numerous tests are performed on each sample in both the Fish Health section and the Forensic section. There is no set number of tests performed, as it is dependent on the sample type and the requested analysis by the submitting officer or biologist. This also accounts for the variability in the number of tests performed. The number of samples submitted to the Tooth Aging section of the Laboratory is equal to the number of test performed; therefore, the first figure comprises both statistics. Hunters and Department biologists submit these samples. What has been accomplished: During this fiscal year, forensic and fish health personnel optimized and validated a polymerase chain reaction test for Chytrid fungus. Fish Division typically submits these samples to an independent laboratory in Colorado. During the next fiscal year, a correlation study will be conducted between the two laboratories to determine if the same results are obtained from a herpetological sample. This is the final step in the validation process. Fish Health personnel helped develop and perform a critical step in the process to use of Aquaflor® (florfenicol) for treatment of bacterial coldwater disease in state hatcheries. Fish staff must receive a presumptive clinical diagnosis by the Fish Health Pathologist or Fish Health Inspector of Flavobacterium psychrophilum, the causative bacterial agent of

141
Coldwater Disease, in a lot (a lot is 60 fish of a particular species from one water source) of hatchery fish before treatment with Aquaflor® can be initiated. What we propose to improve performance in the next two years: • The Laboratory has set up a fund with the Wildlife Heritage Foundation called the
“Donation Fund for the Advancement of Wildlife Forensics”. A second automated sequencer will be purchased with this money. This will allow for decreased turn around time on casework, as well as, an increased ability to analyze databases. It will also result in an increased number of tests being analyzed in the Forensic section. Donations will be accepted in law enforcement cases, and outside agencies will be solicited for donations.
• Continue to work on expanding more open lines of communication between the Laboratory and the Wildlife and Fish Divisions by having annual coordination meetings with staff and the appropriate Laboratory personnel. Requests for new technical procedures will be evaluated and the feasibility of procedures studied. If appropriate, new procedures will be implemented in the Laboratory. During the meetings, deadlines will be set for each change. This will result in expanded use of the Laboratory.
• Additional disease confirmation tests will be implemented in the Fish Health section of the Laboratory, as outlined in the American Fisheries Society Blue Book. The Fish Health Inspector will work with the Forensic program manager to validate these analysis.
• Additional analysis in the area of tooth aging is not being pursued because of cost/resource limitations.
Performance Measure #4: Percent of elk calves ballistically vaccinated with Strain 19 on 22 of 23 elk feedgrounds in western Wyoming
0
20
40
60
80
100
% E
lk C
alve
s Va
ccin
ated
2001-2002 2002-2003 2003-2004 2004-2005 2005-2006
Winter
Story behind the performance: The Brucellosis-Feedground-Habitat (BFH) program was created in 1989 as an integrated approach to control brucellosis in free-ranging elk associated with feedgrounds. This approach combines four ongoing Department programs (feedground vaccination, feedground management, habitat enhancement, and elk/cattle separation) with the ultimate goal of eliminating brucellosis in elk and maintaining spatial and temporal separation of elk and cattle during potential brucellosis transmission periods.

142
In controlled studies, Brucella abortus strain 19 vaccination was shown to reduce abortion rates in elk. Ballistic strain 19 vaccination in elk was initiated in 1985 at the Greys River Feedground, and was expanded over the next 17 years to 21 of 22 state operated feedgrounds and the National Elk Refuge. Dell Creek feedground elk have never been vaccinated, as this population serves as a control to measure efficacy of the strain 19 vaccination program via brucellosis seroprevalence. This performance measure examines vaccination efforts in 22 distinct areas. During the height of elk feedground attendance of each winter, which is typically early February, elk are classified by age (e.g. calves/juveniles, cows, spike bulls, branch-antler bulls). A maximum number of juvenile elk are vaccinated on 22 of 23 feedgrounds annually. Biodegradable bullets composed of hydroxypropylcellulose and calcium carbonate and loaded with lyophilized strain 19 vaccine are ballistically implanted into the large muscle mass of the hindquarter, which dissolve within several hours. The percentages displayed in the graph above are based on the number of calves classified. Approximately 70,000 doses of vaccine have been administered to date. Vaccination efforts have resulted in over 95 percent calf coverage over the past three years. Some feedgrounds, such as Soda Lake, Bench Corral, and those in the Gros Ventre drainage, have poor elk attendance during light to moderate severity winters due to availability of native foraging opportunities. Elk must be concentrated on feed lines for the vaccination program to be effective. Thus, recent years’ vaccination coverage should be considered the maximum and increased effort will not increase percent of calves vaccinated. Since winter 2001-2002, an average of 93 percent of classified elk calves have been vaccinated. The winter of 2005-2006 yielded a slightly higher than average result with 97 percent vaccinated (3,768 elk calves). Efforts since winter 2003-2004 have yielded very high percentages of vaccinations. Poor habitat conditions and the early arrival of snow in winter 2003-2004 brought a greater number of elk on the feedgrounds (16,111). The ability to vaccinate 100 percent of elk calves that winter was likely attributable to deep snow conditions, resulting in greater tolerance of elk to disturbances associated with the vaccination effort. What has been accomplished: Strain 19 calfhood vaccination was again successful this winter with a majority of the feedgrounds reporting 100 percent calfhood coverage. Many feedgrounds reported over 100 percent coverage, which suggests yearling females were boosted at several areas. However, mild winter conditions coupled with low snow coverage contributed to poor coverage on several feedgrounds adjacent to native winter ranges (e.g., Green River Lakes feedground, Gros Ventre feedgrounds, etc.), which decreased the total percent vaccinated. A total of 2,091 calves were vaccinated on 19 state feedgrounds. What we propose to improve performance in the next two years: Although winter conditions and availability of native forage affect elk tolerance to the vaccination efforts, and are likely the primary factors influencing this performance

143
measure, BFH personnel will continue to maintain vaccination equipment in proper functioning condition and work closely with feedground personnel to ensure vaccination equipment is delivered promptly when conditions are most conducive for vaccination. Data development agenda: The percent of elk calves vaccinated for those classified on feedgrounds is important information to document the success of the strain 19-vaccination program delivery method. However, the successful delivery of the vaccine does not ensure the program is efficacious in reducing the occurrence of brucellosis in elk, specifically brucellosis transmission among elk and from elk to cattle. Current research using vaginal implant transmitters may be expanded to vaccinated and non-vaccinated feedgrounds to better determine abortion prevention rates afforded by strain 19 in marked elk. Performance Measure #5: Complete and rapid analysis and reporting of samples submitted for laboratory testing
0
2
4
6
8
10
12
Leng
th o
f Tim
e (w
eeks
)
1999 2001 2003 2005 2007
Calendar Year
Story behind the performance: Over the past nine years, the Wildlife Disease Laboratory has undergone some major shifts in its role and duties within the Wyoming Game and Fish Department. One of the major changes was the decision to do “in-house" testing for brucellosis using the federal standard brucellosis serologic tests. In conjunction with this, a cELISA was developed for the differentiation of field strain and vaccine strain antibodies. These assays were undertaken by the Laboratory to significantly decrease the reporting time and provide a complete brucellosis serology panel for feedground and hunter-killed elk surveillance. Over the past nine years, the reporting time has been reduced from over one year to less than a month. During test and slaughter operations, serologic results must be returned in less than 12 hours. In 2003, the Wildlife Disease Laboratory also adopted in-house testing for chronic wasting disease. Testing for this disease was traditionally conducted by the Wyoming State Veterinary Laboratory, but extended reporting times of six months or more made management actions impossible. Analysis for chronic wasting disease are now generally completed and reported in less than three weeks.

144
What has been accomplished: • The reduced reporting timeframe for brucellosis diagnostics by implementation of an
interactive database was scrapped due to the high cost of development. • Over the past year, the laboratory has instituted a quality control measure to track
serology results and samples. This was accomplished by utilizing barcodes and the current database. Results thus far have been very positive with improved accuracy in reporting and cataloging of storage.
• Through the budget process, the laboratory has submitted a request for two permanent positions to the legislature.
• The implementation of fee–for-service with the Wyoming State Veterinary Laboratory (WSVL) has been moderately successful. While the Wyoming Game & Fish Department is now paying for diagnostics, which has improved our relationship with WSVL, our case turn-around time has not been significantly improved. The mean final reporting time is between four and eight weeks, some cases are much, much longer. The WSVL has experienced a shortage of pathologists for the past two years, which has had a marked effect on case completion.
What we propose to improve performance in the next two years: • During FY 09 the Laboratory plans to continue the procedure implementation for
quality control and tracking of diagnostic serum samples by modification to the current labeling and tracking system.
• If the request for permanent positions is unsuccessful in the 2008 legislative session, the laboratory will continue efforts to convert contract positions to permanent to aid in the retention of competent and efficient Laboratory personnel.
• The Wyoming State Veterinary Laboratory is now in the process of hiring two new pathologists. It is anticipated this addition of personnel will result in a significant reduction in the amount of time necessary for diagnostic results to be made available to the Department case coordinator, and thus, a significant reduction in the amount of time between submission of the case and delivery of the final report. Dr. Cynthia Tate will be responsible for tracking the number of days between submission of a clinical case by a biologist and delivery of a final report.

APPENDIX A:
INDIVIDUAL MANAGEMENT PROGRAMS


BIG GAME
Pronghorn
Elk Mule Deer
White-tailed Deer Moose
Bighorn Sheep Rocky Mountain Goat
Bison


A-1
PRONGHORN
2006: Population: 564,580a Licenses Sold: 58,456 Population Objective: 461,950b License Revenue: $ 5,266,144 Harvest: 45,615 All Other Agency Revenue*: $ 2,637,115 Hunters: 47,642 Total Program Revenue: $ 7,903,259 Success Rate: 96% Program Costs: $ 3,167,032 Recreation Days: 151,874 Hunter Expenditures: 1 $ 17,527,792 Days/Animal: 3.3 Cost Dept. Per Animal: $ 69 Economic Return per Animal: $ 384 aStatewide population was calculated from 40 of 44 pronghorn herds. Population estimates for the other 4 herds were not available. bStatewide population objective calculated from 43 of 44 pronghorn herds. There is no objective for 1 herd. Wyoming’s statewide pronghorn population grew steadily the past four years, increasing 9.6 percent from 2005 to 2006. In 2006, the state population was estimated to be 564,580 animals compared to the objective of 461,950. The state population increased beyond its objective mainly because of hunter access limitations and the Department’s inability to issue sufficient licenses to obtain harvests that will control the species. Declining range conditions due to drought and extensive loss of habitat from escalating mineral development are of great concern to managers. The Department continues to monitor habitat conditions, recommend improvements where necessary, seek mitigation of habitat lost to development, and promote hunting seasons that move the population toward the objective. The Department increased license quotas in 2002-2006 in an attempt to reduce the number of animals the state’s drought-depleted habitats must support, however access restrictions continue to be impediments. The Department continues to work to improve hunter access through efforts such as the Private Lands Public Wildlife program. The 2006 harvest of 45,615 animals was a 15 percent increase over the 2005 harvest. Hunter effort decreased slightly to 3.3 days per animal harvested, equaling the five-year average.
Five-year trends in Wyoming's pronghorn program. Harvest, recreation and licenses issued are by calendar year. Revenue and costs are by fiscal year.
Year
Harvest
Rec. Days
Success
Days/ Animal
Lic. Sold
Lic. Rev. ($)
Mgmt. Costs ($)
Hunter ($) Expend.1
2002 30,260 101,989 91% 3.4 39,720 3,487,196 2,827,952 40,509,266
2003 34,393 109,948 93% 3.2 43,826 3,819,118 2,497,594 11,441,887
2004 36,383 113,577 96% 3.1 44,850 4,756,674 3,025,576 12,214,009
2005 39,526 132,625 93% 3.4 51,430 4,931,280 2,881,194 14,860,450
2006 45,615 151,874 96% 3.3 58,456 5,266,144 3,167,032 17,527,7921 Calculations prior to 2003 were based on the report, Wyoming 1997 Hunting Expenditures Survey, 1998. However, these calculations could not be reproduced. The 2004 calculations were derived from the report, Wyoming Resident and Nonresident Deer, Elk and Antelope Hunter Expenditure Survey, 2004. Data for this survey were collected during the 2003 season. Hunter Expenditure in 2004 was calculated from the 2003 cost per day expenditure, corrected for inflation using the Consumer Price Index (2003 per day expenditure x 1.033 = 2004 per day expenditure, 2003 per day expenditure x 1.068 = 2005 per day expenditure). *Includes allocated application fees, conservation stamp revenue, federal/other grants, and interest earned on Department cash balances.

A-2
ELK 2006: Population: 102,281a Licenses Sold: 57,682 Population Objective: 83,169 License Revenue: $ 7,677,240 Harvest: 21,680 All Other Agency Revenue*: $ 4,389,980 Hunters: 50,643 Total Program Revenue: $ 12,067,220 Success Rate: 43% Program Costs: $ 11,183,083 Recreation Days: 360,463 Hunter Expenditures: 1 $ 33,099,252 Days/Animal: 16.6 Cost Dept. Per Animal: $ 516 Economic Return per Animal: $ 1,527 aStatewide population was calculated from 28 of 35 elk herds. Population estimates for the other 7 herds were not available. The Department continues to manage for a reduction in Wyoming’s elk population. The population increased by 9 percent in 2006 and is now 23 percent above the statewide objective of 83,169 animals. The harvest increased 10 percent from 2005 to 2006 and was above the five-year average (21,093). Hunter success remained stable over the past five years at approximately 40 percent. Hunter effort (days/animal) decreased in 2006 and was well below the five-year average (18.3 days/animal). Overall, management strategies will continue to be focused on decreasing the population, however some herds are at objective and will be managed for their current numbers. Access continues to hamper obtaining adequate harvest in many herds. The Department will continue to work to improve hunter access.
Five-year trends in Wyoming's elk program. Harvest, recreation and licenses issued are by calendar year. Revenue and costs are by fiscal year.
Year
Harvest
Rec. Days
Success
Days/ Animal
Lic. Sold
Lic. Rev. ($)
Mgmt. Costs ($)
Hunter ($) Expend.1
2002 21,462 423,409 39% 19.7 62,013 6,310,310 8,550,907 83,316,849
2003 21,365 397,458 40% 18.6 59,428 7,415,739 8,837,890 33,213,218
2004 21,252 380,219 41% 17.9 58,182 7,733,361 8,833,834 32,802,943
2005 19,708 365,256 39% 18.5 56,550 7,565,022 10,789,073 32,562,491
2006 21,680 360,463 43% 16.6 57,682 7,677,240 11,183,083 33,099,2521 Calculations prior to 2003 were based on the report, Wyoming 1997 Hunting Expenditures Survey, 1998. However, these calculations could not be reproduced. The 2004 calculations were derived from the report, Wyoming Resident and Nonresident Deer, Elk and Antelope Hunter Expenditure Survey, 2004. Data for this survey were collected during the 2003 season. Hunter Expenditure in 2004 was calculated from the 2003 cost per day expenditure, corrected for inflation using the Consumer Price Index (2003 per day expenditure x 1.033 = 2004 per day expenditure, 2003 per day expenditure x 1.068 = 2005 per day expenditure). *Includes allocated application fees, conservation stamp revenue, federal/other grants, and interest earned on Department cash balances.

A-3
MULE DEER 2006: Population: 521,070a Licenses Sold: 1 88,405 Population Objective: 564,650b License Revenue: 1 $ 9,319,734 Harvest: 40,067 All Other Agency Revenue*: $ 4,170,693 Hunters: 64,660 Total Program Revenue: $ 13,490,427 Success Rate: 62% Program Costs: $ 5,145,752 Recreation Days: 313,402 Hunter Expenditures: 2 $ 31,525,638 Days/Animal: 7.8 Cost Dept. Per Animal: $ 128 Economic Return per Animal: $ 787
aStatewide population was calculated from 36 of 39 mule deer herds. Population estimates for the other 3 herds were not available. bStatewide population objective calculated from 38 of 39 mule deer herds. There is no objective for 1 herd. Wyoming’s mule deer population increased 4 percent in 2006 and is now approximately 92 percent of the statewide objective. There is continuing concern about the persistent drought, the resulting poor range conditions and their effect on reproduction and survival. The Department will continue to monitor habitats and recommend improvements where necessary. Field personnel are proposing a further reduction in some herds to lessen the impacts of deer on drought-depleted browse plants until moisture conditions improve. However, further reducing mule deer numbers is counter-intuitive to some publics, and we are anticipating resistance to it despite its long-term benefits.
Harvest and hunter success increased in 2006. The 2006 harvest of 40,067 is well above the five-year average of 37,006, and the 62 percent success rate is well above its five-year average (57 percent). Hunter effort decreased in 2006 from 8.7 days per animal harvested to 7.8, approximately ½ day below the five-year average (8.7 days/animal). The Department has been working to address access and habitat issues through its Private Lands Public Wildlife program, habitat improvement projects and strong advocacy for mitigation of impacts related to mineral extraction. However, the greatest improvement in habitat conditions will come with improved moisture conditions.
Five-year trends in Wyoming's mule deer program. Harvest, recreation and licenses issued are by calendar year. Revenue and costs are by fiscal year.
Year
Harvest
Rec. Days
Success
Days/ Animal
Lic. Sold1
Lic. Rev. ($)1*
Mgmt. Costs ($)
Hunter ($) Expend.2
2002 37,580 349,753 55% 9.3 85,200 8,111,773 4,170,980 118,398,495
2003 35,382 328,720 54% 9.3 84,557 8,021,018 5,260,386 30,089,124
2004 36,733 299,922 58% 8.2 82,049 9,520,324 4,735,670 28,343,737
2005 35,266 307,256 57% 8.7 84,533 9,482,629 * 4,813,400 30,007,186
2006 40,067 313,402 62% 7.8 88,405 9,319,734 5,145,752 31,525,6381 Includes both mule deer and white-tailed deer. 2 Calculations prior to 2003 were based on the report, Wyoming 1997 Hunting Expenditures Survey, 1998. However, these calculations could not be reproduced. The 2004 calculations were derived from the report, Wyoming Resident and Nonresident Deer, Elk and Antelope Hunter Expenditure Survey, 2004. Data for this survey were collected during the 2003 season. Hunter expenditure in 2004 was calculated from the 2003 cost per day expenditure, corrected for inflation using the Consumer Price Index (2003 per day expenditure x 1.033 = 2004 per day expenditure, 2003 per day expenditure x 1.068 = 2005 per day expenditure). *Includes allocated application fees, conservation stamp revenue, federal/other grants, and interest earned on Department cash balances.

A-4
WHITE-TAILED DEER 2006: Population: 53,839a Licenses Sold: 1 88,405* Population Objective: 52,000b License Revenue: 1 $ 9,319,734* Harvest: 13,858 All Other Agency Revenue*: $ 4,170,693* Hunters: 24,636 Total Program Revenue: $13,490,427* Success Rate: 56% Program Costs: $ 456,980 Recreation Days: 107,181 Hunter Expenditures: 2 $ 10,823,317 Days/Animal: 7.7 Cost Dept. Per Animal: $ 33 Economic Return per Animal: $ 781 aStatewide population was calculated from 2 of 5 white-tailed deer herds. Population estimates for the other 3 herds were not available. bStatewide population objective calculated from 3 of 5 white-tailed deer herds. There is no objective for 2 herds. It is difficult to collect data on Wyoming’s white-tailed deer populations because of the habitats in which the species lives and its elusive behavior. Most white-tailed deer inhabit private lands in eastern Wyoming and along major watercourses in other parts of the state where access for hunting has become difficult to obtain and is often expensive. This adds to the difficulty of managing white-tailed deer. Management throughout the state is primarily dictated by local perceptions of deer numbers and by landowner tolerances. The white-tailed deer is an undesirable species to some landowners and hunters while to others it has a status similar to other big game species. The 2006 white-tailed deer harvest was 12% higher than the 2005 harvest, and hunter numbers increased by 5 percent from 2005. Hunter success increased in 2006 to 56 percent, while effort decreased slightly to 7.7 days/animal.
Five-year trends in Wyoming's white-tailed deer program. Harvest, recreation and licenses issued are by calendar year. Revenue and costs are by fiscal year.
Year
Harvest
Rec. Days
Success
Days/ Animal
Lic. Sold1
Lic. Rev. ($)1
Mgmt. Costs ($)
Hunter ($) Expend.2
2002 9,216 74,750 44% 8.9 85,200 8,111,773 436,408 25,530,820
2003 10,328 78,383 49% 7.6 84,557 8,021,018 362,474 7,197,675
2004 10,733 82,083 49% 7.6 82,049 9,520,324 412,043 7,790,860
2005 12,333 97,416 52% 7.9 84,533 * 9,482,629 * 520,579 9,550,710
2006 13,858 107,181 56% 7.7 88,405* 9,319,734* 456,980 10,823,3171 Includes both mule deer and white-tailed deer.
2 Calculations prior to 2003 were based on the report, Wyoming 1997 Hunting Expenditures Survey, 1998. However, these calculations could not be reproduced. The 2004 calculations were derived from the report, Wyoming Resident and Nonresident Deer, Elk and Antelope Hunter Expenditure Survey, 2004. Data for this survey were collected during the 2003 season. Hunter expenditure in 2004 was calculated from the 2003 cost per day expenditure, corrected for inflation using the Consumer Price Index (2003 per day expenditure x 1.033 = 2004 per day expenditure, 2003 per day expenditure x 1.068 = 2005 per day expenditure). 2005 Hunter expenditure was calculated from the 2005 cost per day expenditure, corrected for inflation using the Consumer Price Index (2005 per day expenditure x 1.03). *Includes allocated application fees, conservation stamp revenue, federal/other grants, and interest earned on Department cash balances.

A-5
MOOSE 2006: Population: 10,154a Licenses Sold: 768 Population Objective: 14,680 License Revenue: $ 174,964 Harvest: 636 All Other Agency Revenue*: $ 239,920 Hunters: 730 Total Program Revenue: $ 414,884 Success Rate: 87% Program Costs: $ 699,814 Recreation Days: 4,729 Hunter Expenditures: 1 $ 630,528 Days/Animal: 7.4 Cost Dept. Per Animal: $ 1,100 Economic Return per Animal: $ 991 aStatewide population was calculated from 8 of 10 moose herds. Population estimate for the other 1 herd was not available. Although Wyoming’s largest moose populations are in the west and northwest, moose occur in other areas of the state. The species has long been in the Bighorn Mountains; and it has expanded into the mountain ranges of south central Wyoming from an introduced population in northern Colorado, which is providing additional viewing and hunting opportunities.
Management strategies for moose in Wyoming are quite conservative, and as a result, success rates are traditionally excellent for those hunters fortunate enough to draw a license. The 2006 hunting season was the ninth year in which a restriction against harvesting a cow moose accompanied by a calf was in effect. This restriction has improved calf survival, which has the potential to increase hunting opportunities. However, recent declines in moose numbers in northwest Wyoming, for reasons that have yet to be fully understood, have resulted in dramatic population declines and license quota reductions over the past several years. In 2006, license quotas and harvest declined for a fifth year. Hunter success remained stable and hunter effort increased. The 2006 hunter success rate was slightly above average (86 percent), as was the 2006 effort rate (7.2 days/animal). Permit quotas for western hunt areas will be reduced again in 2007 in response to low population estimates.
Five-year trends in Wyoming's moose program. Harvest, recreation and licenses issued are by calendar year. Revenue and costs are by fiscal year.
Year
Harvest
Rec. Days
Success
Days/ Animal
Lic. Sold
Lic. Rev. ($)
Mgmt. Costs ($)
Hunter ($) Expend.1
2002 1,160 9,048 86% 7.8 1,386 263,800 617,427 1,863,146
2003 999 7,530 87% 7.5 1,189 252,323 646,341 939,520
2004 770 5,026 84% 6.5 927 218,524 1,004,466 638,793
2005 682 4,673 88% 6.9 798 214,029 928,822 604,914
2006 636 4,729 87% 7.4 768 174,694 699,814 630,5281 Calculations prior to 2003 were based on the report, 1989 Hunting and Fishing Expenditure Estimates for Wyoming, 1990. However, these calculations could not be reproduced. The 2003 calculations were derived from the report, Hunting and Trapping Expenditures in Wyoming During the 2001 Season, 2002 using average per day expenditures. Hunter expenditure was calculated from the 2001 cost per day expenditure, corrected for inflation using the Consumer Price Index (2001 per day expenditure x 1.043 = 2003 per day expenditure, 2001 per day expenditure x 1.078 = 2004 per day expenditure, 2001 per day expenditure x 1.115 = 2005 per day expenditure). 2005 Hunter expenditure was calculated from the 2005 cost per day expenditure, corrected for inflation using the Consumer Price Index (2005 per day expenditure x 1.03). *Includes allocated application fees, conservation stamp revenue, federal/other grants, and interest earned on Department cash balances.

A-6
BIGHORN SHEEP 2006: Population: 5,609a Licenses Sold: 240 Population Objective: 7,685b License Revenue: $ 57,611 Harvest: 186 All Other Agency Revenue*: $ 348,441 Hunters: 219 Total Program Revenue: $ 406,052 Success Rate: 85% Program Costs: $1,199,696 Recreation Days: 1,654 Hunter Expenditures: 1 $ 472,901 Days/Animal: 9.0 Cost Dept. Per Animal: $ 6,450 Economic Return per Animal: $ 2,542 aStatewide population was calculated from 9 of 14 bighorn sheep herds. Population estimates for the other 4 herds were not available. bStatewide population objective calculated from 12 of 14 bighorn sheep herds. There are no objectives for 2 herds. The estimated number of Wyoming’s bighorn sheep increased slightly (2 percent) in 2006. Larger herds maintained or slightly increased population levels while some smaller populations continued to struggle. Bighorn sheep are highly susceptible to severe weather events and disease outbreaks. Poor habitat conditions predispose bighorn sheep to these other mortality factors and limit population increases in some herds.
The 2006 bighorn sheep harvest was larger than 2005 (172) and equaled the five-year average (186). Hunter success increased 11 percent in 2006, placing it above the five-year average (81 percent). Hunter effort decreased and was well below the five-year average (11.3 days/animal harvested).
The Department will continue to set conservative bighorn sheep hunting seasons. It will continue to monitor disease, evaluate habitat conditions and implement habitat improvement projects for Wyoming’s bighorn sheep.
Five-year trends in Wyoming's bighorn sheep program. Harvest, recreation and licenses issued are by calendar year. Revenue and costs are by fiscal year.
Year
Harvest
Rec. Days
Success
Days/ Animal
Lic. Sold
Lic. Rev. ($)
Mgmt. Costs ($)
Hunter ($) Expend.1
2002 183 2,558 77% 14.0 258 116,139 736,527 809,656
2003 183 2,192 78% 12.0 248 142,949 986,233 562,978
2004 205 2,089 89% 10.2 251 136,538 1,229,246 554,780
2005 172 1,923 74% 11.2 236 130,853 1,066,634 533,798
2006 186 1,654 85% 9.0 240 57,611 1,199,696 472,9011 Calculations prior to 2003 were based on the report, 1989 Hunting and Fishing Expenditure Estimates for Wyoming, 1990. However, these calculations could not be reproduced. The 2003 calculations were derived from the report, Hunting and Trapping Expenditures in Wyoming During the 2001 Season, 2002 using average per day expenditures. Hunter expenditure was calculated from the 2001 cost per day expenditure, corrected for inflation using the Consumer Price Index (2001 per day expenditure x 1.043 = 2003 per day expenditure, 2001 per day expenditure x 1.078 = 2004 per day expenditure, 2001 per day expenditure x 1.115 = 2005 per day expenditure). 2005 Hunter expenditure was calculated from the 2005 cost per day expenditure, corrected for inflation using the Consumer Price Index (2005 per day expenditure x 1.03). *Includes allocated application fees, conservation stamp revenue, federal/other grants, and interest earned on Department cash balances.
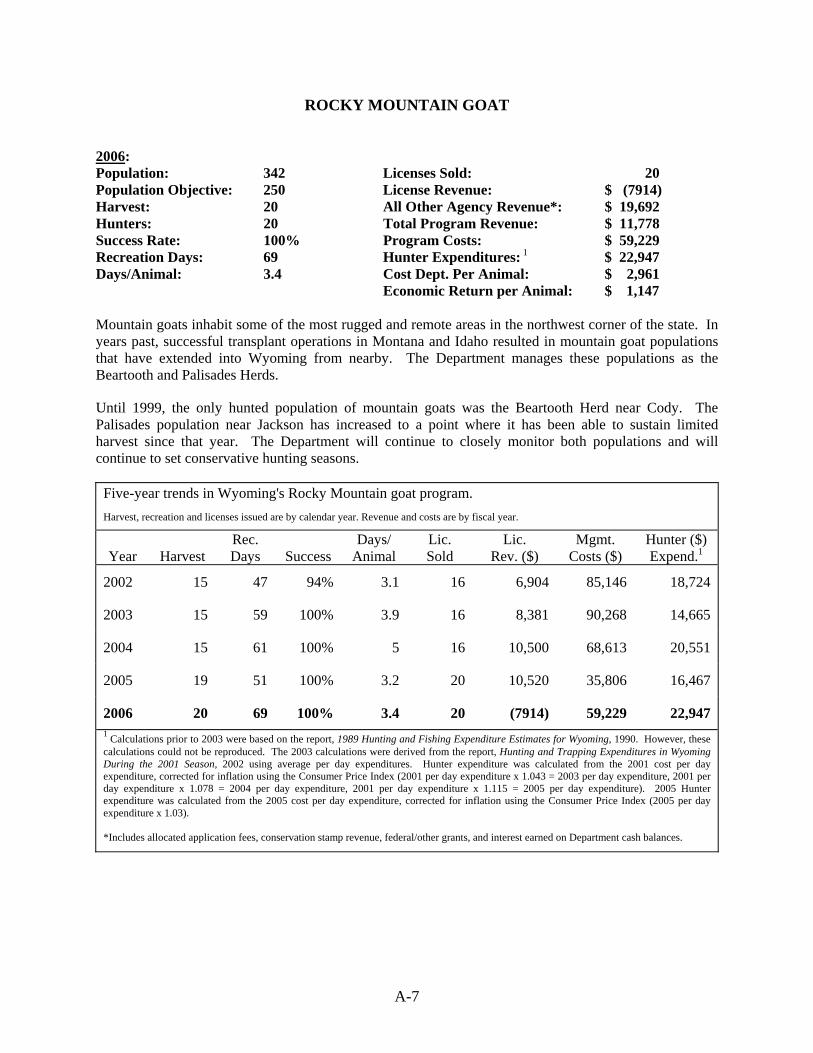
A-7
ROCKY MOUNTAIN GOAT 2006: Population: 342 Licenses Sold: 20 Population Objective: 250 License Revenue: $ (7914) Harvest: 20 All Other Agency Revenue*: $ 19,692 Hunters: 20 Total Program Revenue: $ 11,778 Success Rate: 100% Program Costs: $ 59,229 Recreation Days: 69 Hunter Expenditures: 1 $ 22,947 Days/Animal: 3.4 Cost Dept. Per Animal: $ 2,961 Economic Return per Animal: $ 1,147 Mountain goats inhabit some of the most rugged and remote areas in the northwest corner of the state. In years past, successful transplant operations in Montana and Idaho resulted in mountain goat populations that have extended into Wyoming from nearby. The Department manages these populations as the Beartooth and Palisades Herds.
Until 1999, the only hunted population of mountain goats was the Beartooth Herd near Cody. The Palisades population near Jackson has increased to a point where it has been able to sustain limited harvest since that year. The Department will continue to closely monitor both populations and will continue to set conservative hunting seasons.
Five-year trends in Wyoming's Rocky Mountain goat program. Harvest, recreation and licenses issued are by calendar year. Revenue and costs are by fiscal year.
Year
Harvest
Rec. Days
Success
Days/ Animal
Lic. Sold
Lic. Rev. ($)
Mgmt. Costs ($)
Hunter ($) Expend.1
2002 15 47 94% 3.1 16 6,904 85,146 18,724
2003 15 59 100% 3.9 16 8,381 90,268 14,665
2004 15 61 100% 5 16 10,500 68,613 20,551
2005 19 51 100% 3.2 20 10,520 35,806 16,467
2006 20 69 100% 3.4 20 (7914) 59,229 22,9471 Calculations prior to 2003 were based on the report, 1989 Hunting and Fishing Expenditure Estimates for Wyoming, 1990. However, these calculations could not be reproduced. The 2003 calculations were derived from the report, Hunting and Trapping Expenditures in Wyoming During the 2001 Season, 2002 using average per day expenditures. Hunter expenditure was calculated from the 2001 cost per day expenditure, corrected for inflation using the Consumer Price Index (2001 per day expenditure x 1.043 = 2003 per day expenditure, 2001 per day expenditure x 1.078 = 2004 per day expenditure, 2001 per day expenditure x 1.115 = 2005 per day expenditure). 2005 Hunter expenditure was calculated from the 2005 cost per day expenditure, corrected for inflation using the Consumer Price Index (2005 per day expenditure x 1.03). *Includes allocated application fees, conservation stamp revenue, federal/other grants, and interest earned on Department cash balances.

A-8
BISON 2006: Population: 1,085 Licenses Sold: 52 Population Objective: 400 License Revenue: $ 30,732 Harvest: 48 All Other Agency Revenue*: $ 33,890 Hunters: 52 Total Program Revenue: $ 64,622 Success Rate: 92% Program Costs: $ 21,928 Recreation Days: 273 Hunter Expenditures: 1 $ 46,301 Days/Animal: 5.7 Cost Dept. Per Animal: $ 457 Economic Return per Animal: $ 965 The bison population in the Jackson Herd has increased at a steady pace over the years to a size far greater than is reasonable. There has been a 89 percent increase since 2000. A post-harvest objective of 400 bison, based on a running five-year average, was established for this population. The Department shares management responsibility of the Jackson Herd with the National Elk Refuge, Grand Teton National Park, and the Bridger-Teton National Forest. Bison of the Jackson Herd spend summers in and around Grand Teton National Park, and most spend winters on the National Elk Refuge, hence making it difficult to harvest them. Hunters harvested 48 bison in 2006, following harvests of 36 bison in 2005, 31 in 2004, 40 in 2003, and 47 in 2002. License sales increased slightly in 2006, following a three-year decline. However, license sales still need to be increased in order to reduce this population to its objective. Hunter success in 2006 was 92 percent compared to 77 percent in 2005, 66 percent in 2004 and 71 percent in 2003. Hunter effort was 5.7 days per bison harvested, which is a substantial decrease from 7.5 days per bison harvested in 2005. Social and political concerns continue to influence management of the bison herd.
Five-year trends in Wyoming’s bison program. Harvest, recreation and licenses issued are by calendar year. Revenue and costs are by fiscal year.
Year Harvest Recreation Days
Licenses Sold
License Revenue ($)
Program Costs ($)
2002 47 126 59 22,740 26,313
2003 40 245 56 21,815 69,759
2004 31 100 52 24,173 33,162
2005 36 270 49 23,219 15,728
2006 48 273 52 30,732 21,9281 Calculations prior to 2003 were based on the report, 1989 Hunting and Fishing Expenditure Estimates for Wyoming, 1990. However, these calculations could not be reproduced. The 2003 calculations were derived from the report, Hunting and Trapping Expenditures in Wyoming During the 2001 Season, 2002 using average per day expenditures. Hunter expenditure was calculated from the 2001 cost per day expenditure, corrected for inflation using the Consumer Price Index (2001 per day expenditure x 1.043 = 2003 per day expenditure, 2001 per day expenditure x 1.078 = 2004 per day expenditure, 2001 per day expenditure x 1.115 = 2005 per day expenditure). 2005 Hunter expenditure was calculated from the 2005 cost per day expenditure, corrected for inflation using the Consumer Price Index (2005 per day expenditure x 1.03). *Includes allocated application fees, conservation stamp revenue, federal/other grants, and interest earned on Department cash balances.

TROPHY GAME
Black Bear
Grizzly Bear Mountain Lion


A-9
BLACK BEAR 2006: Population: Not available Licenses Sold: 2,986 Population Objective: Not available License Revenue: $ 191,889 Harvest: 280 All Other Agency Revenue*: $ 91,549 Hunters: 2,033 Total Program Revenue: $ 283,438 Success Rate: 14% Program Costs: $ 522,166 Recreation Days: 18,570 Hunter Expenditures: 1 $ 1,323,599 Days/Animal: 66.3 Cost Dept. Per Animal: $ 1,865 Economic Return per Animal: $ 4,727 Black bears occupy all the major mountain ranges of Wyoming, with the exception of the Black Hills. Most black bears are found in the northwestern part of the state, the Bighorn Mountains and the mountains of south central Wyoming. Black bears are hunted in Wyoming during the spring and fall. Successful bear hunters are required to report bear harvest to a Department game warden, wildlife biologist or regional office within three days of the harvest. Accurate harvest information is vital to management of black bears in Wyoming since other forms of data are hard to collect. The 2006 harvest is similar to the 2005 harvest (277 bears). Quotas have been increased in recent years to address increasing bear/human and bear/livestock conflicts. Bear/human conflicts are most often a result of the bears’ attraction or habituation to human related foods. At the same time, the chronic drought has undoubtedly affected bear food sources as much as it has those of other animals, which exacerbates the problem of bears seeking access to human related foods and coming into conflict. The 2006 hunter success rate was slightly higher than the previous year (2005 = 12 percent). The 2006 hunter effort decreased, and was well below average (73.8 days/animal harvested).
Five-year trends in Wyoming's black bear program. Harvest, recreation and licenses issued are by calendar year. Revenue and costs are by fiscal year.
Year
Harvest
Rec. Days
Success
Days/ Animal
Lic. Sold
Lic. Revenue ($)
Mgmt. Costs ($)
Hunter ($) Expend.1
2002 323 21,965 14% 68.0 2,907 146,045 809,961 2,333,475
2003 261 21,432 12% 82.1 2,890 161,373 466,154 1,438,738
2004 294 22,471 13% 76.4 2,949 171,414 480,138 1,505,337
2005 277 21,043 12% 76.0 2,904 174,576 482,313 1,456,180
2006 280 18,570 14% 66.3 2,986 191,889 283,438 1,323,5991 Calculations prior to 2003 were based on the report, 1989 Hunting and Fishing Expenditure Estimates for Wyoming, 1990. However, these calculations could not be reproduced. The 2003 calculations were derived from the report, Hunting and Trapping Expenditures in Wyoming During the 2001 Season, 2002 using average per day expenditures. Hunter expenditure was calculated from the 2001 cost per day expenditure, corrected for inflation using the Consumer Price Index (2001 per day expenditure x 1.043 = 2003 per day expenditure, 2001 per day expenditure x 1.078 = 2004 per day expenditure, 2001 per day expenditure x 1.115 = 2005 per day expenditure). 2005 Hunter expenditure was calculated from the 2005 cost per day expenditure, corrected for inflation using the Consumer Price Index (2005 per day expenditure x 1.03). *Includes allocated application fees, conservation stamp revenue, federal/other grants, and interest earned on Department cash balances.

A-10
GRIZZLY BEAR OBJECTIVES: To meet those parameters identified in the Conservation Strategy for the Grizzly Bear in the Yellowstone Area. To maintain at least 7,229 square miles of occupied grizzly bear habitat. To obtain the informed consent of all potentially affected interests in structuring the population objectives, management strategies, and regulations. The distribution of the Yellowstone grizzly bear population includes much of northwest Wyoming, mainly Yellowstone National Park and the Caribou-Targhee, Bridger-Teton, and Shoshone National Forests. The Yellowstone population was removed from ‘threatened’ status under the Endangered Species Act (ESA) in 2007. That population is now being managed according to state management plans developed by Wyoming, Montana and Idaho and approved by the U. S. Fish and Wildlife Service. The Yellowstone Ecosystem Subcommittee, which was responsible for recovery, has been replaced by the Yellowstone Grizzly Coordinating Committee, which will coordinate management according to the state plans and the population’s conservation strategy. A means to determine annual allowable sport harvest (in addition to agency conflict removals) has been established, and Wyoming is developing hunting strategies. The Department will continue to participate in all aspects of management of this population, including monitoring and conflict resolution.
Five-year trends in Wyoming’s grizzly bear program.
Fiscal Year Management Costs ($)
FY 2003 1,378,442
FY 2004 937,890
FY 2005 1,048,088
FY 2006 1,237,122
FY 2007 1,182,214

A-11
MOUNTAIN LION 2006: Population: Not available Licenses Sold: 1,553 Population Objective: Not available License Revenue: $ 68,542 Harvest: 186 All Other Agency Revenue*: $ 42,756 Hunters: Not available Total Program Revenue: $ 111,298 Success Rate:1 Not available Program Costs: $ 444,845 Recreation Days: 614a Hunter Expenditures: 2 $ 104,015 Days/Animal: 3.3 Cost Dept. Per Animal: $ 2,392 Economic Return per Animal: $ 559 aCalculated only from successful legal mountain lion hunters who reported days hunted Mountain lions are distributed throughout much of Wyoming and have been managed as a trophy game species in Wyoming since 1974. They prefer rugged foothills and mountainous terrain, which provide cover, den sites and suitable prey bases. Mountain lions are opportunistic predators within established and well-defended territories. Mountain lions have been managed in Wyoming through annual mortality quotas. When a hunt area harvest quota is reached, that area is closed for the remainder of the season. Annual harvest quotas have been adjusted in recent years to limit population growth and to address lion/human and lion/livestock incidents in some areas. The state mountain lion management plan approved by the Wyoming Game and Fish Commission in 2007 and implemented by the Department this year describes a ‘sink/stable/source’ strategy for managing mountain lions across the state in the future. The 2006 mountain lion harvest is 6 percent higher than 2005. Hunter effort increased substantially from 3.8 days per lion harvested in 2001 to 5.1 days per lion harvested in 2002, then decreased in 2003 to 4.0 days per lion harvested. Hunter effort declined again in 2004, then remained stable at 3.5 days per lion harvested in 2005. The 2006 effort rate declined again to 3.3 days per lion harvested, which is well below average (3.9 days/animal).
Five-year trends in Wyoming's mountain lion program. Harvest, recreation and licenses issued are by calendar year. Revenue and costs are by fiscal year.
Year
Harvest
Success1
Licenses Sold
License Revenue ($)
Mgmt. Costs ($)
Hunter Expend. ($)2, 3
2002 201 13% 1,545 61,627 499,805 13,128,9163
2003 199 12% 1,608 69,272 250,254 122,584
2004 181 12% 1,530 67,161 335,197 100,858
2005 175 11% 1,548 71,706 393,315 100,821
2006 186 12% 1,553 68,542 444,845 104,0151 Calculated based on the number of licenses sold. 2 Calculations prior to 2003 were based on the report, 1989 Hunting and Fishing Expenditure Estimates for Wyoming, 1990. These calculations could not be reproduced. The 2003 calculations were based on the report, Hunting and Trapping Expenditures in Wyoming During the 2001 Season, 2002 using average per day expenditures. Hunter expenditure for 2004 was calculated from the 2003 estimate, with inflation corrected for by using the Consumer Price Index (2003 per day expenditure x 1.033 = 2004 per day expenditure, 2003 per day expenditure x 1.068 = 2005 per day expenditure). 2005 Hunter expenditure was calculated from the 2005 cost per day expenditure, corrected for inflation using the Consumer Price Index (2005 per day expenditure x 1.03). 3 Starting in year 2000, recreation days are no longer estimated in the harvest survey; therefore, hunter expenditures for this year were recalculated to reflect the change. *Includes allocated application fees, conservation stamp revenue, federal/other grants, and interest earned on Department cash balances.

A-12

SMALL GAME
Cottontail
Snowshoe Hare Squirrel


A-13
COTTONTAIL 2006: Population: Not available Licenses Sold: **
Population Objective: Not available License Revenue: $ ** Harvest: 86,769 All Other Agency Revenue*: $ ** Hunters: 8,957 Total Program Revenue: $ ** Animals/Hunter: 9.7 Program Costs: $ ** Recreation Days: 30,603 Hunter Expenditures: 1 $ 7,855,370 Days/Animal: 0.4 Cost Dept. Per Animal: $ Not available Economic Return per Animal: $ 91 The cottontail rabbit is the most popular small game animal in Wyoming. It is found in a variety of habitats throughout the state including shrub communities, farmlands, and urban and suburban areas in middle to lower elevations. The cottontail population cannot be accurately monitored. Hunter success and harvest are directly associated with the dramatically cyclic nature of this species’ abundance.
The 2006 harvest statistics and general observations of cottontail abundance over the past year indicate that the population is fairly stable. Harvest increased from a low in 2002 to a high of 89,823 in 2005, then decreased slightly to 86,769 in 2006. Hunter numbers and recreation days both remained stable from 2005 to 2006. The number of animals harvested per hunter also remained stable from 2005. The number of days/animal increased slightly, but was below the five-year average (0.6 days/animal). The Department will continue to maintain liberal hunting seasons and bag limits since hunting has little effect on cottontail populations.
Five-year trends in Wyoming's cottontail program. Harvest, recreation and licenses issued are by calendar year. Revenue and costs are by fiscal year. Fiscal Year
Harvest
Rec. Days
Animal/ Hunter
Days/ Animal
Number Hunters
License Revenue ($)
Mgmt. Costs ($)
Hunter ($) Expend.1
2002 23,287 25,566 4.0 1.1 5,814 67,850 29,504 4,608,817
2003 34,996 18,655 7.2 0.5 4,882 ** ** 4,365,270
2004 47,531 20,872 7.8 0.5 6,076 ** ** 5,032,573
2005 89,823 30,842 10.0 0.3 8,967 ** ** 7,686,134
2006 86,769 30,603 9.7 0.4 8,957 7,855,370 **All small game and small game/game bird and migratory bird license revenue and expenditure information is shown on the pheasant schedule as separate information is not available due to combination licenses. 1 Based on the report, 1989 Hunting and Fishing Expenditure Estimates for Wyoming, published in 1990 by University of Wyoming. Beginning in 2003, this figure was calculated using the report, Wyoming Small/Upland Game Bird Expenditure Survey, 2001 using average per day expenditures. Data for this survey were collected during the 1999 season. Hunter expenditure was calculated from the 1999 cost per day expenditure, corrected for inflation using the Consumer Price Index (1999 per day expenditure x 1.096 = 2003 per day expenditure, 1999 per day expenditure x 1.132 = 2004 per day expenditure, 1999 per day expenditure x 1.170 = 2005 per day expenditure). 2005 Hunter expenditure was calculated from the 2005 cost per day expenditure, corrected for inflation using the Consumer Price Index (2005 per day expenditure x 1.03). *Includes allocated application fees, conservation stamp revenue, federal/other grants, and interest earned on Department cash balances.

A-14
SNOWSHOE HARE 2006: Population: Not available Licenses Sold: **
Population Objective: Not available License Revenue: $ ** Harvest: 660 All Other Agency Revenue*: $ ** Hunters: 349 Total Program Revenue: $ ** Animals/Hunter: 1.9 Program Costs: $ ** Recreation Days: 999 Hunter Expenditures: 1 $ 256,429 Days/Animal: 1.5 Cost Dept. Per Animal: $ Not available Economic Return per Animal: $ 389 The snowshoe hare is distributed throughout most of the mountain coniferous forests of the state. Snowshoe hare hunting is not as popular as other small game hunting, and most snowshoes are likely taken incidentally during big game seasons. Snowshoe hare populations are cyclic, and hunter participation and harvest appear to follow population trends. During most years, fluctuations of hare populations are not consistent across the state; peak snowshoe harvest varies from region to region. The snowshoe harvest decreased from 2005, but was above the five-year average (545). More hunters harvested snowshoe hares at a lower rate than in 2005 and invested slightly more effort. The number of hares harvested per hunter in 2006 was above the five-year average (1.7 animals/hunter), and the 2006 effort rate was well below the five-year average (2.2 days/animal).
Five-year trends in Wyoming's snowshoe hare program. Harvest, recreation and licenses issued are by calendar year. Revenue and costs are by fiscal year. Fiscal Year
Harvest
Rec. Days
Animal/ Hunter
Days/ Animal
Number Hunters
License Revenue ($)
Mgmt. Costs ($)
Hunter ($) Expend.1
2002 609 1,505 1.6 2.5 385 4,493 1,954 271,342
2003 410 1,171 1.3 2.9 319 ** ** 274,014
2004 343 1,004 1.0 2.9 347 ** ** 242,080
2005 703 815 2.9 1.2 239 ** ** 203,106
2006 660 999 1.9 1.5 349 256,429 **All small game and small game/game bird and migratory bird license revenue and expenditure information is shown on the pheasant schedule as separate information is not available due to combination licenses. 1 Based on the report, 1989 Hunting and Fishing Expenditure Estimates for Wyoming, published in 1990 by University of Wyoming. Beginning in 2003, this figure was calculated using the report, Wyoming Small/Upland Game Bird Expenditure Survey, 2001 using average per day expenditures. Data for this survey were collected during the 1999 season. Hunter expenditure was calculated from the 1999 cost per day expenditure, corrected for inflation using the Consumer Price Index (1999 per day expenditure x 1.096 = 2003 per day expenditure, 1999 per day expenditure x 1.132 = 2004 per day expenditure, 1999 per day expenditure x 1.170 = 2005 per day expenditure). 2005 Hunter expenditure was calculated from the 2005 cost per day expenditure, corrected for inflation using the Consumer Price Index (2005 per day expenditure x 1.03). *Includes allocated application fees, conservation stamp revenue, federal/other grants, and interest earned on Department cash balances.

A-15
SQUIRREL 2006: Population: Not available Licenses Sold: **
Population Objective: Not available License Revenue: $ ** Harvest: 1,212 All Other Agency Revenue*: $ ** Hunters: 367 Total Program Revenue: $ ** Animals/Hunter: 3.3 Program Costs: $ ** Recreation Days: 1,463 Hunter Expenditures: 1 $ 375,532 Days/Animal: 1.2 Cost Dept. Per Animal: $ Not available Economic Return per Animal: $ 310 Red squirrels occupy mountain coniferous forests at mid to upper elevations throughout the state. Fox squirrels occupy low elevation deciduous forests, cottonwood-riparian areas and agricultural and urban areas. Squirrel hunter participation increased while harvest decreased in 2006. In 2006, a total of 367 hunters harvested 1,212 squirrels. Hunters invested more effort per squirrel harvested in 2006 than 2005, and each hunter harvested about 1 squirrel less during the 2006 season than in 2005. Squirrel hunting in Wyoming is not as popular as it is in other parts of the country. In Wyoming, most squirrel harvest is incidental to other hunting pursuits. The Department will maintain liberal season structures since hunting has little effect on squirrel populations.
Five-year trends in Wyoming's squirrel program. Harvest, recreation and licenses issued are by calendar year. Revenue and costs are by fiscal year. Fiscal Year
Harvest
Rec. Days
Animal/ Hunter
Days/ Animal
Number Hunters
License Revenue ($)
Mgmt. Costs ($)
Hunter ($) Expend.1
2002 1,637 1,313 3.6 0.8 455 5,310 2,309 236,721
2003 1,127 1,013 4.6 0.9 245 ** ** 237,042
2004 1,607 1,333 5.2 0.8 307 ** ** 321,408
2005 1,434 1,242 4.7 0.9 306 ** ** 309,519
2006 1,212 1,463 3.3 1.2 367 ** ** 375,532 **All small game and small game/game bird and migratory bird license revenue and expenditure information is shown on the pheasant schedule as separate information is not available due to combination licenses. 1 Based on the report, 1989 Hunting and Fishing Expenditure Estimates for Wyoming, published in 1990 by University of Wyoming. Beginning in 2003, this figure was calculated using the report, Wyoming Small/Upland Game Bird Expenditure Survey, 2001 using average per day expenditures. Data for this survey were collected during the 1999 season. Hunter expenditure was calculated from the 1999 cost per day expenditure, corrected for inflation using the Consumer Price Index (1999 per day expenditure x 1.096 = 2003 per day expenditure, 1999 per day expenditure x 1.132 = 2004 per day expenditure, 1999 per day expenditure x 1.170 = 2005 per day expenditure). 2005 Hunter expenditure was calculated from the 2005 cost per day expenditure, corrected for inflation using the Consumer Price Index (2005 per day expenditure x 1.03). *Includes allocated application fees, conservation stamp revenue, federal/other grants, and interest earned on Department cash balances.

A-16

UPLAND GAME
Pheasant
Gray Partridge Chukar
Sage Grouse Sharp-Tailed Grouse
Blue Grouse Ruffed Grouse
Mourning Dove Turkey


A-17
PHEASANT 2006: Population: Not available Licenses Sold: 29,923**
Population Objective: Not available License Revenue: $ 569,517** Harvest: 46,164 All Other Agency Revenue*: $ 1,416,956 ** Hunters: 11,017 Total Program Revenue: $ 1,986,473** Bird/Hunter: 4.2 Program Costs: $ 4,784,092** Recreation Days: 40,322 Hunter Expenditures: 1 $ 10,350,105 Days/Bird: 0.9 Cost Dept. Per Bird: $ 104 Economic Return per Bird: $ 224 Pheasants are not as abundant in Wyoming as they are in neighboring states, but there are many opportunities to harvest this popular upland game bird. Weather and habitat conditions are the primary influences on most of Wyoming’s pheasant populations. Pheasant hunting has improved considerably with the implementation and expansion of Wyoming’s Walk-In Access Program. The Department’s game wardens and biologists have played key roles in opening thousands of acres of private lands to hunting over the past few years. The majority of Wyoming’s pheasant hunting occurs in Goshen County in the southeastern part of the state, but there are other opportunities near Riverton, in the Bighorn Basin and in the Sheridan area. Established pheasant populations are supplemented by releases from the Department’s Downar and Sheridan Bird Farms. The 2006 pheasant season showed a major decrease in harvest, recreation days and number of hunters from 2005. Hunter effort rates have remained fairly constant since 2002. However, hunter success decreased in 2006. The 2006 harvest rate was below average (4.7 birds/hunter) while the effort rate equaled the average (0.9 days/bird).
Five-year trends in Wyoming's pheasant program. Harvest, recreation and licenses issued are by calendar year. Revenue and costs are by fiscal year. Fiscal Year
Harvest
Rec. Days
Bird/ Hunter
Days/ Bird
Number Hunters
License Revenue ($)
Mgmt. Costs ($)
Hunter ($) Expend.1
2002 31,831 28,999 4.7 0.9 6,816 79,544 895,270 3,935,817
2003 29,927 26,101 4.7 0.9 6,367 ** ** 6,107,634
2004 34,322 28,691 4.6 0.8 7,529 ** ** 6,917,859
2005 65,979 51,253 5.2 0.8 12,573 ** ** 12,772,760
2006 46,164 40,322 4.2 0.9 11,017 ** ** 10,350,105**All small game and small game/game bird and migratory bird license revenue and expenditure information is shown on the pheasant schedule as separate information is not available due to combination licenses. 1 Based on the report, 1989 Hunting and Fishing Expenditure Estimates for Wyoming, published in 1990 by University of Wyoming. Beginning in 2003, this figure was calculated using the report, Wyoming Small/Upland Game Bird Expenditure Survey, 2001 using average per day expenditures. Data for this survey were collected during the 1999 season. Hunter expenditure was calculated from the 1999 cost per day expenditure, corrected for inflation using the Consumer Price Index (1999 per day expenditure x 1.096 = 2003 per day expenditure, 1999 per day expenditure x 1.132 = 2004 per day expenditure, 1999 per day expenditure x 1.170 = 2005 per day expenditure). 2005 Hunter expenditure was calculated from the 2005 cost per day expenditure, corrected for inflation using the Consumer Price Index (2005 per day expenditure x 1.03). *Includes allocated application fees, conservation stamp revenue, federal/other grants, and interest earned on Department cash balances.

A-18
GRAY PARTRIDGE 2006: Population: Not available Licenses Sold: ** Population Objective: Not available License Revenue: $ ** Harvest: 1,582 All Other Agency Revenue*: $ ** Hunters: 925 Total Program Revenue: $ ** Bird/Hunter: 1.7 Program Costs: $ ** Recreation Days: 3,190 Hunter Expenditures: $ 818,829 Days/Bird: 2.0 Cost Dept. Per Bird: $ Not available Economic Return per Bird: $ 518 The gray (Hungarian) partridge, which is native to eastern Europe and central and southwest Asia, is most abundant in Sheridan County and the Bighorn Basin, but it can be found in many other parts of the state. The gray partridge was introduced to Wyoming in the early 1900s to provide additional hunting opportunity for the sportsmen of Wyoming. Wyoming’s gray partridge population has suffered from prolonged drought and its influence on habitat conditions. This species’ numbers have dropped considerably since the turn of the century. Between 1999 and 2003, harvest declined 90 percent, hunter numbers declined 82 percent, and recreation days declined 86 percent. Harvest and hunter numbers then increased in 2003, 2004 and 2005. In 2006, however, harvest and hunter numbers declined (55 percent and 47 percent, respectively). Because the gray partridge is very sensitive to drought and severe winters, weather conditions can dictate its abundance and, in turn, hunter activity. This is borne out in the harvest statistics of the past 5 years. Hunting is a minor influence on gray partridge populations. Like other upland game birds, nesting and brood rearing success from the summer preceding the hunting season play a major role in hunter success and participation.
Five-year trends in Wyoming's gray partridge program. Harvest, recreation and licenses issued are by calendar year. Revenue and costs are by fiscal year. Fiscal Year
Harvest
Rec. Days
Bird/ Hunter
Days/ Bird
Number Hunters
License Revenue ($)
Mgmt. Costs ($)
Hunter ($) Expend.1
2002 1,414 3,807 1.3 2.7 1,086 12,674 19,856 516,688
2003 1,719 2,360 2.5 1.4 676 ** ** 552,240
2004 2,607 3,355 2.6 1.3 993 ** ** 808,944
2005 3,520 5,335 2.0 1.5 1,750 ** ** 1,329,535
2006 1,582 3,190 1.7 2.0 925 ** ** 818,829**All small game and small game/game bird and migratory bird license revenue and expenditure information is shown on the pheasant schedule as separate information is not available due to combination licenses. 1 Beginning in 2003, this figure was calculated using the report, Wyoming Small/Upland Game Bird Expenditure Survey, 2001 using average per day expenditures. Data for this survey were collected during the 1999 season. Hunter expenditure was calculated from the 1999 cost per day expenditure, corrected for inflation using the Consumer Price Index (1999 per day expenditure x 1.096 = 2003 per day expenditure, 1999 per day expenditure x 1.132 = 2004 per day expenditure, 1999 per day expenditure x 1.170 = 2005 per day expenditure). 2005 Hunter expenditure was calculated from the 2005 cost per day expenditure, corrected for inflation using the Consumer Price Index (2005 per day expenditure x 1.03). *Includes allocated application fees, conservation stamp revenue, federal/other grants, and interest earned on Department cash balances.

A-19
CHUKAR 2006: Population: Not available Licenses Sold: ** Population Objective: Not available License Revenue: $ ** Harvest: 8,315 All Other Agency Revenue*: $ ** Hunters: 1,963 Total Program Revenue: $ ** Bird/Hunter: 4.2 Program Costs: $ ** Recreation Days: 6,558 Hunter Expenditures: $ 1,683,348 Days/Bird: 0.8 Cost Dept. Per Bird: $ Not available Economic Return per Bird: $ 202 The chukar partridge, which is native to Europe and Asia, was first released in Wyoming in the 1930s. Small populations of chukars are scattered throughout Wyoming in rocky, steep habitats, but the largest concentrations are found in the Bighorn Basin. Chukar populations have suffered from prolonged drought and have dropped considerably since 1999. Following a harvest decline of 10 percent in 2004, a harvest increase of 194 percent in 2005, chukar harvest decreased by 24 percent in 2006. Hunter numbers decreased 20 percent from 2005 to 2006. Recreation days decreased 21 percent from 2005 to 2006. The result for 2006 was a harvest per hunter that exceeded the average (3.4) and an effort rate that was below average (1.0 days/bird). Because the chukar is very sensitive to drought and severe winters, weather conditions can dictate its abundance and the resulting hunter interest. Hunting seems to play a minor role in chukar abundance. Like other upland game birds, nesting and brood rearing success from the summer preceding the hunting season play a major role in hunter success and participation.
Five-year trends in Wyoming's chukar program. Harvest, recreation and licenses issued are by calendar year. Revenue and costs are by fiscal year.
Fiscal Year
Harvest
Rec. Days
Bird/ Hunter
Days/ Bird
Number Hunters
License Revenue ($)
Mgmt. Costs ($)
Hunter ($) Expend.1
2002 3,244 3,921 2.4 1.2 1,369 15,976 25,030 532,219
2003 4,146 4,210 3.1 1.0 1,323 ** ** 985,140
2004 3,715 4,347 2.8 1.2 1,327 ** ** 1,048,131
2005 10,909 8,302 4.4 0.8 2,465 ** ** 2,068,941
2006 8,315 6,558 4.2 0.8 1,963 ** ** 1,683,348**All small game and small game/game bird and migratory bird license revenue and expenditure information is shown on the pheasant schedule as separate information is not available due to combination licenses. 1 Based on the report, 1989 Hunting and Fishing Expenditure Estimates for Wyoming, published in 1990 by University of Wyoming. Beginning in 2003, this figure was calculated using the report, Wyoming Small/Upland Game Bird Expenditure Survey, 2001 using average per day expenditures. Data for this survey were collected during the 1999 season. Hunter expenditure was calculated from the 1999 cost per day expenditure, corrected for inflation using the Consumer Price Index (1999 per day expenditure x 1.096 = 2003 per day expenditure, 1999 per day expenditure x 1.132 = 2004 per day expenditure, 1999 per day expenditure x 1.170 = 2005 per day expenditure). 2005 Hunter expenditure was calculated from the 2005 cost per day expenditure, corrected for inflation using the Consumer Price Index (2005 per day expenditure x 1.03). *Includes allocated application fees, conservation stamp revenue, federal/other grants, and interest earned on Department cash balances.

A-20
SAGE-GROUSE 2006: Population: Not available Licenses Sold: ** Population Objective: Not available License Revenue: $ ** Harvest: 12,920 All Other Agency Revenue*: $ ** Hunters: 5,412 Total Program Revenue: $ ** Bird/Hunter: 2.4 Program Costs: $ ** Recreation Days: 11,981 Hunter Expenditures: $ 3,075,359 Days/Bird: 0.9 Cost Dept. Per Bird: $ Not available Economic Return per Bird: $ 238 Depressed sage-grouse populations have been a concern for states within the historic range of the species since sharp declines were detected in the early 1990s. Wyoming’s sage-grouse populations are considered to be well below desired and historic levels. They continue to sustain the light harvest allowed by conservative season structures. Harvest has little effect on sage-grouse populations compared to the influence of habitat loss and condition. However, since 1995, sage-grouse seasons have been shortened and have opened later in the year to protect hens with broods. Closures have been in effect in parts of the state since 2000 to protect small populations in isolated or severely degraded habitats or where West Nile Virus caused significant declines in sage-grouse numbers in the Powder River Basin. Over the past 4 years, closures have been in effect in parts of the state. Sage-grouse seasons were again conservative in 2006. The 2006 harvest, hunter numbers, and recreation days remained similar to those in 2005. Harvest rate and effort also remained stable from 2005 to 2006. Harvest rate was above and hunter effort was below the five-year average (2.2 birds/hunter and 1.1 days/bird, respectively). The Department is participating in interstate sage-grouse conservation efforts. It will continue to monitor sage-grouse populations and to try to improve habitat conditions throughout the state.
Five-year trends in Wyoming's sage grouse program. Harvest, recreation and licenses issued are by calendar year. Revenue and costs are by fiscal year. Fiscal Year
Harvest
Rec. Days
Bird/ Hunter
Days/ Bird
Number Hunters
License Revenue ($)
Mgmt. Costs ($)
Hunter ($) Expend.1
2002 4,835 7,164 1.6 1.5 2,947 34,392 979,917 972,330
2003 5,263 5,946 2.1 1.1 2,504 ** ** 1,391,364
2004 11,783 13,296 2.2 1.1 5,436 ** ** 3,205,878
2005 13,176 12,176 2.5 0.9 5,231 ** ** 3,034,381
2006 12,920 11,981 2.4 0.9 5,412 ** ** 3,075,359**All small game and small game/game bird and migratory bird license revenue and expenditure information is shown on the pheasant schedule as separate information is not available due to combination licenses. 1 Based on the report, 1989 Hunting and Fishing Expenditure Estimates for Wyoming, published in 1990 by University of Wyoming. Beginning in 2003, this figure was calculated using the report, Wyoming Small/Upland Game Bird Expenditure Survey, 2001 using average per day expenditures. Data for this survey were collected during the 1999 season. Hunter expenditure was calculated from the 1999 cost per day expenditure, corrected for inflation using the Consumer Price Index (1999 per day expenditure x 1.096 = 2003 per day expenditure, 1999 per day expenditure x 1.132 = 2004 per day expenditure, 1999 per day expenditure x 1.170 = 2005 per day expenditure). 2005 Hunter expenditure was calculated from the 2005 cost per day expenditure, corrected for inflation using the Consumer Price Index (2005 per day expenditure x 1.03). *Includes allocated application fees, conservation stamp revenue, federal/other grants, and interest earned on Department cash balances.

A-21
SHARP-TAILED GROUSE 2006: Population: Not available Licenses Sold: ** Population Objective: Not available License Revenue: $ ** Harvest: 2,337 All Other Agency Revenue*: $ ** Hunters: 1,124 Total Program Revenue: $ ** Bird/Hunter: 2.1 Program Costs: $ ** Recreation Days: 3,502 Hunter Expenditures: $ 898,915 Days/Bird: 1.5 Cost Dept. Per Bird: $ Not available Economic Return per Bird: $ 385 Sharp-tailed grouse occur, and are harvested in, eastern Wyoming. Thousands of acres of marginal farmlands in the state were converted to wildlife habitat that benefits sharp-tailed grouse beginning in the mid 1980s through the Conservation Reserve Program. And, the Department’s Walk-In Access Program, begun in 1998, has greatly improved sharp-tailed grouse hunting opportunities. Several consecutive years of drought in Wyoming have impacted sharp-tailed grouse populations. The harvest increased 90 percent from 2004 to 2005, then decreased 14 percent between 2005 and 2006. However, the harvest in recent years is much less than it was near the turn of the century. The 2006 harvest was 80 percent less than the 2000 harvest and 41 percent less than the 2001 harvest. The numbers of hunters remained stable between 2005 and 2006 while recreation days decreased 6 percent. The success and effort rates also declined slightly in 2006, but they were better than average (2.0 birds/hunter and 2.0 days/bird, respectively).
Five-year trends in Wyoming's sharp-tailed grouse program. Harvest, recreation and licenses issued are by calendar year. Revenue and costs are by fiscal year. Fiscal Year
Harvest
Rec. Days
Bird/ Hunter
Days/ Bird
Number Hunters
License Revenue ($)
Mgmt. Costs ($)
Hunter ($) Expend.1
2002 1,376 3,658 1.7 2.7 821 9,581 39,304 496,450
2003 2,130 3,832 2.3 1.8 909 ** ** 896,688
2004 1,429 3,686 1.5 2.6 959 ** ** 888,754
2005 2,712 3,729 2.4 1.4 1,128 ** ** 929,304
2006 2,337 3,502 2.1 1.5 1,124 ** ** 898,915 **All small game and small game/game bird and migratory bird license revenue and expenditure information is shown on the pheasant schedule as separate information is not available due to combination licenses. 1 Based on the report, 1989 Hunting and Fishing Expenditure Estimates for Wyoming, published in 1990 by University of Wyoming. Beginning in 2003, this figure was calculated using the report, Wyoming Small/Upland Game Bird Expenditure Survey, 2001 using average per day expenditures. Data for this survey were collected during the 1999 season. Hunter expenditure was calculated from the 1999 cost per day expenditure, corrected for inflation using the Consumer Price Index (1999 per day expenditure x 1.096 = 2003 per day expenditure, 1999 per day expenditure x 1.132 = 2004 per day expenditure, 1999 per day expenditure x 1.170 = 2005 per day expenditure). 2005 Hunter expenditure was calculated from the 2005 cost per day expenditure, corrected for inflation using the Consumer Price Index (2005 per day expenditure x 1.03). *Includes allocated application fees, conservation stamp revenue, federal/other grants, and interest earned on Department cash balances.

A-22
BLUE GROUSE 2006: Population: Not available Licenses Sold: ** Population Objective: Not available License Revenue: $ ** Harvest: 9,324 All Other Agency Revenue*: $ ** Hunters: 4,051 Total Program Revenue: $ ** Bird/Hunter: 2.3 Program Costs: $ ** Recreation Days: 17,134 Hunter Expenditures: $ 4,398,063 Days/Bird: 1.8 Cost Dept. Per Bird: $ Not available Economic Return per Bird: $ 472 Blue grouse occupy most of Wyoming’s mountain conifer habitats, except for the Black Hills in the northeast corner of the state. They winter among conifers and migrate to lower altitudes with more open cover for the spring and summer. The Department maintains liberal hunting seasons and harvest limitations since hunting has little influence on blue grouse populations. Blue grouse numbers fluctuate primarily due to natural factors such as weather events and, to some degree, detrimental land management practices. Blue grouse harvest decreased for the first time in three years. Hunter numbers and recreation days also decreased. The 2006 harvest was 29 percent lower than in 2005, and the 2006 hunter number was 19 percent lower than in 2005. The 2006 harvest rate decreased and the effort rate increased from 2005. The harvest rate was below the five-year average (2.7 birds/hunter), and the effort rate was higher than the five-year average (1.6 days/bird).
Five-year trends in Wyoming's blue grouse program. Harvest, recreation and licenses issued are by calendar year. Revenue and costs are by fiscal year. Fiscal Year
Harvest
Rec. Days
Bird/ Hunter
Days/ Bird
Number Hunters
License Revenue ($)
Mgmt. Costs ($)
Hunter ($) Expend.1
2002 13,861 21,102 2.8 1.5 4,898 57,160 11,997 2,864,042
2003 11,421 15,566 3.3 1.4 3,456 ** ** 3,642,444
2004 12,550 20,176 2.4 1.6 5,290 ** ** 4,864,756
2005 13,076 19,782 2.6 1.5 4,986 ** ** 4,929,872
2006 9,324 17,134 2.3 1.8 4,051 ** ** 4,398,063 **All small game and small game/game bird and migratory bird license revenue and expenditure information is shown on the pheasant schedule as separate information is not available due to combination licenses. 1 Based on the report, 1989 Hunting and Fishing Expenditure Estimates for Wyoming, published in 1990 by University of Wyoming. Beginning in 2003, this figure was calculated using the report, Wyoming Small/Upland Game Bird Expenditure Survey, 2001 using average per day expenditures. Data for this survey were collected during the 1999 season. Hunter expenditure was calculated from the 1999 cost per day expenditure, corrected for inflation using the Consumer Price Index (1999 per day expenditure x 1.096 = 2003 per day expenditure, 1999 per day expenditure x 1.132 = 2004 per day expenditure, 1999 per day expenditure x 1.170 = 2005 per day expenditure). 2005 Hunter expenditure was calculated from the 2005 cost per day expenditure, corrected for inflation using the Consumer Price Index (2005 per day expenditure x 1.03). *Includes allocated application fees, conservation stamp revenue, federal/other grants, and interest earned on Department cash balances.

A-23
RUFFED GROUSE 2006: Population: Not available Licenses Sold: ** Population Objective: Not available License Revenue: $ ** Harvest: 5,545 All Other Agency Revenue*: $ ** Hunters: 2,165 Total Program Revenue: $ ** Bird/Hunter: 2.6 Program Costs: $ ** Recreation Days: 9,888 Hunter Expenditures: $ 2,538,114 Days/Bird: 1.8 Cost Dept. Per Bird: $ Not available Economic Return per Bird: $ 458 Ruffed grouse occupy the western and northern forests of Wyoming, including the Black Hills and the Uinta Mountains. They occupy dense, brushy habitats within mixed conifer and deciduous tree stands, usually in and along creek bottoms. The Wyoming Range and the mountainous areas around Jackson offer some of the best ruffed grouse habitat and provide the best hunting opportunities in Wyoming. The ruffed grouse harvest increased in 2006, but was below average (5,610). Hunter numbers also increased in 2006, as did recreation days. Hunter effort decreased and was slightly below average (1.9 days/bird). Hunter success increased, but was slightly below average (2.7 birds/hunter). Like blue grouse, ruffed grouse populations appear to be affected by weather, land use changes, timber management, and grazing practices, with hunting playing a minor role in population changes.
Five-year trends in Wyoming's ruffed grouse program. Harvest, recreation and licenses issued are by calendar year. Revenue and costs are by fiscal year. Fiscal Year
Harvest
Rec. Days
Bird/ Hunter
Days/ Bird
Number Hunters
License Revenue ($)
Mgmt. Costs ($)
Hunter ($) Expend.1
2002 5,564 10,565 2.6 1.9 2,175 25,383 5,327 1,433,883
2003 6,792 10,245 3.8 1.5 1,771 ** ** 2,397,330
2004 6,968 13,903 2.5 2.0 2,836 ** ** 3,352,236
2005 3,182 6,940 2.2 2.2 1,475 ** ** 1,729,517
2006 5,545 9,888 2.6 1.8 2,165 ** ** 2,538,114 **All small game and small game/game bird and migratory bird license revenue and expenditure information is shown on the pheasant schedule as separate information is not available due to combination licenses. 1 Based on the report, 1989 Hunting and Fishing Expenditure Estimates for Wyoming, published in 1990 by University of Wyoming. Beginning in 2003, this figure was calculated using the report, Wyoming Small/Upland Game Bird Expenditure Survey, 2001 using average per day expenditures. Data for this survey were collected during the 1999 season. Hunter expenditure was calculated from the 1999 cost per day expenditure, corrected for inflation using the Consumer Price Index (1999 per day expenditure x 1.096 = 2003 per day expenditure, 1999 per day expenditure x 1.132 = 2004 per day expenditure, 1999 per day expenditure x 1.170 = 2005 per day expenditure). 2005 Hunter expenditure was calculated from the 2005 cost per day expenditure, corrected for inflation using the Consumer Price Index (2005 per day expenditure x 1.03). *Includes allocated application fees, conservation stamp revenue, federal/other grants, and interest earned on Department cash balances.

A-24
MOURNING DOVE 2006: Population: Not available Licenses Sold: ** Population Objective: Not available License Revenue: $ ** Harvest: 32,807 All Other Agency Revenue*: $ ** Hunters: 2,461 Total Program Revenue: $ ** Bird/Hunter: 13.3 Program Costs: $ ** Recreation Days: 7,141 Hunter Expenditures: $ 1,832,997 Days/Bird: 0.2 Cost Dept. Per Bird: $ Not available Economic Return per Bird: $ 56 The mourning dove is the most abundant and widespread game bird in North America. More mourning doves are harvested throughout the country than all other game birds combined. The mourning dove occupies a wide variety of native habitats in Wyoming, as well as farmlands and urban areas. The Wyoming mourning dove harvest decreased 26 percent in 2006. Hunter numbers decreased 23 percent, and recreation days decreased 21 percent. The 2006 harvest rate was below and effort rate was equal to the five-year average (13.5 birds/hunter and 0.2 days/bird, respectively). Mourning dove harvest in Wyoming can be greatly reduced when cold weather in late August and early September causes early migration. Mourning dove hunting seasons are set at the national level by the U.S. Fish and Wildlife Service in accordance with the Migratory Bird Treaty. Concern over the decline in morning dove populations based on annual surveys has prompted the U.S. Fish and Wildlife Service to initiate efforts with the states throughout the Flyway system to develop a Morning Dove Strategic Harvest Management Plan. The plan will establish hunting season frameworks based on different population levels as determined through annual population surveys. To date seasons have generally been liberal since harvest was thought to have little impact on dove populations. Changes in habitat are thought to have the most impact on dove populations.
Five-year trends in Wyoming's mourning dove program.
Fiscal Year
Harvest
Rec. Days
Bird/ Hunter
Days/ Bird
Number Hunters
License Revenue ($)
Mgmt. Costs ($)
Hunter ($) Expend.1
2002 36,431 14,470 13.8 0.4 2,648 30,902 111,845 1,963,915
2003 27,837 5,978 13.4 0.2 2,078 ** ** 1,398,852
2004 32,142 7,645 13.0 0.2 2,471 ** ** 1,843,332
2005 44,280 9,080 13.9 0.2 3,194 ** ** 2,262,827
2006 32,807 7,141 13.3 0.2 2,461 ** ** 1,832,997 **All small game and small game/game bird and migratory bird license revenue and expenditure information is shown on the pheasant schedule as separate information is not available due to combination licenses. 1 Based on the report, 1989 Hunting and Fishing Expenditure Estimates for Wyoming, published in 1990 by University of Wyoming. Beginning in 2003, this figure was calculated using the report, Wyoming Small/Upland Game Bird Expenditure Survey, 2001 using average per day expenditures. Data for this survey were collected during the 1999 season. Hunter expenditure was calculated from the 1999 cost per day expenditure, corrected for inflation using the Consumer Price Index (1999 per day expenditure x 1.096 = 2003 per day expenditure, 1999 per day expenditure x 1.132 = 2004 per day expenditure, 1999 per day expenditure x 1.170 = 2005 per day expenditure). 2005 Hunter expenditure was calculated from the 2005 cost per day expenditure, corrected for inflation using the Consumer Price Index (2005 per day expenditure x 1.03). *Includes allocated application fees, conservation stamp revenue, federal/other grants, and interest earned on Department cash balances.

A-25
TURKEY 2006: Population: Not available Licenses Sold: 8,146 Population Objective: Not available License Revenue: $ 190,192 Harvest: 3,986 All Other Agency Revenue*: $ 221,793 Hunters: 6,904 Total Program Revenue: $ 411,985 Bird Hunter: 0.6 Program Costs: $ 211,984 Recreation Days: 20,519 Hunter Expenditures: $ 5,267,944 Days/Bird: 5.1 Cost Dept. Per Bird: $ 53 Economic Return per Bird: $ 1,322 The wild turkey was originally introduced to Wyoming in 1935 when New Mexico traded nine hens and six gobblers of the Merriam’s subspecies to Wyoming in exchange for sage grouse. Those first birds were released near Laramie Peak. Until recently, that has been the predominant subspecies in the state. Turkeys are found primarily in the southeastern, northeastern, and north-central portions Wyoming in riparian habitats on private land and in low elevation conifer habitats. Wild turkey translocations and favorable winter weather over the past decade have resulted in an abundance of turkeys spread over most habitats in the state that will support them. Recent introductions of the Rio Grande subspecies to riparian habitats have further expanded the species’ presence. The turkey harvest increased 3 percent and hunter numbers remained stable from 2005 to 2006. Hunter success remained stable and equaled the five-year average (0.6 birds/hunter). As the turkey population in Wyoming has increased under the generally favorable weather regime of the past several years, particularly the mild winters, managers have increased the number of hunt areas with general instead of limited quota licenses. As a result, hunter opportunity and harvest have increased.
Five-year trends in Wyoming's turkey program. Harvest, recreation and licenses issued are by calendar year. Revenue and costs are by fiscal year.
Fiscal Year
Harvest
Rec. Days
Bird/ Hunter
Days/ Bird
Number Hunters
License Revenue ($)
Mgmt. Costs ($)
Hunter ($) Expend.1
2002 2,815 16,845 0.5 5.6 5,688 141,915 272,393 2,847,492
2003 4,052 24,243 0.6 6.0 7,144 189,894 214,604 5,701,514
2004 3,956 22,238 0.6 5.6 7,094 180,837 304,936 5,358,017
2005 3,855 21,536 0.6 5.6 6,833 183,947 253,273 5,368,003
2006 3,986 20,519 0.6 5.1 6,904 190,192 211,984 5,267,944
1 Based on the report, 1989 Hunting and Fishing Expenditure Estimates for Wyoming, published in 1990 by University of Wyoming. Beginning in 2003, this figure was calculated using the report, Wyoming Small/Upland Game Bird Expenditure Survey, 2001 using average per day expenditures. Hunter expenditure for 2004 and 2005 were calculated from the 2003 estimate, with inflation corrected for by using the Consumer Price Index (2003 per day expenditure x 1.033 = 2004 per day expenditure, 2003 per day expenditure x 1.068 = 2005 per day expenditure, 1999 per day expenditure x 1.170 = 2005 per day expenditure). 2005 Hunter expenditure was calculated from the 2005 cost per day expenditure, corrected for inflation using the Consumer Price Index (2005 per day expenditure x 1.03). *Includes allocated application fees, conservation stamp revenue, federal/other grants, and interest earned on Department cash balances.

A-26

WATERFOWL
Duck Goose
Sandhill Crane Rail, Snipe, Coot

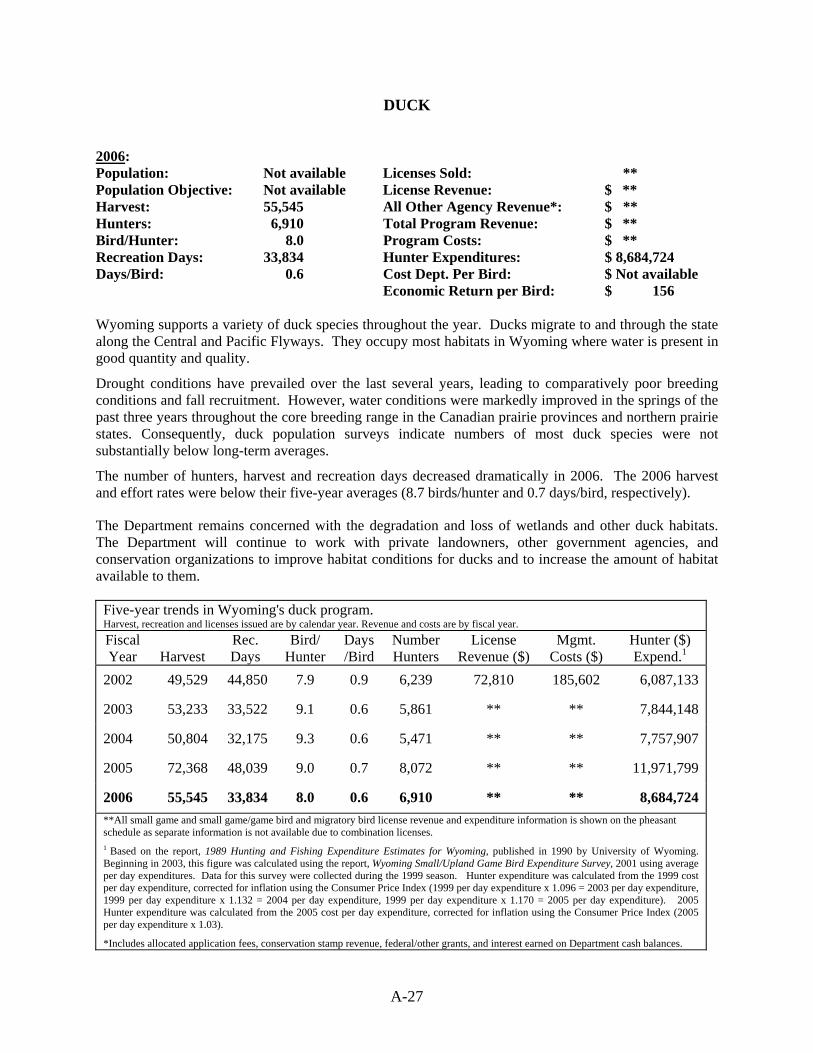
A-27
DUCK 2006: Population: Not available Licenses Sold: ** Population Objective: Not available License Revenue: $ ** Harvest: 55,545 All Other Agency Revenue*: $ ** Hunters: 6,910 Total Program Revenue: $ ** Bird/Hunter: 8.0 Program Costs: $ ** Recreation Days: 33,834 Hunter Expenditures: $ 8,684,724 Days/Bird: 0.6 Cost Dept. Per Bird: $ Not available Economic Return per Bird: $ 156 Wyoming supports a variety of duck species throughout the year. Ducks migrate to and through the state along the Central and Pacific Flyways. They occupy most habitats in Wyoming where water is present in good quantity and quality. Drought conditions have prevailed over the last several years, leading to comparatively poor breeding conditions and fall recruitment. However, water conditions were markedly improved in the springs of the past three years throughout the core breeding range in the Canadian prairie provinces and northern prairie states. Consequently, duck population surveys indicate numbers of most duck species were not substantially below long-term averages. The number of hunters, harvest and recreation days decreased dramatically in 2006. The 2006 harvest and effort rates were below their five-year averages (8.7 birds/hunter and 0.7 days/bird, respectively).
The Department remains concerned with the degradation and loss of wetlands and other duck habitats. The Department will continue to work with private landowners, other government agencies, and conservation organizations to improve habitat conditions for ducks and to increase the amount of habitat available to them.
Five-year trends in Wyoming's duck program. Harvest, recreation and licenses issued are by calendar year. Revenue and costs are by fiscal year. Fiscal Year
Harvest
Rec. Days
Bird/ Hunter
Days/Bird
Number Hunters
License Revenue ($)
Mgmt. Costs ($)
Hunter ($) Expend.1
2002 49,529 44,850 7.9 0.9 6,239 72,810 185,602 6,087,133
2003 53,233 33,522 9.1 0.6 5,861 ** ** 7,844,148
2004 50,804 32,175 9.3 0.6 5,471 ** ** 7,757,907
2005 72,368 48,039 9.0 0.7 8,072 ** ** 11,971,799
2006 55,545 33,834 8.0 0.6 6,910 ** ** 8,684,724**All small game and small game/game bird and migratory bird license revenue and expenditure information is shown on the pheasant schedule as separate information is not available due to combination licenses. 1 Based on the report, 1989 Hunting and Fishing Expenditure Estimates for Wyoming, published in 1990 by University of Wyoming. Beginning in 2003, this figure was calculated using the report, Wyoming Small/Upland Game Bird Expenditure Survey, 2001 using average per day expenditures. Data for this survey were collected during the 1999 season. Hunter expenditure was calculated from the 1999 cost per day expenditure, corrected for inflation using the Consumer Price Index (1999 per day expenditure x 1.096 = 2003 per day expenditure, 1999 per day expenditure x 1.132 = 2004 per day expenditure, 1999 per day expenditure x 1.170 = 2005 per day expenditure). 2005 Hunter expenditure was calculated from the 2005 cost per day expenditure, corrected for inflation using the Consumer Price Index (2005 per day expenditure x 1.03). *Includes allocated application fees, conservation stamp revenue, federal/other grants, and interest earned on Department cash balances.

A-28
GOOSE 2006: Population: Not available Licenses Sold: ** Population Objective: Not available License Revenue: $ ** Harvest: 22,748 All Other Agency Revenue*: $ ** Hunters: 6,344 Total Program Revenue: $ ** Bird/Hunter: 3.6 Program Costs: $ ** Recreation Days: 29,522 Hunter Expenditures: $ 7,577,893 Days/Bird: 1.3 Cost Dept. Per Bird: $ Not available Economic Return per Bird: $ 333 Goose hunting in Wyoming has been excellent for a number of years despite drought conditions that have affected water availability. Harvest of migratory populations of Canada geese is dependent on winter weather patterns which can affect the timing and extent of the migration and the number of birds available to hunters in the Central Flyway portion of Wyoming. Canada geese traditionally have provided most of the goose hunting in Wyoming, but expanding populations of lesser snow geese and liberalization of hunting opportunities to address their increase have provided hunters with more recreation, especially in late winter and early spring during the Light Goose Conservation Order seasons.
The 2006 harvest decreased 59 percent from 2005. Recreation days in 2006 decreased 41 percent from 2005, while the 2006 hunter success and effort rates were worse than average (4.7 birds/hunter and 1.2 days/bird). Liberal season lengths and bag limits designed to lower goose populations continue to afford hunters abundant harvest opportunities. The early goose season in the Pacific Flyway in September is designed to harvest local geese and address some damage problems associated with increasing goose numbers. Liberal seasons will continue, especially the late season Conservation Order for snow and other light geese, as the flyway councils attempt to lower populations to protect important nesting areas from overuse of sensitive forage plants.
Five-year trends in Wyoming's goose program. Harvest, recreation and licenses issued are by calendar year. Revenue and costs are by fiscal year. Fiscal Year
Harvest
Rec. Days
Bird/ Hunter
Days/ Bird
Number Hunters
License Revenue ($)
Mgmt. Costs ($)
Hunter ($) Expend.1
2002 22,337 32,110 3.9 1.4 5,708 66,613 431,698 4,358,092
2003 23,163 28,485 4.5 1.2 5,127 ** ** 6,665,490
2004 25,938 28,241 5.0 1.1 5,204 ** ** 6,809,357
2005 55,678 50,406 6.4 0.9 8,729 ** ** 12,561,679
2006 22,748 29,522 3.6 1.3 6,344 ** ** 7,577,893**All small game and small game/game bird and migratory bird license revenue and expenditure information is shown on the pheasant schedule as separate information is not available due to combination licenses. 1 Based on the report, 1989 Hunting and Fishing Expenditure Estimates for Wyoming, published in 1990 by University of Wyoming. Beginning in 2003, this figure was calculated using the report, Wyoming Small/Upland Game Bird Expenditure Survey, 2001 using average per day expenditures. Data for this survey were collected during the 1999 season. Hunter expenditure was calculated from the 1999 cost per day expenditure, corrected for inflation using the Consumer Price Index (1999 per day expenditure x 1.096 = 2003 per day expenditure, 1999 per day expenditure x 1.132 = 2004 per day expenditure, 1999 per day expenditure x 1.170 = 2005 per day expenditure). 2005 Hunter expenditure was calculated from the 2005 cost per day expenditure, corrected for inflation using the Consumer Price Index (2005 per day expenditure x 1.03). *Includes allocated application fees, conservation stamp revenue, federal/other grants, and interest earned on Department cash balances.

A-29
SANDHILL CRANE 2006: Population: Not available Licenses Sold: ** Population Objective: Not available License Revenue: $ ** Harvest: 194 All Other Agency Revenue*: $ ** Hunters: 305 Total Program Revenue: $ ** Bird/Hunter: 0.6 Program Costs: $ ** Recreation Days: 687 Hunter Expenditures: $ 176,343 Days/Bird: 3.5 Cost Dept. Per Bird: $ Not available Economic Return per Bird: $ 909 Two populations of Sandhill Cranes are found in Wyoming, the Rocky Mountain Greater Sandhill Crane and the Mid-Continent Sandhill Crane. Sandhill Cranes are managed in cooperation with various western states and the federal government. Most crane harvest occurs in the western part of Wyoming. The Rocky Mountain Population of Sandhill Cranes has increased in size with above average recruitment in the past few years. The Mid-Continent Population of Sandhill Cranes has been relatively stable since the early 1980s, but increased slightly over the past four years.
During the 2006 season, 305 hunters harvested 194 cranes in Wyoming. The success rate remained stable from 2005 to 2006, equaling the five-year average. Hunter effort was slightly below average in 2006 (3.6 days/animal harvested).
Five-year trends in Wyoming's Sandhill Crane program. Harvest, recreation and licenses issued are by calendar year. Revenue and costs are by fiscal year. Fiscal Year
Harvest
Rec. Days
Bird/ Hunter
Days/ Bird
Number Hunters
License Revenue ($)
Mgmt. Costs ($)1
Hunter ($) Expend.2
2002 132 437 0.6 3.3 210 2,451 44,203 59,295
2003 72 348 0.5 4.8 152 ** ** 81,432
2004 124 343 0.7 2.8 174 ** ** 82,703
2005 116 430 0.6 3.7 196 ** ** 107,160
2006 194 687 0.6 3.5 305 ** ** 176,343**All small game and small game/game bird and migratory bird license revenue and expenditure information is shown on the pheasant schedule as separate information is not available due to combination licenses. 1 Management costs are for both greater and lesser Sandhill crane. 2 Based on the report, 1989 Hunting and Fishing Expenditure Estimates for Wyoming, published in 1990 by University of Wyoming. Beginning in 2003, this figure was calculated using the report, Wyoming Small/Upland Game Bird Expenditure Survey, 2001 using average per day expenditures. Data for this survey were collected during the 1999 season. Hunter expenditure was calculated from the 1999 cost per day expenditure, corrected for inflation using the Consumer Price Index (1999 per day expenditure x 1.096 = 2003, 1999 per day expenditure x 1.132 = 2004 per day expenditure, 1999 per day expenditure x 1.170 = 2005 per day expenditure). 2005 Hunter expenditure was calculated from the 2005 cost per day expenditure, corrected for inflation using the Consumer Price Index (2005 per day expenditure x 1.03). *Includes allocated application fees, conservation stamp revenue, federal/other grants, and interest earned on Department cash balances.

A-30
RAIL, SNIPE, AND COOT 2006: Population: Not available Licenses Sold: ** Population Objective: Not available License Revenue: $ ** Harvest: 1,243 All Other Agency Revenue*: $ ** Hunters: 346 Total Program Revenue: $ ** Bird/Hunter: 3.6 Program Costs: $ ** Recreation Days: 1,207 Hunter Expenditures: $ 309,820 Days/Bird: 1.0 Cost Dept. Per Bird: $ Not available Economic Return per Bird: $ 249 Rail, snipe, and coot are harvested in both the Central and Pacific Flyways in Wyoming. Since these birds are not highly valued as game species or as food sources, the demand is low. Generally, these species are incidentally taken in conjunction with other migratory game birds and upland game birds.
Five-year trends in Wyoming's rail, snipe and coot program. Harvest, recreation and licenses issued are by calendar year. Revenue and costs are by fiscal year. Fiscal Year
Harvest
Rec. Days
Birds/ Hunter
Days/ Bird
Number Hunters
License Revenue ($)
Mgmt. Costs ($)
Hunter ($) Expend.1
2002 302 717 1.7 2.4 178 2,077 ** 97,362
2003 787 862 3.1 1.1 257 ** ** 201,708
2004 505 1,036 2.0 2.1 250 ** ** 249,796
2005 759 1,349 1.7 1.8 440 ** ** 336,184
2006 1,243 1,207 3.6 1.0 346 ** ** 309,820**All small game and small game/game bird and migratory bird license revenue and expenditure information is shown on the pheasant schedule as separate information is not available due to combination licenses. 1 Based on the report, 1989 Hunting and Fishing Expenditure Estimates for Wyoming, published in 1990 by University of Wyoming. Beginning in 2003, this figure was calculated using the report, Wyoming Small/Upland Game Bird Expenditure Survey, 2001 using average per day expenditures. Data for this survey were collected during the 1999 season. Hunter expenditure was calculated from the 1999 cost per day expenditure, corrected for inflation using the Consumer Price Index (1999 per day expenditure x 1.096 = 2003, 1999 per day expenditure x 1.132 = 2004 per day expenditure, 1999 per day expenditure x 1.170 = 2005 per day expenditure). 2005 Hunter expenditure was calculated from the 2005 cost per day expenditure, corrected for inflation using the Consumer Price Index (2005 per day expenditure x 1.03). *Includes allocated application fees, conservation stamp revenue, federal/other grants, and interest earned on Department cash balances. ** Because program costs were negligible, they are included with other waterfowl management costs.

FISHERIES
Sport Fisheries
Commercial Fisheries


A-31
SPORT FISHERIES 2006: Recreation Day Objectives: 2,778,000 License Revenue: $ 4,719,065 Recreation Days: 1 2,354,052 All Other Agency Revenue: $ 6,554,137 Fish/Day: 2.5 Total Program Revenue: $ 11,273,202 Licenses Sold: 357,662 Program Costs: $ 15,226,226 *** Economic Return Per Day: $79.82 Angler Expenditures: 1,2 $ 187,900,431 In 2006, Wyoming was estimated to have provided 2.354 million angler days. Overall, numbers of fishing licenses reversed a gradual five-year decline even though drought conditions continue to persist making many water unapproachable by boat or virtually dry and fishless. Due to technical issues related to data entry on fishing licenses, the WGFD has not been able to conduct detailed participation or expenditure surveys for anglers. As such, the 2001 National Survey of Fishing, Hunting, and Wildlife-Associated Recreation was used for information prior to 2006. Expenditure information form the preliminary findings report 2006 National Survey of Fishing, Hunting, and Wildlife-Associated Recreation (05/2007) was used for expenditures in 2006. Previous research conducted by the Fish Division has indicated that anglers fish primarily within the fisheries management region where they bought their license. Overall, the distribution of angling in the state is believed to have been 45 percent for flowing waters and 55 percent for standing waters.
Five-year trends in Wyoming's sport fisheries program.
Year
Recreation Days 1
Fish/Day
Licenses Sold
License Revenue ($)
Program Costs ($)
Angler Expenditure 1,2
2002 4,236,800 2.5 368,952 4,574,077 14,029,271 $ 609,552,859
2003 2,497,000 2.5 361,976 4,729,055 14,101,248 $ 220,625,790
2004 2,250,000 2.5 356,252 4,604,994 14,435,377 $ 205,472,974
2005 2,256,200 2.5 349,979 4,669,286 14,300,540 $ 213,111,011
2006 2,354,052 2.5 357,662 4,719,065 15,226,226 $187,900,431
1 In 2003, figures related to angler participation and expenditures were derived from the report, 2001 National Survey of Fishing, Hunting, and Wildlife Associated Recreation, issued in 2003. Estimates of average per day expenditures were corrected for inflation using the Consumer Price Index (2001 per day expenditure x 1.043 = 2003 per day expenditure, 2001 per day expenditure x 1.078 = 2004 per day expenditure, 2001 per day expenditure x 1.115 = 2005 per day expenditure). Program costs do not include a general fund appropriation received in 2005 for hatchery capital construction. Recreation days for 2005 were adjusted from values reported in the 2001 survey, based on number of licenses sold and the days fished per license. Expenditures per angler $79.82 are from the preliminary report 2006 National Survey of Fishing, Hunting, and Wildlife Associated Recreation, showing a decline in angler expenditures nationally. 2 Prior to 2003, angler expenditure figures were calculated to include non-licensed anglers, pioneers, and 6-13 year olds. However, these calculations could not be reproduced.
*** Does not include general fund capital construction dollars of $13.1 million for hatchery renovations in the FY07-08 biennium budget.

A-32
COMMERCIAL FISHERIES Objectives: The statewide objective for the program is to provide licensing, monitoring, and extension services for minnow seiners, private bait dealers, commercial hatcheries, and private fishing preserves. 2006: License Sold: 765 License Revenue: $ 23,484 All Other Agency revenue*: $ 3,997 Total Program Revenue**: $ 27,481 Program Costs*: $ 38,195 Live baitfish and seining permits continue to show a very gradual upward trend over the last four years. Licenses or permits sold for commercial fisheries interests during 2006 included: 73 fishing preserves, 13 commercial fish hatcheries, 619 seining, and 57 live bait dealers.
Five-year trends in Wyoming's commercial fisheries program.
Year
Licenses Sold
License Revenue ($)
Program Costs ($)
2002 682 $ 19,225 $ 17,674
2003 673 $ 19,682 $ 20,690
2004 705 $ 20,959 $ 43,615
2005 754 $ 23,894 $ 57,201
2006 765 $ 27,481 $ 38,195 * Beginning in 2000, all monetary information is for a fiscal year. Other information is tracked on calendar year schedule. ** Includes allocated application fees, conservation stamp revenue, federal/other grants, and interest earned on Game and Fish cash balances.

FURBEARERS
Bobcat Other Furbearers


A-33
BOBCAT
2006: Bobcat Harvest1: 3617 Licenses Sold 4: 1623 Bobcat Trappers2: 499 License Revenue: $ 61,448 Bobcats per Trappers3: 7.2 Other Agency Revenue*: $ 50,923 Recreation Days: NA Total Program Revenue: $112,371 Days/Animal: NA Program Costs: $ 404,019 Benefits to the State: 5 $ 13,310,921 Cost Dept. Per Animal: $ Not available Economic Return per Animal: $ Not available The bobcat is one of the most popular furbearing species in the state. The number of licenses sold and the bobcat harvest increased dramatically from 2002 to 2005, reflecting the increased value of pelts. The harvest rate (number of bobcats/trapper) also increased. Harvest dropped in 2006, although the number of trappers continued to increase, probably in anticipation of increased harvest success and pelt prices. Due to the poor response rate for the annual furbearer harvest survey over a period of years, the Department discontinued it in 2002. From that time on, bobcat harvest information has been collected as part of the Convention on International Trade of Endangered Species (CITES) requirements for bobcat pelt tagging. The Department relies on agency personnel who tag bobcats with CITES tags to collect information on age and sex of each bobcat and on effort values. This information is available for the annual CITES report and for Department use. This information is only for successful bobcat trappers, but it is more reliable than information collected previously through the furbearer harvest survey.
Five-year trends in Wyoming's furbearer program.
Bobcat Statistics Entire Furbearer Program Fiscal Year
Reported Harvest1
Bobcats/ Trapper2
Number Trappers3
Licenses Sold4
License Rev. ($)
Program Costs ($)
Benefits to the State ($)5
2002 1,847 3.0 240 1,289 46,045 223,555 2,572,645
2003 2,165 5.4 401 1,388 52,741 255,062 11,142,776
2004 3,120 7.3 425 1,454 59,031 267,776 11,516,695
2005 3,179 6.8 468 1,496 57,369 310,444 11,911,980
2006 3617 7.2 499 1,623 61,448 404,019 13,310,9211 The number of bobcats tagged in Wyoming. 2 The number of bobcats per successful trapper. 3 The number of trappers who had bobcats tagged. 4 The total number of furbearer licenses sold. 5 Calculations prior to 2003 were based on the report, 1989 Hunting and Fishing Expenditure Estimates for Wyoming, 1990. Includes estimated trapper expenditures and value of furs taken (based on total furs purchased). The 2003 calculations were based on the report, Hunting and Trapping Expenditures in Wyoming During the 2001 Season, 2002 using average per day expenditures. Hunter expenditure was calculated from the 2001 season cost per day expenditure, corrected for inflation using the Consumer Price Index (2001 per day expenditure x 1.043 = 2003 per day expenditure, 2001 per day expenditure x 1.078 = 2004 per day expenditure, 2001 per day expenditure x 1.115 = 2005 per day expenditure). 2005 Hunter expenditure was calculated from the 2005 cost per day expenditure, corrected for inflation using the Consumer Price Index (2005 per day expenditure x 1.03). *Includes allocated application fees, conservation stamp revenue, federal/other grants, and interest earned on Department cash balances.

A-34
OTHER FURBEARERS 2006: Furbearer Harvest: 35,809 Licenses Sold 2: 1623 Furbearer Trappers1: 947 License Revenue: $ 61,448 Furbearers per Trapper: 37.8 Other Agency Revenue*: $ 50,923 Recreation Days: NA Total Program Revenue: $ 112,370 Days/Animal: NA Program Costs: $ 404,019 Benefits to the State: 3 $ 13,310,921 Cost Dept. Per Animal: $ Not available Economic Return per Animal: $ Not available Besides bobcat, there are a variety of other fur bearing species in Wyoming. Coyote, red fox, beaver, muskrat, mink, badger, raccoon, striped skunk, weasel and marten are the most commonly harvested. Furbearer harvest levels are determined by fur prices and by species abundance. These factors, combined with harvest quotas (where used), ensure that trapping has little impact on furbearer populations. Due to the poor response rate for the annual furbearer harvest survey over a period of years, the Department discontinued it in 2002. However, the annual furbearer harvest survey has been restructured and was reinstated in 2005.
Five-year trends in Wyoming's furbearer program.
Other Furbearer Statistics Entire Furbearer Program Fiscal Year
Reported Harvest
Furbearers/ Trapper
Number Trappers1
Licenses Sold2
License Rev. ($)
Program Costs ($)
Benefits to the State ($)3
2002 --- --- --- --- --- --- ---
2003 --- --- --- --- --- --- ---
2004 --- --- --- --- --- --- ---
2005 27,761 45.6 623 1,496 57,369 310,444 11,911,980
2006 35,809 37.8 947 1,623 61,448 404,019 13,310,9211 includes bobcat trappers. 2 The total number of furbearer licenses sold. 3 Calculations prior to 2003 were based on the report, 1989 Hunting and Fishing Expenditure Estimates for Wyoming, 1990. Includes estimated trapper expenditures and value of furs taken (based on total furs purchased). The 2003 calculations were based on the report, Hunting and Trapping Expenditures in Wyoming During the 2001 Season, 2002 using average per day expenditures. Hunter expenditure was calculated from the 2001 season cost per day expenditure, corrected for inflation using the Consumer Price Index (2001 per day expenditure x 1.043 = 2003 per day expenditure, 2001 per day expenditure x 1.078 = 2004 per day expenditure, 2001 per day expenditure x 1.115 = 2005 per day expenditure). 2005 Hunter expenditure was calculated from the 2005 cost per day expenditure, corrected for inflation using the Consumer Price Index (2005 per day expenditure x 1.03). *Includes allocated application fees, conservation stamp revenue, federal/other grants, and interest earned on Department cash balances.

RAPTORS


A-35
RAPTORS OBJECTIVES: To provide a harvest, through capture, of 50 raptors annually. To maintain a harvest success rate of 50 percent, based on capture permits issued. There are approximately 31 species of raptors known or thought to occur within Wyoming’s borders. Raptors include hawks, owls, eagles, and vultures. Some species are present only seasonally, and densities vary with climatic conditions and prey abundance. In calendar year 2006, 16 raptors were captured in Wyoming for use in falconry with a 47 percent success rate. Eighteen resident licenses were issued and 6 birds were captured, for a capture success rate of 33 percent. Sixteen nonresident licenses were issued and 10 birds were captured, for a capture success rate of 63 percent.
Five-year trends in Wyoming’s Raptor Program Harvest, recreation and licenses issued are by calendar year. Revenue and costs are by fiscal year.
Fiscal Year
Capture
Success1
Licenses Sold2
License Revenue ($)
Program Costs ($)
2002 29 58% 50 4,495 58,004
2003 21 49% 43 6,245 135,319
2004 16 48% 33 5,674 133,707
2005 13 31% 41 5,292 128,083
2006 16 47% 34 5,279 104,9281Based on capture licenses sold. 2Includes permits to hunt with falcon.

A-36

NON-GAME PROGRAMS
AND NON-LICENSED USES


A-37
NONGAME PROGRAMS AND NON-LICENSED USES OF WILDLIFE Included under this heading are programs for trumpeter swan, bald eagle, peregrine falcon, black-footed ferret, wolverine, and lynx. The bald eagle and the peregrine falcon were deemed recovered and had Endangered Species Act protections removed (they were delisted) in 2007. The other species are either federally listed as threatened or endangered, or national political pressures are pressing for listing. All continue to require special management attention and intensive restoration efforts. The nongame program also includes planning, information and education, environmental commenting, inventories, and monitoring specifically for species of special concern such as black-tailed prairie dog, swift fox, common loon, harlequin duck, ferruginous hawk, merlin, colonial nesting water birds, long-billed curlew, mountain plover, and several bat species. The Nongame Section participates in and coordinates monitoring of many species during broader efforts such as the Breeding Bird Survey, Monitoring Avian Productivity and Survival Survey, and small mammal capture transects. Nongame personnel are also involved in many committees and working groups that coordinate interstate and intrastate planning and implementation efforts to maintain wildlife diversity. The Nongame Section has been, and will continue to be, intensively involved in the implementation of the Wyoming Comprehensive Wildlife Conservation Strategy (CWCS). The CWCS will, for the most part, direct the section’s inventory monitoring and survey activities from this point on. Data for 2002-2005 are based on the 2001 National Survey of Fishing, Hunting, and Wildlife-Associated Recreation, with inflation corrected for by using the Consumer Price Index. In 2006, non-consumptive users spent approximately $392.5 million in Wyoming. The final 2006 National Survey of Fishing, Hunting, And Wildlife-Associated Recreation report was not available at the time this was prepared, so recreation days spent in Wyoming were not available. The number of recreation days listed for 2002-2006 is carried over from the 2001 survey and it should be considered a minimum for each of those years. The Department’s “Wyoming’s Wildlife – Worth the Watching®” program has provided economic support for nongame, habitat, and non-consumptive projects. Department interpretive sites include the Tom Thorne/Beth Williams Wildlife Research Center at Sybille, Sheridan Visitor Center, Story Fish Hatchery, and Lander Visitor Center. Other interpretive efforts include signing at highway rest areas, cooperative Department/U.S. Forest Service signing, exhibits, nature trails on Department lands, The Wildlife Heritage Expo, and cooperative projects with some city governments. In addition, wildlife-viewing guides have been developed, and a variety of publications have been produced to inform and educate the public about nongame wildlife. Interactive educational programs include: Project WILD, O.R.E.O. (Outdoor Recreation Education Opportunities), BOW (Becoming and Outdoors Woman). Beginning in 2003, a percentage of the proceeds from the sale of big game licenses the Governor donates to conservation groups for fund raising are being made available for nongame programs in the state.

A-38
Trends in Wyoming's non-licensed uses of wildlife program.
Year Recreation Days Non-consumptive Users’ Expenditures ($)
20021
3,924,000
271,289,344
20031
3,924,000
276,323,033
20041
3,924,000
285,595,618
20051
3,924,000
295,398,065
20062
3,924,000
392,572,000 1 The number of recreation days and expenditures are reflective of those found in the report, 2001 National Survey of Fishing, Hunting, and Wildlife Associated Recreation, issued in 2003. Non-consumptive users’ expenditure was calculated from the 2001 survey, with inflation corrected for by using the Consumer Price Index (2001 expenditure x 1.024 = 2002 expenditure, 2001 expenditure x 1.043 = 2003 expenditure, 2001 expenditure x 1.078 = 2004 expenditure, 2001 expenditure x 1.115 = 2005 expenditure). 2 Recreation Days from the 2006 National Survey of Fishing, Hunting and Wildlife Associate Recreation are not yet available, so the value from the 2001 survey is used. Expenditures are from the 2006 survey.

APPENDIX B:
HUNTER AND ANGLER EXPENDITURE
Estimates of 2006 Expenditures in Wyoming
by Hunters and Anglers
Restitution Values of Game Animals


LICENSE HARVEST HUNTERS SUCCESS RECREATION DAYS/ LICENSES LICENSE TOTAL HUNTERRATE DAYS ANIMAL ISSUED SALES 1 EXPENDITURES 2
ANTELOPERESIDENT 17,145 19,332 88.7% 62,478 3.6 23,826 $539,033 $7,210,592NONRESIDENT 28,470 28,310 100.6% 89,396 3.1 34,630 $4,727,111 $10,317,201
MULE DEERRESIDENT 20,488 37,219 55.0% 190,697 9.3 53,401 $1,426,493 $19,182,534NONRESIDENT 19,579 27,441 71.3% 122,705 6.3 35,004 $7,893,241 $12,343,104
WHITE-TAILED DEERRESIDENT 8,551 15,667 54.6% 74,646 8.7 ------ ------ $7,537,878NONRESIDENT 5,307 8,969 59.2% 32,535 6.1 ------ ------ $3,285,439
ELKRESIDENT 16,875 41,297 40.9% 305,034 18.1 47,787 $1,941,384 $28,009,525NONRESIDENT 4,805 9,346 51.4% 55,429 11.5 9,895 $5,735,856 $5,089,727
MOOSERESIDENT 528 609 86.7% 4,131 7.8 636 $46,792 $550,795NONRESIDENT 108 121 89.3% 598 5.5 132 $128,172 $79,733
BIGHORN SHEEPRESIDENT 135 160 84.4% 1,323 9.8 179 $7,435 $378,264NONRESIDENT 51 59 86.4% 331 6.5 61 $50,176 $94,637
ROCKY MTN GOAT RESIDENT 15 15 100.0% 53 3.5 15 -$1,140 $17,626NONRESIDENT 5 5 100.0% 16 3.2 5 -$6,774 $5,321
BISONRESIDENT 41 44 93.2% 258 6.3 44 $14,267 $43,757NONRESIDENT 7 8 87.5% 15 2.1 8 $16,465 $2,544
BLACK BEARRESIDENT 220 1,796 12.2% 17,240 78.4 2,724 $107,654 $1,228,802NONRESIDENT 60 237 25.3% 1,330 22.2 262 $84,235 $94,797
MOUNTAIN LION 3 186 ------ ------ 614 3.3 1,553 $68,542 $104,015
TURKEYRESIDENT 2,703 5,086 53.1% 15,477 5.7 6,089 $73,570 $3,973,486NONRESIDENT 1,283 1,818 70.6% 5,042 3.9 2,057 $116,622 $1,294,457
LICENSE HARVEST HUNTERS SUCCESS RECREATION DAYS/ LICENSES LICENSE TOTAL HUNTERRATE DAYS ANIMAL ISSUED SALES 1 EXPENDITURES 2
COTTONTAIL 86,769 8,957 968.7% 30,603 0.4 ------ ------ $7,855,370SNOWSHOE HARE 660 349 189.1% 999 1.5 ------ ------ $256,429SQUIRREL 1,212 367 330.2% 1,463 1.2 ------ ------ $375,532
SUMMARY OF 2006 CALENDAR YEAR HARVEST, LICENSE SALES AND EXPENDITURES IN WYOMINGBY HUNTERS AND ANGLERS
B-1

LICENSE HARVEST HUNTERS SUCCESS RECREATION DAYS/ LICENSES LICENSE TOTAL HUNTERRATE DAYS ANIMAL ISSUED SALES 1 EXPENDITURES 2
PHEASANT 46,164 11,017 419.0% 40,322 0.9 29,923 $569,517 $10,350,105GRAY PARTRIDGE 1,582 925 171.0% 3,190 2.0 ------ ------ $818,829CHUKAR 8,315 1,963 423.6% 6,558 0.8 ------ ------ $1,683,348SAGE GROUSE 12,920 5,412 238.7% 11,981 0.9 ------ ------ $3,075,359SHARP-TAILED GROUSE 2,337 1,124 207.9% 3,502 1.5 ------ ------ $898,915BLUE GROUSE 9,324 4,051 230.2% 17,134 1.8 ------ ------ $4,398,063RUFFED GROUSE 5,545 2,165 256.1% 9,888 1.8 ------ ------ $2,538,114MOURNING DOVE 32,807 2,461 1333.1% 7,141 0.2 ------ ------ $1,832,997DUCK 55,545 6,910 803.8% 33,834 0.6 ------ ------ $8,684,724GOOSE 22,748 6,344 358.6% 29,522 1.3 ------ ------ $7,577,893SANDHILL CRANE 194 305 63.6% 687 3.5 ------ ------ $176,343RAIL 20 22 90.9% 80 4.0 ------ ------ $20,535SNIPE 532 191 278.5% 504 0.9 ------ ------ $129,370COOT 691 133 519.5% 623 0.9 ------ ------ $159,915
RAPTOR 16 35 45.7% ------ ------ 33 $5,279 ------
LICENSE HARVEST HUNTERS SUCCESS RECREATION DAYS/ LICENSES LICENSE TOTAL ANGLERRATE DAYS ANIMAL ISSUED SALES 1 EXPENDITURES 2
SPORT FISHING ------ ------ 250.0% 2,354,000 ------ 357,662 $4,729,113 $221,419,503COMMERCIAL ------ ------ ------ ------ ------ 765 $13,436 ------
LICENSE HARVEST4 HUNTERS5 SUCCESS RECREATION DAYS/ LICENSES LICENSE TOTAL TRAPPERRATE5 DAYS ANIMAL ISSUED 6 SALES 6 EXPENDITURES6
BOBCAT 3,617 499 724.8% No Data No Data 1,623 61,448 $13,310,921OTHER FURBEARERS 35,809 947 3781.3% No Data No Data ------ ------ ------
SUMMARYTOTALS 453,369 251,716 1,177,379 390,006 5,378,793 $349,760,736
1License Sales figures will vary from the Statement of Revenue and Expenditures due to timing differences between subsidiary and general ledger reporting, inclusion of application fees; preference points, and conservation stamps and reduction by credit card fees.2Total Hunter and Angler Expenditure figures do not include license sales.3Calculated only from successful legal mountain lion hunters who reported days hunted.4Only successful bobcat trappers surveyed.5Bobcat trappers only.
* License sales and license revenue information related to all small game, upland game bird, and migratory game birds is presented under the pheasant schedule as separate information cannot be reliably generated due to combination licenses.
6Information for all types included here since they cannot be separated, Derived from Hunting and Trapping Expenditures in Wyoming in the 2001 Season, 2002
SUMMARY OF 2006 CALENDAR YEAR HARVEST, LICENSE SALES AND EXPENDITURES IN WYOMINGBY HUNTERS AND ANGLERS
B-2

B-3
RESTITUTION VALUES OF GAME ANIMALS TO THE STATE OF WYOMING The Game and Fish Department has reviewed the state's valuation of wildlife and recommends that the following monies be used in determining the restitution value of illegally killed animals. The factors used in determining the dollar values vary yearly and thus, the values will fluctuate accordingly. Questions concerning the factors used in calculating these values should be directed to the Wyoming Game and Fish Department, Wildlife Division, 5400 Bishop Boulevard, Cheyenne, Wyoming 82006. SPECIES 2006 DOLLAR VALUE Elk.............................................................................................................................. $6,000 Pronghorn..................................................................................................................... 3,000 Mule Deer .................................................................................................................... 4,000 White-tailed Deer......................................................................................................... 4,000 Moose........................................................................................................................... 7,500 Bighorn Sheep............................................................................................................ 15,000 Rocky Mountain Goat................................................................................................ 12,500 Black Bear.................................................................................................................... 5,000 Grizzly Bear ............................................................................................................... 25,000 Mountain Lion ............................................................................................................. 5,000 Bison ............................................................................................................................ 6,000 Wolf ............................................................................................................................. 1,000 Because the factors used in determining the valuation of big game animals is not currently available for small game, waterfowl and furbearer, the best information is based on estimates of the money spent by hunters in harvesting these animals (hunter expenditures divided by harvest): Cottontail ...................................................................................................................... $200 Snowshoe Hare ............................................................................................................... 200 Squirrel – Fox, Grey and Red ......................................................................................... 200 Pheasant .......................................................................................................................... 300 Gray/Hungarian Partridge............................................................................................... 300 Sage Grouse .................................................................................................................... 300 Sharptail Grouse ............................................................................................................. 300 Blue Grouse .................................................................................................................... 300 Ruffed Grouse................................................................................................................. 300 Chukar............................................................................................................................. 300 Sandhill Crane................................................................................................................. 250 Turkey............................................................................................................................. 500 Duck................................................................................................................................ 150 Goose .............................................................................................................................. 250 Mourning Dove............................................................................................................... 100 Rail, Snipe, Coot ............................................................................................................. 100 Bobcat ............................................................................................................................. 550 Beaver ............................................................................................................................. 125 Other Furbearer (not designated) .................................................................................... 120 Other Wildlife (not specified) ....................................................................................10-100 Game Fish ....................................................................................................................... 100

APPENDIX C:
BUDGETARY AND FINANCIAL SUMMARIES


FY 08 BUDGET SUMMARY
MAINTENANCE & OPERATIONS Director ........................................... $2,590,603Fiscal Services ........................................... 4,343,886Services(1) ........................................... 12,087,871Fish (1) ........................................... 10,628,900Wildlife ........................................... 20,366,878
TOTAL M&O 50,018,138
COUPONS ........................................... 595,000EARLY RETIREMENT ........................................... 82,932DAMAGE ........................................... 500,000COST ALLOCATION ...........................................SALECS ........................................... 300,000ACCESS EASEMENTS ........................................... 750,000PROPERTY RIGHTS ........................................... 204,000ELECTRONIC LIC PROJECT …………………………… 605,439NONRECURRING PROJECTS(2) 1,667,300WILDLIFE TRUST ........................................... 1,124,858STATE WILDLIFE GRANTS …………………………… 705,475LANDOWNER INCENTIVE TIER I ……………………… 151,720 REIMBURSED CONTRACTS ........................................... 4,000,000
FY 08 BUDGET (approved July 2007 Commission) 60,704,862
AUTHORIZED CARRYOVER 4,371,988
AMOUNT AUTHORIZED FOR FY 08 SPENDING* 65,076,850
(1) does not include FY 07-08 capital construction appropriation awarded to the State Department of Administration of $15.75 million in construction funds for renovation and replacement work at two hatcheries, 1 regional office and several comfort stations and handicapped accessible areas. Does include 50% of the biennial appropriation for the general fund vet services and sage grouse local working group programs
(2) funding for these projects was made possible by the 2007 Legislative license recoupment bill, reimbursing the Department for free and reduced priced licenses required by previous legislation and a moratorium on cost allocation payments by the Department. These funding sources are not being used for recurring costs.
C-1
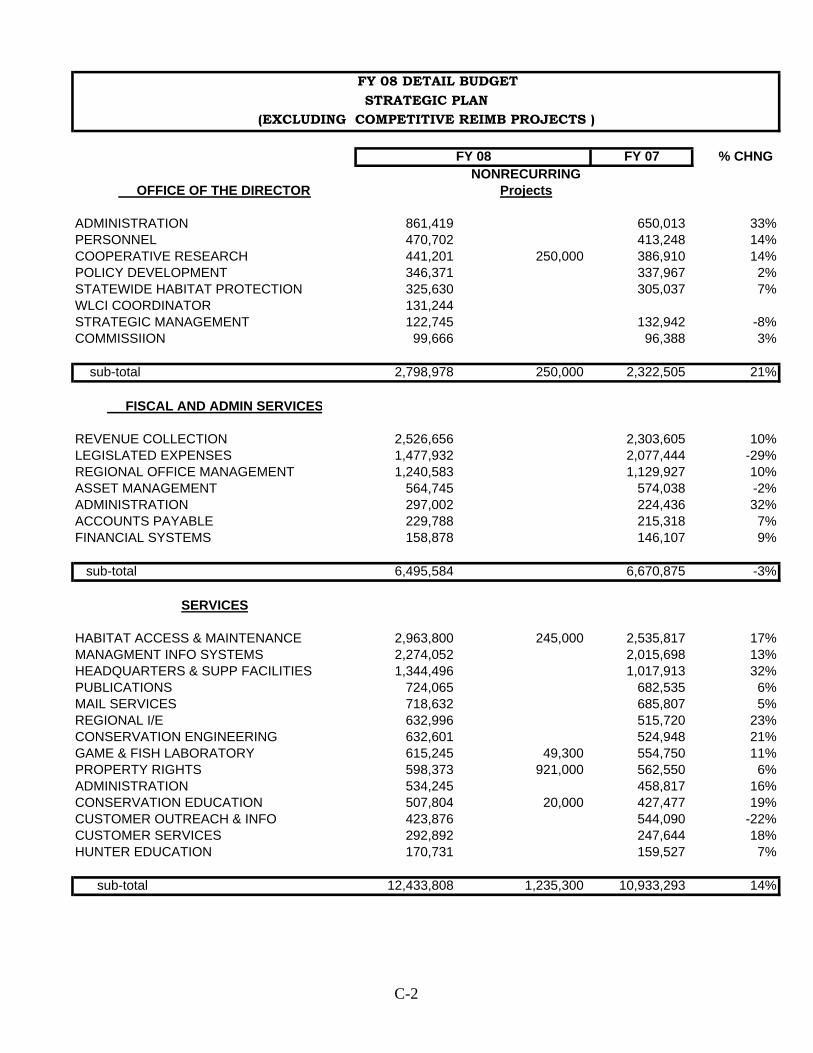
FY 08 DETAIL BUDGETSTRATEGIC PLAN
(EXCLUDING COMPETITIVE REIMB PROJECTS )
FY 07 % CHNG NONRECURRING
OFFICE OF THE DIRECTOR Projects
ADMINISTRATION 861,419 650,013 33%PERSONNEL 470,702 413,248 14%COOPERATIVE RESEARCH 441,201 250,000 386,910 14%POLICY DEVELOPMENT 346,371 337,967 2%STATEWIDE HABITAT PROTECTION 325,630 305,037 7%WLCI COORDINATOR 131,244 STRATEGIC MANAGEMENT 122,745 132,942 -8%COMMISSIION 99,666 96,388 3%
sub-total 2,798,978 250,000 2,322,505 21%
FISCAL AND ADMIN SERVICES
REVENUE COLLECTION 2,526,656 2,303,605 10%LEGISLATED EXPENSES 1,477,932 2,077,444 -29%REGIONAL OFFICE MANAGEMENT 1,240,583 1,129,927 10%ASSET MANAGEMENT 564,745 574,038 -2%ADMINISTRATION 297,002 224,436 32%ACCOUNTS PAYABLE 229,788 215,318 7%FINANCIAL SYSTEMS 158,878 146,107 9%
sub-total 6,495,584 6,670,875 -3%
SERVICES
HABITAT ACCESS & MAINTENANCE 2,963,800 245,000 2,535,817 17%MANAGMENT INFO SYSTEMS 2,274,052 2,015,698 13%HEADQUARTERS & SUPP FACILITIES 1,344,496 1,017,913 32%PUBLICATIONS 724,065 682,535 6%MAIL SERVICES 718,632 685,807 5%REGIONAL I/E 632,996 515,720 23%CONSERVATION ENGINEERING 632,601 524,948 21%GAME & FISH LABORATORY 615,245 49,300 554,750 11%PROPERTY RIGHTS 598,373 921,000 562,550 6%ADMINISTRATION 534,245 458,817 16%CONSERVATION EDUCATION 507,804 20,000 427,477 19%CUSTOMER OUTREACH & INFO 423,876 544,090 -22%CUSTOMER SERVICES 292,892 247,644 18%HUNTER EDUCATION 170,731 159,527 7%
sub-total 12,433,808 1,235,300 10,933,293 14%
FY 08
C-2
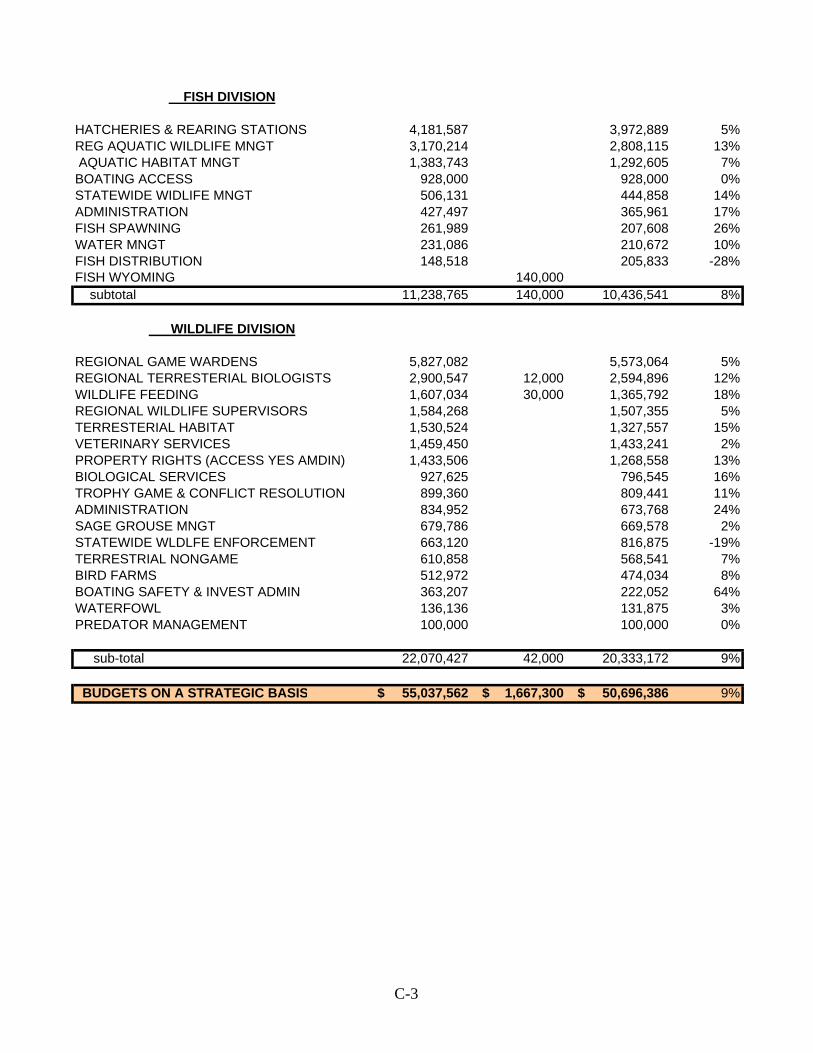
FISH DIVISION
HATCHERIES & REARING STATIONS 4,181,587 3,972,889 5%REG AQUATIC WILDLIFE MNGT 3,170,214 2,808,115 13% AQUATIC HABITAT MNGT 1,383,743 1,292,605 7%BOATING ACCESS 928,000 928,000 0%STATEWIDE WIDLIFE MNGT 506,131 444,858 14%ADMINISTRATION 427,497 365,961 17%FISH SPAWNING 261,989 207,608 26%WATER MNGT 231,086 210,672 10%FISH DISTRIBUTION 148,518 205,833 -28%FISH WYOMING 140,000 subtotal 11,238,765 140,000 10,436,541 8%
WILDLIFE DIVISION
REGIONAL GAME WARDENS 5,827,082 5,573,064 5%REGIONAL TERRESTERIAL BIOLOGISTS 2,900,547 12,000 2,594,896 12%WILDLIFE FEEDING 1,607,034 30,000 1,365,792 18%REGIONAL WILDLIFE SUPERVISORS 1,584,268 1,507,355 5%TERRESTERIAL HABITAT 1,530,524 1,327,557 15%VETERINARY SERVICES 1,459,450 1,433,241 2%PROPERTY RIGHTS (ACCESS YES AMDIN) 1,433,506 1,268,558 13%BIOLOGICAL SERVICES 927,625 796,545 16%TROPHY GAME & CONFLICT RESOLUTION 899,360 809,441 11%ADMINISTRATION 834,952 673,768 24%SAGE GROUSE MNGT 679,786 669,578 2%STATEWIDE WLDLFE ENFORCEMENT 663,120 816,875 -19%TERRESTRIAL NONGAME 610,858 568,541 7%BIRD FARMS 512,972 474,034 8%BOATING SAFETY & INVEST ADMIN 363,207 222,052 64%WATERFOWL 136,136 131,875 3%PREDATOR MANAGEMENT 100,000 100,000 0%
sub-total 22,070,427 42,000 20,333,172 9%
BUDGETS ON A STRATEGIC BASIS 55,037,562$ 1,667,300$ 50,696,386$ 9%
C-3

WYOMING GAME AND FISH COMMISSION FY 08 BUDGET
WILDLIFE TRUST FUND PROJECTS:HABITAT PROJECTS & GRANTS Bates Creek Watershed Restoration* Bighorn Basin Habitat Cover 5,000 Big Horn East Slope Wooded Draw Restoration 6,500 Blair Creek Forage Reserve Fencing 10,000 Dull Center Sagebrush Restoration 5,000 Elk Mt/Red Canyon Prescribed Burn 25,000 Fish Passage at Low Head Diversions* 8,000 Gooseberry Watershed Enhancement Project 20,000 Grey Rocks Salt Cedar Control 5,000 Jackknife Creek Restoration Project* 40,000 Kirby Creek Watershed Enhancement 10,000 LaBarge Watershed Project* 12,000 Lake Desmet Sagebrush Grassland Improvement Program 50,000 Lander Front Habitat Improvement 20,000 Moose Habitat Analysis Contract 20,000 PLPW habitat grants* 10,000 Red Mountain Habitat & Livestock Grazing Project 9,000 Red Rim WHMA Water Development 7,000 Roath Habitat Management Technical support* 15,000 Schnoor Flat Top Sagebrush Restoration 18,500 South Tongue River Stream Restoration 25,000 Spring Creek Project 25,000 Weiner Creek Aspen Burn 5,000 Winward Technical Assistance Contract* 11,625 Wyoming Front Aspen Treatment 30,000 Yellowtail CRM Invasive Plant Mngt 5,000 habitat projects 397,625$
Property Rights Specialist Program* 80,432 Habitat Biologist Program* 541,097 habitat programs 621,529$
CONSERVATION EDUCATION(WORTH THE WATCHING) PROJECTS
Pronghorn Migration Coordinator Interpretive Exhibit 7,500 Beating Brucellosis Brochure 4,000 Brucellosis Public Education Survey 12,000 educational projects 23,500Alternative Funding Program 82,204$
TOTAL DEPARTMENT TRUST PROGRAMS/PROJECTS 1,124,858$
STATE WILDLIFE GRANT PROJECTS: Big Horn Native Fish Survey * 58,745 Cody Bear Management 33,640 Conflict Resolution with Grizzly Bears * 71,333 Cutthroat Conservation * 71,343
C-4

Effects of Winter Recreation on small Mammals * 18,528 Fish Entrainment* 22,031 Green River Catostomidae* ** 10,300 Herpetological Program * 12,510 Making Gis Useful * 38,005 NE/SE Prairie Streams Survey 58,508 Roundtail Chub** 15,000 Salt River Spawning of Snake River CT * ** 47,071 Terrestrial Nongame Species Surveys * 86,959 Wapiti Bear Management * 62,230 White Tailed Prairie Dog 45,472 Wind River Burbot ** 53,800 TOTAL DEPARTMENT FY 08 State Wildlife Projects 470,414$ * ongoing projects**work being performed by the UW coop unit
SPECIAL NONRECURRING PROJECTS FROM NEW FY 08 FUNDING SOURCES:
150 HP statewide tractor 145,000 Access acquisitions 786,000 Access development costs 50,000 Baggs Mule deer project 150,000 Cody aerial surveys 12,000 CWD research 40,000 Feedground EIS (1/2 FTE AWEC) 30,000 Fish Wyoming grants 140,000 Lab DNA sequencer 49,300 PLPW walk-in & hunter mngt add-on 85,000 Sand Mesa sprinkler (3rd pivot) 100,000 Trail Lakes renovation (minor) 20,000 Willow Creek (moose)project add-on 20,000 UW Coop academic professional 40,000$
TOTAL DEPARTMENT FY 08 Special Projects 1,667,300$
(License recoupment fees & cost allocation reduction)
C-5

MAINTENANCE & OPERATIONS BUDGETS (FY 87 - FY 08) (Does not include Enhancements, Trust Projects, Property Rights, Capital Facilities, General Funds or Reimbursed Projects)
FY 87 $19,913,441 Game Division 7,483,347 Fish Division 4,451,347 HATS Division 2,843,805 Communications Division 1,538,464 Fiscal Division 2,359,229 Administration Division 1,236,638 Coupons 750,000 Damage 500,000 FY 88 $21,040,674 Game Division 7,381,078 Fish Division 4,602,523 HATS Division 2,920,979 Communications Division 1,553,215 Fiscal Division 1,436,749 Administration Division 702,834 Agency Common 1,193,296 Coupons 750,000 Damage 500,000 FY 89 $20,465,981 Game Division 7,576,046 Fish Division 4,146,592 HATS Division 2,540,610 I&E Services Division 1,583,581 Adm. & Fiscal Svcs. Div. 1,337,388 Office of Director 689,602 Agency Common 1,217,162 Coupons 750,000 Damage 500,000 Early Retirement 125,000 Damage 500,000 FY 90 $20,533,195 Game Division 8,084,170 Fish Division 4,406,561 HATS Division 2,693,910 I&E Services Division 1,661,592 Adm. & Fiscal Svcs. Div. 1,329,610 Office of Director 708,133 Agency Common 474,219 Coupons 550,000 Damage 500,000 Early Retirement 125,000 FY 91 $22,518,236 Game Division 8,711,427 Fish Division 4,787,533 HATS Division 2,876,190 I&E Services Division 1,941,699 Adm. & Fiscal Svcs. Div. 1,383,147 Office of Director 746,640 Agency Common 876,600 Coupons 600,000 Damage 500,000 Early Retirement 95,000
FY 92 $27,073,153 Game Division 9,893,600 Fish Division 5,708,203 HATS Division 4,035,772 I&E Services Division 2,723,179 Fiscal Services Division 2,469,238 Office of Director 942,412 Coupons 600,000 Damage 500,000 Early Retirement 200,749
FY 93 $29,674,362 Game Division 10,561,574 Fish Division 6,124,559 HATS Division 4,114,019 I&E Services Division 3,253,794 Fiscal Services Division 2,377,512 Office of Director 1,632,904 Coupons 860,000 Damage 500,000 Early Retirement 250,000
FY 94 $30,946,580 Game Division 10,423,261 Fish Division 6,185,826 HATS Division 4,539,758 I&E Services Division 3,568,632 Fiscal Services Division 2,996,836 Office of Director 1,687,267 Coupons 750,000 Early Retirement 295,000 FY 95 $30,672,321 Wildlife Division 10,126,225 Fish Division 6,187,409 HATS Division 4,195,529 I&E Services Division 3,204,102 Fiscal Services Division 2,692,088 Office of Director 1,956,424 Coupons 650,000 Early Retirement 150,000 Damage 500,000 Cost Allocation 300,000 SALECS 217,000 Salary Contingency 493,544 FY 96 $31,402,001 Wildlife Division 10,288,181 Fish Division 6,803,683 HATS Division 4,587,011 I&E Services Division 3,504,112 Fiscal Services Division 3,018,908 Office of Director 1,249,286 Coupons 600,000 Early Retirement 333,820 Damage 500,000 Cost Allocation 300,000
FY96 (Continued) SALECS 217,000 FY 97 $30,484,636 Wildlife Division 11,479,769 Fish Division 6,255,709 Services Division 7,033,623 Fiscal Services Division 2,780,604 Office of Director 984,931 Coupons 560,000 Early Retirement 378,000 Damage 500,000 Cost Allocation 300,000 SALECS 212,000 FY 98 $33,776,380 Wildlife Division 12,747,313 Fish Division 6,755,891 Services Division 7,332,429 Fiscal Services Division 3,097,432 Office of Director 1,822,313 Coupons 602,000 Early Retirement 369,002 Damage 500,000 Cost Allocation 330,000 SALECS 220,000
FY 99 $33,582,267 Wildlife Division 12,155,687 Fish Division 7,017,794 Services Division 7,615,445 Fiscal Services Division 3,025,520 Office of Director 1,824,772 Coupons 515,000 Early Retirement 358,249 Damage 500,000 Cost Allocation 342,200 SALECS 227,600 FY 00 $36,238,774 Wildlife Division 12,970,024 Fish Division 8,377,249 Services Division 7,765,569 Fiscal Services Division 3,297,221 Office of Director 1,860,511 Coupons 515,000 Early Retirement 325,600 Damage 500,000 Cost Allocation 400,000 SALECS 227,600 FY 01 $36,571,119 Wildlife Division 12,900,839 Fish Division 8,617,707 Services Division 7,884,777 Fiscal Services Division 3,355,319 Office of Director 1,917,494
FY01 (Continued) Coupons 515,000 Early Retirement 305,000 Damage 500,000 Cost Allocation 350,000 SALECS 224,000 FY 02 $39,727,021 Wildlife Division 14,047,986 Fish Division 9,107,324 Services Division 8,982,248 Fiscal Services Division 3,648,879 Office of Director 2,081,384 Coupons 475,000 Early Retirement 262,200 Damage 500,000 Cost Allocation 370,000 SALECS 252,000 FY 03 $40,545,447 Wildlife Division 14,843,001 Fish Division 8,856,919 Services Division 9,015,519 Fiscal Services Division 3,904,386 Office of Director 2,165,017 Coupons 450,000 Early Retirement 208,605 Damage 500,000 Cost Allocation 350,000 SALECS 252,000 FY 04 $39,572,909 Wildlife Division 14,520,159 Fish Division 8,780,831 Services Division 8,921,007 Fiscal Services 3,622,015 Office of Director 2,002,835 Coupons 400,000 Early Retirement 164,062 Damage 500,000 Cost Allocation 410,000 SALECS 252,000 FY 05 $40,720,306 Wildlife Division 14,890,882 Fish Division 8,979,167 Services Division 9,426,638 Fiscal Services 3,569,888 Office of Director 2,031,455 Coupons 500,000 Early Retirement 138,276 Damage 500,000 Cost Allocation 432,000 SALECS 252,000 FY 06 44,624,002 Wildlife Division 44,624,002
FY06 (Continued) Fish Division 17,962,143 Services Division 9,294,901 Fiscal Services 9,670,901 Office of Director 2,059,320 Coupons 500,000 Early Retirement 105,274 Damage 500,000 Cost Allocation 600,000 SALECS 252,000 FY07 $47,208,311 Wildlife Division 18,735,410 Fish Division 9,769,631 Services Division 10,615,365 Fiscal Services 3,958,939 Office of Director 2,051,522 Coupons 535,000 Early Retirement 90,444 Damage 500,000 Cost Allocation 700,000 SALECS 252,000 FY08 $49,468,992 Wildlife Division 18,339,800 Fish Division 10,628,900 Services Division 12,087,871 Fiscal Services 4,343,886 Office of the Director 2,590,603 Coupons 595,000 Early Retirement 82,932 Damage 500,000 Cost Allocation 0 SALECS 300,000

ARISING FROM CASH TRANSACTIONS % CHNGAS OF JUNE 30, FY 04 TO
2007 2006 2005 2004 FY 07ASSETS:
PETTY CASH 14,750$ 14,750$ 14,750$ 14,450$ 2% CASH - OPERATIONS 27,044,138 22,658,283 18,473,868 16,862,195 60% CASH- WLDLFE TRUST INTEREST 2,019,654 1,630,155 1,568,387 1,620,801 25% CASH- ACCESS FUND 1,012,033 957,866 894,141 827,509 22% 30,090,575 25,261,054 20,951,146 19,324,955 56%
CASH - WLDLFE TRUST CORPUS 20,203,311 19,473,876 18,773,926 18,121,434 11% CASH- LIFETIME LICENSE FUND 3,053,705 2,748,685 2,554,027 2,436,869 25% CASH-ALTERNATIVE ENTERPRISES 50,000 50,013 49,978 50,000 0% CASH - APPS/LICENSES IN PROCESS 13,653,774 13,221,845 18,667,441 12,618,476 8% RETURNED CHECKS 3,234 8,001 51,349 3,996 -19% TOTAL ASSETS 67,054,599 60,763,474 61,047,867 52,555,730 28%
LIABILITIES:
VOUCHERS PAYABLE 260 251,390 88,807 248,900 -100% LICENSE AGENT BONDS 100,000 100,000 100,000 93,135 7% COURT ORDERED RESTITUTION 31,671 40,534 42,259 34,296 -8% UNDISTRIBURED DRAW/APPS PENDIN 13,653,774 13,221,845 18,667,441 12,618,476 8% RESTRICTED FEDERAL FUNDS 0 64,431 49,607 49,607 -100% OTHER DEFERRED REVENUE 187,424 208,907 205,717 161,500 16% TOTAL LIABILITIES 13,973,129 13,887,107 19,153,831 13,205,914 6%
FUND BALANCE:
RESTRICTED OUTSTANDING ENCUMBERANCES 4,371,988 4,321,386 3,921,674 2,985,165 46% WLDLFE TRUST FUND CORPUS 20,203,311 19,473,876 18,773,926 18,121,434 11% WLD TRUST FUND INTEREST 1,731,104 1,511,912 1,566,769 1,516,725 14% ACCESS FUND CORPUS 993,333 933,591 877,326 812,709 22% LIFETIME LICENSE FUND 3,053,705 2,748,685 2,571,939 2,436,869 25% ALTERNATIVE ENTERPRISES 50,000 50,013 49,978 50,000 0%
UNRESTRICTED G&F OPERATING FUND 22,678,029 17,836,904 14,539,058 13,426,914 69% TOTAL FUND BALANCE 53,081,470 46,876,367 42,300,670 39,349,816 35% TOTAL LIABILITIES AND FUND BALANCE
67,054,599 60,763,474 61,454,501 52,555,730 28%
STATEMENT OF ASSETS, LIABILITIES, AND FUND BALANCES (G&F funds only)
C-7

STATEMENT OF REVENUE AND EXPENDITURES ARISING FROM CASH TRANSACTIONS
EXPENDABLE FUNDS %PR CHREVENUE RECEIVED FY 06Hunting & Fish Lic@ 28,373,221$ 28,158,607$ 1% Preference Points 1,429,278 2,646,708 -46%Conservation Stamps 664,049 649,230 2%Boating Registration 384,322 411,781 -7%Pooled Interest Opr 1,728,334 1,428,582 21%Pooled Interest Trt 888,776 857,249 4%Income from Inv&Land 590,274 208,196 184%Nonfederal Grants 753,749 709,290 6%Application Fees 1,797,358 1,688,900 6%Publication Sales 182,439 176,135 4%Access Yes c-stamp/donations 743,865 707,209 5%Federal Aid & Grants 12,560,769 9,898,176 27%General Funds 1,590,324 1,247,299 28%Other Items 124,725 71,042 76%
TOTAL REVENUE EARNED 51,811,483 48,858,404 6%
EXPENDITURES MADE Maintenance & Ops Office of Director 1,746,115 1,709,092 2%Fiscal Division 3,264,119 3,169,735 3%Services Division 9,160,939 8,434,589 9%Fish Division 8,290,972 7,985,396 4%Wildlife Division 16,471,960 15,633,748 5%
TOTAL M&O EXPENSES 38,934,105 36,932,560 5%
Access Payments 709,424 648,710 9%Trust Projects 619,607 646,645 -4%Legislated Expenses 1,690,866 1,750,310 -3%Carryover M/0 /Trust FD 2,074,985 1,983,580 5%
TOTAL OPERATING EXP 44,028,987 41,961,805 5%
Licensing Project 409,770 342,681 20%Reimbursable Contracts 1,600,424 1,292,608 24% State Wildlife Grants 645,726 536,288 20%LIP Tier I Grants 76,879 59,906 28%Property Rights 8,500 1,750Carryover 581,127 661,506 -12%
TOTAL NONOP EXPENDTRS 3,322,426 2,894,739 15%
TOTAL EXPENDITURES 47,351,413 44,856,544 6%DEFICIT OF REV OVER EXP $4,460,070 $4,001,860 11%
All Department revenue is recognized above excepting: 1)$377,157 in lifetime license sales & interest earned on those licenses(W.S. provides that the corpus of the lifetime license fund cannot be spent, but up to 6% of the corpus balance may be transferred annually to the Game and Fish Operating fund;
2)$ 1/2 or $63,662 of lifetime conservation stamps and 37 1/2% of the c-stamp ($664,049) revenue deposited in the wildlife trust fund;W.S. provides the corpus cannot be spent, but interest earned may be used for operations 3)access donations of $143,392 which are deposited into an access fund & are budgeted and spent in the year following receipt; they can only be used for purchasing nonfee title access easements;
4) and $22,179 (net profit on a cash basis for revenue of $160,291 & expenses of $114,242) from sale of promotional products and publications.
All Department expenditures, excepting capital construction costs, included in a Legislative appropriation andpaid directly by the Department of Administration and Information Construction Management Division, are shown
FROM EXPENDABLE FUNDS FOR THE PERIOD ENDED JUNE 30, 2007
C-8

SCHEDULE OF EXPENDITURES BY STRATEGIC PLAN OBJECTIVESFOR THE Fiscal year ENDED June 30, 2007
Game &Fish
OpertngFund
WildlifeTrust Fund
Accessfund
State Wld Grnts &
LIP I
100% funded ThirdParty
Grants
Sub-Total Agencyfunding
Generalfund (non
capitalconstructn)
TotalAgency
Expenditures%
ExpdAQUATIC WILDLIFE MNGT 3,699,269$ 199,892$ 58,305$ 3,957,466$ 3,957,466$ 8.50%BIRD FARMS 455,086 2,950 458,036 458,036 0.98%CO-OP UNIT RESEARCH 201,497 186,314 387,811 387,811 0.83%CONSERVATION ENGNING 528,712 528,712 528,712 1.14%DEPARTMENT ADMIN 2,586,671 (2,047) 2,584,624 2,584,624 5.55%EDUCATION 505,753 111,201 616,954 616,954 1.33%FEEDGROUNDS 1,535,960 1,535,960 1,535,960 3.30%FINANCIAL MANAGEMENT 2,191,499 29,331 (2,802) 2,218,028 2,218,028 4.77%FISH CULTURE^ 4,402,755 4,402,755 4,402,755 9.46%HABITAT ^ 3,713,367 617,051 47,548 248,797 4,626,763 4,626,763 9.94%INFORMATION 1,757,411 1,757,411 1,757,411 3.78%LEGISLATED EXPENSES(2) 1,724,480 1,724,480 1,724,480 3.71%CUSTOMER SERVICES 212,648 212,648 212,648 0.46%MANAGEMENT INFO SYSTEMS 1,808,809 35,049 345 1,844,203 1,844,203 3.96%PERSONNEL MANAGEMENT 263,998 263,998 263,998 0.57%PROPERTY RIGHTS 971,781 714,949 26,451 1,713,181 1,713,181 3.68%REGIONAL INFORMATION/ED 456,697 456,697 456,697 0.98%SPECIALIZED LAW ENFORCMNT 826,928 307,792 1,134,720 1,134,720 2.44%STRATEGIC MNGT 101,216 81,120 182,336 182,336 0.39%SUPPORT FACILITIES/PERSNL 1,886,456 1,886,456 1,886,456 4.05%TERRESTRIAL WLD MNGT 10,514,096 252,881 392,836 11,159,813 351,808 11,511,621 24.73%WILDLIFE HABITAT PRCTCN 271,532 197,749 469,281 469,281 1.01%WILDLIFE HEALTH & LAB SVCS 520,838 309,834 830,672 1,238,516 2,069,188 4.45%
- - TTL DEPT OBJECTIVES 41,137,459 698,171 714,949 751,015 1,651,411 44,953,005 1,590,324 46,543,329 ######
Alternative Enterprises 114,242 114,242 114,242 Electronic Licensing Project 808,084 808,084 808,084 TOTAL AMT SPENT DURING FY07 42,059,785 698,171 714,949 751,015 1,651,411 45,875,331 1,590,324 47,465,655 100.00%
^(1) does not include capital construction payments out of general fund for capital construction
C-9

STATEWIDE FIVE-YEAR COMPARISON OF LICENSE SALESBIG GAME LICENSES PRICE 2002 2003 2004 2005 2006 Resident Antelope $22.00 12,260 12,970 Resident Antelope $26.00 13,013 Resident Antelope $27.00 13,811 14,453 Depredation Resident Antelope $22.00 Resident Youth Antelope $15.00 2,094 2,110 2,218 2,285 2,328 Depredation Resident Youth Antelope $15.00 Resident Doe/Fawn Antelope $20.00 3,724 4,308 Resident Doe/Fawn Antelope $24.00 4,357 Resident Doe/Fawn Antelope $19.00 4,788 5,923 Resident Youth Doe/Fawn Antelope $14.00 434 527 548 525 630 Pioneer Antelope $2.00 379 324 300 296 259 Pioneer Doe/Fawn Antelope $2.00 54 51 59 54 66 Depredation Resident Pioneer Antelope $2.00 Pioneer Heritage Antelope $16.00 108 114 140 Pioneer Heritage Doe/Fawn Antelope $15.00 20 17 27
TOTALS 18,945 20,290 20,623 21,890 23,826 Nonres Special Antelope $285.00 1,803 1,886 Nonres Special Antelope $425.00 1,455 Nonres Special Antelope $426.00 1,498 761 NonRes Special Antelope w/Preference Point $456.00 860 NonRes Antelope w/Preference Point $256.00 2,039 NonRes Antelope Yth w/Preference Point $120.00 226 Nonres Antelope $185.00 11,709 12,861 Nonres Antelope $225.00 13,399 Nonres Antelope $226.00 14,478 13,242 Nonres Youth Antelope $110.00 587 674 830 931 809 Nonres Doe/Fawn Antelope $50.00 6,261 7,604 Nonres Doe/Fawn Antelope $60.00 7,955 Nonres Doe/Fawn Antelope $29.00 11,913 15,725 Nonres Youth Doe/Fawn Antelope $30.00 413 511 588 Nonres Youth Doe/Fawn Antelope $19.00 720 968
TOTALS 20,773 23,536 24,227 29,540 34,630TOTAL ANTELOPE LICENSES 39,718 43,826 44,850 51,430 58,456 Resident Bighorn Sheep $75.00 189 182 Resident Bighorn Sheep $95.00 187 Resident Bighorn Sheep $96.00 174 179 Nonresident Bighorn Sheep $1,500.00 69 66 Nonresident Bighorn Sheep $1,900.00 64 Nonresident Bighorn Sheep $1,901.00 62 61TOTAL BIGHORN SHEEP LICENSES 258 248 251 236 240 Resident Deer $25.00 41,556 40,698 Resident Deer $30.00 39,596 Resident Deer $31.00 38,591 39,887 Resident Deer Military Combat $0.00 11 Resident Youth Deer $15.00 5,933 5,718 5,414 5,353 5,455 Resident Doe/Fawn Deer $20.00 3,266 3,790 Resident Doe/Fawn Deer $24.00 4,233 Resident Doe/Fawn Deer $19.00 5,479 6,728 Resident Youth Doe/Fawn Deer $14.00 305 337 435 514 627 Depredation Resident Doe/Fawn Deer $20.00 167 Depredation Resident Youth Doe/Fawn Deer $14.00 28 Pioneer Deer $2.00 861 718 628 554 461 Pioneer Doe/Fawn Deer $2.00 48 46 46 36 45 Pioneer Heritage Deer $19.00 138 157 172 Pioneer Heritage Doe/Fawn Deer $15.00 19 11 15
TOTALS 52,164 51,307 50,509 50,695 53,401
C-10

STATEWIDE FIVE-YEAR COMPARISON OF LICENSE SALES Nonres Special Deer $310.00 4,263 4,149 Nonres Special Deer $460.00 3,278 Nonres Special Deer $461.00 2,948 1,414 NonRes Deer Special w/Preference Point $501.00 1,314 NonRes Deer w/Preference Point $301.00 3,168 NonRes Deer Yth w/Preference Point $120.00 200 Nonresident Deer $210.00 25,198 24,933 Nonresident Deer $260.00 24,076 Nonresident Deer $261.00 24,569 21,011 Nonresident Youth Deer $110.00 953 1,022 1,042 1,158 972 Nonresident Doe/Fawn Deer $50.00 2,466 2,984 Nonresident Doe/Fawn Deer $60.00 2,950 Nonresident Doe/Fawn Deer $29.00 4,915 6,569 Nonresident Youth Doe/Fawn Deer $30.00 147 162 194 Nonresident Youth Doe/Fawn Deer $19.00 248 356 Nonresident Depredation Deer $210.00 6
TOTALS 33,027 33,250 31,540 33,838 35,004TOTAL DEER LICENSES 85,191 84,557 82,049 84,533 88,405 Resident Elk $35.00 41,106 39,734 Resident Elk $42.00 38,357 Resident Elk $43.00 37,192 38,055 Resident Elk Military Combat $0.00 9 Resident Youth Elk $25.00 4,255 4,025 3,969 3,801 3,777 Depredation Resident Elk $42.00 91 Depredation Resident Youth Elk $25.00 9 Pioneer Elk $5.00 927 788 695 573 529 Resident Cow/Calf Elk $30.00 3,955 3,835 Resident Cow/Calf Elk $36.00 4,038 4,229 4,687 Resident Yth Cow/Calf Elk $20.00 268 244 297 326 318 Pioneer Cow/Calf Elk $5.00 49 52 62 52 48 Pioneer Heritage Elk $27.00 243 294 330 Pioneer Heritage Cow/Calf Elk $23.00 30 26 34
TOTALS 50,560 48,678 47,791 46,493 47,787 Nonres Special Elk/Fishing $600.00 2,809 2,807 Nonres Special Elk/Fishing $880.00 2,783 Nonres Special Elk/Fishing $881.00 2,785 716 NonRes Elk Yth w/Preference Point $325.00 70 NonRes Elk Special w/Preference Point $931.00 2,069 NonRes Elk w/Preference Point $531.00 1,920 Nonres Elk & Fishing $400.00 6,387 5,959 Nonres Elk & Fishing $480.00 5,757 Nonres Elk & Fishing $481.00 5,536 3,513 Nonres Youth Elk/Fishing $275.00 147 164 154 151 111 Nonres Cow/Calf Elk $200.00 1,751 Nonres Cow/Calf Elk $150.00 2,023 Nonres Cow/Calf Elk $240.00 1,636 1,538 1,441 Nonres Youth Cow/Calf Elk $75.00 86 Nonres Youth Cow/Calf Elk $100.00 69 61 47 55
TOTALS 11,452 10,750 10,391 10,057 9,895TOTAL ELK LICENSES 62,012 59,428 58,182 56,550 57,682 Resident Moose $75.00 1,167 1,002 Resident Moose $90.00 777 Resident Moose $91.00 669 636 Nonresident Moose $1,000.00 219 187 Nonresident Moose $1,200.00 150 Nonresident Moose $1,201.00 129 132TOTAL MOOSE LICENSES 1,386 1,189 927 798 768
C-11

STATEWIDE FIVE-YEAR COMPARISON OF LICENSE SALES Resident Mountain Goat $75.00 12 12 Resident Mountain Goat $100.00 12 Resident Mountain Goat $101.00 15 15 Nonres Mountain Goat $1,500.00 4 4 Nonres Mountain Goat $1,800.00 4 Nonres Mountain Goat $1,801.00 5 5TOTAL MOUNTAIN GOAT LICENSES 16 16 16 20 20
COMMERCIAL LICENSES PRICE 2002 2003 2004 2005 2006 Comm’l Fish Hatchery $125.00 14 16 Comm’l Fish Hatchery $150.00 12 Comm’l Fish Hatchery $151.00 14 13 Deal in Live Bait $45.00 61 62 Deal in Live Bait $55.00 65 Deal in Live Bait $56.00 56 57 Fishing Preserve $90.00 75 62 Fishing Preserve $110.00 62 Fishing Preserve $111.00 72 73 Resident Fur Dealer $35.00 19 13 Resident Fur Dealer $42.00 13 Resident Fur Dealer $43.00 11 14 Nonresident Fur Dealer $190.00 7 9 Nonresident Fur Dealer $230.00 9 Nonresident Fur Dealer $231.00 10 10 Game Bird Farm $90.00 103 108 Game Bird Farm $110.00 117 Game Bird Farm $111.00 115 105 Seine or Trap Fish License $25.00 Seine or Trap Fish License $15.00 532 533 566 Seine or Trap Fish License $16.00 612 622 Resident Taxidermist $45.00 152 157 Resident Taxidermist $55.00 168 Resident Taxidermist $56.00 163 161 Nonresident Taxidermist $500.00 5 2 Nonresident Taxidermist $600.00 4 Nonresident Taxidermist $601.00 5 6TOTAL COMMERCIAL LICENSES 968 962 1,016 1,058 1,061FUR BEARING/TRAP LICENSES PRICE 2002 2003 2004 2005 2006 Res Fur Bearing Trap $30.00 1,156 1,256 Res Fur Bearing Trap $35.00 1,310 Res Fur Bearing Trap $36.00 1,347 1,466 Res Youth Fur Bear Trap $6.00 106 100 113 110 115 Nonres Fur Bearing Trap $170.00 27 32 Nonres Fur Bearing Trap $200.00 31 Nonres Fur Bearing Trap $201.00 39 42TOTAL FUR BEARING/TRAPPING LICENSES 1,289 1,388 1,454 1,496 1,623
C-12

STATEWIDE FIVE-YEAR COMPARISON OF LICENSE SALES
GAME BIRD/SML GAME LICENSES: PRICE 2002 2003 2004 2005 2006 Res Bird/Small Game Annual $15.00 12,326 11,091 Res Bird/Small Game Annual $18.00 10,189 Res Bird/Small Game Annual $19.00 10,278 10,622 Res Daily Bird/Small Game $5.00 765 859 Res Daily Bird/Small Game $6.00 1,155 Res Daily Bird/Small Game $7.00 1,108 1,019 Res Bird/Small Game Military Combat $0.00 6 Nonres Bird/Small Game Annual $50.00 1,925 2,004 Nonres Bird/Small Game Annual $60.00 1,824 Nonres Bird/Small Game Annual $61.00 1,868 2,054 Nonres Daily Bird/Small Game $15.00 4,465 4,417 5,107 Nonres Daily Bird/Small Game $16.00 6,203 6,752 Nonres Youth Bird/Small Game Annual $40.00 68 81 80 106 111TOTAL COMBINATION LICENSES 19,549 18,452 18,355 19,563 20,564GAME BIRD LICENSES: PRICE 2002 2003 2004 2005 2006 Resident Game Bird $10.00 7,652 7,821 Resident Game Bird $12.00 8,024 Resident Game Bird $13.00 7,767 7,350 3-Day Special Bird $15.00 115 74 0TOTAL GAME BIRD LICENSES 7,767 7,895 8,024 7,767 7,350SMALL GAME LICENSES: PRICE 2002 2003 2004 2005 2006 Resident Small Game $10.00 1,510 1,658 Resident Small Game $12.00 1,971 Resident Small Game $13.00 2,142 2,009TOTAL SMALL GAME LICENSES 1,510 1,658 1,971 2,142 2,009TURKEY LICENSES: PRICE 2002 2003 2004 2005 2006 Resident Spring Turkey $10.00 3,728 3,814 Resident Spring Turkey $12.00 4,188 Resident Spring Turkey $13.00 4,165 4,148 Resident Fall Turkey $10.00 1,756 1,938 Resident Fall Turkey $12.00 2,230 Resident Fall Turkey $13.00 1,818 1,941
TOTALS 5,484 5,752 6,418 5,983 6,089 Nonres Spring Turkey $50.00 1,187 1,251 Nonres Spring Turkey $60.00 1,414 Nonres Spring Turkey $61.00 1,545 1,567 Nonres Fall Turkey $50.00 511 671 Nonres Fall Turkey $60.00 572 Nonres Fall Turkey $61.00 432 490
TOTALS 1,698 1,922 1,986 1,977 2,057TOTAL TURKEY LICENSES 7,182 7,674 8,404 7,960 8,146
GAME FISH LICENSES: PRICE 2002 2003 2004 2005 2006 Resident Fishing Annual $15.00 81,394 78,750 Resident Fishing Annual $18.00 73,541 Resident Fishing Annual $19.00 72,932 75,872 Resident Youth Fishing Annual $3.00 7,413 6,780 6,368 6,255 6,440 Resident Daily Fish $3.00 31,950 35,565 39,862 Resident Daily Fish $4.00 40,427 39,759 Resident Daily Fish Military Combat 8
TOTALS 120,757 121,095 119,771 119,614 122,079
C-13

STATEWIDE FIVE-YEAR COMPARISON OF LICENSE SALES Nonres Fishing Annual $65.00 16,644 17,011 Nonres Fishing Annual $75.00 14,033 Nonres Fishing Annual $76.00 13,842 14,579 Nonres Youth Fish Annual $15.00 3,858 3,733 3,554 3,371 3,673 Nonres Daily Fishing $6.00 Nonres Daily Fishing $10.00 227,693 220,137 218,894 Nonres Daily Fishing $11.00 213,152 217,331
TOTALS 248,195 240,881 236,481 230,365 235,583TOTAL FISHING LICENSES 368,952 361,976 356,252 349,979 357,662
LIFETIME LICENSES: PRICE 2002 2003 2004 2005 2006 Bird/Fish/Small Game $400.00 82 162 121 Bird/Fish/Small Game $401.00 100 121 Fishing $250.00 41 110 74 Fishing $251.00 70 114 Bird/Fish/Small Game & Conservation Stamp $475.00 644 1,407 Bird/Fish/Small Game & Conservation Stamp $550.00 195 Bird/Fish/Small Game & Conservation Stamp $551.50 289 358 Bird/Small Game $250.00 23 Bird/Small Game $251.00 21 23 Bird/Small Game & Conservation Stamp $400.00 3 Bird/Small Game & Conservation Stamp $401.50 3 3 Fishing/Conservation Stamp $325.00 429 1,279 Fishing/Conservation Stamp $400.00 129 Fishing/Conservation Stamp $401.50 157 208 Conservation Stamp $75.00 1,739 6,032 Conservation Stamp $150.00 79 Conservation Stamp $150.50 86 105TOTAL LIFETIME LICENSES 2,935 8,990 624 726 932
OTHER LICENSES: PRICE 2002 2003 2004 2005 2006 Resident Archery $10.00 9,716 10,111 Resident Archery $12.00 10,836 Resident Archery $13.00 11,144 12,223 Nonresident Archery $20.00 2,580 2,930 Nonresident Archery $24.00 3,254 Nonresident Archery $25.00 3,362 3,871TOTAL ARCHERY LICENSES 12,296 13,041 14,090 14,506 16,094 Res License to Capture Falcon $25.00 25 20 Res License to Capture Falcon $30.00 17 Res License to Capture Falcon $31.00 19 17 Nonres Lic to Capture Falcon $170.00 26 21 Nonres Lic to Capture Falcon $200.00 16 Nonres Lic to Capture Falcon $201.00 22 16 License to Hunt with Falcon $10.00 95 91 License to Hunt with Falcon $12.00 85 License to Hunt with Falcon $13.00 99 92 License to Capture Fur Bearing Animal $15.00 2 3 2 License to Capture Fur Bearing Animal $16.00 1 2 Disabled Hunter Companion Permit $5.00 22 74 73 69 Duplicate with Coupon $3.00 875 948 1,010 Duplicate with Coupon $4.00 1,077 1,070 Duplicate without Coupon $3.00 133 113 109
C-14

STATEWIDE FIVE-YEAR COMPARISON OF LICENSE SALES Duplicate without Coupon $4.00 127 159 Duplicate Multi-Purpose $3.00 426 425 753 Duplicate Multi-Purpose $4.00 750 828 Duplicate Commercial $3.00 2 1 1 Duplicate Commercial $4.00 1 1 Duplicate Lifetime $4.00 174 233TOTAL OTHER LICENSES 428 426 754 1,052 1,221PERMITS: PRICE 2002 2003 2004 2005 2006 Goose Special Management Permit $10.00 186 87 21 Pheasant Special Mgmnt Permit $10.00 5,839 6,013 6,010 5,995 5,926 Conservation Order Special Mgmt Permit $10.00 229 243 249 Conservation Order Special Mgmt Permit $10.50 272 206TOTAL PERMITS 6,254 6,343 6,280 6,267 6,132STAMPS AND TAGS: PRICE 2002 2003 2004 2005 2006 Conservation Stamps $10.00 186,535 181,599 168,992 Conservation Stamps $10.50 169,573 176,043 Elk Special Management Stamp $5.00 15,762 Elk Special Management Stamp $10.00 15,308 Elk Special Management Stamp $10.50 14,397 14,064 Wildlife Damage Management Stamp $5.00 Wildlife Damage Management Stamp $10.00 240 220 320 365 275 Reciprocity Stamps $10.00 7,809 6,577 6,616 7,098 7,049 Interstate Game Tags $3.00 14,763 15,227 Interstate Game Tags $5.00 15,829 15,181 16,367TOTAL STAMPS AND TAGS 209,347 219,385 207,065 206,614 213,798TROPHY GAME LICENSES: PRICE 2002 2003 2004 2005 2006 Resident Black Bear $30.00 2,675 2,601 Resident Black Bear $36.00 2,702 Resident Black Bear $37.00 2,651 2,724 Nonres Black Bear $250.00 232 289 Nonres Black Bear $300.00 247 Nonres Black Bear $301.00 253 262TOTAL BLACK BEAR LICENSES 2,907 2,890 2,949 2,904 2,986 Resident Mountain Lion $20.00 1,423 1,457 Resident Mountain Lion $30.00 Resident Mountain Lion $24.00 1,396 Resident Mountain Lion $25.00 1,423 1,441 Resident Additional Mountain Lion $15.00 1 3 Resident Additional Mountain Lion $16.00 3 3 Nonres Mountain Lion $250.00 121 150 Nonres Mountain Lion $300.00 130 Nonres Mountain Lion $301.00 122 109 Nonres Additional Mountain Lion $75.00 1 Nonres Additional Mountain Lion $76.00TOTAL MOUNTAIN LION LICENSES 1,544 1,608 1,530 1,548 1,553
C-15

STATEWIDE FIVE-YEAR COMPARISON OF LICENSE SALESWILD BISON LICENSES: PRICE 2002 2003 2004 2005 2006 Resident Wild Bison $275.00 53 51 Resident Wild Bison $330.00 48 Resident Wild Bison $331.00 45 44 Nonresident Wild Bison $1,688.00 6 5 Nonresident Wild Bison $2,100.00 4 Nonresident Wild Bison $2,101.00 4 8TOTAL BISON LICENSES: 59 56 52 49 52
2002 2003 2004 2005 2006GRAND TOTAL LICENSES: 831,568 842,008 815,095 817,198 846,754
HIP PERMITS ISSUED: Total 10,173 (7,992 manual permits issued; 2,181 issued via internet)
C-16

EXPENDITURE ALLOCATIONS FY PROGRAM -- FY 07
COSTS BEFORE GEN'L WILDLIFE COSTS AFTERCODE PROGRAM ALLOCATION ALLOCATION* ALLOCATION
AA GENERAL WILDLIFE 11,197,301
BC ANTELOPE 2,411,668 755,364 3,167,032
BD ELK 8,515,822 2,667,261 11,183,083
BE ROCKY MOUNTAIN SHEEP 913,558 286,138 1,199,696
BF MOOSE 532,902 166,912 699,814
BG ROCKY MOUNTAIN GOAT 45,102 14,127 59,229
BJ MOUNTAIN LION 338,746 106,099 444,845
BK BLACK BEAR 397,625 124,541 522,166
BL GRIZZLY BEAR 900,246 281,968 1,182,214
BM MULE DEER 3,918,446 1,227,306 5,145,752
BN WHITE-TAILED DEER 347,986 108,994 456,980
BP BISON 16,698 5,230 21,928
BW WOLF 309,620 96,977 406,597
CA SMALL GAME 72,866 22,823 95,689
CB GAME BIRDS 3,353 1,050 4,403
CC PHEASANTS 799,442 250,395 1,049,837
CF TURKEY 161,424 50,560 211,984
CG PARTRIDGE 1,876 588 2,464 CR BLUE/RUFFED GROUSE 27,586 8,640 36,226 CT SAGE GROUSE 1,711,643 536,108 2,247,751 CV SHARPTAILED GROUSE 19,517 6,113 25,630
DB GEESE 500,090 156,634 656,724
DC DUCKS 261,905 82,032 343,937
DD SWANS 111,404 34,893 146,297
DE DOVES 52,805 16,539 69,344
DF CRANES 80,558 25,232 105,790
FX SPORT FISH 11,594,641 3,631,585 15,226,226

EXPENDITURE ALLOCATIONS FY PROGRAM -- FY 07
COSTS BEFORE GEN'L WILDLIFE COSTS AFTERCODE PROGRAM ALLOCATION ALLOCATION* ALLOCATIONHB BOBCAT/LYNX 291,212 91,211 382,423 HC BEAVER 16,445 5,151 21,596
MB COMMERCIAL FISHERIES 29,085 9,110 38,195
NA NONGAME MAMMALS 183,976 57,624 241,600
NB NONGAME BIRDS 237,823 74,489 312,312
NC RAPTORS 79,902 25,026 104,928
ND NONGAME FISH 273,431 85,642 359,073
NE AMPHIBIANS/REPTILES 260,789 81,682 342,471
NF PREDATORY BIRDS 1,357 425 1,782 NH PEREGRINE FALCON 22,915 7,177 30,092 NJ BALD EAGLE 17,674 5,536 23,210
NK BLACK FOOTED FERRET 183,757 57,555 241,312
NL CANADIAN LYNX 5,346 1,674 7,020
NM PREBLES MEADOW MOUSE
NP PREDATORY MAMMALS 30,331 9,500 39,831
NR BLACK TAILED PRAR DOG 13,795 4,321 18,116
NS WHITE TAILED PRAR DOG 53,296 16,693 69,989
NW WYOMING TOAD 43 13 56
NX EXOTIC GAME 1,162 364 1,526
ZZ NONWILDLIFE 518,486 518,486
TOTAL PROGRAM COSTS 47,465,655 11,197,301 47,465,655 *Most costs for the Office of Director, Fiscal Services, Services(including remodeling and maintenance of regional office buildings, and Information/Education programs such as Wyoming wildlife magazine, information services, visitor centers, educational programs,etc. are included in General Wildlife and allocated on a percentage basis to specific department programs.

C-19
WGF Expenditures by Species - FY 07 (includes general fund non capital construction)
ELK24%
DEER12%
ANTELOPE7%
FISH31%
OTHER5%
T/E4%
MOOSE, SH,GOAT4%
MT LION1%
MIGRATORY BIRD3%
SMALL GAME/GAME BIRD8%
BLACK BEAR1%

EXPENDITURE ALLOCATIONS BY PROGRAM - Five-Year History (Includes General Wildlife Allocation)
PROGRAM 2,003 % 2004 % 2,005 % 2,006 % 2,007 % Antelope 2,827,952 6.98% 2,497,594 6.21% 3,025,576 7.16% 2,881,194 6.40% 3,167,032 6.67%
Elk 8,550,907 21.12% 8,837,890 21.98% 8,833,834 20.92% 10,789,073 23.98% 11,183,083 23.56%
Rocky Mountain Sheep 736,527 1.82% 986,233 2.45% 1,229,246 2.91% 1,066,634 2.37% 1,199,696 2.53%
Moose 617,427 1.52% 646,341 1.61% 1,004,466 2.38% 928,822 2.06% 699,814 1.47%
Rocky Mountain Goat 85,146 0.21% 90,268 0.22% 68,613 0.16% 35,806 0.08% 59,229 0.12%
Mountain Lion 499,805 1.23% 250,254 0.62% 335,197 0.79% 393,315 0.87% 444,845 0.94%
Black Bear 809,961 2.00% 466,154 1.16% 480,138 1.14% 482,313 1.07% 522,166 1.10%
Grizzly Bear 1,378,442 3.40% 937,890 2.33% 1,048,088 2.48% 1,237,122 2.75% 1,182,214 2.49%
Mule Deer 4,170,980 10.30% 5,260,386 13.08% 4,735,670 11.21% 4,813,400 10.70% 5,145,752 10.84%
White-tailed Deer 436,408 1.08% 362,474 0.90% 412,043 0.98% 520,579 1.16% 456,980 0.96%
Bison 26,313 0.06% 69,759 0.17% 33,162 0.08% 15,728 0.03% 21,928 0.05%
Wolf 506,029 1.25% 118,968 0.30% 498,312 1.18% 186,925 0.42% 406,597 0.86%
Small Game 33,767 0.08% 53,275 0.13% 62,989 0.15% 83,452 0.19% 95,689 0.20%
Game Birds 113,900 0.28% 57,453 0.14% 915 0.00% 885 0.00% 4,403 0.01%
Pheasants 895,270 2.21% 874,552 2.17% 936,535 2.22% 924,601 2.06% 1,049,837 2.21%
Turkey 272,393 0.67% 214,604 0.53% 304,936 0.72% 253,273 0.56% 211,984 0.45%
Partridge 44,886 0.11% 43,289 0.11% 2,102 0.00% 2,158 0.00% 2,464 0.01%
Blue/Ruffed Grouse 17,324 0.04% 18,661 0.05% 16,577 0.04% 16,611 0.04% 36,226 0.08%
Sage Grouse 979,917 2.42% 1,158,226 2.88% 1,395,137 3.30% 1,985,053 4.41% 2,247,751 4.74%

EXPENDITURE ALLOCATIONS BY PROGRAM - Five-Year History (Includes General Wildlife Allocation)
PROGRAM 2,003 % 2004 % 2,005 % 2,006 % 2,007 % Sharp-Tailed Grouse 39,304 0.10% 29,070 0.07% 26,713 0.06% 25,211 0.06% 25,630 0.05%
Geese 431,698 1.07% 367,575 0.91% 602,585 1.43% 866,266 1.93% 656,724 1.38%
Ducks 185,602 0.46% 149,015 0.37% 62,430 0.15% 98,893 0.22% 343,937 0.72%
Swans 311,047 0.77% 352,925 0.88% 129,526 0.31% 180,166 0.40% 146,297 0.31%
Doves 111,845 0.28% 74,903 0.19% 96,222 0.23% 70,904 0.16% 69,344 0.15%
Cranes 44,203 0.11% 28,417 0.07% 77,044 0.18% 56,979 0.13% 105,790 0.22%
Sport Fish 14,029,271 34.65% 14,101,248 35.07% 14,435,377 34.18% 14,300,540 31.78% 15,226,226 32.08%
Bobcat/Lynx 174,655 0.43% 221,064 0.55% 222,287 0.53% 301,166 0.67% 382,423 0.81%
Beaver 48,900 0.12% 33,998 0.08% 45,489 0.11% 9,278 0.02% 21,596 0.05%
Commercial Fisheries 17,674 0.04% 20,690 0.05% 43,615 0.10% 57,201 0.13% 38,195 0.08%
Nongame Mammals 183,609 0.45% 210,921 0.52% 235,140 0.56% 290,541 0.65% 241,600 0.51%
Nongame Birds 360,314 0.89% 393,752 0.98% 228,277 0.54% 322,229 0.72% 312,312 0.66%
Raptors 58,004 0.14% 135,319 0.34% 133,707 0.32% 128,083 0.28% 104,928 0.22%
Nongame Fish 60,732 0.15% 151,536 0.38% 298,081 0.71% 397,787 0.88% 359,073 0.76%
Amphibians/Reptiles 173,350 0.43% 93,110 0.23% 162,745 0.39% 236,282 0.53% 342,471 0.72%
Predatory Birds 498 0.00% 1,809 0.00% 2,818 0.01% 6,374 0.01% 1,782 0.00%
Peregrine Falcon 54,621 0.13% 46,309 0.12% 87,545 0.21% 61,929 0.14% 30,092 0.06%
Bald Eagle 27,291 0.07% 23,026 0.06% 40,725 0.10% 14,030 0.03% 23,210 0.05%
Black-Footed Ferret 30,330 0.07% 80,867 0.20% 115,837 0.27% 258,023 0.57% 241,312 0.51%

EXPENDITURE ALLOCATIONS BY PROGRAM - Five-Year History (Includes General Wildlife Allocation)
PROGRAM 2,003 % 2004 % 2,005 % 2,006 % 2,007 % Canadian Lynx 187 0.00% 1,475 0.00% 2,262 0.01% 17,428 0.04% 7,020 0.01%
Prebles Jumping Mouse 443 0.00% 99 0.00% *** 164 0.00% 0.00%
Predatory Mammals 175,646 0.43% 90,785 0.23% 62,334 0.15% 86,157 0.19% 39,830 0.08%
Black-Tailed Prairie Dog 332,885 0.82% 119,605 0.30% 60,362 0.14% 49,795 0.11% 18,116 0.04%
White-Tailed Prairie Dog 936 0.00% 2,416 0.01% 4,720 0.01% 17,273 0.04% 69,989 0.15%
Wyoming Toad 137,343 0.34% 36,828 0.09% 702 0.00% 1,135 0.00% 56 0.00%
Exotic Game 76,644 0.19% 104,323 0.26% 99,471 0.24% 8,942 0.02% 1,526 0.00%
Nonwildlife 418,736 1.03% 394,642 0.98% 529,280 1.25% 512,834 1.14% 518,486 1.09%
TOTAL PROGRAM COSTS 40,489,122 100.00% 40,209,998 100.00% 42,228,830 100.00% 44,992,554 100.00% 47,465,655 100.00%
* because program costs were negligible, they are included in Bobcat and Beaver program costs.** because program costs were negligible, they are included with other waterfowl management costs.*** because the program is new, there are no previous reporting figures.

ALL AGENCY EXPENDITURES ON AN ACTIVITY BASIS
2003 2004 2005 2006* 2007#num ACTIVITY DESCRIPTION AMT % AMT % AMT % AMT % AMT %001 Legal research 864 0.00 11,218 0.03 174 0.00 9,016 0.02 86,453 0.18002 Legal briefs 8,689 0.02 5,358 0.01 105 0.00 2,044 0.00003 Legal pleadings 646 0.00 4,171 0.01 5,730 0.01004 Legal - court appearances 2,198 0.01 2,526 0.01 78 0.00 1,053 0.00 2,065 0.00005 Legal conferences
051 Fee Title Acq-Aquatic Habitat 327,357 0.81 200 0.00 555 0.00052 Fee Title Acq- Rip Habitat 1,868 0.00 9,124 0.02 5,045 0.01 3,090 0.01 410 0.00053 Fee Title Acq- Ter Habitat 26,877 0.07 427,684 1.06 15,650 0.04 30,307 0.07 17,809 0.04054 Fee Title Acq- Boat Access 764 0.00 271 0.00 325 0.00 340 0.00055 Fee Title Acq- Public Access 114 0.00 50 0.00 2,855 0.01 2,073 0.00056 Fee Title Acq- Dept Facilities 6,678 0.02 17,028 0.04 12,904 0.03 8,888 0.02 9,764 0.02061 Non-Fee Title- Aquatic Habitat 2,912 0.01 6,894 0.02 3,283 0.01 57,722 0.13 12,513 0.03062 Non-Fee Title- Rip Habitat 4,805 0.01 1,802 0.00 4,274 0.01 6,628 0.01 4,666 0.01063 Non-Fee Title- Ter Habitat 30,676 0.08 57,769 0.14 50,683 0.12 73,214 0.16 170,695 0.36064 Non-Fee Title- Boat Access 8,559 0.02 6,847 0.02 4,527 0.01 82,818 0.18 7,591 0.02065 Non-Fee Title-Public Access 480,403 1.19 527,205 1.31 574,139 1.36 647,368 1.44 724,999 1.53066 Non-Fee Title-Dept Facilities 4,747 0.01 4,931 0.01 3,871 0.01 2,504 0.01 1,277 0.00
100 Administration 5,239,673 12.94 5,319,143 13.23 5,674,710 13.44 6,164,379 13.70 5,259,402 11.08105 Clerical 856,844 2.12 825,573 2.05 905,987 2.15 937,430 2.08 935,541 1.97110 License Sales & Accounting 1,146,692 2.83 1,153,364 2.87 1,159,805 2.75 1,801,258 4.00 1,884,575 3.97114 Product Sales & Alt Funding 126,873 0.31 113,255 0.28 125,090 0.30 135,714 0.30 111,520 0.23115 Fiscal 650,223 1.61 643,042 1.60 752,326 1.78 682,333 1.52 957,358 2.02121 Management Planning 728,383 1.80 671,215 1.67 787,240 1.86 914,539 2.03 985,114 2.08122 Strategic Planning 204,729 0.51 213,517 0.53 243,581 0.58 178,605 0.40 181,769 0.38125 Procurement & Inventory 384,922 0.95 144,086 0.36 301,150 0.71 595,744 1.32 613,888 1.29130 Regulations 167,173 0.41 161,602 0.40 148,651 0.35 171,630 0.38 256,174 0.54132 Season Setting 104,817 0.26 121,101 0.30 105,999 0.25 110,127 0.24 170,457 0.36135 Grant-in-Aid Administration 41,345 0.10 40,463 0.10 85,585 0.20 88,345 0.20 131,548 0.28140 Inter-Agency communications 647,428 1.60 670,011 1.67 649,293 1.54 758,520 1.69 775,247 1.63141 Mngt Info Systems(LE & LIC) 621,551 1.54 495,885 1.23 604,632 1.43 287,154 0.64 761,018 1.60142 Mngt Info Systems(other) 94,738 0.23 204,820 0.51 107,888 0.26 99,585 0.22 117,686 0.25

2003 2004 2005 2006* 2007#num ACTIVITY DESCRIPTION AMT % AMT % AMT % AMT % AMT %143 Mngt Info Systems-Hdw/Soft 243,003 0.60 198,652 0.49 339,690 0.80 578,691 1.29 704,773 1.48145 Intra-Agency Communications 803,828 1.99 986,836 2.45 989,670 2.34 1,147,356 2.55 1,107,658 2.33149 Commuting Mileage 1,307 0.00 4,328 0.01 6,254 0.01 8,901 0.02 28,051 0.06
150 Hunter Safety 181,503 0.45 171,068 0.43 163,725 0.39 136,839 0.30 147,237 0.31155 Conservation Education 289,623 0.72 223,509 0.56 220,450 0.52 235,521 0.52 263,145 0.55156 Aquatic Education 76,850 0.19 71,676 0.18 84,323 0.20 70,733 0.16 62,512 0.13158 Mass Media Presentations 78,696 0.19 77,514 0.19 100,740 0.24 123,196 0.27 179,868 0.38160 Public Contacts 1,258,604 3.11 1,320,920 3.29 1,381,499 3.27 1,410,750 3.14 1,463,855 3.08165 Info Documents & Displays 772,528 1.91 725,474 1.80 774,396 1.83 881,366 1.96 1,002,211 2.11170 Wyo Wildlife Magazine 465,362 1.15 471,306 1.17 499,757 1.18 487,433 1.08 504,920 1.06175 Extension Service 62,182 0.15 50,599 0.13 56,679 0.13 70,974 0.16 45,974 0.10180 In-Service Training 1,198,385 2.96 992,824 2.47 1,175,375 2.78 1,104,752 2.46 1,140,475 2.40181 Instructional Training 55,202 0.14 35,734 0.09 84,545 0.20 76,244 0.17 105,577 0.22
201 Habitat Dvmt on Priv Land 33,120 0.08 6,247 0.02 2,927 0.01 19,559 0.04 38,953 0.08210 Department Facility Dev 1,104,204 2.73 355,781 0.88 570,197 1.35 1,196,816 2.66 449,807 0.95231 Wldlife Rearing Facility Dev 257,651 0.64 238,304 0.59 329,293 0.78 145,604 0.32 955,513 2.01232 Watering Facility Dev 48,110 0.12 8,095 0.02 398,592 0.94 110,860 0.25 50,116 0.11233 Motor Boat Access Dev 854,741 2.11 548,122 1.36 1,006,647 2.38 512,878 1.14 752,051 1.58234 Stream Habitat Develpmnt 411,326 1.02 583,328 1.45 124,115 0.29 79,038 0.18 99,741 0.21235 Reservoir/Lake Habitat Dev 9,514 0.02 9,267 0.02 7,799 0.02 18,713 0.04 15,804 0.03236 Impoundment Development 26,786 0.07 2,941 0.01 959 0.00 2,197 0.00 3,553 0.01236 NEPA Development 14,973 0.04 4,031 0.01 8,413 0.02 45,491 0.10 4,778 0.01240 Riparian Habitat Dev 207,667 0.51 92,298 0.23 42,955 0.10 32,706 0.07 22,232 0.05250 Terrestrial Habitat Dev 15,132 0.04 18,169 0.05 11,364 0.03 27,157 0.06 83,340 0.18260 Public Facility Development 77,825 0.19 245,513 0.61 227,243 0.54 16,834 0.04 8,736 0.02270 Cropland Development 65 0.00 537 0.00 3,981 0.01280 Transport Facility Dev 11,303 0.03 1,521 0.00 1,762 0.00 538 0.00290 Fence Construction 21,551 0.05 3,966 0.01 5,113 0.01 27,274 0.06 75,691 0.16299 Other Misc Public Dev 356 0.00 464 0.00 898 0.00 666 0.00 1,153 0.00300 Routine Enforcement 1,445,324 3.59 1,521,509 3.78 1,423,828 3.37 1,568,165 3.49 1,559,401 3.29310 Enforcement Investigations 511,221 1.27 555,736 1.38 592,248 1.40 544,815 1.21 603,164 1.27320 Enforcement Administration 281,100 0.70 289,749 0.72 374,954 0.89 237,380 0.53 297,714 0.63
401 Habitat Mntn on Priv Land 1,106 0.00 966 0.00 784 0.00 6,064 0.01 8,930 0.02
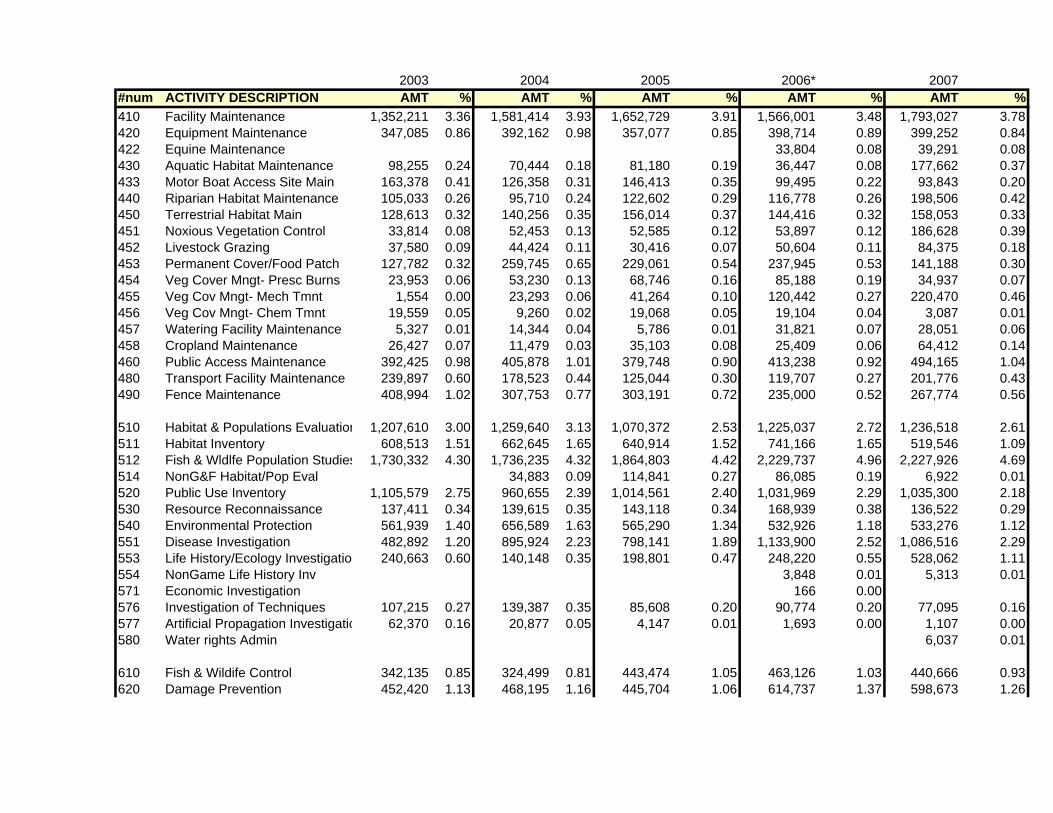
2003 2004 2005 2006* 2007#num ACTIVITY DESCRIPTION AMT % AMT % AMT % AMT % AMT %410 Facility Maintenance 1,352,211 3.36 1,581,414 3.93 1,652,729 3.91 1,566,001 3.48 1,793,027 3.78420 Equipment Maintenance 347,085 0.86 392,162 0.98 357,077 0.85 398,714 0.89 399,252 0.84422 Equine Maintenance 33,804 0.08 39,291 0.08430 Aquatic Habitat Maintenance 98,255 0.24 70,444 0.18 81,180 0.19 36,447 0.08 177,662 0.37433 Motor Boat Access Site Main 163,378 0.41 126,358 0.31 146,413 0.35 99,495 0.22 93,843 0.20440 Riparian Habitat Maintenance 105,033 0.26 95,710 0.24 122,602 0.29 116,778 0.26 198,506 0.42450 Terrestrial Habitat Main 128,613 0.32 140,256 0.35 156,014 0.37 144,416 0.32 158,053 0.33451 Noxious Vegetation Control 33,814 0.08 52,453 0.13 52,585 0.12 53,897 0.12 186,628 0.39452 Livestock Grazing 37,580 0.09 44,424 0.11 30,416 0.07 50,604 0.11 84,375 0.18453 Permanent Cover/Food Patch 127,782 0.32 259,745 0.65 229,061 0.54 237,945 0.53 141,188 0.30454 Veg Cover Mngt- Presc Burns 23,953 0.06 53,230 0.13 68,746 0.16 85,188 0.19 34,937 0.07455 Veg Cov Mngt- Mech Tmnt 1,554 0.00 23,293 0.06 41,264 0.10 120,442 0.27 220,470 0.46456 Veg Cov Mngt- Chem Tmnt 19,559 0.05 9,260 0.02 19,068 0.05 19,104 0.04 3,087 0.01457 Watering Facility Maintenance 5,327 0.01 14,344 0.04 5,786 0.01 31,821 0.07 28,051 0.06458 Cropland Maintenance 26,427 0.07 11,479 0.03 35,103 0.08 25,409 0.06 64,412 0.14460 Public Access Maintenance 392,425 0.98 405,878 1.01 379,748 0.90 413,238 0.92 494,165 1.04480 Transport Facility Maintenance 239,897 0.60 178,523 0.44 125,044 0.30 119,707 0.27 201,776 0.43490 Fence Maintenance 408,994 1.02 307,753 0.77 303,191 0.72 235,000 0.52 267,774 0.56
510 Habitat & Populations Evaluation 1,207,610 3.00 1,259,640 3.13 1,070,372 2.53 1,225,037 2.72 1,236,518 2.61511 Habitat Inventory 608,513 1.51 662,645 1.65 640,914 1.52 741,166 1.65 519,546 1.09512 Fish & Wldlfe Population Studies 1,730,332 4.30 1,736,235 4.32 1,864,803 4.42 2,229,737 4.96 2,227,926 4.69514 NonG&F Habitat/Pop Eval 34,883 0.09 114,841 0.27 86,085 0.19 6,922 0.01520 Public Use Inventory 1,105,579 2.75 960,655 2.39 1,014,561 2.40 1,031,969 2.29 1,035,300 2.18530 Resource Reconnaissance 137,411 0.34 139,615 0.35 143,118 0.34 168,939 0.38 136,522 0.29540 Environmental Protection 561,939 1.40 656,589 1.63 565,290 1.34 532,926 1.18 533,276 1.12551 Disease Investigation 482,892 1.20 895,924 2.23 798,141 1.89 1,133,900 2.52 1,086,516 2.29553 Life History/Ecology Investigatio 240,663 0.60 140,148 0.35 198,801 0.47 248,220 0.55 528,062 1.11554 NonGame Life History Inv 3,848 0.01 5,313 0.01571 Economic Investigation 166 0.00576 Investigation of Techniques 107,215 0.27 139,387 0.35 85,608 0.20 90,774 0.20 77,095 0.16577 Artificial Propagation Investigatio 62,370 0.16 20,877 0.05 4,147 0.01 1,693 0.00 1,107 0.00580 Water rights Admin 6,037 0.01
610 Fish & Wildife Control 342,135 0.85 324,499 0.81 443,474 1.05 463,126 1.03 440,666 0.93620 Damage Prevention 452,420 1.13 468,195 1.16 445,704 1.06 614,737 1.37 598,673 1.26

2003 2004 2005 2006* 2007#num ACTIVITY DESCRIPTION AMT % AMT % AMT % AMT % AMT %630 Damage Claims 757,060 1.88 779,294 1.94 793,767 1.88 926,066 2.06 972,426 2.05
710 Fish & Wldlfe Rearing 1,534,287 3.82 1,491,052 3.71 1,488,404 3.52 1,691,014 3.76 1,681,710 3.54712 Fish Egg Collection 180,618 0.45 201,452 0.50 196,880 0.47 196,117 0.44 205,370 0.43715 Wildlife Stocking-Restoration 7,798 0.02 9,977 0.02 6,666 0.02 6,086 0.01 16,118 0.03716 Wildlife Stocking-Maintenance 139,126 0.35 173,536 0.43 237,640 0.56 243,657 0.54 198,316 0.42717 Wildlife Stocking-Put&Take 115,181 0.29 104,123 0.26 103,412 0.24 110,869 0.25 123,919 0.26718 Wildlife Stocking-New Species E 11,546 0.03 2,431 0.01 294 0.00 673 0.00 1,770 0.00720 Wildlife Feeding 1,264,707 3.15 904,103 2.25 1,325,159 3.14 1,010,609 2.25 1,359,412 2.86730 Trapping & Transplanting 27,903 0.07 19,122 0.05 33,761 0.08 93,223 0.21 194,844 0.41
810 Paid Leave-Military, Admin 335,484 0.83 188,696 0.47 136,757 0.32 136,501 0.30 112,834 0.24811 Paid Leave-Annual 1,630,032 4.05 1,561,230 3.88 1,642,387 3.89 1,632,214 3.63 1,670,143 3.52812 Paid Leave-Sick 386,924 0.96 352,465 0.88 372,426 0.88 380,110 0.84 400,002 0.84813 Paid Leave-Comp Time Off 156,855 0.39 165,408 0.41 232,398 0.55 134,461 0.30 107,715 0.23814 Paid Leave-Holiday 596,647 1.48 689,214 1.71 704,033 1.67 742,358 1.65 787,773 1.66815 Paid Leave - Bee Time 78,302 0.17 107,189 0.23816 Paid Leave - Personal Day 3,058 0.01 60,315 0.13830 Employee Moving 28,419 0.07 22,857 0.06 33,311 0.08 25,889 0.06 50,574 0.11
900 Boating Enforcement 227,092 0.56 197,708 0.49 251,676 0.60 258,270 0.57 249,879 0.53905 Boating Accident Invest 6,703 0.02 2,859 0.01 1,976 0.00 5,979 0.01 10,045 0.02910 Boating Certificate & Sales 35,387 0.09 40,271 0.10 43,070 0.10 47,088 0.10 51,847 0.11915 Boating Administration 65,471 0.16 46,885 0.12 52,412 0.12 88,781 0.20 77,008 0.16920 Boating Education 4,576 0.01 31,542 0.08 20,070 0.05 13,904 0.03 11,363 0.02925 Search & Rescue 2,102 0.01 2,881 0.01 4,323 0.01 4,420 0.01 4,416 0.01930 Local Law Enforcement Assistan 8,609 0.02 10,861 0.03 9,041 0.02 8,786 0.02 9,522 0.02935 Boating Buoy Maintenance 3,578 0.01 6,414 0.01 3,742 0.01940 Boating Equip/Supp Proc 691 0.00 782 0.00 282 0.00
TOTAL 40,489,121 100 40,204,284 100 42,228,139 100 44,992,554 100 47,465,655 100
*includes general fund expenditures of $1,590,323 in fy 07 for vet services and sage grouse program
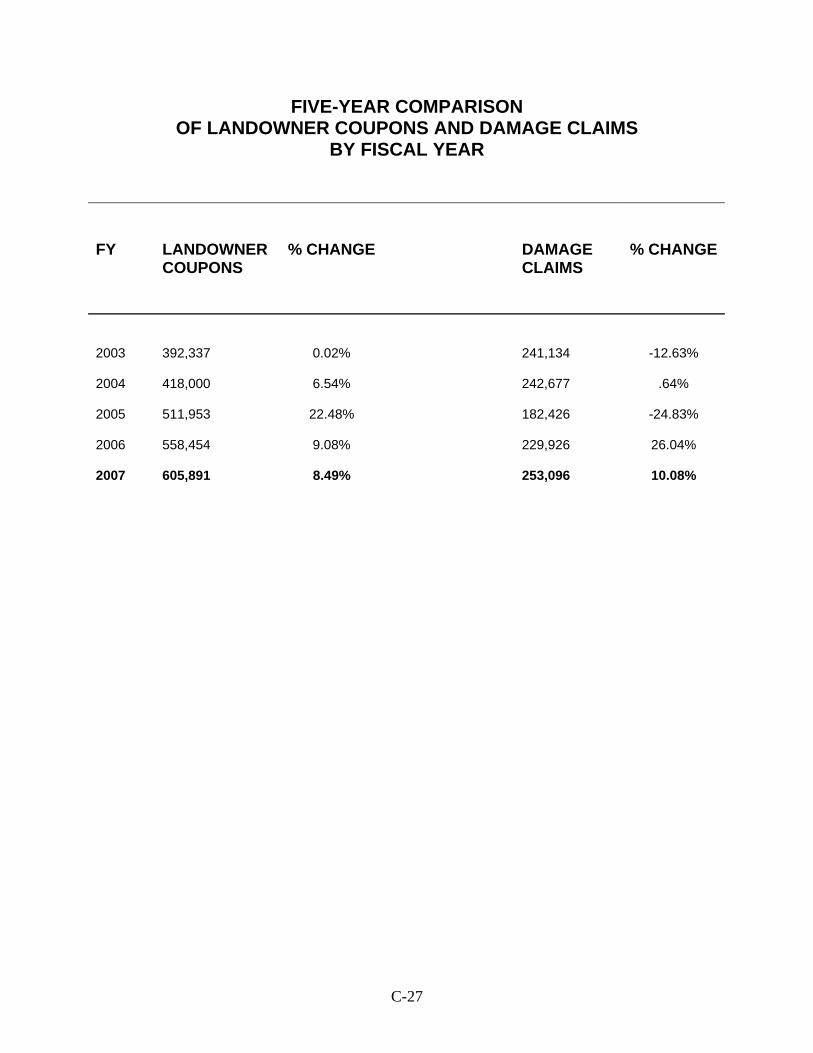
C-27
FIVE-YEAR COMPARISON OF LANDOWNER COUPONS AND DAMAGE CLAIMS
BY FISCAL YEAR FY LANDOWNER
COUPONS % CHANGE DAMAGE
CLAIMS % CHANGE
2003 392,337 0.02% 241,134 -12.63% 2004 418,000 6.54% 242,677 .64% 2005 511,953 22.48% 182,426 -24.83% 2006 558,454 9.08% 229,926 26.04% 2007 605,891 8.49% 253,096 10.08%

REFERENCES Responsive Management. 1998. Wyoming 1997 hunting expenditures. Wyoming Game
and Fish Department. Responsive Management, Harrisonburg, VA. _____. 2001. Wyoming small game/upland game bird expenditure survey. Wyoming
Game and Fish Department. Responsive Management, Harrisonburg, VA. _____. 2002. Hunting and trapping expenditures in Wyoming during the 2001 season.
Wyoming Game and Fish Department. Responsive Management, Harrisonburg, VA.
_____. 2004. Wyoming resident and nonresident deer, elk, and antelope hunter
expenditure survey. Wyoming Game and Fish Department. Responsive Management, Harrisonburg, VA.
University of Wyoming, Department of Geography and Recreation. 1990. Hunting and
fishing expenditure estimates for Wyoming, 1989. Wyoming Game and Fish Department. Department of Geography and Recreation. 141 pp.
2003 U.S. Department of the Interior, Fish and Wildlife Service and U.S. Department of
Commerce, U.S. Census Bureau. 2001 National Survey of Fishing, Hunting, and Wildlife-Associated Recreation: Wyoming. 79 pp.
Wyoming Game and Fish Department 2006 Job Completion Reports. _____. 2006 License Sales Data. _____. 2007. 2006 Annual Report of Big and Trophy Game Harvest. 299 pp. _____. 2007. 2006 Annual Report of Small and Upland Game Harvest. 120 pp. Wyoming Game and Fish Department 2007 Internal Client Satisfaction Survey Report. DISC Information Services Corporation. 2007 External Strategic Plan Survey. St. Cloud,
MN


![8 Eigenvectors and the Anisotropic Multivariate Gaussian …jrs/189s17/lec/08.pdf · 2017. 2. 14. · 777 777 777 777 777 5 [diagonal matrix of eigenvalues] Defn. of “eigenvector”:](https://img.dokumen.tips/doc/110x75/61216a6db677231115104a22/8-eigenvectors-and-the-anisotropic-multivariate-gaussian-jrs189s17lec08pdf.jpg)