Embed Size (px)
Citation preview

U.S. Railroad Safety Statistics and Trends
Peter W. French
AVP- Safety & Performance Analysis
Association of American Railroads
July 29, 2008

Railroad Safety: Topics
• Safety Statistics & Trends– Train Safety (Train Accidents)– Grade Crossing Safety– Trespassers– Passenger Safety– Employee Safety– Hazardous Materials Safety

Railroad Safety: Topics (continued)
• RR Initiatives to Improve Safety
• Improvements in Technology
• Safety Programs
• Risk-Based Safety Performance Standards

U.S. Railroad Safety Statistics:Main Themes
• Railroads have dramatically improved safety over the last two and a half decades.
• Railroads compare favorably with other industries & transportation modes.
• The most troubling railroad safety problems arise from factors largely outside railroad control.
• Railroads have implemented numerous and effective technological improvements and company-wide safety programs.

U.S. Railroad Safety Statistics:
In 2007, U.S. railroads achieved their safest year ever by the following major safety yardsticks:
• Train Accident Rate, down 10% from 2006.• Grade Crossing Collisions and Collision Rates,
down 6% and 4% from 2006. Employee Casualties and Rates missed the 2006
records by 0.8% and 1.4%.
Sources: FRA website: http://safetydata.fra.dot.gov/Prelim/2007/r01.htm (Preliminary 2007 data) FRA, Railroad Safety Statistics Annual Report, 1997-2005, Tables 1-1, 1-2. FRA, Accident/Incident Bulletin, 1975-1996, Tables 1, 51.

In 2007, 95% of rail-related fatalities weregrade crossing users and trespassers.
Trespassers: 473 (56%)
Grade Crossing Users: 337 (39%)
Employees: 17Passengers: 4 Others: 20
Sources: FRA website: http://safetydata.fra.dot.gov/Prelim/2007/r03.htm (preliminary 2007 data). FRA, Railroad Safety Statistics Annual Report 2005, Table 1-3.

In 2007, 60% of rail-related injuries were incurred by employees on duty.
Passengers: 1,058
Others: 1,254
Sources: FRA website: http://safetydata.fra.dot.gov/Prelim/2007/r03.htm (preliminary 2007 data). FRA, Railroad Safety Statistics Annual Report 2005, Table 1-3.
Employees 5,263
Grade Crossing Users: 828
Trespassers: 398

Train accidents per million train-miles have dropped 71% since 1980 and 30% since 1990, to a new low.
0
2
4
6
8
10
12
1980 1985 1990 1995 2000 2007
Sources: FRA website: http://safetydata.fra.dot.gov/Prelim/2007/r01.htm (preliminary 2007 data). FRA, Railroad Safety Statistics Annual Report, 1997-2005, Tables 1-1, 1-2. FRA, Accident/Incident Bulletin, 1980-1996, Tables 19, 36.Note: Excludes grade crossing accidents.
11.43
4.73
3.29
3.54

Train collisions per million train-miles have dropped 85% since 1980 and 51% since 1990.
0.0
0.5
1.0
1.5
2.0
1980 1985 1990 1995 2000 2007
Sources: FRA website: http://safetydata.fra.dot.gov/Prelim/2007/r01.htm (preliminary 2007 data). FRA, Railroad Safety Statistics Annual Report, 1997-2005, Tables 1-1, 5-6. FRA, Accident/Incident Bulletin, 1980-1996, Tables 19, 36.Note: Excludes grade crossing collisions.
1.67
0.52
0.25

Mainline train collisions per million train-miles on Class I freight railroads have dropped 85% since 1980 and 54% since 1990.
0.0
0.2
0.4
0.6
1980 1985 1990 1995 2000 2007
Sources: FRA website: http://safetydata.fra.dot.gov/Prelim/2007/r01.htm. AAR Analysis of FRA train accident database through 2007. FRA, Railroad Safety Statistics Annual Report, 1997-2005, Tables 1-1, 5-6; FRA, Accident/Incident Bulletin, 1980-1996, Tables 19, 36. Note: Excludes grade crossing collisions. Includes passenger train collisions on Class I freight railroads.
0.52
0.254
0.057
All Collisions: All RRs
Mainline & Sidings: Class I Freight RRs All Consists
0.54
0.12Frt Trains Only
0.17
0.080
0.37

Derailments per million train-miles have dropped 74% since 1980 and 33% since 1990, to a new low.
0
2
4
6
8
10
1980 1985 1990 1995 2000 2007
Sources: FRA website: http://safetydata.fra.dot.gov/Prelim/2007/r01.htm & r02.htm (preliminary 2007 data) FRA, Railroad Safety Statistics Annual Report, 1997-2005, Tables 1-1, 5-6. FRA, Accident/Incident Bulletin, 1980-1996, Tables 19, 36.Note: Excludes grade crossing accidents.
3.52
8.98
2.38

Equipment-caused accidents per million train-miles have dropped 80% since 1980 and 42% since 1990.
0.0
0.5
1.0
1.5
2.0
2.5
1980 1985 1990 1995 2000 2007
Sources: FRA website: http://safetydata.fra.dot.gov/Prelim/2007/r01.htm & r02.htm (preliminary 2007 data) FRA, Railroad Safety Statistics Annual Report, 1997-2005, Tables 1-1, 5-9. FRA, Accident/Incident Bulletin, 1980-1996, Tables 19, 36.Note: Excludes grade crossing accidents.
0.70
0.40
2.03

Track-caused accidents per million train-miles have dropped 76% since 1980 and 28% since 1990, to a new low.
0
1
2
3
4
5
1980 1985 1990 1995 2000 2007
Sources: FRA website: http://safetydata.fra.dot.gov/Prelim/2007/r01.htm & r02.htm (preliminary 2007 data) FRA, Railroad Safety Statistics Annual Report, 1997-2005, Tables 1-1, 5-9. FRA, Accident/Incident Bulletin, 1980-1996, Tables 19, 36.Note: Excludes grade crossing accidents.
1.60
1.15
4.84

Human factors-caused accidents per million train-miles have dropped 61% since 1980 and 30% since 1990.
0.0
0.5
1.0
1.5
2.0
2.5
3.0
3.5
1980 1985 1990 1995 2000 2007
Sources: FRA website: http://safetydata.fra.dot.gov/Prelim/2007/r01.htm & r02.htm (preliminary 2007 data) FRA, Railroad Safety Statistics Annual Report, 1997-2005, Tables 1-1, 5-9. FRA, Accident/Incident Bulletin, 1980-1996, Tables 19, 36.Note: Excludes grade crossing accidents.
1.80
1.26
3.24
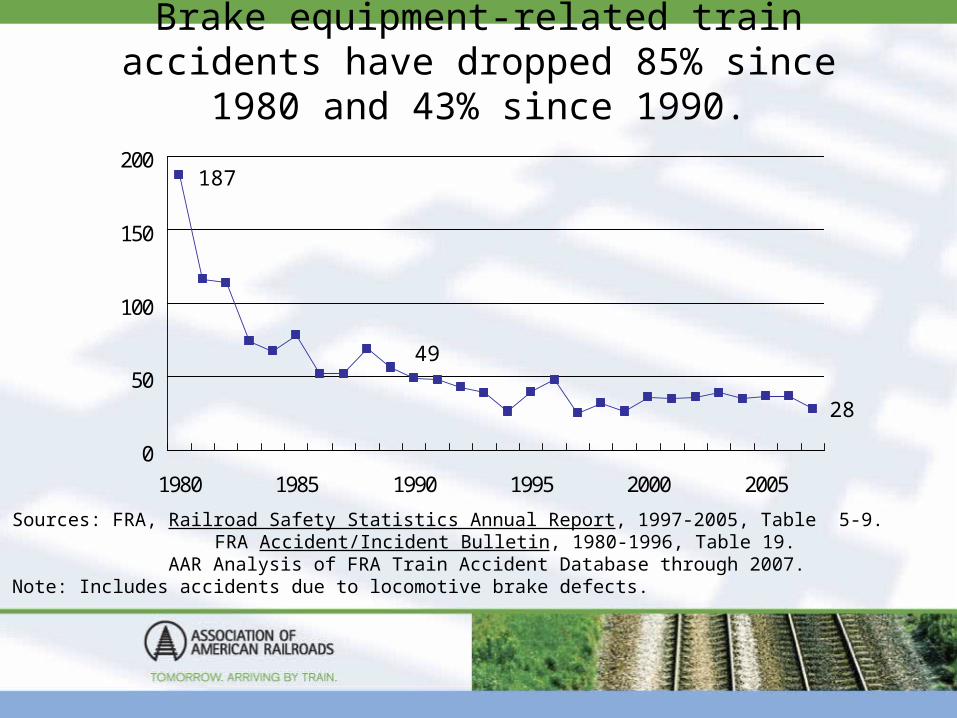
Brake equipment-related train accidents have dropped 85% since 1980 and 43% since 1990.
0
50
100
150
200
1980 1985 1990 1995 2000 2005
Sources: FRA, Railroad Safety Statistics Annual Report, 1997-2005, Table 5-9. FRA Accident/Incident Bulletin, 1980-1996, Table 19. AAR Analysis of FRA Train Accident Database through 2007. Note: Includes accidents due to locomotive brake defects.
187
49
28

Brake equipment-related train accident rates have dropped 86% since 1980 and 56% since 1990.
0.0
0.1
0.2
0.3
1980 1985 1990 1995 2000 2005
Sources: FRA, Railroad Safety Statistics Annual Report, 1997-2005, Table 1-1, 5-9. FRA Accident/Incident Bulletin, 1980-1996, Table 19, 36. AAR Analysis of FRA Train Accident Database through 2007.Note: Includes accidents due to locomotive brake defects.
0.261
0.080 0.035
Accidents per Million Train-Miles

Wheel equipment-related train accident rates have dropped 85% since 1980 and 54% since 1990.
0.0
0.1
0.2
0.3
0.4
0.5
1980 1985 1990 1995 2000 2005
Sources: FRA, Railroad Safety Statistics Annual Report, 1997-2005, Table 1-1, 5-9. FRA Accident/Incident Bulletin, 1980-1996, Table 19, 36. AAR Analysis of FRA Train Accident Database through 2007. Note: Includes accidents due to locomotive wheel defects.
0.411
0.135
0.062
Accidents per Million Train-Miles

Axle and bearings-related train accident rates have dropped 78% since 1980 and 54% since 1990.
0.0
0.1
0.2
0.3
1980 1985 1990 1995 2000 2005
Sources: FRA, Railroad Safety Statistics Annual Report, 1997-2005, Table 1-1, 5-9. FRA Accident/Incident Bulletin, 1980-1996, Table 19, 36. AAR Analysis of FRA Train Accident Database through 2007.Note: Includes accidents due to locomotive axle or bearing defects.
0.287
0.138
0.063
Accidents per Million Train-Miles

Truck component-related train accident rates have dropped 83% since 1980 and 50% since 1990.
0.0
0.1
0.2
0.3
0.4
0.5
1980 1985 1990 1995 2000 2005
Sources: FRA, Railroad Safety Statistics Annual Report, 1997-2005, Table 1-1, 5-9. FRA Accident/Incident Bulletin, 1980-1996, Table 19, 36. AAR Analysis of FRA Train Accident Database through 2007.Note: Includes accidents due to locomotive truck component defects.
0.450
0.153
0.076
Accidents per Million Train-Miles

Grade crossing collisions have declined 74% since 1980 and 52% since 1990.
0
2,000
4,000
6,000
8,000
10,000
12,000
1980 1985 1990 1995 2000 2007
Sources: FRA, Railroad Safety Statistics Annual Report, 1997-2005, Table 1-1. FRA Highway/Rail Crossing Accident/Incident & Inventory Bulletin, 1980-1996, Table S. FRA website: http://safetydata.fra.dot.gov/Prelim/2007r01.htm (preliminary 2007 data) Notes: Includes collisions involving pedestrians. Includes collisions at private crossings.
10,611
5,715
2,749

Grade crossing fatalities have declined 59% since 1980 and 52% since 1990.
0
200
400
600
800
1,000
1980 1985 1990 1995 2000 2007
Sources: FRA, Railroad Safety Statistics Annual Report, 1997-2005, Tables 1-1, 1-3. FRA Highway/Rail Crossing Accident/Incident & Inventory Bulletin, 1980-1996, Table S. FRA website: http://safetydata.fra.dot.gov/Prelim/2007/r01.htm (preliminary 2007 data) Note: Includes pedestrians, employees, passengers, and collisions at private crossings.
833
698
338

Grade crossing injuries have declined73% since 1980 and 57% since 1990.
0
1,000
2,000
3,000
4,000
1980 1985 1990 1995 2000 2007
Sources: FRA, Railroad Safety Statistics Annual Report, 1997-2005, Tables 1-1, 1-3. FRA Highway/Rail Crossing Accident/Incident & Inventory Bulletin, 1980-1996, Table S. FRA website: http://safetydata.fra.dot.gov/Prelim/2007/r01.htm (preliminary 2007 data) Note: Includes pedestrians, employees, passengers, and collisions at private crossings.
3,890
2,407
1,031

Grade crossing collision rates have declined for 29 consecutive years, 77% since 1980 and 63% since 1990.
0
4
8
12
16
1980 1985 1990 1995 2000 2007
Sources: FRA, Railroad Safety Statistics Annual Report, 1997-2005, Table 1-1. FRA Highway/Rail Crossing Accident/Incident & Inventory Bulletin, 1980-1996, Table S.FRA website: http://safetydata.fra.dot.gov/Prelim/2007/r01.htm & r02.htm (preliminary 2007 data) Note: Includes accidents involving pedestrians and collisions at private crossings.
14.79
9.39
3.47
Grade Crossing Collisions per Million Train-Miles

Since 1980, the total number of public crossings has declined 35%, while the number with gates has increased 146%.
0
50,000
100,000
150,000
200,000
250,000
1980 2007Sources: AAR Analysis of December 2007 FRA Grade Crossing Inventory Database. FRA, Railroad Safety Statistics Annual Report 2005, Table 9-3. FRA Highway/Rail Crossing Accident/Incident & Inventory Bulletin, 1980, Table 46.
35% Decrease
Passive 75%
Passive 54%
Lights 17%Lights 17%
Gates 8% Gates 29%

Grade crossing warning device upgrades work. Gates cut the accident & fatality rates by 93%.
0
50
100
150
200
250
300
Passive Flashing Lights Gates
No InjuryInjuryFatal
Source: AAR Analysis of FRA Grade Crossing Incident & Inventory Databases, using 1999-2003 incident data and the December 2003 inventory data.Note: Collision opportunities are measured here as the average number of trains per hour multiplied by the average number of vehicles per hour moving over each crossing. It is useful primarily as a measure of relative, not absolute, exposure, since the time period (hour) is arbitrary.
Grade Crossing Collisions per Billion Collision Opportunities296
63
21

Grade crossing collisions are usually caused by motorist error.
Drove Around Gate: 16%
Did Not Stop 41%
Sources: AAR Analysis of Highway-Rail Incident Database for 2007 (July 2008).FRA, Railroad Safety Statistics Annual Report 2005, Table 8-6.Note: Motor vehicle highway-rail incidents at public crossings.
Stopped on Tracks: 29%
Stopped, Proceeded 6%
Other 8%

Trespasser fatalities continue to be a significant safety problem.
0
150
300
450
600
1980 1985 1990 1995 2000 2007
Sources: FRA, Railroad Safety Statistics Annual Report, 1997-2005, Tables 1-2, 10-3. FRA Accident/Incident Bulletin, 1980-1996, Table 13. FRA website: http://safetydata.fra.dot.gov/Prelim/2007/r03.htm (preliminary 2007 data) Note: Excludes "trespasser" fatalities at grade crossings.
457543
473

But the trespasser fatality rate per million train miles was still the lowest in 25 years in 2005.
0.00
0.20
0.40
0.60
0.80
1.00
1980 1985 1990 1995 2000 2007
Sources: FRA, Railroad Safety Statistics Annual Report, 1997-2005, Tables 1-2, 10-3. FRA Accident/Incident Bulletin, 1980-1996, Table 13. FRA website: http://safetydata.fra.dot.gov/Prelim/2007/r03.htm (preliminary 2007 data) Note: Excludes "trespasser" fatalities at grade crossings.
0.64
0.89
0.60

85% of trespasser fatalities in 2007 resulted from being struck by trains or freight cars.
Struck by On-TrackEquipment 410
Source: AAR Analysis of FRA Casualty Database for 2007.FRA, RR Safety Statistics Annual Report 2005, Table 10-10.Note: Excludes "trespasser" fatalities at grade crossings.
Other 71
Train Accidents 3

Many Trespassers are Killed While Intoxicated.• A North Carolina study for the period 1990-1994 found that
78% of 128 trespassers killed on railroad property were intoxicated. The median blood alcohol level for this group was 2.5 times the legal limit.
• A 1994 South Carolina study of 24 train-related pedestrian fatalities found that 79% were intoxicated.
• Toxicology results on 78 of 132 railroad trespassers killed in Georgia in the period 1990-1996 found 40 (51%) with alcohol levels above 100 mg/dL.
• A 2005 survey of coroners and Chief Medical Examiners found that alcohol and/or drugs were judged to be a factor in 530 (57%) of 929 trespasser fatalities in the period 2002-2004 for which the additional data could be obtained.
Sources: Andrew Pelletier, MD, "Deaths Among Railroad Trespassers: The Role of Alcohol in Fatal Injuries,” Journal of the American Medical Association, Vol. 277, No. 13, April 2, 1997, pp. 1064-66.Center for Disease Control, Morbidity & Mortality Weekly Report, Vol. 48, No. 25, July 2, 1999.Bruce George, “Rail Trespasser Fatalities: Developing Demographic Profiles,” presentation to Transportation Research Board Annual Meeting, January 15, 2008.

Passengers are 15 to 20 times as likely to die on the highway as on a train.
0
4
8
12
16
1980 1985 1990 1995 2000 2005
Sources: BTS, U.S. Air Carrier Traffic Statistics, Domestic Sched & Unsched; NTSB, Aviation Accident Data Base;FHWA, Highway Statistics 2006, Table VM-1. NHTSA, Traffic Safety Facts 2006, Early Ed., Table 4, p. 18.FRA Accident/Incident Bulletin, Tables 13, 36; RR Safety Statistics Annual Report 2005, Tables 1-3, 2-9.Excludes 232 airline passenger fatalities in the Sept. 11, 2001 terrorist attacks.
Passenger Fatalities per Billion Passenger Miles
Highway
Railroads Airlines

Railroads and airlines have comparable passenger fatality rates.
0
1
2
3
4
5
1980 1985 1990 1995 2000 2005
Sources: BTS, U.S. Air Carrier Traffic Statistics, Domestic Sched & Unsched; NTSB, Aviation Accident Data Base;FRA Accident/Incident Bulletin, Tables 13, 36; RR Safety Statistics Annual Report 2005, Tables 1-3, 2-9.Note: 1993 RR fatalities included 42 killed in one Amtrak accident caused by a barge hitting & misaligninga RR bridge and another 6 killed by a gunman on the Long Island RR. Excludes 232 fatalities in 9/11 attacks.
Passenger Fatalities per Billion Passenger Miles
Railroads Airlines

Railroads have reduced employee casualty rates by 80% since 1980 and 71% since 1990.
0
2
4
6
8
10
12
1980 1985 1990 1995 2000 2007
Sources: FRA, Railroad Safety Statistics Annual Report, 1997-2005, Tables 1-2, 4-1. FRA Accident/Incident Bulletin, 1980-1996, Tables 13, 36. FRA website: http://safetydata.fra.dot.gov/Prelim/2007/r01.htm & r02.htm (preliminary 2007 data) Note: Casualties include fatalities as well as injuries and occupational illnesses.
11.16
7.59
2.19
Total Casualties per 100 Full-Time Employees

Railroads have lower employee injury rates than do other major industry groups.
0
1
2
3
4
Lost Workday Injuries & Illnesses per 100 Full Time Employees, 2006
Source: Bureau of Labor Statistics, http://www.bls.gov/iif/oshwc/osh/os/ostb1765.pdf

Railroads have lower employee injury rates than do other transportation modes.
0
2
4
6
8
RAILROADS
Barge
Truck
ing
Urban
Tran
sit
Airline
s
Lost Workday Injuries & Illnesses per 100 Full Time Employees, 2006
Source: Bureau of Labor Statistics, http://www.bls.gov/iif/oshwc/osh/os/ostb1765.pdf

Railroads have lower employee fatality rates than do other transportation modes.
0
10
20
30
40
RAILROADS
Airline
s
Transit
Truck
ing
Wate
r Tr.
(200
5)
Fatalities per 100,000 Full Time Employees, 2006
Sources: Bureau of Labor Statistics, National Census of Fatal Occupational Injuries, 2006, Table 2;And BLS Quarterly Census of Employment & Wages (QCEW) Program for number of employees.FRA website: http://safetydata.fra.dot.gov/Prelim/2006/r03.htm (preliminary 2006 data).FRA, Railroad Safety Statistics Annual Report 2005, Tables 1-1 and 1-2.

Railroads have about the same injury severityas do other industries.
0
10
20
30
40
50
60
RailroadsTransportAll Industry
Percent of Lost Workday Employee Injuries, 2006
Source: Bureau of Labor Statistics, Table R49. Number of nonfatal occupational injuries and illnessesinvolving days away from work by nature of injury and industry division, 2006. http://www.bls.gov/iif/oshwc/osh/case/ostb1841.pdf . AAR Analysis of FRA Casualty Database for 2006.See also FRA, Railroad Safety Statistics Annual Report 2005, Table 4-1.

Railroads have about the same injury severityas do other industries.
02468
10121416
RailroadsTransportAll Industry
Percent of Lost Workday Employee Injuries, 2006 (Sprains not shown)
Source: Bureau of Labor Statistics, Table R49. Number of nonfatal occupational injuries and illnessesinvolving days away from work by nature of injury and industry division, 2006. http://www.bls.gov/iif/oshwc/osh/case/ostb1841.pdf . AAR Analysis of FRA Casualty Database for 2006.See also FRA, Railroad Safety Statistics Annual Report 2005, Table 4-1.

U.S. railroads have had lower employee injury rates than have most major European railroads.
0
2
4
6
8
1987 1989 1991 1993 1995 1997 1999 2001
Sources: UIC, Statistics on Accidents at Work, 1993-2001. FRA, Accident/Incident Bulletin, Tables 43, 45, 46.FRA, Railroad Safety Statistics Annual Reports, 1997-2001, Tables 4-1, 1-1. UIC discontinued these stats after 2001.Notes: Excludes occupational illnesses. Excludes injuries with no days away from work. Includes fatal injuries.Data for Sweden & Norway (1993-96) and for U.S. (all years) is per 200,000 hours actually worked, hence higher.
Lost Workday Injuries per 100 Employees
Germany
Spain
BelgiumItaly
AustriaFrance
U.S.
BRNorway
Sweden Britain

The safest U.S. RRs have had lower employee injury rates than have the safest European RRs.
0
1
2
3
4
1987 1989 1991 1993 1995 1997 1999 2001
Sources: UIC, Statistics on Accidents at Work, 1993-2001. FRA, Accident/Incident Bulletin, Tables 43, 45, 46.FRA, Railroad Safety Statistics Annual Reports, 1997-2001, Tables 4-1, 1-1. UIC discontinued these stats after 2001.Notes: Excludes occupational illnesses. Excludes injuries with no days away from work. Includes fatal injuries.Data for Sweden & Norway (1993-96) and for U.S. (all years) is per 200,000 hours actually worked, hence higher.
Lost Workday Injuries per 100 Employees
NS
BR
Norway Sweden
CSX
IC
BNSF
UP

In 2007, train accidents and grade crossing collisions accounted for less than 4% of employee injuries.
All Other Incidents 96.35%
Source: FRA website: http://safetydata.fra.dot.gov/Prelim/2007/r03.htm (preliminary 2007 data) See also FRA, Railroad Safety Statistics Annual Report 2005, Table 1-3.
Train Accidents 1.71% Grade Crossing Collisions 1.94%

Railroads have reduced employee fatalities by 82% since 1980 and 57% since 1990.
0
20
40
60
80
100
1980 1985 1990 1995 2000 2007
Sources: FRA, Railroad Safety Statistics Annual Report, 1997-2005, Tables 1-2, 1-3, 4-2. FRA Accident/Incident Bulletin, 1980-1996, Tables 13. Employee on Duty Fatalities. FRA website: http://safetydata.fra.dot.gov/Prelim/2007/r03.htm (preliminary 2007 data)
97
40
17

Railroads employee fatality rates have fallen 51% since 1990.
0
4
8
12
16
20
1980 1985 1990 1995 2000 2007
Sources: FRA, Railroad Safety Statistics Annual Report, 1997-2005, Tables 1-1, 4-2. FRA Accident/Incident Bulletin, 1980-1996, Tables 13, 36. FRA website: http://safetydata.fra.dot.gov/Prelim/2007/r03.htm & r02.htm (preliminary 2007 data)
Employee On-Duty Fatalities per 100,000 Employees
7.0
14.5

Of 21 employee fatalities in 2007, 12 were due to being struck or crushed by moving on-track equipment.
Sources: News clippings and FRA, Monthly Reports on Employee Fatalities, 2007. FRA, Railroad Safety Statistics Annual Report, 1997-2005, Tables 1-2.
Road TrainCollision - 2
Switching, StruckOr Crushed By Cars orLocos. (“SOFA”)- 6
MOW – Other - 4
MOE – Electrocution - 1
MOW Struck by Train - 5
MOE – Highway Accident - 1
Grade XingCollision - 1
Transp, Struck by Train -1

Of 16 employee fatalities in 2006, none occurred in trainaccidents, 4 occurred in grade crossing collisions, and 9 were due to being struck by moving on-track equipment.
Sources: News clippings and FRA, Monthly Reports on Employee Fatalities, 2006. FRA, Railroad Safety Statistics Annual Report, 1997-2005, Tables 1-2.
Transp Switching, StruckOr Crushed By Cars orLocos. (“SOFA”)- 5
MOW In Hwy Accident - 1
MOE in Veh Collision - 1
MOW Struckby MOW Equip - 2
MOE in Grade XingCollision - 2
Transp in GradeCrossing Collision - 2
Other – 1 Veh struck bldg.
MOEStruck or Crushed by FrtCars - 2

Of 25 employee fatalities in 2005, 11 were due to being struck or crushed by moving on-track equipment and 8 were
in train or grade crossing collisions.
Sources: News clippings and FRA, Monthly Reports on Employee Fatalities, 2005. FRA, Railroad Safety Statistics Annual Report, 1997-2005, Tables 1-2.
Road TrainCollisions - 7
Switching, StruckOr Crushed By Cars orLocos. (“SOFA”)- 11
MOW In Hwy Accident - 2
Explosion - 1
MOW Struck by Train - 2
Electrocution - 1
Transportation,Not in TrainAccident
Transportation:Train Accident
Grade XingCollision - 1
Maint of Equip.
Maint. of Way

Hazmat accident rates have declined 87% since 1980 and 34% since 1990.
0.00
0.02
0.04
0.06
0.08
0.10
0.12
0.14
0.16
1980 1985 1990 1995 2000 2005Sources: FRA, RR Safety Statistics Annual Report, 1997-2005, Table 6-1. FRA, Accident/Incident Bulletin, Table 26. AAR Analysis of 2006 FRA Train Accident Database. Carloads from ICC/STB Waybill Sample, 1995-2006. Terminated carloads adjusted to counter known hazmat underreporting. Prior to 2003 terminated carloads overestimated by 10% to 15% due to inability to exclude duplicates associated with rebilling.
Train Accidents with a Release per Thousand Hazmat Carloads
0.143
0.0270.018
99.996% of Carloads are Accident Release Free

Accidents with a hazmat release have declined 61% since 1980.
0
20
40
60
80
100
120
140
1980 1985 1990 1995 2000 2007
Sources: FRA, RR Safety Statistics Annual Report, 1997-2005, Tables 6-1. FRA, Accident/Incident Bulletin, Table 26. AAR Analysis of 2007 FRA Train Accident Database.Note: An accident may involve releases from more than one car.
Reportable Train Accidents with a Hazmat Release
119
35
46

Hazmat incident release rates have declined 72% since 1980 and 58% since 1990.
0.0
0.2
0.4
0.6
0.8
1.0
1.2
1.4
1.6
1980 1985 1990 1995 2000 2005
Sources: USDOT, Pipeline & Hazardous Materials Safety Administration, Hazardous Materials Incidentsby Year & Mode. http://hazmat.dot.gov/files/hazmat/10year/10yearfrm.htm for 1997-2006.Includes releases in train accidents as well as non-accident releases. ICC/STB Waybill Sample.1995-2006. Terminated carloads adjusted to counter known hazmat underreporting. Prior to 2003 terminated carloads overestimated by 10% to 15% due to inability to exclude duplicates associated with rebilling.
Incidents per Thousand Hazmat Carloads
1.52
0.99
0.4299.96% Incident Free

Over the last 10 years, about 1.1% of train accidents have resulted in a release of hazardous materials.
No Hazmat Cars Present23,715 75.5%
Source: AAR Analysis of 1998-2007 FRA Train Accident Databases, July 2008.Note: Includes grade crossing train accidents meeting dollar threshold.
Hazmat Released 354 1.1%
Hazmat Cars inConsist 3,997 12.7%
Hazmat Cars Derailed or Damaged 3,360 10.7%

In 2007, about 1.6% of reportable train accidents resulted in a release of hazardous materials.
No Hazmat Cars Present2,098 73.3%
Source: AAR Analysis of Year 2007 FRA Train Accident Database, July 2008.Note: Includes grade crossing train accidents meeting dollar threshold.
Hazmat Released 46 1.6%
Hazmat Cars inConsist 416 14.5%
Hazmat Cars Derailed or Damaged 302 10.6%

Rail freight transport incurs about 12% of the fatalities that trucks do per trillion ton-miles.
0
500
1,000
1,500
2,000
2,500
3,000
3,500
4,000
Rail Freight Tractor-Trailers
FatalitiesFatality Rate
Sources: AAR Analysis of FRA Casualty Database for 2006. Rail Ton-Miles in 2006 from RR Facts, 2007, pp. 27, 32. USDOT, FMCSA, Large Truck Crash Facts, 2006, Table 13, http://ai.volpe.dot.gov/CarrierResearchResults/PDFs/LargeTruckCrashFacts2006.pdf (p. 19) Tractor-trailer net ton-miles in 2002 estimated at 1.14 trillion from 2002 USDOC,Vehicle Inventory & Use Survey (VIUS), updated to 2006 based on VMT from same Table 13.
720 391
3,761 3,207

Rail freight transport incurs about 6% of the injuries that trucks do per trillion ton-miles.
0
10,000
20,000
30,000
40,000
50,000
60,000
Rail Freight Tractor-Trailers
InjuriesInjury Rate
Sources: AAR Analysis of FRA Casualty Database for 2006. Rail Ton-Miles in 2006 from RR Facts, 2007., p. 27, 32. USDOT, FMCSA, Large Truck Crash Facts, 2006, Table 15, http://ai.volpe.dot.gov/CarrierResearchResults/PDFs/LargeTruckCrashFacts2006.pdf (p. 22) Tractor-trailer net ton-miles in 2002 estimated at 1.14 trillion from 2002 USDOC,Vehicle Inventory & Use Survey (VIUS), updated to 2006 based on VMT from Large Truck Crash Facts Table 13.
5,419 2,942
56,000 48,000

Railroads incurred 17 fatalities in the last 10 yearsdue to hazmat while trucks incurred 124.
0
20
40
60
80
100
120
140
Rail Truck
Source: USDOT, Pipeline & Hazardous Materials Safety Administration, Hazardous Materials Incidents by Year & Mode, from http://hazmat.dot.gov/pubs/inc/data/tenyr.pdf for 1998 through 2007, as of 6/11/2008.

Railroads now have less than 5% of the hazmat incidents that trucks have, despite roughly equal hazmat ton-mileage.
0
2,000
4,000
6,000
8,000
10,000
12,000
14,000
16,000
18,000
1988 1990 1992 1994 1996 1998 2000 2002 2004 2006
TruckRailroad
Sources: USDOT, Pipeline & Hazardous Materials Safety Administration, Hazardous Materials IncidentsBy Year & Mode, from http://hazmat.dot.gov/pubs/inc/data/10yearfrm.htm for 1998 through 2007. 6/11/2008In 2005, the truck and rail modes hauled about the same number of hazmat net ton-miles, estimated at 114 billionfor trucks and 111 billion for rail. USDOC, 2002 Commodity Flow Survey (CFS), Table 1a, for truck hazmatton-miles, updated using combination truck VMT from FHWA Highway Statistics,Table VM-1.STB Waybill Sample for rail ton-miles.

Railroads now have 21% of the serious hazmat incidents that trucks have, despite roughly equal hazmat ton-mileage.
050
100150
200250300
350400450
500
1989 1991 1993 1995 1997 1999 2001 2003 2005 2007
TruckRailroad
Sources: USDOT, Pipeline & Hazardous Materials Safety Administration, Hazardous Materials Incidentsby Year & Mode, from http://hazmat.dot.gov/pubs/inc/data/tenyr_new_serious.pdf, as of 6/11/2008. PHMSA’s new definition defines serious incidents as those involving a fatality or serious injury due toa hazmat release or evacuation of 25 or more people as the result of a hazmat release or fire.In 2005, the truck and rail modes hauled about the same number of hazmat net ton-miles, estimated at 114 billionfor trucks and 111 billion for rail. USDOC, 2002 Commodity Flow Survey (CFS), Table 1a, for truck hazmatton-miles, updated using combination truck VMT from FHWA Highway Statistics,Table VM-1. STB Waybill Sample.
(New definition of “Serious”)

Railroads now have less than 18% of the hazmat accidents that trucks have, despite roughly equal hazmat ton-mileage.
0
50
100
150
200
250
300
350
400
1994 1996 1998 2000 2002 2004 2006
TruckRailroad
Sources: USDOT, Pipeline & Hazardous Materials Safety Administration, Hazardous MaterialsIncidents by Year & Mode, from http://hazmat.dot.gov/pubs/inc/data/tenyr_accd.pdf. 6/11/2008In 2005, the truck and rail modes hauled about the same number of hazmat net ton-miles, estimated at 114 billionfor trucks and 111 billion for rail. USDOC, 2002 Commodity Flow Survey (CFS), Table 1a, for truck hazmatton-miles, updated using combination truck VMT from FHWA Highway Statistics,Table VM-1.STB Waybill Sample for rail ton-miles.

Technological Improvements to Railroad Safety: Track & Equipment
Improved Track• Rail steels• Welded rail• Fasteners• Detection of flaws, weak spots
Improved Equipment• Heat treated curved plate wheels• Hot box detectors, roller bearings, acoustic detection
systems• Air brake control valves & air brake tests• Advanced Technology Safety Initiative (ATSI), to
identify and repair high impact wheels & other flaws.

Over 3.6 years, ATSI has prevented an estimated 160 broken rail and broken wheel accidents on main track.
0.0
0.1
0.2
0.3
0.4
1997 1998 1999 2000 2001 2002 2003 2004 2005 2006 2007
Sources: AAR Analysis of FRA Train Accident and Train-Mile Data, 1997-2007,All U.S. Railroads.
“Before” Period (Pre-ATSI)
“After” Period (ATSI)
Main Track Accidents per Million Freight Train Miles
Without ATSI (Estimate)
With ATSI (Actual)

Technological Improvements to Railroad Safety: Tank Cars and SNF
• Head shields and shelf couplers• Thermal insulation• Bottom outlet protection• Enhanced safety requirements of hazmat tank cars >263,000
lbs or carrying environmentally sensitive chemicals• Enhanced standard for cars carrying spent nuclear fuel and
high level radioactive waste.• A new performance standard for TIH tank cars.

Railroad Industry Safety Programs: Hazardous Materials
• AAR North American Non-Accident Release (NAR) Program
• Transportation & Community Awareness & Emergency Response (TRANSCAER)
• ACC Responsible Care• Operation Respond• TTCI's Emergency Response Training Center • TTCI's BOE Hazmat Inspections• TTCI's BOE Hazmat Safety Information

Railroad Industry Safety Programs:Operations, Training, Crossings
• Individual Railroad Employee Safety Programs
• Crew Resource Management (CRM)
• Peer Observation Programs
• Fatigue Countermeasures
• Remote Control Operations
• Locomotive Simulators
• Interactive Video Individual Training
• Operation Lifesaver
• Grade Crossing Upgrade (Section 130) Program

Railroad Security
• After the 9/11 terrorist attacks, the AAR & its member railroads voluntarily conducted a comprehensive risk assessment and implemented a security action plan with four alert levels.
• The Security Plan encompasses over 1,300 critical facilities (tunnels, bridges, yards, dispatch centers, etc.) over a 142,000-mile nationwide rail network.
• Execution of the Security Plan depends on timely receipt of threat & warning information from the federal govt.
• Former DHS Secretary Ridge cited this plan as a model for other U.S. industries.

Railroad Security:Countermeasures include:
• Employee and customer awareness and training: e.g. to thwart terrorist intelligence gathering, facilitate warning & recovery.
• Sharing of Intelligence on Threats:– AAR Operations Center (24/7) collects, evaluates, and disseminates
information to railroads thru the Railway Alert Network (RAN)– The Surface Transportation Information Sharing & Analysis Center (ST-
ISAC) collects, analyzes, and disseminates information on physical and cyber-security threats to providers and users of surface transportation.
• Vetting employees & contractors.• Controlling access to critical facilities and shipment info.• Special operating measures to safeguard hazmat.• Securing communications and data and ensuring message
integrity and best IT practices.

Since 1980, U.S. Class I railroads have spent $396 billion on track and equipment.
0.0
2.0
4.0
6.0
8.0
10.0
12.0
1980 1985 1990 1995 2000 2007
Sources: AAR, Analysis of Class I Railroads, 1980 - 2007, based on R-1 Reports submitted by each Class Irailroad to the ICC/STB. Equipment: Lines 382+158-151-154-157. Track: Lines 378+149-147.Note: Current year dollars.
Capital Expenditures and Maintenance Expenses, Minus Depreciation, in Billions of Dollars
Track & Structures
Equipment

Since 1991, U.S. Class I railroads have accelerated capital spending on new rail.
0.0
0.5
1.0
1.5
2.0
2.5
1987 1989 1991 1993 1995 1997 1999 2001 2003 2005 2007
Source: R-1 Reports submitted by each Class I railroad to the ICC/STB, 1987-2007.Schedule 330, line 8, column e; Schedule 410, lines 1, 14, and 15, column h.
Billions of Current Dollars
Capital Expenditures on Rail
Operating Expenses for Rail & Other Track Material

In the last 10 years, U.S. Class I railroads have laid 5.9 million tons of new rail.
0.00
0.25
0.50
0.75
1987 1989 1991 1993 1995 1997 1999 2001 2003 2005 2007
Note: Includes new rail laid in replacement and in addition, excludes relay rail.Sources: AAR, Analysis of Class I Railroads, 1980 – 2007, Lines 366+369+371, based on R-1 Reports submitted by each Class I railroad to the ICC/STB.
Million Tons of New Rail Laid