Embed Size (px)
Citation preview

Extension is a Division of the Institute of Agriculture and Natural Resources at the University of Nebraska—Lincoln cooperating with the C ounties and the United States Department of Agriculture.
University of Nebraska—Lincoln Extension educational programs abide with the nondiscrimination policies of the University of Nebraska—Lincoln and the United States Department of Agriculture.
Coyright © 2016 Th e Board of Regents of the University of Nebraska. All rights reserved.
Agricultural Research DivisionUniversity of Nebraska Extension
Institute of Agriculture and Natural ResourcesUniversity of Nebraska–Lincoln
Non Profi tUS Postage
PAIDUNLP.O. Box 830908
C220 ANSCLincoln, NE 68583-0908 USA
NE
BR
AS
KA
MP104
2017Beef Cattle
Report2017 Beef C
attle ReportM
P104

AcknowledgementsAppreciation is expressed to the following fi rms, associations, or agencies who provided
grant support for research in the beef cattle program.
Agriculture and Food Research Initiative Competitive Grant/USDA/NIFA Foundation Program: Animal Reproduction
Th e Beef Checkoff , Centennial, ColoCargill Corn Milling, Blair, Neb.CSIRO, Commonwealth Scientifi c and Industrial Research
Organization, Dickson, ACT, AustraliaElanco Animal Health, Indianapolis, Ind.Huvepharma Inc. Peachtree City, GADr. Kenneth and Caroline McDonald Eng Foundation
San Antonio, Tex.Lallemand Animal Nutrition. Montreal, Quebec, CanadaMerck Animal Health, Madison, NJNational Cattlemen’s Beef Association, Centennial, Colo.Nebraska Beef Council, Kearney, Neb.Nebraska Cattlemen Research and Education Foundation,
Lincoln, Neb.
Nebraska Center for Energy Sciences Research, University Of Nebraska, Lincoln, Neb
Nebraska Corn Board, Lincoln, Neb.Nebraska Environmental Trust, Lincoln, Neb.Novus International, Saint Charles, MOPellet Technology USA, Gretna, Neb.Prince Agri Products, Inc. Quincy, ILRich Porter. Reading, KSSyngenta. Greensboro, NCUSDA MultiState Hatch Funds (Pasture work)USDA NIFA Climate Change (Samodha)USDA NIFA Award 2012 68003-30155USDA grant Award 2012-68002-19823USDA SARE
Appreciation is also expressed to the following fi rms who provide products or services
Beefmaster Breeders UnitedBirko Corporation. Henderson, COCargill Corn Milling, Blair, Neb.Cattlemen’s Nutrition Services, LLC, Lincoln, NEElanco Animal Health, Indianapolis, Ind.Greater Omaha Packing Company, Omaha, Neb.Iowa Limestone, Des Moines, Iowa
Kalle USA Inc. Gurnee, ILNovus International, Inc., St. Charles, Mo.Sladky Farms. Wahoo, Neb.Tyson Foods. Springdale, ARUS Meat Animal Research Center, Clay Center, Neb.USDA Meat Grading and Certifi cation Branch, Omaha, Neb
Appreciation is also expressed to the following Research Technicians, Unit Managers, and Crew involved in the research Programs at our various locations.
Animal Science http://animalscience.unl.edu
Curriculum: Th e curriculum of the Animal Science Department at the University of Nebraska– Lincoln is designed so that each student can select from a variety of options oriented to specifi c career goals in professions ranging from animal production to veterinary medicine. With unique opportunities to double major in Grazing Livestock Systems (http://gls.unl.edu) or complete the Feedlot Management Internship Program (http://feedlot.unl.edu/intern)
Careers:Animal HealthBanking and FinanceAnimal ManagementConsultant
EducationMarketingTechnical ServiceMeat Processing
Meat SafetyQuality AssuranceResearch and DevelopmentVeterinary Medicine
Scholarships: Th e Animal Science Department also off ers scholarships to incoming freshmen and upperclassmen. Th e department awards over $30,000 each year to Animal Science students.ABS Global ScholarshipBaltzell- Agri- Products, Inc. ScholarshipMaurice E. Boeckenhauer Memorial ScholarshipMike Cull Judging and Activities ScholarshipDon Geweke Memorial AwardParr Young Senior Merit AwardNebraska Pork Producers Association ScholarshipWaldo Family Farms ScholarshipFrank and Mary Bruning ScholarshipArt and Ruth Raun ScholarshipAnimal Science Department Freshman ScholarshipFeedlot Management ScholarshipRobert Boeckenhauer Memorial ScholarshipBurnell Scholarship FundDoane ScholarshipLincoln Coca- Cola Bottling Company Scholarship.
William J. and Hazel J. Loeff el ScholarshipNutrition Service Associates ScholarshipParr Family Student Support FundChris and Sarah Raun Memorial ScholarshipWalter A. and Alice V. Rockwell ScholarshipStandard Manufacturing Co. ScholarshipMax and Ora Mae Stark ScholarshipD. V. and Ernestine Stephens Memorial ScholarshipDwight F. Stephens ScholarshipArthur W. and Viola Th ompson ScholarshipTh omas H. Wake, III ScholarshipFrank E. Card ScholarshipDerrick Family ScholarshipG. H. Francke Livestock Judging ScholarshipEric Peterson Memorial AwardWinkler Memorial Livestock Judging Scholarship
Agriculture Research & Development Center, Ithaca
Sam CairesKen CejkaAndrew DonahueAlex FrerichsTara HarmsBump KraegerAaron Lauer
Michael LubenSteve MaserBrett MehomAllison MillerKarl MolineJustin MooreChuck Rezac
Ken RezacBen SchneiderMark SchroederMatt SillivanKeith Street
Department of Animal Science, Lincoln
Jeff BergmanKevin BahrCurt BittnerBethany BlackburnRobby BondurantBradley BoydClay BoylesZac CarlsonRoger Carpenter
Jana GramkowHannah HamiltonBrent JohnsonMelissa JollyTommi JonesScott KurzErin MarotzClyde NaberSamantha Powell
Kyle ReganCalvin SchrockPayton ShanklandDavid ShieldsAdam ShreckDarren StrizekCurtis Wetovick
Gumundsen Sandhills Laboratory, Whitman
Andy ApplegarthJacki Musgrave
John Nollette
Panhandle Research & Extension Center, Scottsbluff
Josh ButtleNabor Guzman
Jacob HansenDoug Pieper
West Central Research & Extension Center, North Platte
Mike KirbyJess Milby
T. L. MeyerJim Teichert
High Plains Ag Laboratory
Rob Higgins Paul McMillian
Electronic copies of Nebraska Beef Reports and Summaries available at: http://beef.unl.edu, click on reports.
2017 Nebraska Beef Cattle Report · 3
Table of Contents 2017 Nebraska Beef Cattle Report
Cow/Calf
Eff ect of Heifer Development System on Reproduction and Subsequent Gain as a Pregnant Heifer.............................................................. 5Impact of Heifer Development System in Two Breeding Seasons ........................................................................................................................ 8Timed Insemination vs. Modifi ed Estrus Detection in Beef Heifers .................................................................................................................. 11Growth and Reproductive Performance of Yearling Beef Heifers Implanted with Revalor G in the Nebraska Sandhills .......................... 13Development of Terminal and Maternal Economic Selection Indices in Beefmaster Cattle .......................................................................... 16Eff ects of Wintering System on Cow and Calf Performance in a Summer- Calving Intensive Production System ..................................... 19Methods to Increase Productivity of Spring Calving Production Systems in the Nebraska Sandhills .......................................................... 22
Growing
Eff ect of Crude Glycerin Concentration on Growing Steer Performance in Forage Diets ............................................................................. 25Eff ect of Increasing Supplemental Undegradable Protein (RUP) on Performance of Calves Fed a Silage Growing Diet .......................... 27Eff ects of Modifi ed Distillers Grains and Corn Ratios as Supplements in Diets Varying in Forage Quality on
Performance of Growing Beef Steers .............................................................................................................................................................. 29Rumen Undegradable Protein and Bambermycins Supplementation of Calves Grazing Corn Residue ...................................................... 32Pooled Gain Analysis of Steers Grazing Corn Residue and Supplemented with Distillers Grains ................................................................ 34Evaluating the Impacts of Field Peas in Growing and Finishing Diets on Performance and Carcass Characteristics ................................ 36Eff ects of Field Pea Supplementation on Digestibility and Rumen Volatile Fatty Acid Concentration of
Diets Containing High and Low Quality Forages ........................................................................................................................................ 38Eff ect of Backgrounding System on Steer Performance and Carcass Characteristics ...................................................................................... 40
Forage and Residue Resource Management
Nutrient Content of Summer-Planted Oats aft er Corn Harvest and Grazing Performance ........................................................................... 43Eff ect of Corn Residue Grazing or Baling on Subsequent Crop Yield and Nutrient Removal ....................................................................... 46Eff ect of Long- Term Corn Residue Grazing on Soil Properties .......................................................................................................................... 50Eff ect of Harvest Method on Digestibility of Corn Residue ................................................................................................................................ 53Summer Cocktail Forage Research in the Panhandle of Nebraska ..................................................................................................................... 55In Situ Digestibility of Residue Parts of Corn Planted in Diff erent Populations and Row Widths ................................................................ 57Corn Residue Quality throughout the Grazing Season........................................................................................................................................ 60Eff ect of Harvest Method and Ammoniation of Digestibility and Intake of Corn Residue ............................................................................ 62
Evaluation of Techniques and Procedures Used in Grazing Cattle Research
Comparison of Diets Collected from Esophageally Fistulated Cows to Forage Quality Estimated from Fecal Analysis ........................... 64Impact of Inoculum Source for in vitro and in situ Digestion Procedures Performed on Corn Residue and Grass Samples .................... 67Evaluation of Plant- waxes to Estimate Forage Intake in Grazing Cattle ........................................................................................................... 69Delineating Complex Forage Mixtures using Plant- wax Markers ...................................................................................................................... 73
4 · 2017 Nebraska Beef Cattle Report
Finishing
Relationship between Dietary Total Digestible Nutrients and Digestible Organic Matter in Beef Cattle Finishing and Growing Diets With or Without Distillers Grains ........................................................................................................................................ 76
Comparison of Titanium® 5 PH- M verses Titanium® 5 + NUPLURA® PH with the Presence or Absence of Monensin on Health and Performance of Newly Received Feedlot Calves Fed RAMP® .................................................... 79
Eff ect of Th ree Initial Implant Programs with a Common Terminal Revalor®- 200 on Feedlot Performance and Carcass Traits of Weaned Steers ...................................................................................................................................................................... 81
Evaluation of 0 or 300 mg of Optafl exx® on Growth Performance and Carcass Characteristics of Steers Fed to Diff erent Degrees of Finish .............................................................................................................................................................................. 84
Predicting Feedlot Growth Performance over the Feeding Period Utilizing Steer Age and Body Weight ................................................... 87Evaluation of the Value of Fiber in Distillers Grains Plus Solubles on Performance of Finishing Cattle ...................................................... 90Th e Eff ect of Supplementing Mannan Oligosaccharide or Finely Ground Fiber during the Summer on
Body Temperature, Performance, and Blood Metabolites of Finishing Steers ......................................................................................... 93Eff ects of Distillers Grains or Fiber on Enterohemorrhagic Escherichia coli in Steers ..................................................................................... 96
Beef Products
Th e Infl uence of Diet and Oxidation on Calcium Retention of the Mitochondria in Fresh Beef .................................................................. 99Eff ect of Feeding Field Peas on Fresh Beef Quality ............................................................................................................................................. 101Fatty Acid Stability of Beef Fed OmniGen- AF at Receiving or Finishing ....................................................................................................... 104Organic Acids and Applications used for Reduction of E. coli on Beef Shoulder
Clods used for Ground Beef .......................................................................................................................................................................... 107Eff ect of Salt Reduction on the Quality and Shelf Life Characteristics of Deli- Style Roast Beef .................................................................. 109
Industry Perceptions
Perceptions of Crop Consultants and Producers on Grazing Corn Residue in Nebraska ............................................................................. 112
Explanation of Statistics
Statistics Used in the Nebraska Beef Report and Th eir Purpose ....................................................................................................................... 116
2017 Nebraska Beef Cattle Report · 5
© Th e Board Regents of the University of Nebraska. All rights reserved.
of deep snow. All heifers were managed together in a drylot during estrus synchro-nization and AI.
Prior to estrus synchronization, 2 blood samples were collected 10 d apart to deter-mine plasma progesterone concentration. Heifers with greater than 1 ng/mL at either collection were considered pubertal. Heifers were synchronized using the melengestrol acetate- prostaglandin F2α (MGA- PG) proto-col. Heat detection aids (Estrotect, Rockway Inc., Spring Valley, WI) were applied at PG injection (Lutalyse, Zoetis, Florham Park, NJ). Heifers in standing estrus were AI 12 h later. Heifers not expressing estrus received a PG injection 6 d following the fi rst PG injection and placed with bulls. Remaining heifers were combined with the non- AI heifers and bulls 10 d following AI on range at a 1:50 bull to heifer ratio for 60 d. Pregnancy diagnosis was conducted via transrectal ultrasonography (ReproScan, Beaverton, OR) 45 d following AI. Forty- fi ve d aft er bull removal a second pregnancy diagnosis determined fi nal pregnancy rate.
Pregnant Heifer Feed Effi ciency
In mid- October, following fi nal preg-nancy diagnosis, a subset of AI- pregnant heifers from each treatment (RANGE, n = 36; CR, n = 46; DLHI, n = 48; DLLO, n = 23) were placed in a Calan Broadbent indi-vidual feeding system. Heifers were allowed a 20 d acclimation period before beginning a 90 d trial at approximately gestational d 170. Heifers were off ered ad libitum hay (7.9% CP); individual amounts off ered were recorded daily and orts collected weekly.
decrease DMI in the mature cow. Under-standing the long term eff ects of heifer development on cow effi ciency will allow producers to make better management deci-sions. Whether a diff erence lies in behavioral eff ects, or previous diet quality, mature cow intake as a result of development systems, have the potential to impact beef producers’ profi tability. Th erefore, objectives of the current study were to determine if post- weaning heifer development system aff ected ADG, pregnancy rates, and subsequent feed effi ciency as a pregnant heifer.
Procedure
Post- Weaning Development
A 4- yr study conducted at the West Central Research and Extension Cen-ter (WCREC), North Platte, NE utilized Angus- based crossbred, spring born heifers. In Yr 1, weaned heifers grazed corn residue (CR, n = 50) or were fed in a drylot (DLHI, n = 50). In Yr 2, 3, and 4, heifers grazed CR (n = 75), upland range (RANGE; n = 75), or were fed 1 of 2 drylot diets (Table 1) diff er-ing in energy, high (DLHI, n = 75) or low (DLLO, n = 75). Heifers developed on CR (n = 125) grazed corn residue from mid- November through mid- February and then grazed winter range until estrus synchro-nization. RANGE heifers (n = 75) grazed winter range from mid- November until estrus synchronization. While grazing corn residue or winter range, heifers received the equivalent of 1 lb.hd- 1.d- 1 of a 29% CP, dried distillers grain- based supplement contain-ing monensin, with hay provided in times
Shelby A. SpringmanHazy R. Nielson
T. L. MeyerMike KirbyJim Teichert
Rick N. Funston
Summary with Implications
Weaned heifers grazed corn residue, upland range, or were fed 1 of 2 drylot diets diff ering in energy. Heifer development diets did not impact their resulting AI or fi nal pregnancy rates. Cost per pregnant heifer was similar among treatments. A subset of AI- pregnant heifers was placed in a Calan Broadbent individual feeding system during late gestation. As a pregnant heifer, feed effi ciency was not impacted by development system. Th ese results indicate producers may utilize their most readily available and/or cost- eff ective feed resources with no detri-ment to pregnancy rates or feed effi ciency as fi rst- calf heifers.
Introduction
Retaining and developing replacement heifers presents one of the largest expens-es to the cow- calf producer. Developing heifers to a lower target BW than previously recommended has been shown to reduce costs, without reducing pregnancy rate. Previous research comparing corn residue and drylot systems has found heifers in the drylot gained more during the development period than heifers grazing corn residue (2013 Nebraska Beef Report, pp. 5– 7). However, heifers developed on corn residue experienced increased post- AI ADG while on summer range compared with heifers developed in confi nement, possibly due to compensatory gain or retained learned graz-ing behavior. Greater eff ort has been made to select heifers with higher feed- effi ciency. However, selecting for greater effi ciency may
Eff ect of Heifer Development System on Reproduction and Subsequent Gain as a Pregnant Heifer
Table 1. Drylot diet composition (DM basis) off ered to replacement heifers
Ingredient, % DLHI1 DLLO2
Hay 74 83
Wet CGF 21 12
Heifer supplement3 5 51 DLHI = heifers in Yr 1, 2, 3, and 4 received a high- energy diet in the drylot for 170 d.2 DLLO = heifers in Yr 2, 3, and 4 received a low- energy diet in the drylot for 170 d.3 Supplement = dry rolled corn (81.35% of supplement, DM basis), limestone (11.11%), iodized salt (5.55%), trace mix (1.39%),
Rumensin- 90 (0.37%), and Vitamins A- D- E (0.22%).

6 · 2017 Nebraska Beef Cattle Report
Economic Analysis
Due to price fl uctuations during the experiment (2010– 2014), an average 5 yr price was used for economic analysis. Heifer value was obtained for the wk heifers were received. Pasture values were calculat-ed as half the cost of a cow- calf pair in the Southwest region of Nebraska and obtained from the Nebraska Farm Real Estate Market Highlights. Wet corn gluten prices were obtained from the USDA- AMS for the third wk in September using Kansas City values. Hay prices were obtained for the third wk of September in the Platte Valley from the Nebraska and Iowa Hay report. Actual supplement costs, both drylot and cube, were used. Other expenses included interest (6.5% of heifer value), vaccine, yardage, trucking for CR heifers, breeding expenses, and other miscellaneous expenses. Cull val-ues of non- pregnant heifers were obtained for the wk of fi nal pregnancy diagnosis. Th e value of one, non- pregnant heifer was divided by 1 minus pregnancy rate to deter-mine the value of cull heifers per pregnant heifer. Th is value was subtracted from the total development cost. Finally, the adjusted development cost was divided by pregnan-cy rate to determine the net cost of one pregnant heifer.
Statistical Analysis
Treatments were the specifi c heifer development system where CR and DLHI were replicated for 4 yr and RANGE and DLLO were replicated for 3 yr. Treat-ment group within year was considered the experimental unit, with development treatment fi tted as a fi xed eff ect. Data were analyzed using the GLIMMIX procedure of SAS (SAS Inst. Inc., Cary NC). Pregnancy analyses included AI technician as a ran-dom eff ect. Pregnant heifer feed effi ciency analyses included pen as a random eff ect. A P- value ≤ 0.05 was considered signifi cant.
Results
Post Weaning Development Treatment
Heifers had a similar initial BW (P = 0.88, 518 ± 11 lb, Table 2). During develop-ment, ADG was greater (P = 0.01) for DLHI heifers (1.57 ± 0.11 lb/d) compared with RANGE and CR (0.97 and 0.86 ± 0.11 lb/d, respectively). Diff erences in ADG resulted
Table 2. Eff ect of development system on heifer gain and reproductive performance
Item RANGE1 CR2 DLHI3 DLLO4 SEM P- value
n 75 125 125 75
Initial BW, lb 516 520 518 516 11 0.88
Post- development BW5, lb
664b 659b 763a 708a,b 18 < 0.01
Development ADG, lb 0.97b 0.86b 1.57a 1.26a,b 0.11 0.01
Pre- breeding BW, lb 714b 725b 820a 765a,b 20 0.01
Percent of mature, % 59b 60b 67a 63a,b 2 0.01
Pubertal status, % 28 41 86 77 10 0.20
Synchronization ADG, lb
1.57 1.79 1.52 1.72 0.24 0.20
AI pregnancy diagnosis BW, lb
802b 818b 873a 829a,b 13 0.02
Final pregnancy diagnosis BW, lb
941 941 985 952 24 0.13
Breeding ADG6, lb 1.68a,b 1.76a 1.01c 1.26b,c 0.22 < 0.01
AI pregnancy, % 67 63 61 49 7 0.39
Final pregnancy, % 84 90 91 91 5 0.59
Calved in fi rst 21 d, % 81a 69ab 70ab 53b 12 0.021 RANGE = heifers were off ered the equivalent of 0.99 lb . hd- 1 . d- 1 while grazing winter range for 170 d before entering the drylot
for estrus synchronization and AI.2 CR = heifers were off ered the equivalent of 0.99 lb . hd- 1 . d- 1 while grazing corn residue for 90 d and winter range for 80 d before
entering the drylot for estrus synchronization and AI.3 DLHI = heifers were developed in the drylot for 170 d and through estrus synchronization and AI on a high- energy diet.4 DLLO = in Yr 2, 3, and 4 heifers received a low- energy diet in the drylot for 170 d through estrus synchronization and AI.5 BW at the time of blood collection.6 ADG in the period between prebreeding and fi rst pregnancy diagnosis.a,b,c Means in a row with diff erent superscripts are diff erent (P ≤ 0.05).
Table 3. Eff ects of heifer development system on pregnant heifer feed effi ciency
Item RANGE1 CR2 DLHI3 DLLO4 SEM P- value
n 36 46 48 23
Initial BW, lb 994 1,008 1,041 1,023 22 0.35
Mid BW, lb 1,032 1,052 1,085 1,063 20 0.25
Final BW, lb 1,076 1,096 1,127 1,107 31 0.24
DMI, lb 21.47 21.98 22.44 22.05 1.68 0.27
ADG, lb 0.84 0.99 0.95 0.90 0.37 0.36
RFI5 0.094 0.091 - 0.056 - 0.074 0.160 0.61
F:G 21.4 18.2 21.1 21.3 4.8 0.381 RANGE = heifers were off ered the equivalent of 0.99 lb . hd- 1 . d- 1 while grazing winter range for 170 d before entering the drylot
for estrus synchronization and AI.2 CR = heifers were off ered the equivalent of 0.99 lb . hd- 1 . d- 1 while grazing corn residue for 90 d and winter range for 80 d before
entering the drylot for estrus synchronization and AI.3 DLHI = heifers were developed in the drylot for 170 d and through estrus synchronization and AI on a high- energy diet.4 DLLO = heifers received a low- energy diet in the drylot for 170 d through estrus synchronization and AI.5 RFI = Residual Feed Intake
2017 Nebraska Beef Cattle Report · 7
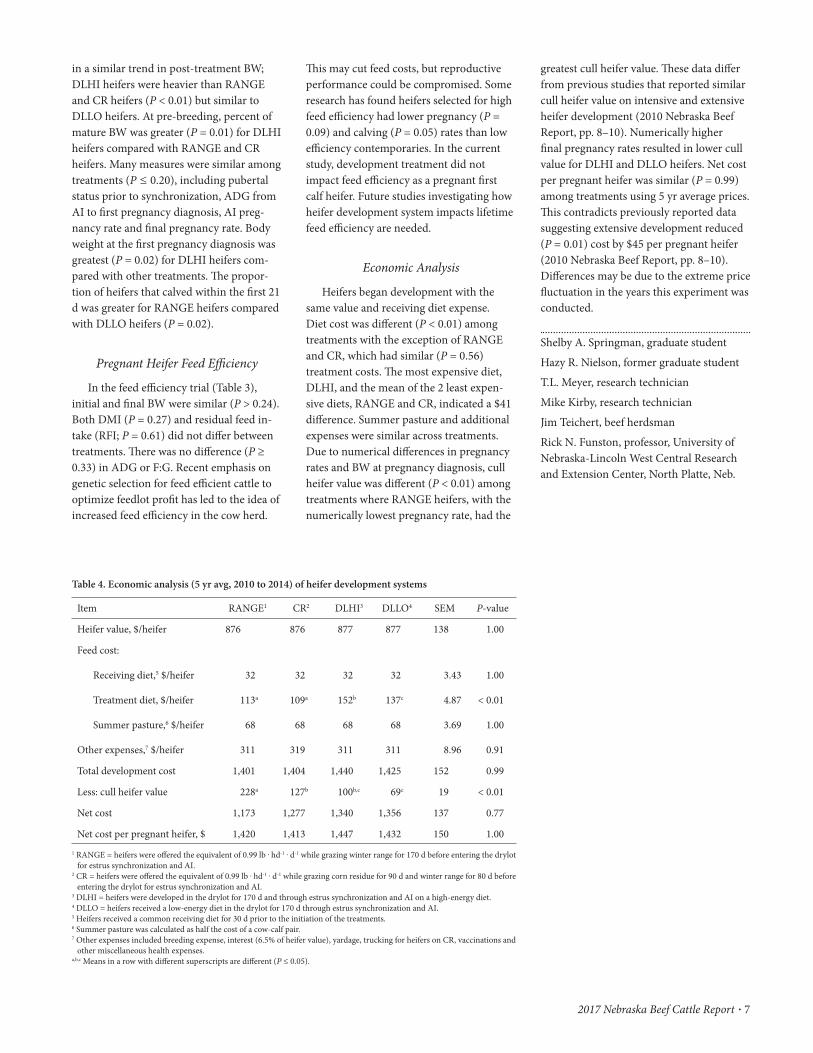
greatest cull heifer value. Th ese data diff er from previous studies that reported similar cull heifer value on intensive and extensive heifer development (2010 Nebraska Beef Report, pp. 8– 10). Numerically higher fi nal pregnancy rates resulted in lower cull value for DLHI and DLLO heifers. Net cost per pregnant heifer was similar (P = 0.99) among treatments using 5 yr average prices. Th is contradicts previously reported data suggesting extensive development reduced (P = 0.01) cost by $45 per pregnant heifer (2010 Nebraska Beef Report, pp. 8– 10). Diff erences may be due to the extreme price fl uctuation in the years this experiment was conducted.
Shelby A. Springman, graduate studentHazy R. Nielson, former graduate studentT.L. Meyer, research technicianMike Kirby, research technicianJim Teichert, beef herdsmanRick N. Funston, professor, University of Nebraska- Lincoln West Central Research and Extension Center, North Platte, Neb.
Th is may cut feed costs, but reproductive performance could be compromised. Some research has found heifers selected for high feed effi ciency had lower pregnancy (P = 0.09) and calving (P = 0.05) rates than low effi ciency contemporaries. In the current study, development treatment did not impact feed effi ciency as a pregnant fi rst calf heifer. Future studies investigating how heifer development system impacts lifetime feed effi ciency are needed.
Economic Analysis
Heifers began development with the same value and receiving diet expense. Diet cost was diff erent (P < 0.01) among treatments with the exception of RANGE and CR, which had similar (P = 0.56) treatment costs. Th e most expensive diet, DLHI, and the mean of the 2 least expen-sive diets, RANGE and CR, indicated a $41 diff erence. Summer pasture and additional expenses were similar across treatments. Due to numerical diff erences in pregnancy rates and BW at pregnancy diagnosis, cull heifer value was diff erent (P < 0.01) among treatments where RANGE heifers, with the numerically lowest pregnancy rate, had the
in a similar trend in post- treatment BW; DLHI heifers were heavier than RANGE and CR heifers (P < 0.01) but similar to DLLO heifers. At pre- breeding, percent of mature BW was greater (P = 0.01) for DLHI heifers compared with RANGE and CR heifers. Many measures were similar among treatments (P ≤ 0.20), including pubertal status prior to synchronization, ADG from AI to fi rst pregnancy diagnosis, AI preg-nancy rate and fi nal pregnancy rate. Body weight at the fi rst pregnancy diagnosis was greatest (P = 0.02) for DLHI heifers com-pared with other treatments. Th e propor-tion of heifers that calved within the fi rst 21 d was greater for RANGE heifers compared with DLLO heifers (P = 0.02).
Pregnant Heifer Feed Effi ciency
In the feed effi ciency trial (Table 3), initial and fi nal BW were similar (P > 0.24). Both DMI (P = 0.27) and residual feed in-take (RFI; P = 0.61) did not diff er between treatments. Th ere was no diff erence (P ≥ 0.33) in ADG or F:G. Recent emphasis on genetic selection for feed effi cient cattle to optimize feedlot profi t has led to the idea of increased feed effi ciency in the cow herd.
Table 4. Economic analysis (5 yr avg, 2010 to 2014) of heifer development systems
Item RANGE1 CR2 DLHI3 DLLO4 SEM P- value
Heifer value, $/heifer 876 876 877 877 138 1.00
Feed cost:
Receiving diet,5 $/heifer 32 32 32 32 3.43 1.00
Treatment diet, $/heifer 113a 109a 152b 137c 4.87 < 0.01
Summer pasture,6 $/heifer 68 68 68 68 3.69 1.00
Other expenses,7 $/heifer 311 319 311 311 8.96 0.91
Total development cost 1,401 1,404 1,440 1,425 152 0.99
Less: cull heifer value 228a 127b 100b,c 69c 19 < 0.01
Net cost 1,173 1,277 1,340 1,356 137 0.77
Net cost per pregnant heifer, $ 1,420 1,413 1,447 1,432 150 1.001 RANGE = heifers were off ered the equivalent of 0.99 lb . hd- 1 . d- 1 while grazing winter range for 170 d before entering the drylot
for estrus synchronization and AI.2 CR = heifers were off ered the equivalent of 0.99 lb . hd- 1 . d- 1 while grazing corn residue for 90 d and winter range for 80 d before
entering the drylot for estrus synchronization and AI.3 DLHI = heifers were developed in the drylot for 170 d and through estrus synchronization and AI on a high- energy diet.4 DLLO = heifers received a low- energy diet in the drylot for 170 d through estrus synchronization and AI.5 Heifers received a common receiving diet for 30 d prior to the initiation of the treatments.6 Summer pasture was calculated as half the cost of a cow- calf pair.7 Other expenses included breeding expense, interest (6.5% of heifer value), yardage, trucking for heifers on CR, vaccinations and
other miscellaneous health expenses.a,b,c Means in a row with diff erent superscripts are diff erent (P ≤ 0.05).

8 · 2017 Nebraska Beef Cattle Report
© Th e Board Regents of the University of Nebraska. All rights reserved.
Results
March- born Gain and Reproductive Performance
March- born HAY heifers had greater (P = 0.01) ADG during the treatment period than MDW heifers (Table 1). However, following treatment, MDW heifers tended (P = 0.07) to have a greater ADG compared with HAY heifers. Summer ADG (May 22 to Sept. 10) was similar (P = 0.12) between treatments. Signifi cant year eff ects are noted on summer ADG among heifers developed in 2012 compared with other develop-ment years, presumably due to the severe drought. Post- treatment and prebreeding BW was greater (P = 0.02) for HAY heifers. At pregnancy diagnosis, HAY heifers tend-ed (P = 0.06) to have greater BW compared with MDW heifers. Percent of mature BW prior to the breeding season was greater (P = 0.02) for HAY compared with MDW. Pubertal status prior to breeding was not diff erent (P = 0.51) between treatments. Furthermore, pregnancy rates were similar for HAY and MDW heifers (P = 0.97, 88 ± 4%). Calving rate and the proportion of heifers that calved within the fi rst 21 d was also similar (P ≥ 0.54) between treatments.
May- born Gain and Reproductive Performance
Data for BW gain and reproductive performance on May- born heifers are presented in Table 2. Similar to March- born heifers, May- born heifers on HAY had greater (P = 0.01) ADG during the treatment period. Spring and summer ADG was greater (P = 0.03) for MDW heifers, due to a compensatory gain eff ect. Post- treatment and pre- breeding BW was greater (P = 0.02) for HAY heifers compared with MDW heifers. At pregnancy diagnosis, BW was similar (P = 0.16) between treat-ments. Percent of mature BW prior to the breeding season was greater (P = 0.02) for
the impact of heifer development system on subsequent growth and reproductive performance in early and late summer breeding seasons.
Procedure
A 4- yr study was conducted at the Gudmundsen Sandhills Laboratory (GSL), Whitman, NE, that utilized replacement heifers from 2 calving seasons. March- born (n = 225) and May- born (n = 258), crossbred (5/8 Red Angus, 3/8 Continental) heifers were stratifi ed by BW and randomly assigned to 1 of 2 post- weaning nutritional treatments (2 pastures·treatment- 1·year- 1) from mid- January to mid- April. Heifers were off ered ad libitum meadow hay (HAY) and 4 lb/d (29% CP, DM) supplement or allowed to graze meadow (MDW) and off ered 1 lb/d of the same supplement. Prior to and following treatment, heifers were managed together within their respective breeding group. Prior to each breeding season, 2 blood samples were collected 10 d apart to determine pubertal status. Heifers with plasma progesterone concentrations greater than 1 ng/mL at either collection were considered pubertal. Heifers were synchronized with a single PGF2α injection 5 d aft er being placed with bulls for a 45 d breeding season. Pregnancy diagnosis was conducted via transrectal ultrasonography 40 d following bull removal.
Statistical Analysis
Data were analyzed using the GLIMMIX procedure of SAS (SAS Institute, Inc., Cary, N.C.), evaluating year, treatment, and year × treatment. Th e proportions of pubertal and pregnant heifers were analyzed using an odds ratio. Least squared means and SE of the proportion of pubertal and pregnant heifers by treatment were obtained using the ILINK function.
Shelby A. SpringmanHazy R. Nielson
Jacqueline A. MusgraveJohn Nollette
Andy ApplegarthRick N. Funston
Summary with Implications
Replacement heifers from March and May calving herds were off ered ad libitum meadow hay and 4 lb/d supplement or grazed meadow and off ered 1 lb/d sup-plement from mid- January to mid- April. Heifers fed hay gained more during the treatment; however, heifers grazing meadow experienced compensatory gain, resulting in similar body weight at pregnancy diagnosis in both calving herds. Pregnancy rates were similar between treatment groups in March and May heifers. A reduced input winter management system is a viable option to maintain pregnancy rates in early and late summer breeding seasons.
Introduction
Traditional recommendations suggest heifers reach 55 to 65% of mature body weight (BW) at the time of breeding. Due to the cost of retaining replacement heifers, more eff orts have been made to devise economical methods of developing heifers. Previous studies have indicated heifers developed to lower target BW have comparable reproductive performance to heifers developed in higher input systems. Furthermore, it has been reported heifers fed to 51% vs. 57% mature BW showed no diff erence in puberty attainment. However, heifers developed on corn residue had a reduced percentage that reached puberty compared with winter range or drylot developed heifers. Th erefore, the objec-tive of the current study was to determine
Impact of Heifer Development System in Two Diff erent Breeding Seasons

2017 Nebraska Beef Cattle Report · 9
Table 1. Eff ect of over- winter treatment on developing March- born heifer gain and reproductive performance
Development Year Treatment
Item 2012 2013 2014 2015 SEM P- value Hay1 MDW2 SEM P- value
n 50 50 101 24 113 112
ADG
Treatment ADG,3 lb/d 1.37 1.43 1.57 1.28 0.11 0.42 1.70 1.12 0.07 0.01
Spring ADG,4 lb/d 2.03x 0.66xy 0.33y 0.31y 0.31 0.06 0.46 1.21 0.20 0.07
Summer ADG,5 lb/d 0.60b 1.37a 1.23a 1.48a 0.06 <0.01 1.12 1.21 0.03 0.12
Body Weight
Weaning BW, lb 425b 412b 467a 463ab 9 0.01 443 441 4 0.86
Post- treatment BW, lb 644yz 639z 697x 648xz 13 0.07 683 631 8 0.02
Pre- breeding BW,6 lb 701ab 664b 712a 677ab 11 0.049 705 672 7 0.02
Percent of Mature BW,7 % 57ab 54b 58a 55ab 1 0.049 58 55 1 0.02
Pregnancy Diagnosis BW, lb 767b 816ab 847a 851a 12 0.02 831 809 6 0.06
Pubertal,8 % 66a 30b 68a 54ab 7 <0.01 53 57 5 0.51
Pregnancy Rate, % 92 82 84 96 7 0.21 88 88 4 0.97
Calving rate, % 90 80 82 — 6 0.36 86 83 4 0.54
Calved in fi rst 21 d, % 80 75 78 — 7 0.83 78 78 5 0.98 1HAY = heifers received ad libitum hay and 4 lb/d supplement from Jan. 15 to April 15.2MDW = heifers grazed meadow and received 1 lb/d supplement from Jan. 15 to April 15.3Treatment ADG from Jan. 16 to April 22 (96 d), includes the treatment period.4Spring ADG from April 22 to May 22 (30 d).5Summer ADG from May 22 to Sept 10 (111 d).6Pre- breeding BW determined May 22.7Percent of mature BW at breeding based on mature cow size of 1,218 lb.8Considered pubertal if blood serum progesterone concentration > 1 ng/mL.a,b,c For Development Year, means in a row with diff erent superscripts are diff erent (P ≤ 0.05).x,y,z For Development Year, means in a row with diff erent superscripts are diff erent (0.05 ≤ P < 0.1).
Table 2. Eff ect of over- winter treatment on developing May- born heifer gain and reproductive performance
Development Year TreatmentItem 2012 2013 2014 2015 SEM P- value HAY1 MDW2 SEM P- valuen 66 65 68 59 128 130ADG
Treatment ADG,3 lb/d 1.17xz 0.86yz 1.10xz 1.41x 0.09 0.09 1.39 0.86 0.07 0.01Spring ADG,4 lb/d 1.92b 2.43a 2.56a 1.90b 0.07 0.01 2.07 2.34 0.04 0.03Summer ADG,5 lb/d 0.68c 0.84c 1.76a 1.34b 0.07 <0.01 1.06 1.26 0.04 0.03
Body WeightWeaning BW, lb 434x 434x 406xy 397y 11 0.05 417 419 4 0.90Post- Treatment BW, lb 580 522 527 540 13 0.13 575 514 9 0.02Pre- breeding BW,6 lb 697 672 686 666 11 0.32 703 657 7 0.02Percent Mature BW,7 % 57 55 56 55 1 0.32 58 54 1 0.02Pregnancy Diagnosis BW, lb 765b 772ab 866a 787ab 13 0.05 811 785 11 0.16
Pubertal,8 % 78a 37b 96a 54b 5 <0.01 72 60 4 0.02Pregnancy Rate, % 71 62 70 76 6 0.38 72 68 4 0.44Calving Rate, % 68 57 67 — 6 0.35 65 63 5 0.77Calved in 1st 21 d, % 75 74 60 — 8 0.27 60 78 6 0.03
1HAY = heifers received ad libitum hay and 4 lb/d supplement from Jan. 15 to April 15.2MDW = heifers grazed meadow and received 1 lb/d supplement from Jan. 15 to April 15.3Treatment ADG from Jan. 5 to May 10 (125 d), includes the treatment period.4Spring ADG from May 10 to July 9 (30 d).5Summer ADG from July 9 to Sept 10 (63 d).6Pre- breeding BW determined July 9.7Percent of mature BW at breeding based on mature cow size of 1,218 lb.8Considered pubertal if blood serum progesterone concentration > 1 ng/mL.a,b,c For Development Year, means in a row with diff erent superscripts are diff erent (P ≤ 0.05).x,y,z For Development Year, means in a row with diff erent superscripts are diff erent (0.05 ≤ P < 0.1).

10 · 2017 Nebraska Beef Cattle Report
than in May (87 vs. 70 ± 3%). Th e lower pregnancy rate in May heifers may be due to declining forage quality and quantity during the breeding season.
Shelby A. Springman, graduate studentHazy R. Nielson, former graduate studentJacqueline A. Musgrave, research technicianJohn Nollette, research technicianAndy Applegarth, operations managerRick N. Funston, professor, University of Nebraska- Lincoln West Central Research and Extension Center, North Platte, Neb.
HAY (58%) compared with MDW (54%). May- born heifers on HAY had greater (P = 0.02) pubertal status prior to breeding than MDW. Signifi cant development year eff ects are noted for spring and summer ADG due to the severe drought year in 2012. Pregnancy and calving rates were similar (P ≥ 0.44) between treatments, although, the proportion of heifers that calved in the fi rst 21 d was greater (P = 0.03) for MDW compared with HAY.
Heifer development system did not impact pregnancy rate in the March or May replacement heifers; however, March heifer pregnancy rate was greater (P < 0.01)

2017 Nebraska Beef Cattle Report · 11
© Th e Board Regents of the University of Nebraska. All rights reserved.
consisting of wet distillers grains (WDG), grass hay, corn silage (CS), and a pellet to balance for minerals. Heifers in Group 2 (n = 317) grazed dormant meadow and were off ered supplement containing WDG, CS, and a balancer pellet. In early February, heifers in Group 2 were moved to 2 drylot pens and off ered a diet containing WDG, grass hay, CS, and balancer pellet. Heifers in Group 3 (n = 357) were managed in 5 drylot pens and off ered a diet comprised of WDG, mixed hay (50, 25, and 25% alfalfa, grass, and millet hay, respectively), CS, and liquid fi nisher supplement.
All heifers were synchronized using a MGA- PG protocol. From d 1 through d 14 each heifer was off ered 0.5 mg/d MGA (Zoetis, Florham Park, NJ) pellets included in their diet. On d 33, heifers received a
eff ective as controlled internal drug release (CIDR) device in fi xed- time AI protocols (2014 Nebraska Beef Report, pp. 8– 10). Th e objective of this study was to compare preg-nancy rates using modifi ed estrus detection and FTAI vs. no estrus detection and FTAI utilizing a MGA- prostaglandin F2α (PG) synchronization protocol.
Procedure
Yearling, Angus- based crossbred heifers (n = 971, 761 ± 31 lb) were managed in 3 groups at the Kelly Ranch near Suther-land, NE. During the development period, heifers were fed to achieve 60% mature BW at breeding.
Heifers in Group 1 (n = 297) were managed in 3 drylot pens and off ered a diet
Ben T. TibbittsT. L. MeyerDan J. Kelly
Rick N. Funston
Summary with Implications
Th e objective of this study was to compare a modifi ed estrus detection and fi xed time AI vs. no estrus detection and fi xed time AI on subsequent pregnancy rates. Yearling heifers were estrus synchronized and AI at 72 ± 2 h aft er prostaglandin injection. In one group estrus was not detected and all heifers received gonadotropin releasing hormone at the fi xed- time AI; in the other group estrus was detected at 58 ± 2 and 70 ± 2 h aft er prostaglandin and inseminated in the following order at 72 ± 2 h: heifers in estrus at 58 h, heifers in estrus at 70 h, and heifers not appearing in estrus at either observation. Similar AI conception and fi nal pregnancy rates were achieved without the added labor of estrus detection.
Introduction
Artifi cial insemination (AI) allows producers to utilize superior genetics for less cost than purchasing a herd sire of similar quality. Using AI can decrease the chance for dystocia by using high accuracy calving ease sires. Additionally, estrus synchronization can shorten the calving season, increase calf uniformity (2010 Nebraska Beef Report, pp. 13– 15), and facilitate the use of AI.
Estrus synchronization and AI require planning and additional time and labor. Fixed- time AI (FTAI) protocols eliminate estrus detection and reduce the number of times cattle are handled, but may result in lower conception rates than protocols involving estrus detection (2016 Nebras-ka Beef Report, pp. 17– 18). Melengestrol acetate (MGA) is an alternative progestin commonly used to synchronize estrus in beef heifers and has proven to be as
Timed Insemination vs. Modifi ed Estrus Detection in Beef Heifers
MGA
GnRH
PG AI
(GnRH)
Treatment day
1 14 33 36. . .19 d. . . . . .72 h. . .
MGAPG AI†
Treatment day
1 14 33 36. . .19 d. . . 72 h
*Estrus detect at 58 and 70 h post-PG†At 72 ± 2 h, heifers were AI in the following order:
1. heifers in estrus at 58 h2. heifers in estrus at 70 h3. heifers not expressing estrus at either time
(these heifers received GnRH at AI)
Figure 2. Modifi ed melengestrol acetate- prostaglandin F2α (MGA- PG) estrus synchronization and AI protocol
Figure 1. Melengestrol acetate- prostaglandin F2α (MGA- PG) estrus synchronization and fi xed time AI protocol

12 · 2017 Nebraska Beef Cattle Report
5 mL i.m. PG (Lutalyse, Zoetis, Florham Park, NJ) injection. At PG injection, estrus detection aids, or patches, were applied (Estrotect, Rockway Inc, Spring Valley, WI). At AI, a patch score was recorded for each heifer to indicate estrus status. Th e score refl ected the percentage of rub- off coating removed from the patch. A patch score 1 meant a patch had no rub- off coating removed, a score of 2 described a patch with < 50% of the coating removed, a patch score 3 represented a patch with ≥ 50% of the coating removed, and a patch score of 4 refl ected a missing patch. Heifers receiving a patch score of 3 were considered to have expressed estrus.
At 72 ± 2 h aft er PG, all FTAI heifers (Figure 1) received 2 mL GnRH (Fertagyl, Intervet/Merck Animal Health, Madison, NJ) i.m. injection and were AI. Heifers in the modifi ed- time AI (MTAI, Figure 2) treatment were detected for estrus at 58 ± 2 and 70 ± 2 h aft er PG. Heifers expressing estrus were penned separately. Approxi-
Table 1. Comparison of FTAI1 or MTAI2 protocols on heifer performance
Item FTAI MTAI SEM P- Value
n 486 485
Pre- breeding BW, lb 763 758 31 0.87
Pregnancy test BW, lb 807 814 15 0.27
ADG3, lb 0.88 0.66 0.11 0.59
Percent mature BW4, % 62 63 5 0.86
AI pregnancy rate, % 62 62 5 0.49
Final pregnancy rate, % 96 97 3 0.981 Synchronized using melengestrol acetate- prostaglandin F2α (MGA- PG) protocol. Approximately 72 ± 2 h aft er PG heifers
received GnRH and AI.2 Synchronized using MGA- PG protocol. Heifers were detected for estrus at 58 ± 2 and 70 ± 2 h post PG. At 72 ± 2 h aft er PG,
heifers were AI in the following order: heifers in estrus 58 h post- PG, heifers in estrus 70 h post- PG, and heifers not expressing estrus, which received GnRH at AI.
3ADG from pre- breeding to pregnancy diagnosis.4 Based on 1,220 lb mature BW.
Table 2. Eff ect of estrus status (patch score1) at AI on heifer pregnancy rates in heifers on a FTAI2 or MTAI3 protocol
FTAI MTAI
Patch score 1 2 3 4 1 2 3 4 SEM P- Value
n 44 144 283 15 44 110 326 5
AI pregnancy rate, %
42b 48b 71a 40b 52b 53b 66a 55b 8 < 0.05
Final pregnancy rate, %
96 96 97 86 93 90 95 99 3 0.97
1 Refl ected the percentage of rub- off coating removed from the estrus detection aid, or patch: patch score 1 = not rubbed, 2 = ≤ 50% rubbed, 3 = ≥ 50% rubbed, and 4 = missing.
2 Synchronized using melengestrol acetate- prostaglandin F2α (MGA- PG) protocol. Approximately 72 ± 2 h aft er PG heifers received GnRH and AI.
3 Synchronized using MGA- PG protocol. Heifers were detected for estrus at 58 ± 2 and 70 ± 2 h post PG. At 72 ± 2 h aft er PG, heifers were AI in the following order: heifers in estrus 58 h post- PG, heifers in estrus 70 h post- PG, and heifers not expressing estrus, which received GnRH at AI.
a,b Means in a row with diff ering superscripts diff er (P < 0.05).
mately 72 ± 2 h aft er PG, MTAI heifers were AI in the following order: heifers in estrus at 58 h post- PG, heifers in estrus at 70 h post- PG, and heifers not expressing estrus at either observation. Heifers not expressing estrus in at either detection time (58 and 70 h post- PG) received GnRH at AI. Th irteen days following AI, bulls were placed with heifers at a bull to heifer ratio of 1:50 for a 42 d breeding season. A minimum of 51 d aft er AI, BW was measured and pregnancy was detected via transrectal ultrasonogra-phy (Aloka, Hitachi Aloka Medical America Inc., Wallingford, CT). Heifers not pregnant by AI were diagnosed for pregnancy again 45 d following bull removal.
Statistical Analysis
All data were analyzed using the GLIM-MIX procedure of SAS (SAS Institute, Inc., Cary, N.C.) accounting for group, pen, treatment, and treatment × group interac-tion. Origin, group, and AI technician were
included as random variables. Pregnancy rate was analyzed using an odds ratio. Least square means and SE of the proportion of pregnant heifers by treatment were ob-tained using the ILINK function.
Results
Pre- breeding BW was similar (P = 0.48) between FTAI and MTAI heifers (763 and 758 ± 31 lb, respectively; Table 1). Further-more, BW was similar (P = 0.26) at fi rst pregnancy diagnosis (807 and 814 ± 15 lb; FTAI and MTAI, respectively). Heifers from both groups reached a similar (P = 0.86) percentage mature BW (62 ± 5%, based on 1,220 lb mature BW) prior to breeding. Th e AI conception rate was also similar (62 ± 5%, P = 0.49) for both treatments.
Conception rates by patch score are shown in Table 2. Heifers exhibiting an acti-vated patch (score 3) had greater (P < 0.01; 71 and 66 ± 5% for FTAI and MTAI, respec-tively) AI conception rate in both FTAI and MTAI treatments vs. 47 and 53 ± 9 % AI conception rates in non- estrus heifers (score 1, 2, and 4) for FTAI and MTAI, respectively.
At fi rst estrus detection (58 ± 2 h) 132 heifers exhibited a patch score of 3 (66 ± 5% conception rate), at second estrus detection (70 ± 2 h) 156 heifers exhibited a patch score 3 (66 ± 5% conception rate), and at AI, 38 additional heifers exhibited a patch score 3 for MTAI protocol (68 ± 5% conception rate). Estrus activity at AI did not infl uence fi nal pregnancy rates (96 and 97 ± 3% for FTAI vs. MTAI, respectively; P = 0.97).
Conclusion
Reproductive technologies such as estrus synchronization and AI have limited adoption in the beef industry, partially due to added labor. Protocols that limit labor and cattle processing have a greater poten-tial of being adopted. Th e present study provided a synchronization and AI protocol that limits cattle handling and eliminates estrus detection without compromising conception rates.
Ben T. Tibbitts, graduate studentT.L. Meyer, research technicianDan J. Kelly, Kelly Ranch, Sutherland, NERick N. Funston, professor, University of Nebraska— Lincoln West Central Research and Extension Center, North Platte, NE
2017 Nebraska Beef Cattle Report · 13
© Th e Board Regents of the University of Nebraska. All rights reserved.
greater than 50% of the rub- off coating had been removed from the Estrotect patch and were AI 12 h later. Following the AI period, mature bulls were then placed with heifers at ratios of 1:49 and 1:35 at L2 and L3, respectively, for 19 d to conclude a 25 d breeding season.
Heifers were managed on native Sand-hills range throughout the summer grazing period. Pregnancy diagnosis was conducted via transrectal palpation approximately 45 d following bull removal and ending BW measured. Non- pregnant heifers were mar-keted as stocker cattle. During the second production year, heifers (n = 1,667; 706 and 961, for IMP and CON, respectively) retained as replacements were managed in 3 groups and grazed native upland range throughout the year without further treat-ment. Cows were off ered 1 lb/d of a 32% CP supplement range cube for 30 d (15 d prior to breeding until 15 d following bull turn-out). Pregnancy diagnosis was performed via transrectal palpation approximately 45 d following bull removal.
Economic Evaluation
Winter grazing cost was estimated to be one- half the grazing costs for a mature cow ($0.46/d) based on heifer BW at wean-ing. Winter range with supplement was valued at $0.75/d. Summer grazing costs were $0.55/d for upland grass. Additional development costs, including feed deliv-ery costs, breeding costs, and health and veterinarian costs, were charged at $0.36/head/d. Average heifer purchase and cull prices were based on USDA Agricultural Marketing Service prices reported in Ne-braska for each date. Th e total value of cull heifers was subtracted from the total cost of all developed heifers. Total costs were then divided by the number of heifers exposed to determine the total cost of 1 pregnant heifer. Th is value was divided by fi nal preg-nancy rate to determine the total net cost of 1 pregnant heifer.
to the label, which in general is from 30 to 45 d of age and prior to weaning. Since traditional heifer development programs focus on maximizing reproductive rates, reproductive risk associated with implants not intended for breeding females has been avoided.
Th e objective of the present study was to evaluate eff ects of a single stocker implant (Revalor G) on growth and reproductive performance of yearling beef heifers in the Nebraska Sandhills.
Procedure
In 2011, 12 mo old crossbred beef heifers (n = 3,242; 525 ± 4 lb) grazing native Sandhills range at 3 locations were randomly assigned to be implanted with Revalor G (40 mg trenbolone acetate and 8 mg estradiol, IMP) or not implanted (control, CON). Heifers were implanted at the beginning of the grazing period (May 1). At the time of implant, all heifers were vaccinated (Pyramid 5, Boehringer Ingel-heim, St. Joseph, MO; and VL5 Staybred, Zoetis, Florham Park, NJ) and treated with a topical endectocide (Ivermax, RXV Products, Westlake, TX). At each location, heifers grazed common upland pastures for 164 ± 4 d.
Breeding season began 82 ± 2 d fol-lowing trial initiation. Heifers at location 1 (L1, n = 942) were synchronized with 2 prostaglandin F2α (PG) injections admin-istered 17 d apart (5 ml, Lutalyse, Zoetis, Florham Park, NJ) followed by 5 d of estrus detection and AI. Mature bulls were then placed with heifers at a 1:52 bull to heifer ratio for 20 d to conclude the breeding season. At location 2 (L2; n = 1,184) and 3 (L3; n = 1,116), mature bulls were placed with heifers at a 1:82 bull to heifer ratio 6 d before heifers received a single PG injection followed by 6 d of estrus detection and AI. Estrus detection aids were utilized at all 3 locations (Estrotect, Rockway Inc., Spring Valley, WI) at PG injection. Heifers were considered to have expressed estrus when
Benjamin T. TibbittsHazy R. Nielson
K. C. RamsayR. N. Funston
Summary with Implications
Th is study evaluated eff ects of a single stocker implant (Revalor G) on growth and reproductive performance of yearling beef heifers in the Nebraska Sandhills. Crossbred heifers, grazing native Sandhills range, were randomly assigned to either be implanted 82 ± 2 days prior to estrus synchronization, or not implanted, to determine the eff ects of growth implants on heifer performance. Heifers were bred via artifi cial insemination followed with clean- up bulls. Implanted heifers gained more and were heavier at the end of the trial, but had a reduced pregnancy rate than non- implanted heifers. Implanted heifers also had a lower pregnancy rate in their second breeding season. Implanting yearling beef heifers increased average daily gain; however, it decreased initial and subse-quent pregnancy rate compared with heifers not implanted. When deciding to implant re-placement females, the current (or expected) market conditions for pregnant and feeder heifers must be considered.
Introduction
Administering growth implants in stocker systems results in increased growth, improved effi ciency, and increased profi t-ability. Initially, growth implants were uti-lized in the fi nishing phase of production, but over the past several decades, growth implants have been incorporated at earlier stages of growth and development. Growth implants have not been widely used in heif-er calves due to reproductive concerns, but suckling calf implants approved in breeding heifers have little or no eff ect on subsequent reproduction when implanted according
Growth and Reproductive Performance of Yearling Beef Heifers Implanted with Revalor G in the Nebraska Sandhills

14 · 2017 Nebraska Beef Cattle Report
Statistical Analysis
Data were analyzed using the GLIMMIX procedure of SAS. Individual heifer was the experimental unit and synchronization protocol was included as a random variable in the model. Location was experimental unit for economic analysis and in Table 2 where data are presented by location. Least squares means and SE for ADG, BW, and pregnancy rate were obtained using the Tukey function of SAS.
Results
Th e main eff ects of heifer growth and reproductive performance are presented in Table 1 and are presented by location in Table 2. Initial heifer BW was similar (P > 0.10) between treatments (525 ± 4 lb). Im-planted heifers had greater ADG and end-ing BW (P < 0.05; 1.48 vs. 1.39 ± 0.02 lb/d and 765 vs. 750 ± 7 lb for IMP and CON, respectively). Heifers in the current study grazed native upland Sandhills pasture during the trial without supplement. Forage quality of Sandhills rangeland early in the grazing period is high, but decreases with increasing plant maturity (1997 Nebraska Beef Report, pp. 3– 5). Th erefore, heifers on a higher plane of nutrition for the entire grazing period would likely have a greater growth response to implants.
In a previous study (1984 Nebraska Beef Report, pp.45– 47), implants were administered to crossbred beef heifers at 1, 6, or 9 mo, or at multiple intervals. Heifers receiving a combination of 2 implants had greater ADG from weaning to breeding than control or heifers implanted 3 times. Conception rates in a 62- d breeding season were comparable for implanted vs. non- implanted control heifers (93 vs. 96%), with the exception of heifers receiving implants at both 1 and 6 mo of age (56%). Calf birth weight, dystocia score, cow re- breeding rate, and calf weaning weight were not aff ected by implant treatment.
In the present study, pregnancy rate was greater (P < 0.01) for CON vs. IMP heifers (64 vs. 46 ± 3%). In the 1984 Nebraska Beef Report, pp.45– 47 which observed similar conception rates among non- implanted controls and heifers implanted at 1, 6, or 9 mo of age, implants were administered earlier than in the present study. Strength and type of hormone provided by diff erent
Table 1. Eff ects of Revalor- G on reproduction and summer BW gain of beef heifers grazing native Sandhills rangeland
Item CON1 IMP2 SEM P- value
n 1,621 1,621
Spring BW, lb 522 525 4 > 0.10
Fall BW, lb 750 765 7 < 0.01
ADG3, lb 1.39 1.48 0.02 < 0.01
Pregnancy rate, % 64 46 3 < 0.01
2nd preg. rate, 4 % 96 93 2 0.021CON = Heifers did not receive a growth implant prior to breeding season.2 IMP = Heifers received a Revalor G implant 82 ± 2 d prior to breeding season (Merck Animal Health, Summit, NJ).3 Grazing season ADG (Location 1– 162 d, Location 2– 160 d, Location 3– 168 d).4Second season pregnancy rates (n = 1,667).
Table 2. Eff ects of Revalor G on reproduction and summer BW gain of beef heifers grazing native Sandhills rangeland by location
Item CON1 IMP2 SEM P- value
Location L1 L2 L3 L1 L2 L3
Spring BW, lb 511 518 540 511 520 545 9 0.20
Fall BW, lb 719 774 791 732 794 805 33 0.02
ADG, lb3 1.28 1.59 1.48 1.34 1.70 1.54 0.13 0.03
Pregnancy rate, % 59 64 67 44 44 51 3 < 0.011CON = Heifers did not receive a growth implant prior to breeding season.2IMP = Heifers received a Revalor G (Merck Animal Health, Summit, NJ) implant 82 ± 2 d prior to breeding season.3Grazing season ADG (Location 1, 162 d; Location 2,160 d; Location 3, 168 d).
Table 3. Economics of implanting beef heifers with Revalor G at 12 mo of age1
Item CON2 IMP3 SEM P- value
Winter feed costs /$heifer4 102 102 .02 1.0
Summer feed cost /$heifer 91 91 .1 1.0
Total feed costs, $/heifer 193 193 .02 1.0
Total development cost5 $/heifer
1,019 1,019 3 1.0
Avg. cull heifer value $ 1,102 1,123 46 0.66
Cull heifer value $/heifer exposed
402 601 18 < 0.01
Net cost of 1 pregnant heifer6, $
969 901 36 0.13
1Heifers developed at Rex Ranch on native Sandhills rangeland.2CON = Heifers did not receive a growth implant prior to breeding season.3IMP = Heifers received a Revalor G (Merck Animal Health, Summit, NJ) implant 82 ± 2 d prior to breeding season.4Heifers grazed winter range for 135 d with the equivalent of 1 lb/d 32% CP supplement 3 times per wk.5Includes all fi xed and variable cost associated with initial heifer price, feed, feed delivery, breeding, transportation, and supple-
ment.6Total value of cull heifers was subtracted from the total cost of all developed heifers. Total costs were then divided by the num-
ber of heifers exposed to determine the total cost of 1 pregnant heifer.
2017 Nebraska Beef Cattle Report · 15
demand for replacement females. Some beef stocker enterprises have utilized their resources to market pregnant replacement females and many cow- calf producers have marketed excess pregnant females in response to market demand. It is important to note the implant used in this study is not approved for breeding females, so when pregnant heifer value exceeds feeder heifer value, it is unlikely the additional BW gain in cull females will compensate for the decreased pregnancy rate. However, when pregnant heifer value is comparable to feeder heifer value, the additional BW gain from the implant increases the value and effi ciency of stocker heifers.
Benjamin T. Tibbitts, graduate studentHazy R. Nielson, former graduate studentK. C. Ramsay, Rex Ranch, Ashby, NERick N. Funston, professor, University of Nebraska— Lincoln West Central Research and Extension Center, North Platte, NE
the net cost of 1 pregnant heifer tended (P = 0.13) to be greater in CON heifers due to increased gains in IMP heifers. Cull value did not diff er (P = 0.66) despite a $21 numerical advantage for IMP heifers.
Stocker enterprises commonly market cattle in late summer when pasture avail-ability or forage quality may be declining. A disadvantage in the design of the present study is quantifying treatment diff erences in the expense and resource allocation associated with retaining heifers for an extended period beyond normal stocker marketing windows to accommodate preg-nancy diagnosis. It is likely that heifers con-tinued to gain during the extended period prior to pregnancy detection; however, the increased gain due to implant had presum-ably diminished due to implant potency and declining forage quality.
Conclusion
In recent years, the beef industry has seen a decline in cattle numbers and high
implants may also contribute to variation in pregnancy rates observed between studies. Ralgro was utilized in the 1984 study, whereas Revalor G was used in the present study. Both Ralgro and Revalor G are synthetic hormones; however Ralgro con-tains zeranol, an estrogenic hormone that mimics estradiol, and Revalor G contains trenbolone acetate, an androgenic hormone that mimics testosterone
Subsequent pregnancy rate aft er the fi rst calving season was also lower (P = 0.02) in IMP (93%) vs. CON (96%) heifers, which suggests implanting heifers may have a residual or development eff ect on grow-ing heifers beyond the production yr the implant was administered.
Economic Analysis
Th e economic analysis is presented in Table 3. Heifers were developed together by location; therefore, winter and summer feed costs and total development costs were sim-ilar between treatments (P = 1.0). However,

16 · 2017 Nebraska Beef Cattle Report
© Th e Board Regents of the University of Nebraska. All rights reserved.
distribution with the means and SD for each respective trait obtained from litera-ture. Income was derived from marketing animals based on carcass weight, quality grade and yield grade. Th e 5- year (2010- 2014) average price for steers and heifers at slaughter was obtained from the Livestock Marketing Information Center (LMIC) and used as the base price for all slaughter ani-mals. Premium and discount values based on yield grade, quality grade and carcass weight were obtained from United States Department of Agriculture- Agricultural Marketing Service (USDA- AMS). Costs of the system included feed, veterinary, medicine, bedding, marketing, custom operations, fuel, repairs, processing and yardage. Five- year averages of prices for feedstuff s used in the production system were calculated using information obtained from the USDA— National Agricultural Statistics Service (USDA- NASS).
In the production system assumed for the maternal index, calves were born from a combination of heifers and mature cows, with resulting progeny retained as replace-ments or sold at weaning. Phenotypes for the maternal objective traits were simu-lated from a random normal distribution with the means and SD for each respective trait obtained from literature. Income was derived from marketing calves at weaning and non- pregnant females based on their weight and the market price of that weight category. Average prices of weaned calves ranging in weight from 350 to 700 lbs were calculated from 5 years of fi ltered data from the USDA- AMS. Data was fi ltered to in-clude only states in the region where Beef-master cattle are the most prevalent. States included were Alabama, Arkansas, Georgia, North Carolina, South Carolina, Florida, Mississippi and Texas. Average prices of cull females were estimated as a 5- year average obtained from the LMIC. Costs of the sys-tem were feed and expenses associated with calving diffi cultly. A 5- year average of prices for feedstuff s used in the production system was calculated using information obtained from the USDA- NASS.
While EPD are the traditional genetic tools used to select seedstock, they repre-sent genetic merit in only one trait while in reality multiple traits infl uence an animal’s economic value as a parent. Selection indices simplify comparisons of animals by accounting for multiple traits simultaneous-ly and by considering both biological pro-duction levels and economics. Currently, Beefmasters Breeders United (BBU) reports ten EPD, but provides no tool for multitrait selection. Th erefore, economic selection indices are needed by Beefmaster produc-ers to aid them in selecting seedstock. Th e objective of this study was to develop 2 economic selection indices for Beefmaster cattle tailored to terminal and maternal production systems.
Procedure
Economic Values of Objective Traits
Traits chosen for the breeding objective of each index should be those that aff ect the income and expense of the production system. Five objective traits were consid-ered for the terminal index including hot carcass weight (HCW), marbling score (MS), ribeye area (REA), 12th- rib fat (FAT) and feed intake (FI). Six objective traits were considered for the maternal index including calving diffi cultly direct (CDd), calving diffi culty maternal (CDm), 205- day weaning weight direct (WWd), 205- day weaning weight maternal (WWm), mature weight (MW) and heifer pregnancy (HP). Economic values for each trait in the breed-ing objective ensure selection emphasis is proportional to the economic importance of each trait. Derivation of economic values requires identifying sources of income and expense for each production system in order to develop a profi t equation.
In the production system assumed for the terminal index, all calves were born from mature cows, retained through the feedlot phase, and sold on a grid based system. Phenotypes for the objective traits were simulated from a random normal
Kathleen P. OchsnerMichael D. MacNeil
Ronald M. LewisMatthew L. Spangler
Summary with Implications
Two economic selection indices were developed for Beefmaster cattle, one for a terminal objective and one for a maternal objective. Th e terminal index was developed assuming bulls would be mated to mature cows with all resulting progeny harvested. Th e maternal index was developed assum-ing bulls would be mated to a combination of heifers and mature cows, with resulting progeny retained as replacements or sold at weaning. Relative economic values for the terminal objective traits hot carcass weight, marbling score, ribeye area, 12th- rib fat and feed intake were 91.29, 17.01, 8.38,- 7.07 and- 29.66, respectively. Relative econom-ic values for the maternal objective traits calving diffi cultly direct, calving diffi culty maternal, weaning weight direct, weaning weight maternal, mature weight and heifer pregnancy were- 2.11,- 1.53, 18.49, 11.28,- 33.46 and 1.19, respectively. Th e application of economic selection indices facilitates genetic improvement of beef cattle by aiding producers with their sire selection decisions.
Introduction
Economic selection indices are used to maximize genetic improvement in a specifi c objective. Most currently available selection indices are designed to be used by multiple breeders for specifi c marketing endpoints. Selection emphasis may diff er between production systems and goals set forth for a particular operation. Before using econom-ic indices to make selection decisions, it is important to defi ne the operation goals and choose an index that closely aligns with those goals.
Development of Terminal and Maternal Economic Selection Indices in Beefmaster Cattle

2017 Nebraska Beef Cattle Report · 17
tive trait receiving 27.2% of the emphasis. Th ese two traits are antagonistic to each other relative to the breeding objective, but since the assumed correlation between them is not unity progress can be made in both traits simultaneously.
Th e selection index value for an animal is the weighted sum of its EPD for the selec-tion criteria, with each EPD being weighted according to the index coeffi cient of that EPD (Table 2). Th e accuracy of the terminal index lies between 0.338 and 0.503, and the accuracy of the maternal index lies between 0.218 and 0.428. Th e accuracy of an index refl ects the correlation between the index and the aggregate genotype. Th e lower bound of the accuracy estimate assumes that phenotypic measures are the selection criteria. Th e upper bound of the accuracy estimate assumes that EPD known without error are the selection criteria. However, EPD would never be known with complete certainty given the heterogeneity of the residual variance. Th us, the upper bound of the index accuracy would be the ‘best case scenario,’ presuming that the accuracy of each EPD included in the index for each animal was unity. We would expect the true accuracy of the index to lie somewhere between the two accuracies presented herein that were produced by assuming the index was comprised of either pheno-typic measures or by EPD that are known without error.
As expected, the accuracy of the ma-ternal index was slightly lower than the terminal index because a greater number of indicator traits were included among the
genetic (co)variance matrix among selection criteria, a genetic (co)variance matrix be-tween selection criteria and objective traits, and the vector of economic values for each objective trait. Th e genetic (co)variances assumed in these calculations were based on estimates reported in literature.
Results
Th e relative economic values and the relative emphasis of objective traits for the terminal and maternal selection indices are presented in Table 1. In the terminal objective, decreasing FAT and FI while increasing HCW, REA and MS would increase profi tability. Hot carcass weight is the primary contributor to profi t, receiving 59.5% of the emphasis. Feed intake receives the next highest emphasis at 19.3%. Th is implies improving effi ciency is crucial to increasing the profi tability of an operation with a terminal objective.
In the maternal objective, decreasing CDd, CDm and MW while increasing WWd, WWm and HP would increase profi tability of the operation. Mature weight is the primary driver receiving 49.2% of the emphasis, implying that for the assumed parameters decreasing MW will do the most to improve profi tability of operations with a maternal objective. Weaning weight direct is the second highest priority objec-
Profi t of each system (terminal and maternal) was determined by subtracting simulated cost from simulated income for 100,000 animals. Economic values were determined by approximating the par-tial derivatives of the profi t function by perturbing one trait at a time, by one unit, holding the other traits constant at their re-spective means. Th e relative economic value of each trait was estimated as a product of the respective economic value and genetic SD. Th e relative contribution of each objec-tive trait was calculated as a percentage of the sum of the absolute value of the relative economic values for the objective traits.
Selection Index Coeffi cients
Ideally, selection criteria would include all traits in the breeding objective, but in practice some traits in the objective are not readily observed so selection criteria may in-clude indicator traits. In this study, selection criteria were chosen from EPD currently reported by BBU. Terminal selection criteria were yearling weight (YW), ultrasound ribeye area (UREA), ultrasound 12th- rib fat (UFAT) and ultrasound intramuscular fat (UIMF). Maternal selection criteria were birth weight (BWT), WWd, WWm, YW and scrotal circumference (SC). Index coeffi cients for selection criteria EPD were calculated as the product of an inverted
Table 1. Relative economic values (REV) and relative emphasis of the objective traits.
REV Relative emphasis (%)
Terminal objective
FI, lbs - 29.66 19.3
HCW, lbs 91.29 59.5
REA, sq. in. 8.38 5.5
FAT, in. - 7.07 4.6
MS, units1 17.01 11.1
Maternal objective
CDd, % - 2.11 3.1
CDm, % - 1.53 2.2
WWd, lbs 18.49 27.2
WWm, lbs 11.28 16.6
MW, lbs - 33.46 49.2
HP, % 1.19 1.714.0 = Sl0 and 5.0 = Sm0
Table 2. Index coeffi cients for EPD of selection criteria.
Terminal index
YW 1.715
UREA 0.806
UFAT - 36.60
UIMF 12.375
Maternal index
BWT - 1.371
WWd 1.426
WWm 0.945
YW - 0.660
SC 2.725

18 · 2017 Nebraska Beef Cattle Report
Conclusion
Adding more EPD for economically relevant traits is an important next step for all beef breed associations to improve the accuracy of selection indices, and thus increase profi tability of operations utilizing selection indices as a tool when mak-ing breeding decisions. For the available selection criteria, implementation of the selection indices presented herein will increase profi tability and facilitate genetic improvement of Beefmaster cattle.
Kathleen P. Ochsner, graduate studentMichael D. MacNeil, Delta G, Miles City, MTRonald M. Lewis, professor, Animal Science, LincolnMatthew L. Spangler, associate professor, Animal Science, Lincoln
selection criteria. Some indicator traits (e.g., SC) were used because they were the only traits with a non- zero correlation to im-portant breeding objective traits (e.g., HP). However, SC and HP are lowly correlated, meaning SC is not a strong indicator of HP. Th e accuracy of selection based on an index including SC as selection criteria could be greatly improved if instead EPD for HP were reported and could be included in the selection criteria. Having EPD available for other economically relevant traits such as stayability (STAY) would also greatly improve the accuracy. However, in this case STAY was not even included among the objective traits because there were no cor-related EPD available as selection criteria.

2017 Nebraska Beef Cattle Report · 19
© Th e Board Regents of the University of Nebraska. All rights reserved.
Prior to trial initiation, cows were grouped in a single drylot pen within location during the summer calving season (mean calving date: ENREC=July 7; PRE-C=July 11). A distillers and corn residue based diet was limit- fed to cow- calf pairs during this time.
Trial initiation corresponded to the beginning of cornstalk grazing within each location (ENREC=Nov 11 and PREC=Dec 4). Cow- calf pairs assigned to the CS treat-ment were hauled to irrigated cornstalk fi elds, while cow- calf pairs assigned to DL treatment remained in drylot pens.
Drylot pairs within location were limit- fed a common diet (Table 1) formulated to maintain a lactating cow in early gestation. Dry matter off ered increased monthly throughout the study to account for the increasing intake of the growing calves.
Stocking rate for cow- calf pairs grazing cornstalks was calculated using estimated residue intakes of the cow and calf (2009 Nebraska Beef Cattle Report, pp. 13- 14) and assuming 8 lb of husk and leaf residue (DM) were available per bushel of corn yield.
is limited on the performance of a lactating cow and her calf while grazing cornstalk residue. Th erefore, the objective of this study was to investigate a winter manage-ment system incorporating winter cornstalk residue grazing on cow and calf perfor-mance in a summer- calving intensively managed cow- calf production system.
Procedure
A study was conducted within two locations: the Eastern Nebraska Research and Extension Center (ENREC) feedlot and the Panhandle Research and Extension Center (PREC) feedlot. Seventy- six (n=47 at ENREC; n=29 at PREC) lactating, composite (Red Angus x Red Poll X Tarentaise x South Devon x Devon) beef cows with summer- born calves were utilized in the study. With-in each location, cow- calf pairs were blocked by cow BW (ARDC=4; PREC=3 blocks for drylot and 2 blocks for cornstalk grazing), stratifi ed by calf age, and assigned randomly to one of two treatments: 1) dry lot feeding (DL) or 2) cornstalk grazing (CS).
Shelby E. GardineJason M. WarnerCurtis J. Bittner
Robert G. BondurantKarla H. Jenkins
Rick J. RasbyMatt K. Luebbe
Galen E. EricksonTerry J. Klopfenstein
Summary with Implications
A study evaluated the eff ects of two wintering systems (cornstalk grazing and drylot feeding) on cow- calf performance in a summer- calving intensively managed cowherd at two locations. Grazing cow- calf pairs on cornstalks resulted in lower ending BW of cows and reduced ADG of calves when compared to drylot cow- calf pairs at weaning. A partial budget of incorporating winter cornstalk grazing into an inten-sive production system suggests that cows wintered on cornstalks were $136.85 more profi table when compared to cows wintered in the drylot.
Introduction
Th e conversion of grassland to crop production has stimulated the cattle industry to seek alternative production systems. Research has shown that intensive management of cows can be utilized as an alternative system to traditional pasture beef production (2015 Nebraska Beef Cattle Report, pp. 16- 18). More acres used for grain crop production has also resulted in greater availability of corn residue for fall/winter grazing. An economic analysis of an alternative production system would suggest that integrating cornstalk residue grazing in a partial intensive management system could reduce production cost for a cow- calf enterprise (2015 Nebraska Beef Cattle Report pp. 19- 21). However, research
Eff ects of Wintering System on Cow and Calf Performance in a Summer- Calving Intensive Production System
Table 1. Ingredient and nutrient composition of diets fed to cow- calf pairs in drylot by location1
Location
Ingredient, % ENREC PREC
Modifi ed wet distillers grains plus solubles 55.0
Wet distillers grains plus solubles — 58.0
Wheat Straw 40.0 40.0
Supplement 5.0 2.0
Calculated Composition
DM, % 62.4 47.0
CP, % 19.3 18.8
TDN, % 79.1 81.0
NDF, % 54.0 54.9
ADF, % 31.0 21.6
Ca, % 0.79 0.77
P, % 0.52 0.491All values presented on a DM basis2Supplements included limestone, trace minerals, and vitamin A,D,E premix

20 · 2017 Nebraska Beef Cattle Report
A dried distillers grain based pellet (Ta-ble 2) was supplemented in bunks (space: 2 linear feet per pair) to pairs wintered on cornstalks at a rate of 5.3 lb. (range of 3.7 lb. to 7.1 lb.) DM/pair daily. Th e amount supplemented each day was calculated to provide the pairs on cornstalks the same energy intake of the DL pairs. Estimat-ed DM intake of the cow and calf (2009 Nebraska Beef Cattle Report, pp. 13- 14) and estimated digestibility values of the cornstalk residue throughout the grazing period (2004 Nebraska Beef Cattle Report, pp. 13- 15) were used to calculate supple-mentation rate. Supplemental feed was only fed to grazing pairs if snow cover prevented grazing.
Th e trial was completed when winter cornstalk grazing ended on April 12 (EN-REC) or April 14 (PREC). Weaning of the calves also coincided with the completion of the grazing season.
Cow BW and body condition score (BCS) were recorded over two consecu-tive days at trial initiation and completion to determine changes in BW and BCS. Calf weights were also collected over two consecutive days at trial initiation and completion to calculate gain.
Prior to being weighed at trial initiation, all pairs were limit- fed for a minimum of 5 consecutive days to reduce weight variation due to gastrointestinal tract fi ll. At trial completion, cow and calves were separated and limit- fed a minimum of 5 days before being weighed.
Cows were exposed to bulls (approxi-mately 1 bull: 10 cows) from Sept 25 to Nov 30 for a 66 day breeding season at both lo-cations. All bulls were examined for breed-ing soundness and approved by a licensed veterinarian prior to breeding season.
Results include 2 years of data from ENREC (1 year of previous data; 2016 Nebraska Beef Cattle Report, pp. 5- 7) and 1 year of data from PREC. Data were ana-lyzed as a randomized block design using the mixed procedure of SAS. Th e model included pen or paddock as the experimen-tal unit, wintering system as the fi xed eff ect, and block as a random eff ect. Signifi cance was declared at P ≤ 0.05.
Table 2. Supplement fed to cow- calf pairs grazing cornstalks
Ingredient, %
Dried distillers grains plus solubles 94.06
Limestone 5.49
Pelleting binder (urea formaldehyde polymer and calci-um sulfate)
0.21
Vitamin A,D,E 0.12
Trace mineral3 0.111All values presented on a DM basis2Fed at 5.3 lb per pair per d (DM)3Cobalt, Copper, Manganese, Zinc, Iodine, Limestone Carrier
Table 3. Performance of cows by wintering system1
Item CS2 DL3 SEM P- value
Cow BW, lb
Initial 1183 1187 62 0.93
Ending 1121 1322 57 <0.01
Cow BW Change, lb - 64 132 16 <0.01
Cow BCS4
Initial 5.3 5.3 0.3 0.92
Ending 4.6 5.9 0.2 <0.01
Cow BCS change4 - 0.7 0.5 0.2 <0.011Two years of data from ENREC and 1 year of data from PREC2CS= pairs wintered on cornstalks3DL= pairs wintered in drylot4BCS on a 1 (emaciated) to 9 (obese) scale
Table 4. Performance of calves by wintering system1
Item CS2 DL3 SEM P- value
Initial age, d4 125 129 5 0.49
Ending age, d5 282 284 3 0.51
Calf BW, lb
Initial 331 326 9 0.68
Ending 541 642 13 <0.01
Calf ADG, lb 1.33 2.04 0.1 <0.01
BW•d- 1•age- 1, lb6 1.96 2.32 0.1 <0.011Two years of data from ENREC and 1 year of data from PREC2CS= pairs wintered on cornstalks3DL= pairs wintered in drylot4Initial age= age at initiation of cornstalk grazing period5Ending age= age at collecting weights following weaning6Weight per d of age at collecting weights following weaning

2017 Nebraska Beef Cattle Report · 21
season. In contrast, the DL wintering sys-tem was estimated at $2.16 per pair day or $356.40 per pair per grazing season.
In the CS wintering system, additional feed was required for the cow to compen-sate for BW and body condition reductions observed throughout the winter. Conse-quently, additional post- weaning feed for the CS cow cost approximately $16. Th e lighter weaning weight of CS calves resulted in a reduced return of $60 per calf when a $20/cwt price slide is used between the calf weaning weights of the CS and DL winter-ing systems. A net change of $136.85 per pair was observed when winter cornstalk grazing was incorporated into an intensive production system.
Conclusion
Cow- calf pairs winter grazing cornstalks had poorer performance than pairs fed a complete diet throughout the winter in the drylot. However, lower winter produc-tion inputs may be signifi cant enough to compensate for the reduced performance of calves when cow- calf pairs are wintered on cornstalks.
Shelby E. Gardine, graduate studentJason M. Warner, graduate studentCurtis J. Bittner and Robert G. Bondurant, research technicians, Department of Animal Science, LincolnKarla H. Jenkins, assistant professor, Panhandle Research and Extension Center, Scottsbluff Rick J. Rasby, professor, Department of Animal Science, LincolnMatt K. Luebbe, assistant professor, Panhandle Research and Extension Center, Scottsbluff Galen E. Erickson and Terry J. Klopfenstein, professors, Department of Animal Science, Lincoln
increase in BCS. Calves in the drylot had a greater ending BW compared to calves grazing cornstalks (Table 4). Similarly, DL calves had greater ADG and BW per d of age compared to CS calves. Th e breeding season was nearly complete before the ex-perimental treatments were applied. Th ere-fore, the eff ect of treatment on reproduction could not be measured until the following breeding season. Only 29 cows (of the total 112) meet these criteria. Overall, pregnan-cies were 90%, but the number of cows was too small to make a treatment comparison.
A partial budget (Table 5) was utilized to economically compare the reduced performance, as well as decreased winter production cost of the CS wintering system. Winter production inputs for grazing corn-stalks were estimated to be approximately $0.87 per pair per day, resulting in a total of $143.55 per pair for a 165 winter grazing
Results
Cow- calf pairs at ENREC grazed from Nov 11 to April 19 (160 d). An ammoniated corn stalk bale was fed (approximately 147 lb DM per pair) due to snow cover. Th e cornfi eld at ENREC produced a grain yield of 217 bu per acre. Estimated removal of available corn residue was 32%. At PREC, the grazing period was 133 days (Dec 4 to April 15). Th e average yield for the cornfi eld was 245 bu per acre. Cow- calf pairs removed approximately 20% of the available residue.
Drylot cow- calf pairs were limit- fed 27.9 lb DM (ENREC) or 28.3 lb DM (PREC) throughout the trial. Drylot cows had a greater ending BW and BCS compared to cows grazing cornstalks (Table 3). Cows wintered on cornstalks lost BW and had a 0.7 unit decrease in BCS, while cows in the drylot gained BW and had a 0.5 unit
Table 5. Partial budget of winter cornstalk grazing
Inputs, $/pair/day CS1 DL2
Cornstalk rent3 0.20 —
Yardage 0.30 0.50
Ration4 — 1.66
Supplement4 0.37 —
Net cost, $/pair/day 0.87 2.16
Net cost, $/pair/wintering season 143.55 356.40
Extra post- weaning feed, $/pair5 16.00 —
Lighter weaning wt, $/pair6 60.00 —
Net change, $/pair 136.851CS= pairs wintered on cornstalks2DL= pairs wintered in drylot3Cornstalk rent = $12 per acre4Distillers priced at 100% of corn assuming $3.50 per bu of corn5 Cost to feed an additional 3.6 lb. (DM) of ration at $0.06 per lb. for 75 days to compensate for body condition reduction of cow6Th e diff erence in calf value at weaning between treatments; calf price, April 30; $20/cwt price slide

22 · 2017 Nebraska Beef Cattle Report
© Th e Board Regents of the University of Nebraska. All rights reserved.
were exposed to fertile bulls (1:25 bull:cow ratio) for 45 days in a common pasture, with breeding season ending July 15. Th e non- creep treatment occupied 1 pasture and creep treatments occupied 2 separate pastures, for a total of 3 pastures.
Cow BW and BCS were measured at the beginning and end of the supplementation period pre- breeding and at weaning. Calf BW was measured at birth, the start of the breeding season, and weaning. BW was tak-en aft er at least 12 hr without feed and water.
Cows were removed from the study for failure to wean a calf or to become pregnant and were not replaced. Th erefore, the number of cows decreased throughout the 2 years of data collection. Cows external to the experiment were introduced into pastures to maintain constant stocking rates for each pasture during the experiment.
Cows assigned to the same winter sup-plement, CIDR and creep treatment within winter pasture served as the experimental unit. Replicated treatment means within year were used for analyses of cow and calf response variables. Th ere were 4 obser-vations per treatment replication. Model fi xed eff ects included winter supplement treatment, CIDR treatment, creep treat-ment and all possible interactions. Year and residual error were included in the model as random eff ects. Eff ects of treatment were considered signifi cant when P < 0.05. Th ere were no interactions (P > 0.18) among treatments; therefore, data are reported as main eff ects.
Results
Regardless of supplement amount off ered, there was a notable fl uctuation in cow initial BW to cow weaning BW. Cows assigned to the DM0 treatment had the greatest diff erences in BW from Dec to May. Th e greatest loss in BW occurred during the period between start of calving (March) to start of breeding (May) for all 4 treatments of supplement (Table 1). Treatments fed supplement maintained
calves in a herd, those born to cows with a shorter post- partum interval will be older and therefore weigh more than contempo-raries born to cows that became pregnant later in the breeding season, thus increasing net returns of calves sold at weaning.
Objectives of this study were to deter-mine eff ects of late- gestation supplementa-tion, post- partum progestin administration, and creep feeding on productivity in spring calving systems.
Procedure
A 2- yr experiment used 120 crossbred (Red Angus, Simmental), March calving cows at the Gudmundsen Sandhills Labora-tory, near Whitman, Nebraska. Cows were stratifi ed by BW within age and treatments were assigned randomly in a 4 x 2 x 2 fac-torial arrangement: 1) No supplement from Dec 1 to Mar 1 (DM0), 1 lb of supplement from Dec 1 to Mar 1 (DM1), 1 lb of supple-ment from Jan 15 to Mar 1 (JM1), or 2 lb of supplement from Jan 15 to Mar 1 (JM2) (32% CP; 89% TDN); 2) administration of exogenous progesterone post- partum via a controlled internal drug release device (EAZI- Breed CIDR insert containing 1.38 g of progesterone; Zoetis Inc., Florham Park, NJ) for 7 d and prostaglandin F2α (5 mL Lutalyse, Zoetis Inc.) administered on day seven (CIDR), or no progesterone ad-ministration (NoCIDR); and 3) unrestrict-ed access by the calf to creep feed which contained an intake limiter (Accuration, Purina Animal Nutrition LLC, Gray Sum-mit, MO) from July 15 to Nov 1 (Creep) or no access to creep feed (NoCreep). Th e study began in December when cows were turned in to 1 of 8 upland range pastures (86 ac) where supplement treatments were delivered on a pasture basis 3 days/week until March 1. Beginning March 1 cows were managed as a single group and fed hay until the end of the calving season. On May 28 CIDR inserts were administered to cows assigned to the CIDR treatment. On June 4 CIDR inserts were removed and cows were administered prostaglandin F2α. All cows
Devin L. BroadheadL. Aaron Stalker
Jacki A. MusgraveRick N. Funston
Summary with Implications
Feeding supplement to cattle grazing dormant winter range increased cow BW and BCS and calf performance, but not pregnancy rate. Using a CIDR to shorten the post- partum interval in a cow herd with existing acceptable reproductive performance did not improve pregnancy rate. Feeding creep feed to calves increased weaning BW but should be considered within the context of a cost/benefi t analysis. Additional years of data collection may be necessary to draw defi nitive conclusions.
Introduction
Extending the grazing season to include grazing dormant pasture decreases produc-tion costs. Research has determined supple-mental RDP is necessary to maintain BCS of gestating cows grazing winter range in the Nebraska Sandhills. Feeding supplement to cows grazing winter range during the last trimester of gestation has been shown to increase calf BW at weaning but it is not known if the timing of supplement feeding optimized progeny performance. Under- nutrition during gestation causes suboptimal conditions in the maternal uterine environ-ment, which translates to depressed progeny performance. Potential cost savings could be achieved if the amount and duration of supplement feed was reduced. Further effi ciency might be achieved if supplemental feed delivered directly to the calf could undo the negative eff ects of under- nutrition to dam during gestation.
Administration of exogenous progester-one can shorten the post- partum interval. If weaning occurs at a constant day for all
Methods to Increase Productivity of Spring Calving Production Systems in the Nebraska Sandhills
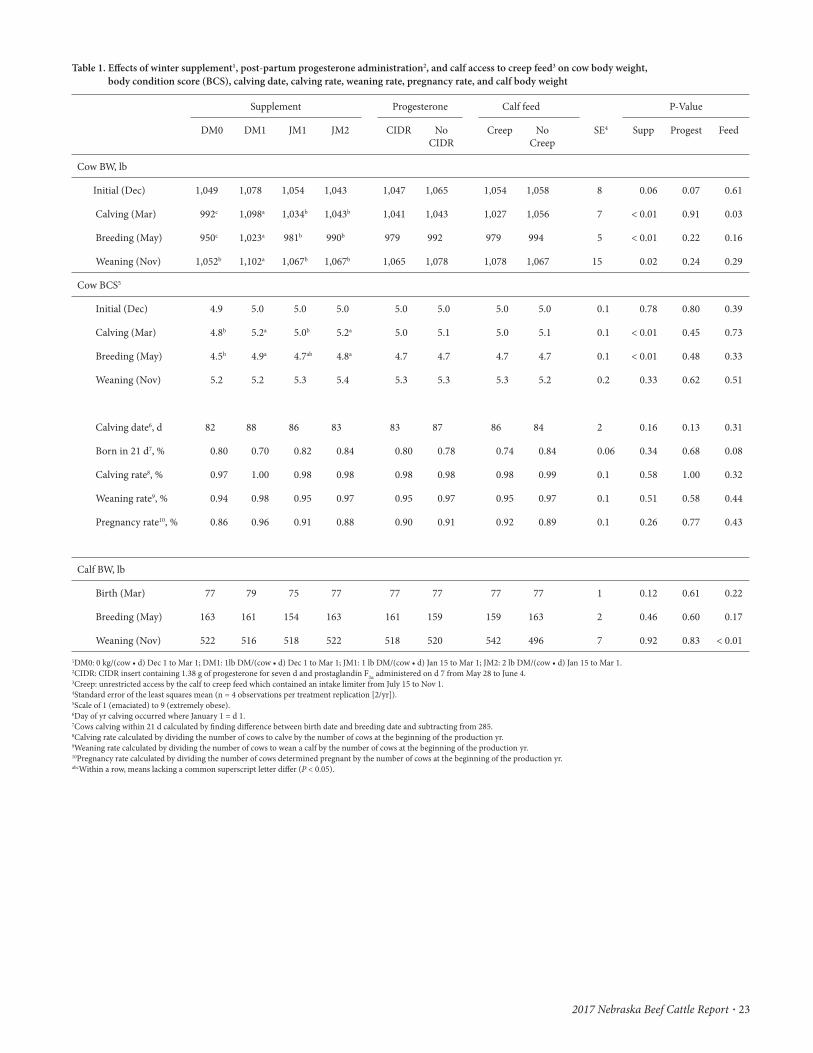
2017 Nebraska Beef Cattle Report · 23
Table 1. Eff ects of winter supplement1, post- partum progesterone administration2, and calf access to creep feed3 on cow body weight, body condition score (BCS), calving date, calving rate, weaning rate, pregnancy rate, and calf body weight
Supplement Progesterone Calf feed P- Value
DM0 DM1 JM1 JM2 CIDR No CIDR
Creep No Creep
SE4 Supp Progest Feed
Cow BW, lb
Initial (Dec) 1,049 1,078 1,054 1,043 1,047 1,065 1,054 1,058 8 0.06 0.07 0.61
Calving (Mar) 992c 1,098a 1,034b 1,043b 1,041 1,043 1,027 1,056 7 < 0.01 0.91 0.03
Breeding (May) 950c 1,023a 981b 990b 979 992 979 994 5 < 0.01 0.22 0.16
Weaning (Nov) 1,052b 1,102a 1,067b 1,067b 1,065 1,078 1,078 1,067 15 0.02 0.24 0.29
Cow BCS5
Initial (Dec) 4.9 5.0 5.0 5.0 5.0 5.0 5.0 5.0 0.1 0.78 0.80 0.39
Calving (Mar) 4.8b 5.2a 5.0b 5.2a 5.0 5.1 5.0 5.1 0.1 < 0.01 0.45 0.73
Breeding (May) 4.5b 4.9a 4.7ab 4.8a 4.7 4.7 4.7 4.7 0.1 < 0.01 0.48 0.33
Weaning (Nov) 5.2 5.2 5.3 5.4 5.3 5.3 5.3 5.2 0.2 0.33 0.62 0.51
Calving date6, d 82 88 86 83 83 87 86 84 2 0.16 0.13 0.31
Born in 21 d7, % 0.80 0.70 0.82 0.84 0.80 0.78 0.74 0.84 0.06 0.34 0.68 0.08
Calving rate8, % 0.97 1.00 0.98 0.98 0.98 0.98 0.98 0.99 0.1 0.58 1.00 0.32
Weaning rate9, % 0.94 0.98 0.95 0.97 0.95 0.97 0.95 0.97 0.1 0.51 0.58 0.44
Pregnancy rate10, % 0.86 0.96 0.91 0.88 0.90 0.91 0.92 0.89 0.1 0.26 0.77 0.43
Calf BW, lb
Birth (Mar) 77 79 75 77 77 77 77 77 1 0.12 0.61 0.22
Breeding (May) 163 161 154 163 161 159 159 163 2 0.46 0.60 0.17
Weaning (Nov) 522 516 518 522 518 520 542 496 7 0.92 0.83 < 0.01
1DM0: 0 kg/(cow • d) Dec 1 to Mar 1; DM1: 1lb DM/(cow • d) Dec 1 to Mar 1; JM1: 1 lb DM/(cow • d) Jan 15 to Mar 1; JM2: 2 lb DM/(cow • d) Jan 15 to Mar 1.2CIDR: CIDR insert containing 1.38 g of progesterone for seven d and prostaglandin F2α administered on d 7 from May 28 to June 4.3Creep: unrestricted access by the calf to creep feed which contained an intake limiter from July 15 to Nov 1.4Standard error of the least squares mean (n = 4 observations per treatment replication [2/yr]).5Scale of 1 (emaciated) to 9 (extremely obese).6Day of yr calving occurred where January 1 = d 1.7Cows calving within 21 d calculated by fi nding diff erence between birth date and breeding date and subtracting from 285.8Calving rate calculated by dividing the number of cows to calve by the number of cows at the beginning of the production yr.9Weaning rate calculated by dividing the number of cows to wean a calf by the number of cows at the beginning of the production yr.10Pregnancy rate calculated by dividing the number of cows determined pregnant by the number of cows at the beginning of the production yr.abcWithin a row, means lacking a common superscript letter diff er (P < 0.05).

24 · 2017 Nebraska Beef Cattle Report
the breeding season due to progesterone ad-ministration was not realized (P = 0.83). Al-lowing calves access to creep feed increased calf BW at weaning by 46 lb (P< 0.05). Even with the increased BW at weaning, the value of gain needs to outweigh the extra cost of creep feeding to be a recommended practice. Th ese benefi ts can vary from year to year depending on cost of gain. Total amount of creep that disappeared from feeder was 2.65 lbs DM/(calf • d).
Devin L. Broadhead, research technicianL. Aaron Stalker, associate professor Animal ScienceJacki A. Musgrave, research technician,Rick N. Funston, professor Animal Science, West Central Research and Extension Center, North Platte
did not aff ect calf BW at birth (P = 0.12), at beginning of dam’s breeding season (P = 0.46), or at weaning (P = 0.92). Similar re-search (2006 Nebraska Beef Report, pp.7– 9, 2012 Nebraska Beef Report, pp. 15– 17) has consistently demonstrated decreased BW at weaning of calves born to cows not fed supplement during winter. Similar BW at weaning between calves born to cows not fed supplement and those fed supplement in this experiment was not expected. Being year 2 of a 3- year study, more defi nitive conclusions may be drawn aft er the third year of data.
Whether or not cows were administered a CIDR did not aff ect (P > 0.13) BW, BCS, reproductive measures, or calf BW. Exog-enous progesterone was not expected to aff ect cow BW or BCS. Potential increased calf age and therefore, increased BW at weaning as a result of earlier conception in
BW. Diff erences in BW among supplement treatments were most notable at the start of the breeding season where DM0 cows had the lightest (P < 0.05) BW, JM1 and JM2 cows intermediate, with DM1 cows having the heaviest BW. Cow BCS was lower (P < 0.05) at the start of the breeding season for DM0 cows than for cows assigned to DM1 and JM2 treatments, with JM1 cows being intermediate. Diff erences in BW and BCS caused by the supplementation treatment did not aff ect measures of reproductive effi ciency such as calving date (P = 0.16), calving rate (P = 0.58), weaning rate (P = 0.51), and pregnancy rate (P = 0.26). Previous research examining eff ects of sup-plement fed to cows grazing winter range has demonstrated decreased weaning rate in cows not fed supplement in some studies but no eff ects in others (2002 Nebraska Beef Report, pp.3– 4). Supplement treatment

2017 Nebraska Beef Cattle Report · 25
© Th e Board Regents of the University of Nebraska. All rights reserved.
nensin and equilibrate Na concentrations across treatment diets to minimize intake variances due to GLY inclusion.
Steers were limit- fed a diet containing 50% alfalfa and 50% Sweet Bran (Cargill; Blair, NE) at 2% BW for 5 d at the begin-ning and end of the trial with a 3- d BW collection to serve as initial and ending BW. Ending BW was calculated as the average of the 3- d weight minus 1 lb for each day steers were fed the limit diet to correct for weight gain during those 7 d. Th e adjust-ment of 1 lb per d is based on previous steer performance data when limit- feeding 50% alfalfa hay and 50% Sweet Bran diet at 2% BW. Steers were implanted with Ralgro® (Merck Animal Health; Summit, NJ) on day 1 of the trial.
Dietary energy values for treatment diets were calculated using the 1996 NRC. Using performance equations, individual steer BW, intake, and gain were used to
Procedure
Th e experiment utilized 60 crossbred steers (initial BW = 795 lb; ± 92 lb) in a randomized complete block design to evaluate the eff ects of increasing concentra-tions of GLY in a 91- d growing trial. Steers were individually fed using the Calan gate system. Treatments included the inclusion of 0, 4, 8, and 12% dietary DM of GLY in forage- based diets (Table 1). Th e control diet consisted of 50% wheat straw, 37% wet corn bran (Cargill; Blair, NE), 8% soybean meal, and 5% supplement. Wheat straw was ground through a 3- inch screen while wet corn bran was utilized to increase palatabil-ity and reduce sorting of dietary ingredi-ents. Th e GLY replaced wet corn bran while the soybean meal and urea increased with increasing GLY to maintain equal dietary CP across treatments. Supplements were formulated to provide 200 mg per day mo-
Robert G. BondurantGalen E. Erickson
Terry J. KlopfensteinJim C. MacDonald
Summary with Implications
Th e eff ect of increasing crude glycerin concentration was evaluated in a 91- d grow-ing trial utilizing 60 steers. Crude glycerin was included at 0, 4, 8, and 12% of dietary DM in diets consisting of 50% wheat straw; 22.9- 37.0% wet corn bran, and 8.0- 10.1% soybean meal. Crude glycerin replaced wet corn bran and soybean meal was added to maintain dietary CP. Steer ending BW was not diff erent among treatments. Th ere was a quadratic increase in DMI from 0 to 8% crude glycerin and subsequent decrease at 12%. Th ere was no diff erence in ADG or feed effi ciency among crude glycerin concentra-tions. Th erefore, crude glycerin appears to have an energy value slightly less than wet corn bran in a forage- based diet.
Introduction
During the transesterifi cation process of biodiesel, fatty acids are cleaved from a triacylglyceride and bound to methanol, which is the biodiesel product. Th e remain-ing byproduct from the reaction is glycerol, also known as crude glycerin (GLY). Th e use of GLY has been evaluated in beef diets with mixed results depending on dietary ingredients being displaced. When evalu-ating 0, 4, 8, and 12% GLY in forage- based diets, GLY did not impact NDF digestibility and decreased acetate to propionate ratio as GLY inclusion increased (2016 Nebraska Beef Cattle Report, pp 40- 41). However, data comparing GLY in forage- based growing diets are limited. Th erefore, the purpose of this experiment was to determine the eff ect of GLY concentration on steer performance in forage- based growing diets.
Eff ect of Crude Glycerin Concentration on Growing Steer Performance in Forage Diets
Table 1. Dietary composition of forage- based growing diets
Crude Glycerin Concentration
0% 4% 8% 12%
Dietary Ingredient, % DM
Wheat Straw 50.0 50.0 50.0 50.0
Wet Corn Bran 37.0 32.3 27.6 22.9
Soybean Meal 8.0 8.7 9.4 10.1
Crude Glycerin 0.0 4.0 8.0 12.0
Supplement1 5.0 5.0 5.0 5.0
Supplement Ingredient,
Urea 0.79 0.87 0.94 1.01
NaCl 0.78 0.52 0.26 0.00
Limestone 0.76 0.76 0.76 0.76
Dicalcium Phosphate 0.39 0.38 0.38 0.37
Dietary Inclusion2
CP, % 12.9 13.0 13.0 13.0
MP balance, g/d 334 327 321 316
RDP balance, g/d 249 280 311 3421 Supplements formulated to provide 200 mg monensin per day.2 Dietary inclusion calculated utilizing 2000 Beef NRC model.

26 · 2017 Nebraska Beef Cattle Report
with an increase at 12% GLY concentration. Th e greatest NEm and NEg were noted for 0% GLY concentration at 0.79 and 0.50 Mcal/lb, respectively.
Conclusion
Feed conversion and dietary net energy tended to change quadratically, and were poorer at 4% and 8% GLY. Th erefore, GLY appears to have an energy value slightly less than wet corn bran in a forage diet.
Robert G. Bondurant, research technicianGalen E. Erickson, professorTerry J. Klopfenstein, professor emeritusJim C. MacDonald, associate professorUniversity of Nebraska- Lincoln (UNL) Department of Animal Science, Lincoln, Neb.
calculate dietary NEm and NEg for each GLY concentration.
Data were analyzed using the GLIMMIX procedure of SAS (SAS Institute, Inc., Cary, N.C.). Steer was the experimental unit. Block was included as a fi xed eff ect. Or-thogonal contrasts were used to test linear and quadratic eff ects of GLY concentration.
Results
Steer ending BW was not diff erent (P = 0.40) among GLY concentrations (Table 2). Th ere was a quadratic increase (P = 0.03) in DMI from 0% GLY (20.6 lb/d) to 8% GLY (22.0 lb/d) and subsequent decrease at 12% GLY (20.4 lb/d). Th ere was no diff erence in ADG (P = 0.37) or feed effi ciency (P = 0.14) among GLY concentrations. Dietary NEm and NEg had a tendency for a quadratic de-crease (P = 0.08) from 0% GLY to 8% GLY
Table 2. Eff ect of crude glycerin concentration on steer performance in forage- based growing diets
Glycerin Concentration (Diet DM) P- value
0% 4% 8% 12% SEM Linear Quadratic
Initial BW, lb 796 794 793 797 3 0.83 0.23
Ending BW, lb 1060 1048 1053 1047 9 0.40 0.74
DMI, lb/d 20.6ab 21.6ab 22.0a 20.4b 0.6 0.93 0.03
ADG, lb 2.90 2.79 2.86 2.75 0.1 0.37 0.99
F:G1 7.06 7.62 7.62 7.34 - 0.50 0.14
NEm, Mcal/lb2 0.79 0.74 0.74 0.77 0.02 0.61 0.08
NEg, Mcal/lb2 0.50 0.47 0.46 0.49 0.02 0.61 0.081 Analyzed as gain:feed, the reciprocal of F:G.2 Dietary NEm and NEg calculated based on animal performance using 1996 Beef NRC model equations.ab Means within rows diff er P < 0.05.

2017 Nebraska Beef Cattle Report · 27
© Th e Board Regents of the University of Nebraska. All rights reserved.
fed using the Calan gate system. Five days prior to trial initiation, steers were limit fed at 2% of BW to reduce gut fi ll variation. Steers were weighed on 3 consecutive days and the average was used as initial BW. Th e diet consisted of 85% corn silage with the remaining 15% fed as supplement (DM basis). Th e supplement included protein sources, urea, minerals, vitamins A- D- E, and a fi nely- ground corn carrier that was replaced with the RUP sources (Table 1). Th e RUP supplement consisted of 52% SoyPass (50% CP; 75% RUP as % of CP) and 34.7% Empyreal (Cargill; 75% CP; 65% RUP as % of CP). SoyPass is a enzymatical-ly browned soy bean meal and Empyreal is a more processed corn gluten meal. Five levels of supplement were evaluated with 12 steers per level. Supplement levels consist-ed of 0, 3.25, 6.5, 9.75 and 13% Soypass + Empyreal (RUP sources as a % of diet DM). Steers were stratifi ed by d- 2 and- 1 BW and assigned randomly to 1 of 5 treatments. All steers were implanted with Ralgro on d 0 and fed ad- libitum once daily at 8 a.m. Feed refusals were collected weekly, weighed, and then dried in a 60° C forced air oven for 48
priate for silage suggests corn silage protein is 22% RUP (% of CP). Without adequate amounts of supplemental RUP, dietary pro-tein will be limiting and will not meet me-tabolizable protein requirements, therefore negatively impacting cattle performance. Because supplemental protein provides a large amount of the total dietary protein, source and amount of supplemental protein is important. A similar study (2016 Nebraska Beef Report, pp. 49- 51) looked at 0 to 10% supplemental RUP in 88% corn silage grow-ing diets. Th ey observed a linear increase in ADG and ending BW, suggesting that MP requirements were not met with the greatest level of supplement (10% supplemental RUP from Soypass and Empyreal®). Th erefore, the objective of this study was to evaluate the eff ects of increasing supplemental RUP (up to 13% of diet DM) on growing performance of calves fed a silage based- diet.
Procedure
An 83- d growing study was conducted utilizing 60 crossbred steers (initial BW = 639; ± 40 lb). All steers were individually
Colton R. OneyF. Henry Hilscher
Robert G. BondurantAndrea K. WatsonGalen E. Erickson
Terry J. Klopfenstein
Summary with Implications
A growing study evaluated the eff ects of increasing supplemental rumen undegrad-able protein (RUP) on performance of calves fed an 85% corn silage diet. Five levels of supplementation were evaluated with 12 individually fed steers per level of supple-ment. Supplement levels consisted of 0, 3.25, 6.5, 9.75 and 13% supplemental RUP (% of diet DM) fed as a blend of 60% Soypass and 40% Empyreal. Increasing supplemental RUP in the diet increased ending body weight and average daily gain linearly, and decreased F:G linearly while DMI remained constant among treatments. As cattle grew from 600 to 730 lb, F:G was improved 30% by supply-ing RUP. Th e same amount of RUP improved F:G by 11% as cattle grew beyond 730 lb. By meeting MP requirements, supplementing RUP linearly improved both ADG and F:G of growing calves, especially early in the growing period.
Introduction
Although ADG may be diminished, feeding increased amounts of corn silage can be economically benefi cial. Feeding corn silage allows cattle feeders to harvest the en-tire corn plant at the time of greatest forage quality and also provides a large quantity of aff ordable forage. Silage averages 6.5 to 8.5% crude protein, with most of it being rumen degradable protein (RDP) which is utilized for microbial protein synthesis. Corn silage is very low in rumen undegradable protein (RUP), which bypasses rumen degradation. Current estimates using a technique appro-
Eff ect of Increasing Supplemental Rumen Undegradable Protein (RUP) on Performance of Calves
Fed a Silage Growing Diet
Table 1. Diets fed to individually fed growing steers
Treatment1
Ingredient 0.0% 3.25% 6.5% 9.75% 13%
Diet composition, % of diet DM
Corn Silage 85.0 85.0 85.0 85.0 85.0
RDP supplement2 15 11.25 7.5 3.75 0
RUP supplement3 0 3.75 7.5 11.25 15.0
Supplemented RUP4 0.4 1.7 3.0 4.2 5.5
Protein sources, % of diet DM
Soypass 0 2.0 3.9 5.9 7.8
Empyreal 0 1.3 2.6 3.9 5.2
Urea 1.5 1.2 0.9 0.6 0.31 Supplement levels consisted of 0, 3.25, 6.5, 9.75 and 13% Soypass + Empyreal (RUP sources as a % of diet DM).2 RDP supplement consisted of 79.2% corn, 2.9% limestone, 2.5% tallow, 9.7% urea, 2.0% salt, 3.2% dicalcium phosphate, trace
minerals, vitamin A- D- E, and Rumension- 90.3 RUP supplement consisted of 52% Soypass, 34.7% Empyreal, 1.9% corn, 3.2% limestone, 2.5% tallow, 1.7% urea, 2.0% salt, 1.5%
dicalcium phosphate, trace minerals, vitamin A- D- E, and Rumension- 90.4 % of RUP provided in the Supplement

28 · 2017 Nebraska Beef Cattle Report
explanation for additional improvement in ADG and F:G as supplemental RUP increased from 9.75 to 13% of diet DM is that excess MP provided from supplemental RUP can also be used as energy once MP requirements are met.
Conclusion
Further research with supplemental RUP needs to be done to determine if ex-cess metabolizable protein would continue to increase growth due to protein (meeting lysine requirements) or used as energy. Increasing the amount of RUP in silage growing diets linearly improved ending BW, ADG, and F:G by meeting MP require-ments of growing calves.
Colton Oney, graduate studentF. Henry Hilscher, research technicianRobert G. Bondurant, research technicianAndrea K. Watson, research assistant professorGalen E. Erickson, professorTerry J. Klopfenstein, professor, Animal Science, Lincoln.
for period 2 (P ≥ 0.11; d 38- 83). As RUP supplementation increased, F:G improved 30% in period 1. Th e increased improve-ment in feed effi ciency in period 1 may be due to increased amino acid requirements of younger, lighter calves.
For the overall growing period (d 1- 83), as supplemental RUP inclusion increased from 0 to 13%, a linear increase was observed in ending BW (P < 0.01). With no diff erence in DMI (P = 0.54) among the 5 treatments, averaging 17.1 lb/d, and a linear increase in ADG (P < 0.01), F:G linearly improved (P < 0.01) by 11% as RUP inclusion increased from 0 to 13%. Th e MP balance increased from- 186 to +98 g/d as RUP inclusion increased from 0 to 13%. Providing 9.75% supplemental RUP in the diets was adequate to meet the MP re-quirements based on the 1996 NRC model (MP balance of +26 g/d). Even though MP requirements were met with both the 9.75 and 13% treatments, ADG continued to lin-early increase up to 13% inclusion of RUP sources. Th is may be due to not meeting a lysine requirement with the 9.75% treat-ment. In period 1, the 13% RUP treatment had a lysine balance of +1.4 g/d. Diets were suffi cient in lysine at only the greatest inclu-sion (13%) of supplemental RUP. Another
hours to calculate an accurate DMI for indi-vidual steers. Interim weights were taken on d 36 and 37 and shrunk 4% to account for gut fi ll. At the conclusion of the study, steers were once again limit fed a diet of 50% alfalfa hay and 50% Sweet Bran (Cargill) at 2% of BW to account for gut fi ll. Weights were collected on 3 consecutive days and averaged to calculate an ending BW.
Data were analyzed using the mixed pro-cedure of SAS as a randomized block design. To evaluate RUP supplementation, linear and quadratic contrasts were developed to determine the eff ect of RUP inclusion. Signifi cance was declared at P ≤ 0.05.
Results
No diff erences in DMI (P = 0.84) were observed among treatments for period 1 (d 1- 37). However, ADG (P < 0.01) and F:G (P < 0.01) both improved linearly as RUP inclusion increased during period 1 (Table 2). Using the NRC model, MP balance (supply minus requirement of MP) for period 1 increased from- 200 to +65 g/d as RUP inclusion increased from 0 to 13%. At 9.75% RUP inclusion, MP requirements were met (MP balance of +2 g/d). Th ere were no diff erences in DMI, ADG or F:G
Table 2. Eff ects of increasing RUP in silage based growing diets on steer performance
Treatments1 P- value
Variable 0% 3.25% 6.5% 9.75% 13% SEM Lin. Quad.
Initial BW, lb 605 606 604 608 604 11.8 0.99 0.93
Ending BW, lb 800 825 821 850 834 16.6 0.01 0.68
d 1- 37
Interim BW, lb 692 707 713 730 729 14.7 0.03 0.69
DMI, lb/d 15.5 15.8 16.0 16.3 15.6 0.56 0.68 0.33
ADG, lb 2.35 2.73 2.95 3.30 3.38 0.21 < 0.01 0.52
F:G 6.59 5.79 5.43 4.94 4.62 — < 0.01 0.76
d 38- 83
DMI, lb/d 16.9 18.8 18.3 18.5 18.3 0.70 0.22 0.16
ADG, lb 2.30 2.51 2.30 2.55 2.23 0.14 0.11 0.87
F:G 7.35 7.49 7.96 7.25 8.19 — 0.60 0.32
d 1- 83
DMI, lb/d 16.3 17.5 17.3 17.5 17.1 0.59 0.34 0.19
ADG, lb 2.32 2.61 2.58 2.88 2.74 0.12 < 0.01 0.55
F:G 7.02 6.70 6.69 6.09 6.25 — < 0.01 0.611 All cattle were fed 85% corn silage with a combination of RDP and RUP supplements to achieve either 0, 3.25, 6.5, 9.75, or 13%
supplemental RUP (% of diet DM). Th e RUP source was a blend of Soypass + Empyreal in the fi nal diet.

2017 Nebraska Beef Cattle Report · 29
© Th e Board Regents of the University of Nebraska. All rights reserved.
Milling, Blair, Neb) for 5 d at the beginning and end of the trial and weighed on 3 con-secutive days to minimize diff erences in gut fi ll. Steers were blocked by initial BW, iden-tifi ed with numbered tags and implanted with 36 mg zeranol (Ralgro; Merck Animal Health). Th e experimental diets contained 56% forage, 40% supplemental energy from diff erent ratios of dry- rolled corn or MDG and 4% supplement with urea, vitamins, minerals and Rumensin (14 mg/hd/d) on a DM basis. Animals were individually fed using Calan gates for 84 days.
Feed delivery and refusals were weighed daily and recorded. Response variables included initial BW, ending BW, DMI, ADG and F:G ratio.
Data were analyzed using the MIXED procedure (SAS Inst. Inc., Cary, NC) with steer as the experimental unit, therefore 10 replications per treatment. Th e exper-iment was designed as a 3 X 4 factorial with 3 forage types (HQ, CB, and EZB) and four MDG:corn ratios (100:0, 80:20, 60:40, and 40:60). Orthogonal compar-isons across MDG levels were analyzed to determine linear, quadratic or cubic trends for varying MDG:corn ratios in the diet. Interactions between supple-mental energy ratios and forage type were also tested. Data were considered statisti-cally signifi cant when P < 0.05.
Results
No interactions (linear or quadratic; P > 0.32) were observed between forage quality and ratio of MDG:corn supplementation for ADG and F:G. A signifi cant quadratic interaction (P < 0.01) was observed for DMI (data not shown). Th e diff erences in DMI across ratios were small within each forage quality. However, the interaction was due to a quadratic increase, then decrease in DMI as MDG was replaced with corn within the HQ diets (range in DMI from 18.7 to 20.6 lb / d). For steers fed EZB, a cubic response to ratio of MDG:corn was observed with DMI of 12.2, 11.0, 12.2, and
In the past, DG was included in ru-minant diets due to its low price, but the increasing export demand in recent years has raised the price. However, it is not known if corn can displace a portion of DG as supplemental energy in forage diets for growing steers. We hypothesize that corn may replace 60% of distillers grains without negatively impacting performance because DG will still meet the protein requirements of the steers. Th e objective of this research was to determine the eff ects of displacing the supplemental energy from modifi ed DG in diets of diff erent forage qualities on performance of growing beef steers.
Procedure
Th e experiment was conducted at the University of Nebraska— Lincoln Eastern Nebraska Research and Extension Center near Mead, Neb. One hundred twenty individually fed crossbred beef steers (initial BW = 620; ± 32 lb) were used in a randomized complete block design with a 4 × 3 factorial treatment arrangement (n = 10 steers per simple eff ect treatment). Factors included 4 ratios of supplemental energy from modifi ed distillers grains (MDG) and dry- rolled corn and 3 forage types (Table 1). Ratios of MDG:corn were 100:0, 80:20, 60:40 or 40:60 as supplemental energy comprising 40% of the diet DM. Energy supplements were fed in diets consisting of high quality (HQ; 70% brome hay and 30% sorghum silage) or one of two low quality forages. Low quality forages consisted of corn residue baled through conventional rake and bale system (CB), or by disen-gaging the spreader on the combine and baling the tailings (easy bale- EZB). Four samples of each type of bale were collected and separated into cobs, shanks and husks, leaf blades and leaf sheaths, and stems. Plant parts were weighted and proportions calculated (Table 1).
Steers were fed a common diet at 2% of BW composed of 60% forage and 40% wet corn gluten feed (Sweet Bran, Cargill Wet
Viviane B. FerrariRobert G. Bondurant
Galen E. EricksonTerry J. KlopfensteinJim C. MacDonald
Summary with Implications
Distillers grains (DG) have been inten-sively used for beef production, but prices relative to corn vary such that it may be benefi cial to displace a portion of DG with corn in certain circumstances. Four ratios of supplemental energy (40% of diet DM) from modifi ed distillers grains and corn (100:0, 80:20, 60:40, and 40:60) were supplemented in one of 3 forage diets (56% of diet DM) and evaluated for performance. Forages were high (brome hay + sorghum silage) or low quality. Low quality forages were corn residue baled through conventional rake and bale, or by disengaging the spreader on the combine and baling the tailings (easy bale). Steers fed the high quality forage had greater ADG due to greater DMI, but similar F:G as both residue forage diets, which were not diff erent. Decreasing the ratio of modifi ed DG:corn linearly decreased ADG and resulted in poorer F:G.
Introduction
Ethanol production in the US increased from 6.1 billion gallons in 2007 to 13.5 billion gallons in 2014. Since then, corn residue and distillers grains (DG) have been intensively used for beef production. Corn residue is composed of plant parts with distinct digestibilities, with the husk being the most digestible, followed by leaf blade, cob and lastly stem (2015 Nebraska Beef Cattle Report, pp. 59- 61). Th e proportion of plant parts in the windrow to be baled plays an important role on performance, since it determines the digestibility of forage consumed by the animal.
Eff ects of Modifi ed Distillers Grains and Corn Ratios as Supplements in Diets Varying in Forage Quality on
Performance of Growing Beef Steers

30 · 2017 Nebraska Beef Cattle Report
10.5 observed as MDG:corn ratio decreased from 100:0 to 40:60, suggesting simply that intakes varied as MDG:corn diff ered. No diff erence in DMI was observed due to ratio of MDG:corn within CB diets. Perfor-mance due to main eff ects of either ratio of MDG:corn or forage quality are presented.
Th e HQ forage increased ending BW by 12.7% (P < 0.01), ADG by 60.0% (P < 0.01) and DMI by 62.73% (P < 0.01) compared to the low quality forages (Table 2). Th ere were no diff erences between the two corn residue forages for ending BW and ADG. Feeding EZB treatment decreased DMI compared to CB. As expected, husk proportion was increased by the EZB method, being 14.45 vs. 9.53% for EZB and CB, respectively. But, the proportion of stem + cob (the parts of the plant with lowest digestibilities) was actually slightly greater for the EZB (55.9 vs. 51.6% Stem + cob for EZB and CB, respectively; Table 3) which can explain the lack of diff erence between the low quality forages on performance. However, the F:G ratio was not aff ected by type of forage (P = 0.92) despite changes in DMI and ADG.
Th ere was a linear decrease in ending BW (P < 0.01) and ADG (P < 0.01) as MDG was displaced with corn (Table 4).
Table 1. Ingredient composition of experimental diets fed to steers (DM basis)
Item HQ1 EZB CB
1002 80 60 40 100 80 60 40 100 80 60 40
Forage 56.0 56.0 56.0 56.0 56.0 56.0 56.0 56.0 56.0 56.0 56.0 56.0
MDG3 40.0 32.0 24.0 16.0 40.0 32.0 24.0 16.0 40.0 32.0 24.0 16.0
DRC4 0.0 8.0 16.0 24.0 0.0 8.0 16.0 24.0 0.0 8.0 16.0 24.0
Supplement
Ground corn
2.1 2.1 2.1 2.1 2.60 2.60 2.54 2.28 2.60 2.60 2.54 2.28
Limestone 1.46 1.46 1.46 1.46 0.92 0.92 0.82 0.39 0.92 0.92 0.82 0.39
Tallow 0.10 0.10 0.10 0.10 0.10 0.10 0.1 0.10 0.10 0.10 0.1 0.10
Salt 0.30 0.30 0.30 0.30 0.30 0.30 0.3 0.30 0.30 0.30 0.3 0.30
Urea 0.0 0.0 0.0 0.0 0.0 0.0 0.15 0.85 0.0 0.0 0.15 0.85
Minerals 0.05 0.05 0.05 0.05 0.05 0.05 0.05 0.05 0.05 0.05 0.05 0.05
Vitamin A- D- E
0.015 0.015 0.015 0.015 0.015 0.015 0.015 0.015 0.015 0.015 0.015 0.015
Rumen-sin- 90
0.014 0.014 0.014 0.014 0.014 0.014 0.014 0.014 0.014 0.014 0.014 0.014
1 HQ = high quality forage, 70% brome hay and 30% sorghum silage; EZB = easy bale, corn residue baled by disengaging the spreader on the combine and baling the tailings; CB = conventional rake and bale system
2 Percent modifi ed distillers grains in the supplement3 MDG = modifi ed distillers grains4 DRC = dry rolled corn
Table 2. Eff ects of forage type on cattle performance
Item Forage type1 SEM P- value
HQ EZB CB Forage
Initial BW, lb 620 620 620 1.25 0.98
Ending BW, lb 865a 763b 772b 4.73 <0.01
DMI, lb/d 19.67a 11.46c 12.22b 0.27 <0.01
ADG, lb 2.89a 1.68b 1.79b 0.05 <0.01
F:G2 6.85 6.71 6.76 - 0.921 HQ = high quality forage, 70% brome hay and 30% sorghum silage; EZB = easy bale, corn residue baled by disengaging the
spreader on the combine and baling the tailings; CB = conventional rake and bale system2 Analyzed as G:F, the reciprocal of feed conversion (F:G).a,b,c Means within a row with diff erent superscripts diff er.
Table 3. Proportions of the parts of the corn residue in each type of bailing method.
Item CB1 EZB2
% SD3 % SD
Stem 46.32 1.59 41.90 3.08
Cob 5.29 0.76 13.96 3.28
Husk 9.53 0.58 14.45 1.02
Leaf 38.86 1.00 29.69 1.981EZB = easy bale, corn residue baled by disengaging the spreader on the combine and baling the tailings; 2CB = conventional rake and bale system;3SD = Standard deviation.

2017 Nebraska Beef Cattle Report · 31
olizable protein requirements, suggesting that the response in ADG and F:G is due to energy diff erences between MDG and corn, and not a protein requirement response. Th e 40% inclusion of modifi ed distillers grains resulted in greater performance com-pared to the other levels.
Conclusions
As expected, the high quality forage in-creased steer performance compared to the two corn residue bailing methods. Howev-er, while it was expected that the easy bale treatment would result in improved residue quality, there was no diff erence between the easy bale and conventional rake and bale systems for average daily gain or feed effi -ciency. Additionally, when distillers grains was displaced with dry- rolled corn, cattle performance decreased.
Viviane B. Ferrari, visiting researcher (FAPESP protocol number 2015/17108- 4)Robert G. Bondurant, research technicianGalen Erickson, professorTerry J. Klopfenstein, professorJim C. MacDonald, associate professor Animal Science, Lincoln.
Similarly, the F:G ratio increased linearly (P = 0.03) and DMI (P = 0.09) tended to decrease linearly as MDG inclusion decreased in the diet and corn increased. Th e F:G response to ratio of MDG:corn was not quadratic (P = 0.58) even though F:G was similar at 100:0 and 80:20 ratios and then F:G increased as corn replaced more MDG. When wet distillers grains or dry distillers grains were evaluated at two diff erent inclusions (15 or 30% in the diet) with grass hay and sorghum silage based diets, the highest distillers inclusion improved ending BW, ADG and F:G ratio regardless of the form of distillers grains fed (2011 Nebraska Beef Cattle Report, pp. 20- 21). Another trial (2011 Nebraska Beef Cattle Report, pp. 24- 25) evaluated the performance of growing steers grazing smooth bromegrass supplemented with dry distillers grains at 0.6% of BW per day and supplementation increased ADG by 1.4 lb / d compared to non- supplemented cattle. Th e improved performance of cattle supple-mented distillers grains can be attributed to the energy from fat and rumen undegrad-able protein of the distillers grains (2006 NebraskaBeef Cattle Report, pp. 27- 29). In the current study, steers fed the 40:60 ratio of MDG:corn should have met their metab-
Table 4. Eff ects of MDG level on cattle performance
Item MDG Level1 SEM P- value
100 80 60 40 Linear Quad
Initial BW, lb 620 620 620 620 1.44 0.98 0.99
Ending BW, lb 813 804 799 784 5.46 <0.01 0.58
DMI, lb/d 14.78 14.42 14.71 13.88 0.54 0.09 0.45
ADG, lb 2.27 2.17 2.11 1.93 0.06 <0.01 0.55
F:G2 6.54 6.54 6.90 7.19 - 0.03 0.581 Percent modifi ed distillers grains (MDG) in the supplement.2 Analyzed as G:F, the reciprocal of feed conversion (F:G).

32 · 2017 Nebraska Beef Cattle Report
© Th e Board Regents of the University of Nebraska. All rights reserved.
assigned randomly to treatments aft er being stratifi ed by weight. Steers were allowed continuous access to daily supplement via Calan gates. All steers were implanted with 36 mg of zeranol (Ralgro®) on d 1 of the experiment.
Stocking rate was calculated using estimates of residue amount and grazing effi ciency from previous research (2012 Nebraska Beef Report, pp. 11- 12). Estimated available forage was divided by estimated DMI (10 lb / steer daily) to determine the number of grazing days the fi eld could support.
Ending BW was determined similarly to initial BW. Steers were limit fed a 50% alfalfa and 50% Sweet Bran® diet at 2% of BW for 6 consecutive days and weighed 3 consecutive days thereaft er. Ending BW was calculated by averaging the 3 day weights.
Performance (BW and ADG) data were analyzed using the GLIMMIX procedure of SAS (SAS Institute, Inc., Cary, N.C.) with steer as the experimental unit. Eff ects of Gainpro and RUP source were analyzed for interaction and main eff ects.
Results
Th ere was no interaction between inclusion of bambermycins and pellet type for ending BW or ADG (P ≥ 0.61; Table 1). Similarly, there was no main eff ect of bambermycins inclusion on ending BW or ADG (P ≥ 0.79) when fed at 20 mg / steer daily. Steers receiving bambermycins gained 0.76 lb / d and steers receving no bambermycins gained 0.74 lb / d. Likewise, there was no main eff ect of pellet type on ending BW or ADG (P ≥ 0.57). For steers receiving the pellet with supplemental protein provided by SBM, ADG was 0.78 lb / d while steers fed a pellet with supplemen-tal protein provided from either Soypass or further processed SBM gained 0.76 and 0.72 lb / d, respectively. Metabolizable protein has been shown to increase gains in steers grazing corn residue. Th e lack of a gain response from feeding an increased
compared to supplements providing similar energy levels but lower RUP concentrations (2016 Nebraska Beef Report, pp. 31- 32). Th erefore, the objective of this study was to determine if ADG of steers grazing corn residue could be increased through an increase in rate of bambermycins fed and strategic supplementation of calves with in-creased levels of RUP in a pellet containing alkaline treated stover and soy byproducts.
Procedure
An 84- d corn residue grazing trial was conducted from November 10, 2015 to Feb-ruary 1, 2016 at the University of Nebraska- Lincoln Eastern Nebraska Research and Extension Center near Mead, NE. Sixty crossbred steers (initial BW = 489 lbs; SD = 31) were evaluated in a 2 x 3 factorial design. Th e fi rst factor was inclusion of bambermycins fed at either 0 or 20 mg / steer daily. Bambermycins was included in a common soyhull- based supplement that was formulated to provide supplemental vitamins, minerals, and, depending on treatment, bambermycins and fed at 1 lb DM / d. Th e second factor was amount of RUP provided in the pellet when fed at 4 lb DM / d. Soypass, soybean meal (SBM), or SBM that was further processed by Pellet Technologies to increase the RUP content were included in the pellet at 40% of pellet DM with the remainder consisting of 44.5% corn stover treated with calcium oxide, and 15.5% solubles (provided by Pellet Tech-nology, USA Gretna, Neb.). Th e SBM pellet was formulated to contain 7.5% RUP (as a % of DM) and provide 136 g of RUP. Th e Soypass and further processed SBM pellet were formulated to contain 15.3% RUP (as a % of DM) and provide 278 g of RUP. Crude protein for all 3 pellets was 26%. All cattle were individually supplemented daily with the treatment pellet and supplement. Steers were limit- fed a diet at 2% of BW consisting of 50% alfalfa and 50% Sweet Bran® for 5 days to equalize gut fi ll. Steers were weighed 2 consecutive days and
Cody A. WelchonsRobby G. Bondurant
F. Henry HilscherJim C. MacDonaldGalen E. Erickson
Summary with Implications
Steer calves grazing non- irrigated corn residue were supplemented with a corn residue and by- product pellet that con-tained either Soypass, soybean meal, or processed soybean meal at a rate of 4 lb / d. Additionally, a supplement was fed at 1 lb / d that provided 0 or 20 mg / steer daily of bambermycins (Gainpro®). Th ere was no interaction between bambermycins inclusion and pellet type. Likewise, there was no eff ect of pellet type or bambermycins on ending BW or ADG. In order to maximize gain of calves grazing corn residue it is important to provide a supplement that ensures adequate levels of both energy and rumen undegrade-able protein.
Introduction
Th e crude protein content of corn res-idue is not suffi cient to meet the require-ments of a growing animal, thus necessi-tating supplementation. Previous research (2016 Nebraska Beef Report, pp. 38- 39) evaluated the eff ect of supplementing steers grazing corn residue with bambermycins and a pellet containing distillers grains and alkaline treated corn stover. Increasing supplement as a percent of BW resulted in a linear increase in ADG while supplement-ing bambermycins at a rate of 10 mg / steer daily had no eff ect on ADG. However, ADG of calves supplemented with the pellet was still less than reported ADG of calves sup-plemented with distillers grains at similar levels. Previous research has demonstrated that an increase in RUP fed to growing steers grazing corn residue increases ADG
Rumen Undegradable Protein and Bambermycins Supplementation of Calves Grazing Corn Residue

2017 Nebraska Beef Cattle Report · 33
energy may be benefi cial in a supplemental pellet in order to maximize response to elevated RUP levels.
Cody A. Welchons, graduate studentRobert G. Bondurant, research technicianF. Henry Hilscher, research technicianJim C. MacDonald, associate professorGalen E. Erickson, professor, University of Nebraska— Lincoln Department of Animal Science, Lincoln, Neb
level of RUP was unexpected and would suggest that the protein level available in all 3 pellets was suffi cient for the amount of available energy.
Conclusions
Due to the limited nutrient content of corn residue, a supplement must provide additional protein and energy to optimize performance of growing calves grazing resi-due. Th ese data demonstrate that additional
Table 1. Eff ects of supplementing growing cattle with a corn byproduct pellet containing diff erent protein sources with or without Gainpro.
Gainpro No Gainpro P- Value
Supplement1 SBM PT SP SBM PT SP SEM Int.2 Gainpro Supp.
Initial BW, lb 488 488 489 489 489 490 10.29 0.99 0.94 0.99
Ending BW, lb 553 555 548 554 550 551 10.30 0.90 0.96 0.92
ADG, lb/d 0.77 0.80 0.70 0.78 0.72 0.73 0.06 0.61 0.79 0.57
1 SBM = soybean meal, PT = further processed SBM, SP = soypass2 Supplement type by Gainpro inclusion interaction.

34 · 2017 Nebraska Beef Cattle Report
© Th e Board Regents of the University of Nebraska. All rights reserved.
and limestone at 60 g / steer daily and were implanted with Ralgro® at the beginning of the trial. In all trials, steers were individual-ly supplemented daily via Calan gates. Re-sults for each trial can be seen in Figure 1.
Estimated available forage was divided by estimated DMI (10 lb / steer daily) to determine the number of grazing days the fi eld could support. Data were pooled using the MIXED procedure of SAS (SAS Institute Inc., Cary, N.C.). Calf was the experimental unit and data were blocked by weight within trial and trial was included in the model. A regression equation was calculated using the average calculated ADG of calves in the 3 trials when DGS was supplemented at 0.3, 0.5, 0.7, 0.9, and 1.1% of BW.
Results
A regression line and equation were calculated utilizing the 3 pooled datasets (Figure 2). As rate of DGS supplemention increased, there was a quadratic increase in ADG (P = 0.06). Estimates of ADG for steers fed DGS at 0.3, 0.5, 0.7, 0.9, and 1.1% of BW were 1.07, 1.36, 1.60, 1.80, and 1.94 lb / d, respectively. Th is analysis agrees with previous research in which DDGS was fed at 0.52% of BW to steers grazing corn
Procedure
A pooled analysis was conducted utiliz-ing data from 3 corn residue grazing trials conducted from early November to early February at the University of Nebraska- Lincoln Eastern Nebraska Research and Extension Center near Mead, NE. In all 3 trials, steer calves grazing corn residue were supplemented with distillers grains at diff ering rates. Th e fi rst trial (2006 Nebraska Beef Report, pp. 36– 37) utilized 120 steers (512 lb, ± 37) that were fed dried distillers grains (DDGS) at either 0.29, 0.49, 0.69, 0.88, 1.08, or 1.27% of BW which equated to a range of 1.5 to 6.5 lb of DDGS / steer daily (DM basis). Th e second trial (2014 Nebraska Beef Report, pp. 48– 49) utilized 120 steers (435 lb, ± 16) fed either modifi ed distillers grains (MDGS) or DDGS at 0.3, 0.7, or 1.1% of BW (1.4 to 5.4 lb / steer daily on a DM basis). Th ere were no diff erences in ADG due to distillers type (P =0.51), therefore gains were pooled together for this analysis. Th e third trial (2015 Nebraska Beef Report, pp. 25– 26) utilized 60 steers (519 lb, ± 11) fed DDGS at 0.3, 0.5, 0.7, 0.9, or 1.1% of BW (1.7 to 6.8 lb / steer daily on a DM basis). Steers in the second and third trial received monensin at 200 mg / steer
Cody A. WelchonsJim C. MacDonald
Summary with Implications
A pooled analysis combined data from three trials in which steer calves grazing corn residue were supplemented with distillers grains at varying amounts as a percent of BW. A regression equation was calculated in order to provide an accurate estimate of gain for calves fed distillers grains at various rates. Steers supplemented with distillers grains in a range from 0.3 to 1.1% of BW (1.5 to 6.5 lb / steer daily) had estimated gains that ranged from 1.07 to 1.94 lb / d. Th is prediction equa-tion provides an estimate of gain for calves supplemented with distillers grains at various rates while grazing corn residue under nor-mal environmental conditions.
Introduction
Corn residue is a relatively inexpensive, grazable forage source in many parts of Nebraska. However, due to its low levels of protein and energy, it is necessary to provide a supplemental nutrient source for growing calves to meet their growth requirements (2016 Nebraska Beef Report, pp. 31– 32). Distillers grains plus solubles (DGS) fi ts well as a supplement for calves grazing corn residue, as it is high in both protein (~30% CP) and energy (108% TDN). An estimate of calf ADG, relative to amount of DGS fed, is important to have so that producers can achieve a desired level of gain. Th e objective of this analysis was to combine ADG data from previous trials into a pooled analysis that would provide an equation from which ADG could be esti-mated depending on rate of DGS supple-mentation (as a percent of BW).
Pooled Gain Analysis of Steers Grazing Corn Residue and Supplemented with Distillers Grains
Gustad et. al., 2006
Jones et. al., 2014
Jones et. al., 2015
Aver
age D
aily
Gai
n, lb
/d
Level of DGS, % of BW
2.50
2.00
1.50
1.00
0.50
0.000 0.2 0.4 0.6 0.8 1 1.2
Figure 1. Eff ect of level of DGS supplement on ADG of steers across trials
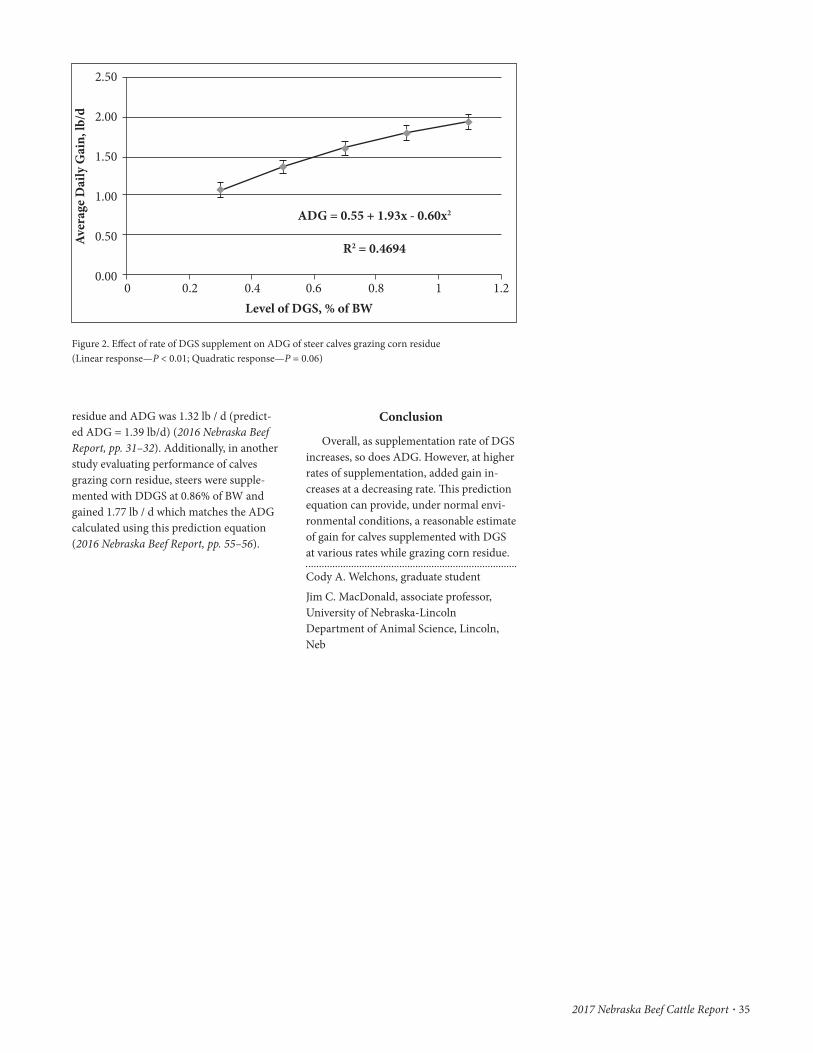
2017 Nebraska Beef Cattle Report · 35
Conclusion
Overall, as supplementation rate of DGS increases, so does ADG. However, at higher rates of supplementation, added gain in-creases at a decreasing rate. Th is prediction equation can provide, under normal envi-ronmental conditions, a reasonable estimate of gain for calves supplemented with DGS at various rates while grazing corn residue.
Cody A. Welchons, graduate studentJim C. MacDonald, associate professor, University of Nebraska- Lincoln Department of Animal Science, Lincoln, Neb
residue and ADG was 1.32 lb / d (predict-ed ADG = 1.39 lb/d) (2016 Nebraska Beef Report, pp. 31– 32). Additionally, in another study evaluating performance of calves grazing corn residue, steers were supple-mented with DDGS at 0.86% of BW and gained 1.77 lb / d which matches the ADG calculated using this prediction equation (2016 Nebraska Beef Report, pp. 55– 56).
2.50
2.00
1.50
1.00
0.50
0.000 0.2 0.4 0.6 0.8 1 1.2
ADG = 0.55 + 1.93x - 0.60x2
R2 = 0.4694
Level of DGS, % of BW
Aver
age D
aily
Gai
n, lb
/d
Figure 2. Eff ect of rate of DGS supplement on ADG of steer calves grazing corn residue (Linear response— P < 0.01; Quadratic response— P = 0.06)
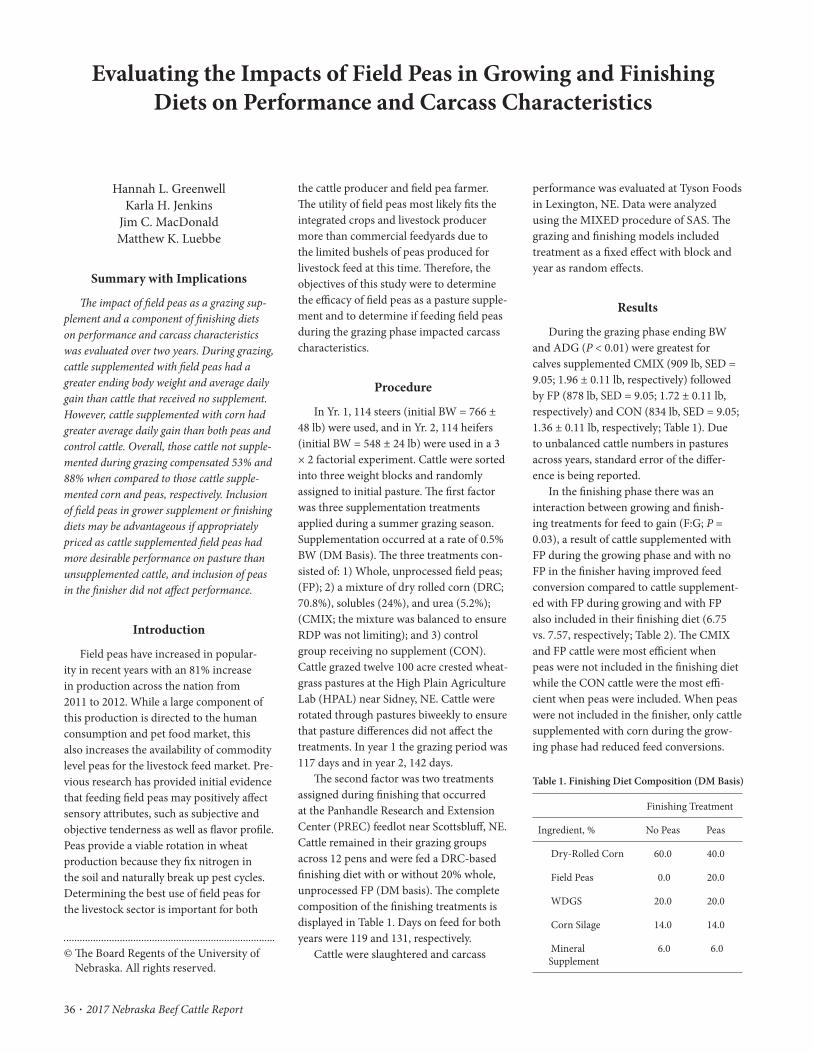
36 · 2017 Nebraska Beef Cattle Report
© Th e Board Regents of the University of Nebraska. All rights reserved.
performance was evaluated at Tyson Foods in Lexington, NE. Data were analyzed using the MIXED procedure of SAS. Th e grazing and fi nishing models included treatment as a fi xed eff ect with block and year as random eff ects.
Results
During the grazing phase ending BW and ADG (P < 0.01) were greatest for calves supplemented CMIX (909 lb, SED = 9.05; 1.96 ± 0.11 lb, respectively) followed by FP (878 lb, SED = 9.05; 1.72 ± 0.11 lb, respectively) and CON (834 lb, SED = 9.05; 1.36 ± 0.11 lb, respectively; Table 1). Due to unbalanced cattle numbers in pastures across years, standard error of the diff er-ence is being reported.
In the fi nishing phase there was an interaction between growing and fi nish-ing treatments for feed to gain (F:G; P = 0.03), a result of cattle supplemented with FP during the growing phase and with no FP in the fi nisher having improved feed conversion compared to cattle supplement-ed with FP during growing and with FP also included in their fi nishing diet (6.75 vs. 7.57, respectively; Table 2). Th e CMIX and FP cattle were most effi cient when peas were not included in the fi nishing diet while the CON cattle were the most effi -cient when peas were included. When peas were not included in the fi nisher, only cattle supplemented with corn during the grow-ing phase had reduced feed conversions.
the cattle producer and fi eld pea farmer. Th e utility of fi eld peas most likely fi ts the integrated crops and livestock producer more than commercial feedyards due to the limited bushels of peas produced for livestock feed at this time. Th erefore, the objectives of this study were to determine the effi cacy of fi eld peas as a pasture supple-ment and to determine if feeding fi eld peas during the grazing phase impacted carcass characteristics.
Procedure
In Yr. 1, 114 steers (initial BW = 766 ± 48 lb) were used, and in Yr. 2, 114 heifers (initial BW = 548 ± 24 lb) were used in a 3 × 2 factorial experiment. Cattle were sorted into three weight blocks and randomly assigned to initial pasture. Th e fi rst factor was three supplementation treatments applied during a summer grazing season. Supplementation occurred at a rate of 0.5% BW (DM Basis). Th e three treatments con-sisted of: 1) Whole, unprocessed fi eld peas; (FP); 2) a mixture of dry rolled corn (DRC; 70.8%), solubles (24%), and urea (5.2%); (CMIX; the mixture was balanced to ensure RDP was not limiting); and 3) control group receiving no supplement (CON). Cattle grazed twelve 100 acre crested wheat-grass pastures at the High Plain Agriculture Lab (HPAL) near Sidney, NE. Cattle were rotated through pastures biweekly to ensure that pasture diff erences did not aff ect the treatments. In year 1 the grazing period was 117 days and in year 2, 142 days.
Th e second factor was two treatments assigned during fi nishing that occurred at the Panhandle Research and Extension Center (PREC) feedlot near Scottsbluff , NE. Cattle remained in their grazing groups across 12 pens and were fed a DRC- based fi nishing diet with or without 20% whole, unprocessed FP (DM basis). Th e complete composition of the fi nishing treatments is displayed in Table 1. Days on feed for both years were 119 and 131, respectively.
Cattle were slaughtered and carcass
Hannah L. GreenwellKarla H. Jenkins
Jim C. MacDonaldMatthew K. Luebbe
Summary with Implications
Th e impact of fi eld peas as a grazing sup-plement and a component of fi nishing diets on performance and carcass characteristics was evaluated over two years. During grazing, cattle supplemented with fi eld peas had a greater ending body weight and average daily gain than cattle that received no supplement. However, cattle supplemented with corn had greater average daily gain than both peas and control cattle. Overall, those cattle not supple-mented during grazing compensated 53% and 88% when compared to those cattle supple-mented corn and peas, respectively. Inclusion of fi eld peas in grower supplement or fi nishing diets may be advantageous if appropriately priced as cattle supplemented fi eld peas had more desirable performance on pasture than unsupplemented cattle, and inclusion of peas in the fi nisher did not aff ect performance.
Introduction
Field peas have increased in popular-ity in recent years with an 81% increase in production across the nation from 2011 to 2012. While a large component of this production is directed to the human consumption and pet food market, this also increases the availability of commodity level peas for the livestock feed market. Pre-vious research has provided initial evidence that feeding fi eld peas may positively aff ect sensory attributes, such as subjective and objective tenderness as well as fl avor profi le. Peas provide a viable rotation in wheat production because they fi x nitrogen in the soil and naturally break up pest cycles. Determining the best use of fi eld peas for the livestock sector is important for both
Evaluating the Impacts of Field Peas in Growing and Finishing Diets on Performance and Carcass Characteristics
Table 1. Finishing Diet Composition (DM Basis)
Finishing Treatment
Ingredient, % No Peas Peas
Dry- Rolled Corn 60.0 40.0
Field Peas 0.0 20.0
WDGS 20.0 20.0
Corn Silage 14.0 14.0
Mineral Supplement
6.0 6.0
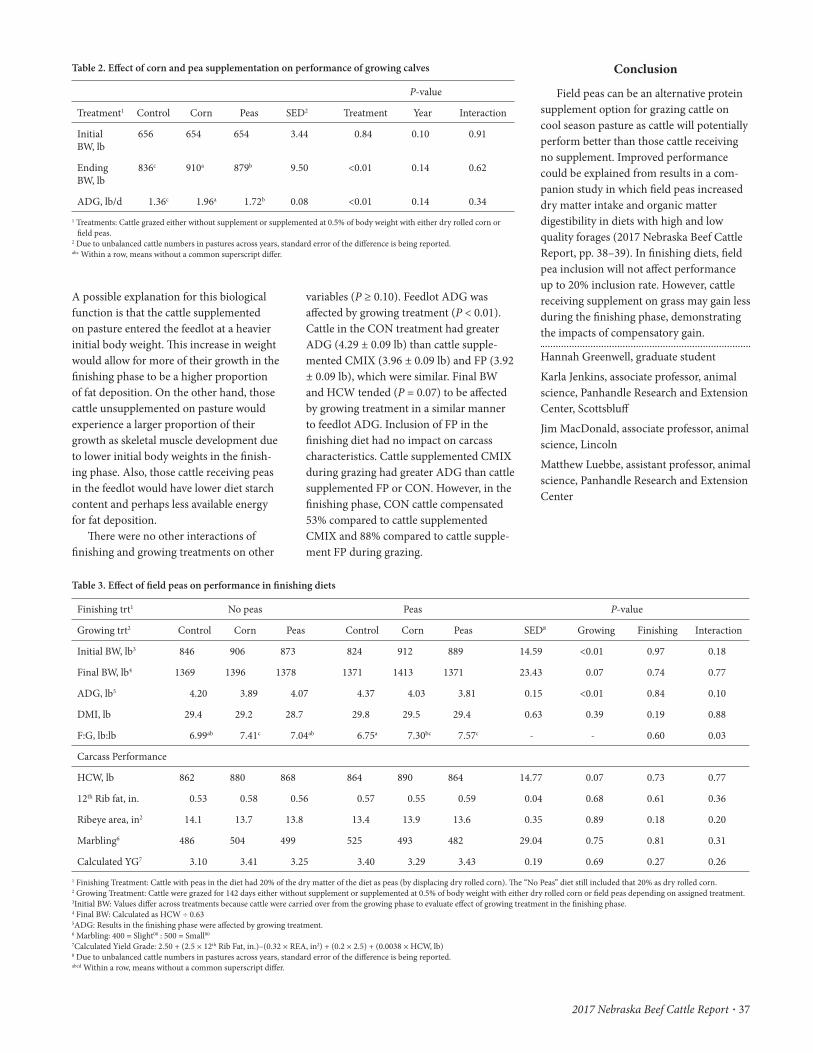
2017 Nebraska Beef Cattle Report · 37
Conclusion
Field peas can be an alternative protein supplement option for grazing cattle on cool season pasture as cattle will potentially perform better than those cattle receiving no supplement. Improved performance could be explained from results in a com-panion study in which fi eld peas increased dry matter intake and organic matter digestibility in diets with high and low quality forages (2017 Nebraska Beef Cattle Report, pp. 38–39). In fi nishing diets, fi eld pea inclusion will not aff ect performance up to 20% inclusion rate. However, cattle receiving supplement on grass may gain less during the fi nishing phase, demonstrating the impacts of compensatory gain.
Hannah Greenwell, graduate studentKarla Jenkins, associate professor, animal science, Panhandle Research and Extension Center, Scottsbluff Jim MacDonald, associate professor, animal science, LincolnMatthew Luebbe, assistant professor, animal science, Panhandle Research and Extension Center
variables (P ≥ 0.10). Feedlot ADG was aff ected by growing treatment (P < 0.01). Cattle in the CON treatment had greater ADG (4.29 ± 0.09 lb) than cattle supple-mented CMIX (3.96 ± 0.09 lb) and FP (3.92 ± 0.09 lb), which were similar. Final BW and HCW tended (P = 0.07) to be aff ected by growing treatment in a similar manner to feedlot ADG. Inclusion of FP in the fi nishing diet had no impact on carcass characteristics. Cattle supplemented CMIX during grazing had greater ADG than cattle supplemented FP or CON. However, in the fi nishing phase, CON cattle compensated 53% compared to cattle supplemented CMIX and 88% compared to cattle supple-ment FP during grazing.
A possible explanation for this biological function is that the cattle supplemented on pasture entered the feedlot at a heavier initial body weight. Th is increase in weight would allow for more of their growth in the fi nishing phase to be a higher proportion of fat deposition. On the other hand, those cattle unsupplemented on pasture would experience a larger proportion of their growth as skeletal muscle development due to lower initial body weights in the fi nish-ing phase. Also, those cattle receiving peas in the feedlot would have lower diet starch content and perhaps less available energy for fat deposition.
Th ere were no other interactions of fi nishing and growing treatments on other
Table 2. Eff ect of corn and pea supplementation on performance of growing calves
P- value
Treatment1 Control Corn Peas SED2 Treatment Year Interaction
Initial BW, lb
656 654 654 3.44 0.84 0.10 0.91
Ending BW, lb
836c 910a 879b 9.50 <0.01 0.14 0.62
ADG, lb/d 1.36c 1.96a 1.72b 0.08 <0.01 0.14 0.341 Treatments: Cattle grazed either without supplement or supplemented at 0.5% of body weight with either dry rolled corn or
fi eld peas.2 Due to unbalanced cattle numbers in pastures across years, standard error of the diff erence is being reported.abc Within a row, means without a common superscript diff er.
Table 3. Eff ect of fi eld peas on performance in fi nishing diets
Finishing trt1 No peas Peas P- value
Growing trt2 Control Corn Peas Control Corn Peas SED8 Growing Finishing Interaction
Initial BW, lb3 846 906 873 824 912 889 14.59 <0.01 0.97 0.18
Final BW, lb4 1369 1396 1378 1371 1413 1371 23.43 0.07 0.74 0.77
ADG, lb5 4.20 3.89 4.07 4.37 4.03 3.81 0.15 <0.01 0.84 0.10
DMI, lb 29.4 29.2 28.7 29.8 29.5 29.4 0.63 0.39 0.19 0.88
F:G, lb:lb 6.99ab 7.41c 7.04ab 6.75a 7.30bc 7.57c - - 0.60 0.03
Carcass Performance
HCW, lb 862 880 868 864 890 864 14.77 0.07 0.73 0.77
12th Rib fat, in. 0.53 0.58 0.56 0.57 0.55 0.59 0.04 0.68 0.61 0.36
Ribeye area, in2 14.1 13.7 13.8 13.4 13.9 13.6 0.35 0.89 0.18 0.20
Marbling6 486 504 499 525 493 482 29.04 0.75 0.81 0.31
Calculated YG7 3.10 3.41 3.25 3.40 3.29 3.43 0.19 0.69 0.27 0.261 Finishing Treatment: Cattle with peas in the diet had 20% of the dry matter of the diet as peas (by displacing dry rolled corn). Th e “No Peas” diet still included that 20% as dry rolled corn.2 Growing Treatment: Cattle were grazed for 142 days either without supplement or supplemented at 0.5% of body weight with either dry rolled corn or fi eld peas depending on assigned treatment.3Initial BW: Values diff er across treatments because cattle were carried over from the growing phase to evaluate eff ect of growing treatment in the fi nishing phase.4 Final BW: Calculated as HCW ÷ 0.635ADG: Results in the fi nishing phase were aff ected by growing treatment.6 Marbling: 400 = Slight00 : 500 = Small00
7Calculated Yield Grade: 2.50 + (2.5 × 12th Rib Fat, in.)– (0.32 × REA, in2) + (0.2 × 2.5) + (0.0038 × HCW, lb)8 Due to unbalanced cattle numbers in pastures across years, standard error of the diff erence is being reported.abcd Within a row, means without a common superscript diff er.
38 · 2017 Nebraska Beef Cattle Report
© Th e Board Regents of the University of Nebraska. All rights reserved.
1600 hours. During collection, rumen fl uid samples and fecal grab samples were taken at four time points including 0700, 1100, 1500, and 1900 hours.
Hourly fecal samples were composited by day by steer on a wet basis, freeze dried, and ground. Daily composites were ground and composited on a week basis by steer and analyzed for NDF, ADF, OM, and percent titanium. Feed ingredients samples were taken each period, dried, ground, and analyzed for NDF, ADF, OM, and CP.
In an eff ort to analyze supplement eff ect on fi ber digestibility, in- situ bag proce-dures were used. Both HQ and LQ were weighed into the bags that were then sealed and incubated in the rumen for 24 hours. Bags were removed, rinsed, washed with NDF solution in an Ankom Fiber Analyz-er, dried, and weighed back to determine remaining NDF aft er incubation.
All data were analyzed using the MIXED procedure of SAS and probabilities were considered signifi cant if P ≤ 0.10. Steer was the experimental unit with supplement type, forage type and their interaction as fi xed eff ects. Steer and collection period were random eff ects.
Results
Digestibility
Th ere were no interactions between forage quality and supplement type on digestibility. Dry matter intake (DMI), forage DMI, DM digestibility (DMD), OM intake (OMI), OM digestibility (OMD), and 24 hour in- situ NDF digestibility (NDFD) were greater with HQ forage than in LQ forage (Table 1). Th e FP supplement increased DMI, DMD, OMI, OMD, and NDFD compared to steers receiving DRC or CON; DRC and CON did not diff er in intake, DMD, OMI or OMD. Forage DMI tended to be least for DRC while FP tended to increase forage DMI, but was similar to CON (Table 2). Th e in- situ 24 hour NDFD is an indicator of the associative eff ects on fi ber digestion that might occur when
favoring propionate. Th e impacts of fi eld pea supplementation on volatile fatty acid (VFA) concentration are not well estab-lished. Th erefore, one objective of this study was to determine how fi eld pea supplemen-tation alters VFA concentrations and diet digestibility relative to corn when supple-mented to high and low quality forages.
Procedure
Five ruminally fi stulated steers (Initial BW = 444 ± 44 lb) were utilized in a 5 × 6 Latin rectangle metabolism study to evalu-ate the eff ects of supplementation on total tract digestibility of diets containing either high or low quality forages. Treatments were set up as a 2 × 3 factorial (forage quality × supplement type). Th e fi rst factor was high quality forage (HQ; 50% alfalfa, 50% sorghum silage, DM basis) or low quality forage (LQ; 50% brome grass hay, 50% wheat straw, DM basis). Th e second factor was one of three supplements: Un-supplemented control (CON), Dry- rolled Corn (DRC), or Ground Field Peas (FP). Th ose steers being supplemented DRC were dosed with a urea solution to ensure that they were not defi cient in rumen degradable protein in comparison to those being supplemented with FP. Both FP and DRC supplements were coated in molasses to increase palatability. Forage was off ered ad libitum through the entire study and steers were supplemented at 0.43% of BW (DM basis). Th e non- supplemented cattle on the LQ forage received an adequate supply of RDP in their diet. Steers were weighed at the beginning of each period to adjust supplement amount accordingly. Supplement was fed at 0800 hours, steers were given two hours to consume supple-ment. Any supplement not consumed was inserted into the rumen cannula. Forage was then fed at 1000 hours. Periods lasted 14 days with a 9 day adaptation period and 4 day collection period. Animals were housed in individual slatted fl oor stalls. Steers were ruminally dosed continuously with 5 g of TiO2 twice daily at 0800 and
Hannah L. GreenwellJana L. Gramkow
Melissa L. Jolly- BreithauptJim C. MacDonald
Karla H. Jenkins
Summary with Implications
Five ruminally cannulated steers were used to evaluate the eff ects of supplementa-tion (no supplement, fi eld peas, or dry rolled corn; 0.43% BW) with high and low quality forages on diet digestibility and rumen vola-tile fatty acid concentrations. Th e inclusion of fi eld peas increased dry matter intake and organic matter digestibility over dry rolled corn and unsupplemented steers. Propionate proportions were less for fi eld peas and con-trol treatments than dry rolled corn, while acetate proportions increased in fi eld peas, and control treatments as compared to dry rolled corn. As a result, acetate to propionate ratio was reduced when dry rolled corn was supplemented. Inclusion of fi eld peas alters the volatile fatty acid concentrations, increas-es dry matter intake, and improves organic matter digestibility when supplemented to forage fed steers.
Introduction
With recent increases in availability of fi eld peas as a livestock feed, a renewed interest has developed in their use in beef production. More in- depth determination of digestion kinetics would improve the prediction of the value of fi eld peas as both a grazing supplement and a component in fi nishing diets. Previous research has shown that feeding fi eld peas in beef cattle diets up to 30% of the diet (DM basis) produces similar results to starch grains, such as corn. Corn has a negative impact on the digestion of fi ber due to the starch content. However, corn supplementation also alters the proportion of acetate to propionate
Eff ects of Field Pea Supplementation on Digestibility and Rumen Volatile Fatty Acid Concentration of Diets Containing
High and Low Quality Forages

2017 Nebraska Beef Cattle Report · 39
proportions were greatest in the DRC sup-plemented cattle with CON and FP being similar. Th e A:P ratio was decreased by all supplement types with DRC and FP being similar (Table 2).
Conclusion
Supplementing FP in forage diets of both low and high quality increased DMI, DMD, OMI, OMD, and 24 hour NDFD. Th ese alterations from the CON and DRC could be associated with the lower starch level of FP as compared to DRC. VFA concentrations with fi eld pea supplementa-tion remain similar to the DRC treatment as opposed to having similar results to the CON treatments. Field peas did not appear to have the same negative associative eff ects on digestibility as DRC, but also did not produce VFA concentrations similar to DRC. Th e changes in VFA concentrations for FP could potentially be explained due to the shift s in microbial populations toward starch digesting bacteria which favors the production of propionate.
Hannah Greenwell, graduate studentJana Gramkow, graduate studentMelissa Jolly- Breithaupt, graduate studentKarla Jenkins, associate professor, animal science, Panhandle Research and Extension Center, Scottsbluff Jim MacDonald, associate professor, animal science, Lincoln
with the acetate to propionate ratio (A:P). Acetate relative proportions increased in the LQ while propionate relative proportions increased in the HQ. Th e changes in relative proportions shift ed the A:P in favor of the propionate and produced lower values in the HQ diets than the LQ diets (Table 1).
Acetate and propionate proportions, as well as the A:P ratio were aff ected by supplement type. Acetate proportions were greatest in the CON and FP, which were similar and greater than DRC. Propionate
other feedstuff s are added to the diet such as supplements. While the level of supple-mentation was low (0.43% BW), there was still a diff erence in forage NDF digestibility between the DRC and FP supplements, with FP having greater fi ber digestibility over the DRC supplemented cattle.
Rumen VFA Concentrations
Forage quality of the diet altered acetate and propionate relative proportions along
Table 1. Diet digestibility and concentration of rumen VFA’s in steers due to forage quality
Forage Trt1 High Quality Low Quality SEM P- value
DMI (lb) 13.50 10.37 1.07 <0.01
Forage DMI (lb) 12.13 9.00 1.07 <0.01
DMD (%) 63.09 49.09 1.65 <0.01
OMI (lb) 12.24 9.24 0.95 <0.01
OMD (%) 64.18 50.10 1.61 <0.01
NDFI (lb) 7.06 7.00 7.06 0.82
In- situ NDFD2 (%) 38.59 33.81 0.85 <0.01
Total, mMol 124.49 126.81 9.39 0.86
Acetate, % 64.1 72.26 0.58 <0.01
Propionate, % 18.48 17.89 0.22 0.06
A:P 3.61 4.09 0.05 <0.01abcd Within a row, means without a common superscript diff er.1High Quality Forage Diet: 50/50 blend of sorghum silage and alfalfa hay. Low Quality Forage Diet: 50/50 blend of brome grass
hay and wheat straw. Water was added to the Low Quality treatment to ensure equal amount of dry matter across both forage treatments.
2NDF digestibility: measured at 24 hours, in- situ.
Table 2. Diet digestibility of steers due to supplement type
Supplement Trt1 Control Corn Peas SEM P- value
DMI (lb) 10.56a 11.72a 13.50b 1.07 0.01
Forage DMI (lb) 10.57 9.67 11.45 1.12 0.14
DMD (%) 53.05a 55.13a 60.10b 2.01 0.06
OMI (lb) 9.42a 10.60a 12.20b 1.00 <0.01
OMD (%) 53.81a 56.07a 61.54b 1.61 0.03
NDFI (lb) 6.81 6.59 7.62 0.68 0.14
In- situ NDFD2 (%) 36.09ab 34.48a 38.03b 1.06 0.09
Total, mMol 128.56 120.12 128.27 11.55 0.84
Acetate, % 68.82b 66.39a 69.38b 0.72 <0.01
Propionate, % 17.96a 18.93b 17.72a 0.27 <0.01
A:P 3.97b 3.58a 3.99b 0.05 <0.01abcd Within a row, means without a common superscript diff er.1Control received no supplement. Corn received dry rolled corn coated in molasses. Peas received ground peas coated in
molasses.2NDF digestibility: measured at 24 hours, in- situ.
40 · 2017 Nebraska Beef Cattle Report
© Th e Board Regents of the University of Nebraska. All rights reserved.
the drylot (DGR). Each treatment had 4 replicates. On November 20, 2014, calves were sorted to their assigned group and were started on their treatment.
Calves in the DGR treatment were placed in 4 feedlot pens with 30 calves per pen. Th ey were backgrounded on the grower ration (Table 1) for 54 d. Weight at the start for fi nishing was targeted to be 800 lb for all treatments. Th us an intermediate weight of DGR calves was taken prior to feeding on d 25 and used to calculate ADG to predict when the target weight of 800 lbs would be achieved.
Calves on CRD were placed in an irrigated corn fi eld that was divided into 4 quarters with 31 acres and 30 calves per quarter. Th e corn yield from this fi eld aver-aged 225 bu/ac. Calves were supplemented 6 d a week with 6.1 lb DM/steer/d of dried distillers grains mixed with limestone at 2% on DM basis. Calves on OBF were placed in an irrigated fi eld planted aft er corn silage. Th e forage in the double- cropped fi eld consisted of 55% oats, 15% radish, and 30% purple top turnips (DM basis). Th is fi eld was divided into 4, 31- acre quarters. Each quarter was stocked at a rate of 3,617 ± 21 lb DM/steer and there were 25, 30, 30, and 30 calves per quarter. Double- cropped for-age samples were taken on Nov. 6, Dec. 9, and Jan. 13, with the average nutritive value being 22.9% CP and 67.4% TDN [calcu-
understand how backgrounding systems aff ect subsequent fi nishing performance and carcass characteristics. Research has suggested greater rates of gain during the backgrounding phase typically reduce fi n-ishing ADG. However, data regarding sub-sequent fi nishing performance and carcass characteristics of short yearlings grazing fall double- cropped forages, such as late summer planted oats and brassicas (turnips and radishes) are not available. Th erefore, the objective of this study was to evaluate the subsequent fi nishing performance and carcass characteristics of backgrounding spring born calves by 1) grazing corn residue and feeding a distillers grains based supplement at 0.86% BW/d, 2) grazing an oats, turnip, radish mix double- crop plant-ed aft er corn silage harvest, or 3) drylotting calves on a corn silage based grower ration.
Procedure
Th is experiment was conducted at the Meat Animal Research Center near Clay Center, Neb., utilizing 355 spring- born, MARC II composite steer calves. Calves receiving a grower ration were stratifi ed by BW (610 ± 61 lb) and genetic line, and then assigned to 1 of 3 treatments: 1) corn residue grazing with distillers supplementa-tion (CRD), 2) oat- brassica forage grazing (OBF) or 3) consuming a grower ration in
Jordan L. CoxKristin E. Hales
Kristen M. UlmerRick J. Rasby
Steven D. ShacklefordChad Engle
John RieckmanHarvey C. Freetly
Mary E. Drewnoski
Summary with Implications
Th e impact of 3 backgrounding systems: grazing corn residue with distillers grains supplementation at 0.86% BW/d, grazing an oats- brassica forage, or feeding a grower ra-tion in a drylot on fi nishing performance and carcass characteristics were evaluated. Back-grounding phase gains were greatest for steers fed a grower ration in the drylot (3.58 lb/d), intermediate for steers grazing oats- brassica forage and then fed the grower ration for short period (2.65 lb/d), and least for steers grazing corn residue while supplemented distillers grains and then fed the grower ration for short period (2.22 lb/d). Th ese back-grounding treatment diff erences did not aff ect ADG during the fi nishing period (3.73 lb/d). However, the 2 grazing treatments had greater DMI resulting in poorer F:G. Overall, these backgrounding systems did not aff ect carcass quality. Increased fi nishing phase cost for the 2 grazing treatments due to poorer F:G, can be off set by less input cost during background-ing, but ultimately the cost eff ectiveness is dependent on the production resources and scenarios of each individual producer.
Introduction
In Nebraska there is signifi cant oppor-tunity to background spring born calves in the winter using forages produced from crop acres, including crop residues and double- cropped annual forages (cov-er crops). Th erefore it is important to
Eff ect of Backgrounding System on Steer Performance and Carcass Characteristics
Table 1. Composition of grower and fi nishing ration
Ingredient Grower RationDM basis, %
Finishing RationDM basis, %
Dry Rolled Corn — 55.8
Corn Silage 51.0 8.7
Alfalfa Hay 25.0 —
WDGS1 20.0 32.3
Supplement2 4.0 3.2
Analyzed composition
NEm, Mcal/lb 0.75 2.15
NEg, Mcal/lb 0.47 1.481Wet distillers grains plus solubles.2Supplement provided Rumensin at 28 g/ton of diet DM.

2017 Nebraska Beef Cattle Report · 41
and corn residue cost ($0.20/hd/d) for CRD calves, seed plus seeding costs ($38.90/ac or $41.58/hd), and N fertilizer ($27.36/ac or $29.25/hd) for OBF calves as well as costs of the grower ration ($114/ton DM) for all treatments. During the backgrounding period CRD and OBF calves were charged $0.10/d for yardage (fence and water maintenance) and CRD calves were charged an additional $0.10/d for the extra labor to feed their supplement. Th e yardage cost for feed calves in the feedlot was charged at $0.40/d. Th e fi nishing ration was $140.72/ton DM for all treatments.
Results
Finishing Performance
Body weight at the start of the fi nishing phase was greatest (P < 0.01) for steers grazing oats- brassica forage (840 lb) due to greater gains in the backgrounding phase than CRD calves and more days in the growing phase than DGR calves (Table 2). Body weight at the start of fi nishing was not diff erent (P = 0.92) between DGR and CRD (805 lb). Th ere was no diff erence in carcass adjusted ADG among the 3 treatments during fi nishing, resulting in the initial fi nishing BW ranking to be maintained throughout fi nishing. Dry matter intake did not diff er (P = 0.40) between OBF (22.7 lb/d) and CRD (22.3 lb/d) calves, but were greater (P = 0.02) than calves placed direct-ly in the drylot (20.9 lb/d). With the ADG similar among treatments, this 1.6 lb/d diff erence in DMI caused the calves in the grazing treatments (OBF and CRD) to have poorer (P < 0.01) F:G than DGR steers.
Carcass Characteristics
Calves on OBF had greater (P = 0.01) HCW (886 lb) than DGR (862 lb) and CRD (858 lb), which were similar (P = 0.51) (Table 3). Th is is due to the OBF steers having 30 lb more BW when enter-ing the fi nishing phase.
Twelft h rib fat was not diff erent (P = 0.62) among the treatments, with an aver-age 12th rib fat of 0.60 inch. Marbling score tended (P = 0.06) to diff er among treat-ments, with DGR (423) and OBF (419) not diff ering (P = 0.59), but DGR being greater (P = 0.02) than CRD (402) while OBF tended (P = 0.06) to be greater than CRD.
(2016 Nebraska Beef Cattle Report, pp. 55– 57). Backgrounding gains were greatest for DGR at 3.58 lb/d, intermediate for OBF at 2.65 lb/d (grazing plus grower ration), and least for CRD at 2.22 lb/d (grazing plus grower ration).
All calves were implanted with Revalor®- XS (Merck Animal Health) at the start of fi nishing and fed a common fi nishing diet (Table 1) for 160 d. Final weights were taken prior to feeding the morning before steers were hauled to the packing plant. Steers were not limit fed due to all calves consuming the same fi nishing ration for an adequate amount of time that gut fi ll stasis should have been met. Hot carcass weight, 12th rib back fat, LM area, marbling score, yield grade, and quality grade data was collected when calves were harvested.
A partial budget analysis was conducted to evaluate the costs of each backgrounding system. Th e feed cost in the budget includ-ed: distillers supplementation ($129/ton),
lated using the equation: TDN = 98.625- (ADF%*1.048)]. Th e CRD and OBF calves were removed from grazing aft er 64 d when the OBF biomass was thought to be limiting intake (1,287 ± 93 lb DM/ac; about 3 inches of growth remaining) and moved to the feedlot. Calves were maintained in their previous groups when placed into feedlot pens. Calves were weighed at entry to the feedlot, fed the grower ration for 6 days and prior to feeding on the 7th day weighed again. To allow the CRD and OBF calves to reach the 800 lb target BW before starting the fi nishing diet, CRD and OBF calves were fed the grower ration (Table 1) an additional 14 d (d 86 of trial) and a single weight was taken prior to feeding and then calves were transitioned to a fi nishing diet.
All treatments were provided Rumensin either by a free choice mineral for the two grazing treatments or a supplement in the grower ration. Performance during the background phase was reported previously
Table 2. Finishing performance of calves backgrounded by grazing corn residue and supplemented with dry distillers grains at 0.86% of BW (CRD), grazing a fall oats and brassica forage (OBF), or fed a grower ration in drylot (DGR).
CRD OBF DGR SEM4 P- value
Finishing Period1
Starting BW, lb 805b 840a 805b 5.3 <0.01
Final Live BW2, lb 1338b 1376a 1349ab 9.3 0.05
Final BW3, lb 1358b 1404a 1367b 9.3 0.01
DMI, lb/d 22.3a 22.7a 20.9b 0.35 0.02
ADG3, lb 3.47 3.54 3.53 0.062 0.68
F:G3 6.45a 6.41a 5.99b 0.055 <0.01a,b,cMeans within a row lacking a common superscript diff er.1All treatments were in the fi nishing phase for 160 d.2Final live BW taken prior to feeding the morning before hauling to the packing plant, with a calculated 4% shrink.3Carcass adjusted Final BW, ADG, and F:G using a common dressing percent of 63%.4Standard error of the least squares mean.
Table 3. Carcass characteristics of calves backgrounded by grazing corn residue and supplemented with dry distillers grains at 0.86% of BW (CRD), grazing a fall oats and brassica forage (OBF), or fed a grower ration in drylot (DGR).
CRD OBF DGR SEM2 P- value
HCW, lb 858b 886a 862b 6.0 0.01
12th rib fat, in 0.58 0.61 0.61 0.019 0.62
LM area, in2 13.2 13.2 12.8 0.11 0.06
Calculated YG 3.29b 3.48a 3.49a 0.047 0.02
Marbling 402 419 423 5.6 0.06
% Choice 44 59 56 4.1 0.06abMeans lacking common letters are diff erent1Marbling Score: 400 = Slight00, 450 = Slight50, 500 = Small00
2 Standard error of the least squares mean.

42 · 2017 Nebraska Beef Cattle Report
ing treatments had a greater (P < 0.01) cost of gain (OBF: $0.57/lb and CRD: $0.57/lb) than DGR ($0.54/lb). Th is diff erence is due to the greater DMI of grazing treatments and lack of diff erence in ADG during the fi nishing period. Th e overall cost of gain from weaning to slaughter was greatest (P < 0.01) for OBF steers ($0.54/lb) followed by CRD ($0.51/lb) and DGR ($0.50/lb), which were not diff erent (P = 0.25). Th e lower cost of gain during the growing period for CRD calves did help off set the increased fi nishing cost due to DMI during the fi nishing period. Opportunity for reduced total cost of gains could have been achieved for the CRD steers if the winter grazing period had of been extended.
Conclusions
Utilizing corn residue with distiller supplementation or oats- brassica forages during the winter for backgrounding calves will not signifi cantly impact gains or carcass characteristics during the subsequent fi nishing phase. However, increased DMI during the fi nishing phase could increase fi nishing input cost for the 2 grazing treat-ments over calves fed a corn silage- based ration during the backgrounding period. Th ese increased fi nishing phase costs were off set by the lower growing cost of the calves grazing corn residue in this study. Ultimately, the cost eff ectiveness depends on the production resources and scenarios of each individual producer.
Jordan L. Cox, graduate student, Animal Science, LincolnKristin K. Hales, Scientists Meat Animal Research Center, Clay Center, NEKristen M. Ulmer, graduate student, Animal Science, LincolnRick J. Rasby, professor, Animal Science, LincolnSteven D. Shackleford, Scientists Meat Animal Research Center, Clay Center, NEChad Engle, Meat Animal Research Center, Clay Center, NEJohn Rieckman, Meat Animal Research Center, Clay Center, NEHarvey C. Freetly, Scientists Meat Animal Research Center, Clay Center, NEMary E. Drewnoski, assistant professor, Animal Science, Lincoln
Economics
A partial budget comparison of the treatments can be found in Table 4. Th ese comparisons do not include veterinary costs, interest, or transportation. During the growing period the cost of gain for CRD was the lowest at $0.34/lb (P < 0.01), while the cost of gain for DGR calves was intermediate ($0.41/lb), and OBF had the greatest cost of gain ($0.48/lb). Th ere are some scenarios such as when manure will be fall applied to provide nutrients for the next cash crop (and thus will be a source of N for the oat- brassica forage) or when seed cost is off set by payments from conserva-tion stewardship programs, which alter the backgrounding costs of OBF and make this system competitive with the CRD steers during the growing phase. More details pertaining to these scenarios are presented in the 2016 Beef Report (2016 Nebraska Beef Cattle Report, pp 55– 57).
During the fi nishing phase, the 2 graz-
Th e diff erences observed in marbling score are most likely explained by the numerical diff erences in 12th rib fat (i.e. degree of fi nish). Research has indicated that a 0.039 inch change in 12th rib fat will result in a 30 unit change in marbling score and a 12 percentage unit change in percent choice (2000 Nebraska Beef Cattle Report, pp. 20- 22). Calves on the DGR treatment had a 0.028 inch more back fat than CRD calves. Th erefore, we would predict a 20 unit great-er marbling score for DGR than for CRD, which is similar to the 21 unit diff erence observed between these 2 treatments.
Th e LM area tended (P = 0.06) to diff er among treatments, with OBF and CRD not diff ering (P = 0.87) but were greater (P ≤ 0.05) than DGR. Calculated yield grade of OBF (3.48) and DGR (3.49) did not diff er (P = 0.88) but were slightly greater (P ≤ 0.0.1) than CRD (3.29). However, yield grade diff erences were extremely small and did not result in a diff erence in discounts or premiums.
Table 4. Partial budget economic analysis1 of three backgrounding systems: grazing corn residue plus supplemented with dry distillers at 0.86% of BW (CRD), grazing a fall oats and brassica forage (OBF) or fed a grower ration in drylot (DGR).
CRD OBF DGR SEM6 P- value
Growing period
Grazing period
Feed cost2,3, $/hd 22.97 71.89 — — —
Yardage4, $/hd 12.10 6.50 — — —
Drylot period
Feed cost 5, $/hd 22.70 23.45 56.06 — —
Yardage 4, $/hd 8.40 8.40 21.60 — —
Total cost, $/hd 66.17 110.24 77.66 — —
Cost of gain, $/lb 0.34c 0.48a 0.41b 0.011 <0.01
Finishing period
Feed cost5, $/hd 251.52 255.18 237.46 — —
Yardage4, $/hd 64.00 64.00 64.00 — —
Total cost, $/hd 315.52 319.18 301.46 — —
Cost of gain, $/lb 0.570a 0.565a 0.535b 0.0053 <0.01
Overall
Total cost, $/hd 380.42 428.15 381.19 — —
Cost of gain, $/lb 0.510b 0.540a 0.503b 0.0043 <0.011Excludes vet cost, interest and transportation.2Distillers supplement $110/ton and corn residue $0.20/hd/d.3Seed plus seeding $38.90/ac ($41.58/hd) and N fertilizer $27.36/ac ($29.25/hd).4Yardage: drylot $0.40/d; feeding supplement $0.10/d and checking fence, water and calves while grazing $0.10/d.5Grower ration $114/ton DM and Finishing ration $141/ton DM; Corn at $3.62/bu, Corn Silage at 10% the price of corn, Alfalfa
hay at $97/ton, WDGS (85% DM) at 75% the price of corn, and Supplement at $250/ton.6Standard error of the least squares mean.

2017 Nebraska Beef Cattle Report · 43
© Th e Board Regents of the University of Nebraska. All rights reserved.
areas in each paddock were sampled. All above ground biomass was harvested at ground level, dried at 60°C, and weighed. Th e growing degree days (GDD) that accu-mulated between time of planting and yield measurement calculated by subtracting 32 from the average daily temperature for each day from planting date to date of biomass measurements and summing the resulting degrees. Th e resulting number (GDD) indi-cates the amount of heat that was available for plant growth.
A quality sample was collected in late October by randomly clipping forage at ground level at three locations within the paddocks. All quality samples were freeze dried and analyzed for DM in 105°C oven, crude protein (CP), neutral detergent fi ber (NDF), acid detergent fi ber (ADF), and organic matter (OM).
In March, ground cover was measured by marking points of ground cover over a 100- foot length.
Stocking rate and grazing
In year 1, there was no grazing of the oats- turnip mixture due to restrictions of herbicides use on the corn and the carry-over eff ects on the cover crop. In year 2, steers grazed treatment paddocks begin-ning in November. Steers grazing oats aft er CS were stocked at 1.7 steers per acre, while steers grazing oats and corn residue aft er HMC were stocked at 1.3 steers per acre. Steers grazing aft er corn silage were allocat-ed 1751 lb oat forage DM / steer based on the initial forage mass measurements. Steers grazing aft er HMC were allocated 399 lb oat forage DM and 2707 lb corn husk and leaf DM / steer (assuming 16 lb of leaf and husk material produced per bushel of corn with 220 bushel per acre corn yield).
Prior to grazing, all steers (initial BW= 468 ± 14 lb) were limit fed a 50:50 diet of alfalfa hay and Sweet Bran for fi ve days, and then weighed three consecutive days prior to grazing to adjust for rumen fi ll. On day two of weighing, steers were assigned to
Kristen M. UlmerRobert G. Bondurant
Jana L. GramkowMary E. Drewnoski
James C. MacDonald
Summary with Implications
Annual forages provide producers with an alternative grazing source in the fall. A cover crop grazing study was conducted following corn harvest to evaluate the steer ADG and yield of summer sown oats and turnips plant-ed aft er either high moisture corn or corn silage production. Th e gain of steers grazing oats aft er silage was 1.29 lb/day, while the gain of steers grazing corn residue and oats aft er high moisture corn was 0.72 lb/day. Average oat forage production aft er silage harvest was 2857 lb/acre, while oat pro-duction following corn harvest was 523 lb/acre. Fall forage production of oats following corn silage harvest provided 133 lb of steer gain per acre, while corn residue plus oats following corn harvest provided 57 lb of steer gain per acre. Utilizing oats following silage harvest provides an opportunity for greater forage production and grazing as compared to following corn grain harvest.
Introduction
Planting annual forages in September following corn silage or grain harvest may provide producers with an alternative grazing source for backgrounding spring born calves in the winter. Oats and turnips are cool season species that can be planted in late- summer to produce fall forage. Uti-lizing oats alone or an oat and turnip mix aft er corn harvest may enable producers to have additional ground cover and produce grazeable forage. Th e timing of corn harvest can aff ect the amount of fall forage pro-duced. Early harvested, corn silage (end of August to early- September) results in more growing degree days available for fall forage
Nutrient Content of Summer-Planted Oats aft er Corn Harvest and Grazing Performance
growth when compared to high moisture corn grain harvest (mid to late September). Th e objectives of this study were to: deter-mine forage production and forage quality of late summer planted oats- turnip mix or oat monoculture planted aft er corn silage or high moisture corn harvest and evaluate performance of steers grazing oats pro-duced aft er corn silage harvest or oats with corn residue produced in a high moisture corn system from November to January.
Procedure
Field and planting details
Pivot irrigated fi elds at the Eastern Nebraska Research and Extension Center (ENREC) near Mead, NE were drilled with 60 lb / ac of Horsepower oat and 5 lb / acre purple top turnip in a 7.5 inch row spacing on September 9, 2014 aft er corn silage (CS) harvest. On September 18, 2014 aft er high moisture corn (HMC) harvest, Horsepow-er oat and purple top turnip were drilled into the corn residue at 70 lb /ac and 5 lb / ac, respectively. Restrictions related to the herbicides used on the corn precluded grazing of the turnips, therefore no grazing occurred in year 1. In year 2, 90 lb / ac of Horsepower oat were drilled with a 7.5 inch row spacing on September 3, 2015 and September 17, 2015 following CS and HMC harvest, respectively. Th e 104- acre fi eld was split in half (east and west) with half being planted to corn and half to soybeans and crops were alternated yearly. Th e 52 acres of corn were further split into two 13 acre rep-lications of the two corn harvest treatments (HMC vs. CS). Th ree acres of each rep were not grazed, half having a fall crop planted and half not. Fertilizer was applied at 45 and 40 lb nitrogen per acre to all treatments in years 1 and 2, respectively.
Forage production measures
Initial forage mass was measured the last week of October. To measure biomass, three randomly selected 36 inch x 22.5 inch

44 · 2017 Nebraska Beef Cattle Report
paddocks based on weight blocks. On day three of weighing, steers were implanted with Ralgro®. Grazing was initiated on No-vember 13, and steers were removed from paddocks on January 4 aft er 62 days when oats and corn residue were fully utilized, meaning little to no leaf or husk and only oat stubble were present. At termination of grazing, steers were returned to the feedlot and were limit fed a 50:50 alfalfa and Sweet Bran diet for eight days followed by weigh-ing three consecutive days to determine ending BW.
Data were analyzed with the MIXED procedure of SAS (SAS Institute, Inc., Cary,
Table 1. Nutrient analysis of fall forage planted aft er corn silage or high moisture corn for both years1
Treatment2
CS HMC SEM P- value
Year 13
OM, % 84.8 86.5 0.26 0.05
CP, % 22.5 18.7 2.25 0.35
NDF, % 43.7 45.1 0.58 0.23
ADF, %4 24.8 21.6 0.66 0.08
IVOMD, %5 82.1 82.2 0.61 0.87
Year 2
OM, % 83.8 84.4 0.39 0.36
CP, % 18.0 23.2 2.15 0.23
NDF, % 43.7 37.5 2.18 0.18
ADF, % 25.6 22.1 0.74 0.08
IVOMD, % 78.9 84.6 0.66 0.031All nutrients on a dry matter basis2CS: Forage grazed aft er corn silage harvest; HMC: forage grazed aft er high moisture corn harvest.3Year 1 mix composed of 60 lbs oats and 5 lbs turnips aft er corn silage and 70 lbs oats and 5 lbs turnips in HMC treatment. Year 2
composed of 90 lbs oats planted aft er corn silage and HMC.4ADF (Acid Detergent Fiber): measure of less or indigestible fi ber which is negatively correlated to energy of diet5IVOMD (in vitro organic matter digestibility): measure of the digestibility of the organic matter in the diet
Table 2. Performance of steers grazing oats aft er corn harvest in 2015
Treatment1
CS HMC SEM P- value
Initial BW, lb 468 469 0.50 0.29
Ending BW, lb 548 513 16.8 0.27
ADG, lb 1.29 0.72 0.27 0.27
Gain, lb/acre 133 57 23.5 0.151CS: Forage grazed aft er corn silage harvest; HMC: forage grazed aft er high moisture corn harvest.
N.C.) with paddock as the experimental unit for forage analysis and steer performance.
Results
Forage production
In year 1, oats- turnip forage production of CS was 941 lb DM / ac (SEM = 104) and 343 lb DM / ac (SEM = 58) for HMC in late October. Growing degree days (GDD) were calculated to be 1358 for the oats- turnip planted aft er CS and 1142 aft er HMC.
In year 2, oats forage production was 2857 lb DM / ac (SEM = 93) for CS and 523
lb DM / ac (SEM = 95) for HMC. Greater oats production on CS paddocks as com-pared to the HMC paddocks was likely due to the earlier planting and thus the greater accumulation of GDD for fall growth (1714 vs. 1162 GDD, aft er CS and HMC, respectively).
Post- graze ground cover measurements showed that there was 63.2% ground cover by oat stubble aft er grazing on the CS paddocks, while there was 81.9% ground cover due to corn residue and minimal oat stubble aft er grazing HMC treatment. Th e HMC treatment had signifi cantly more ground cover (P < 0.01; SEM = 2.68) than CS. Th ese data show that aft er 62 days of grazing, there was a signifi cant amount of ground cover to prevent erosion.
Forage quality
Th e nutrient content of samples collect-ed in October of the oats- turnip mix in year 1 and oats in year 2 are reported in Table 1. In year 1, the oat turnip mix produced in the HMC (86.5%) treatment had a greater percentage of OM as compared to CS (84.8%), as well as, tended (P = 0.08) to have a lower ADF compared to CS (21.6% vs. 24.8% for HMC vs. CS, respectively). However, there was no diff erence in the IVOMD of oat- turnip mix planted aft er CS vs. HMC, 82.1 and 82.2%, respectively. In year 2, the OM content of the late summer planted oats did not diff er between HMC and CS. Whereas, ADF tended (P = 0.08) to be lower for HMC (22.1%) than CS (25.6) and IVOMD was greater for HMC (84.6%) than CS (78.9%). Although, there were some diff erences in nutrient content in the fall forage produced due to planting date (CS vs. HMC), the quality of the forage was extremely high at either planting date. Th e nutrient analysis shows that late summer planted oats, with or without turnips, are high in protein, ranging from 18 to 23% CP and high in energy with IVOMD ranging from 78.9 to 84.6%.
Cattle performance
In year 2, the ADG of steers grazing oats planted aft er CS was 1.29 lb / d and 0.72 lb / d for steers grazing the oats plus corn residue in HMC paddocks (Table 2). How-ever, given the low number of replicates (n = 2) ADG did not statistically diff er among

2017 Nebraska Beef Cattle Report · 45
nomic standpoint, supplementing distillers on cornstalks provides a cheaper gain for producers. However, unlike corn harvested for grain where corn residue provides sig-nifi cant amounts of ground cover, there is a need to plant something in the fall to pro-vide ground cover in corn silage systems. Th ese data suggest that in early harvested fi elds, oats can be used to produce ground cover and provide a relatively low cost source of gains for calves.
Conclusions
Th ese data suggest that there is an opportunity for fall forage production aft er corn silage harvest, but minimal fall pro-duction aft er HMC harvest. Moderate gains (1 to 1.5 lb / d) are possible for growing calves grazing summer planted oats in the late fall/early winter.
Kristen M. Ulmer, graduate studentRobert G. Bondurant, research technicianJana L. Gramkow, research technicianMary E. Drewnoski, assistant professor, Animal Science, LincolnJames C. MacDonald, associate professor, University of Nebraska–Lincoln, Department of Animal Science, Lincoln, NE
treatments (P = 0.27; Table 2). Likewise, gain per acre was numerically greater but not statistically signifi cant (P = 0.15) for steer grazing oats planted aft er CS (133 lb / ac) than for steers grazing HMC residue and oats (57 lb / ac).
In a previous experiment, (2016 Nebraska Beef Report, pp. 31- 32) calves grazing corn residue with no supplement lost 0.18 lb of ADG. Th is suggests that the low amount of oats produced in the HMC system increased gains over grazing residue alone. With the stocking rate used in the present study, the seed plus seeding would have cost $23 / steer in the HMC system. Distillers supplementation of 0.5 lb DM / d (31 lb / steer for the entire period) would have resulted in the same gain but cost roughly $2.60 / steer at $150 / ton of DDGS. Steers grazing oats aft er CS gained 1.29 lb /d, and at the stocking rate used in this study, the cost of seed plus seeding cost $18 / steer. If calves would have been grazed on corn residue and supplemented with distillers to achieve a rate of gain of 1.29 lb / d, they would have needed to be supplemented at 3.0 lb DM / d (186 lb / steer for entire period), resulting in a cost of $14 / steer. Suggesting that from an eco-

46 · 2017 Nebraska Beef Cattle Report
© Th e Board Regents of the University of Nebraska. All rights reserved.
rate was determined using the University of Nebraska’s corn stalk grazing calculator. Th e baled replications were baled following corn grain harvest by the cooperator. Th e bales from each replication were counted and weighed. Bales were sampled by taking a core from each bale, and core samples were composited into a bag for each repli-cation. Residue samples were sent to Ward Laboratories (Kearney, NE) for nutrient analysis (N, Ca, P, and K) which was used to determine pounds of N, CaCO3, P2O5, and K2O removed per acre.
Yield data were collected by hand har-vest. For continuous corn sites, hand harvest was done once corn reached black layer stage of maturity. Corn plants were cut from 17.5 foot rows (3 rows per replication) at the top of the crown root node. Corn ears were removed, then the ear and remaining plant stover (husk, leaf, and stalk) were weighed separately. Subsequently, three cornstalks and three ears were taken as a subsample from each 17.5 foot bundle for dry matter analysis at 60°C. Ear corn samples were dried in the 60°C oven for 48 hours, then the corn grain was shelled. Cobs and grain went back into the oven separately for another 24 hours or until dry. Cob weights were included in the dry stover yields. Dry matter measurements from the grain and stover were used to calculate corn grain yield and stover (total biomass minus the grain) yield per acre. Harvest index was calculated based on the percentage of dry grain in total dry biomass (grain plus stover).
Soybeans were harvested when they reached about 13% moisture. Hand harvest yield of soybeans consisted of cutting two- 17.5 foot rows at the base of the plant at ground level. Rows were bundled and each subsample was dried at 60°C until threshing of the soybeans. At threshing, samples of grain and stover were collected and dried in an oven at 60°C to measure dry matter. Dry matter oven weights for the grain and stover were used to calculate soybean grain yield and stover (total biomass minus the grain) yield per acre for the fi eld.
a crop farmer, it is necessary to evaluate possible changes in grain yield with residue removed either by baling or grazing. With corn residue baling, it is important to deter-mine the amount of nutrients removed per acre from the fi eld to determine potential impacts on fertilizer needs for the next planting. Th e objectives of this 2- year study were to determine how grazing or baling of corn residue aff ects subsequent grain yield, stover yield, and harvest index at multiple locations across Nebraska, and to calculate the amount of nutrients removed by baling corn residue.
Procedure
Study locations included Ainsworth, Norfolk, Odessa, Scottsbluff , Nebraska City, and Clay Center, all in Nebraska. In year 1 (2013), there were four locations (Ainsworth, Norfolk, Odessa, and Scotts-bluff ) and in year 2 (2014), two additional locations (Nebraska City and Clay Center) were added. At each location, there were 3 treatments: grazed, baled, and control (no grazing or baling) with 2 replications per treatment per location, except for the Nebraska City fi eld, which had two fi elds with one fi eld having 2 reps and the other having 3 reps, and the Clay Center location, which had 3 fi elds with each fi eld having one replication. Treatments were applied to a site in Scottsbluff , but no hand harvest measurements were taken at this site, only baled samples were collected for nutrient analysis. Each fi eld was in a continuous corn rotation, except for the Nebraska City site, which was in a corn- soybean rotation and the Scottsbluff site that was in a corn, dry bean, and sugar beet rotation. Th e Nebraska City location was rain- fed, Odessa had sub- surface drip irrigation and the other four sites were pivot irrigated. All locations were in no- till, except for the Ainsworth site, which was disked.
Grazed areas were fenced off , and cows were stocked based on corn yield and targeting 50% removal of husk and leaf components of the corn residue. Stocking
Kristen M. UlmerJordan L. Cox
Manbir K. RakkarRobert G. Bondurant
Humberto Blanco- CanquiMary E. Drewnoski
Karla H. JenkinsJames C. MacDonald
Rick J. Rasby
Summary with Implications
A 2- year study evaluated the eff ect of corn residue baling or grazing on subse-quent yields, as well as, nutrient removal by baling at fi ve locations in Nebraska. Th ree treatments were applied to each fi eld: baled, grazed, and control (no baling and no grazing). Grain and stover yields were measured by hand harvest at maturity. No diff erences were observed among treatments for corn yield with baled having yields of 234 bu grain / acre, grazed with 239 bu grain / acre and control with 223 bu grain / acre. Th ere was no diff erence in stover yield among treatments (8,326, 8,135, and 7,945 lb stover DM / acre for baled, grazed, and control, respectively). Results indicate that removing corn residue provides a potential feed resource with no negative impact on grain yield in the short term.
Introduction
Th e amount of corn residue in the Midwest has increased with increased corn production over the years. Opportunities exist to remove the corn residue from the fi eld for feeding later, or grazing residue in the fi eld. Th ere continues to be questions about the eff ect of residue removal on corn grain yields in subsequent years. Baling of corn residue means that nutrients associat-ed with residues are removed and require fertilization to be replaced. Because yields are the most important profi t indicator for
Eff ect of Corn Residue Grazing or Baling on Subsequent Crop Yield and Nutrient Removal

2017 Nebraska Beef Cattle Report · 47
In the spring following year 1, the percentage of ground cover was measured by marking points of ground cover over a 100- foot length.
Data were analyzed using the MIXED procedure of SAS with the response variables being yield, harvest index and nutrient removed. Location (nested within year) and treatment were considered fi xed eff ects.
Results
Th ere were no interactions (P > 0.11) between location and treatment for all yield and harvest index analyses, but the main eff ect of location was signifi cant (P < 0.01), as expected. Th e weather patterns and topographic and soil characteristics among locations across Nebraska made each loca-tion unique. Corn grain yields ranged from 152 to 286 bu per acre across locations. However, no diff erences were observed among treatments (P = 0.18) for corn grain yield (Table 1). Most locations were irrigat-ed, therefore, the eff ects of residue cover on soil moisture may not have been observed, additionally the two years of collection were both wetter than previous years.
Th ere was a diff erence among treat-ments (P < 0.01) in the amount of ground cover in the spring with grazed having 77.5% cover, baled having 45.8% cover and control having 88.7% cover (SEM = 1.42). Th is demonstrates that grazing corn residue does not reduce soil cover as much as baling does and that a signifi cant amount of cover remains aft er grazing.
Th e baled treatments had numerically greater corn grain yields than control plots. Th is may be due to more available N and less ground cover enabling the ground to warm up earlier. Nitrogen is needed to degrade C, and with less residue being recycled, a short term bump in yields may be recorded.
Th ere was no diff erence (P = 0.59) in corn stover yield among treatments. Stover yields ranged from 5,236 to 10,656 lb dry matter per acre across locations. Th ere was no diff erence (P = 0.44) in harvest index among treatments (62.3, 61.3 and 61.0 ± 0.62% for grazed, baled, and control, respectively). Harvest index is a measure of the percentage of grain produced relative to plant biomass. Th e proportion of corn grain is roughly two- thirds of the plant
Table 1. Corn and soybean yield data collected at locations across Nebraska.
Treatment
Item Grazed Baled Control SEM1 P- value
Corn grain yield, bu/acre2 239 234 223 5.09 0.18
Corn stover yield, lbs DM/acre2
8,135 8,326 7,945 218 0.59
Harvest Index, %3 62.3 61.3 61.0 0.62 0.44
Soybean grain yield, bu/acre4
59.1 61.3 62.0 3.46 0.83
Soybean stover yield, lbs DM/acre4
3,335 3,807 3,452 288 0.51
1SEM = Pooled standard error mean for response variable2Corn grain and stover yield were measured at 4 cooperator sites: Ainsworth, Clay Center, Norfolk, Odessa3Harvest index is the measure of the percentage of corn grain to total biomass (grain + stover).4Soybean grain and stover yields measured only at Nebraska City site
Table 2. Pounds per acre of corn residue (DM basis) removed through baling from each location
Year
Cooperator 2013 2014 2015 SEM1
Ainsworth 3,461 7,306 5,234 483
Norfolk 4,631 3,873 4,578 483
Odessa 4,247 4,088 1,768 483
Nebraska City2 3,431 1,047 4,058 483
Clay Center3 — 5,716 4,585 395
Scottsbluff 4 3,858 5,893 6,681 6841SEM = Pooled standard error mean for response variable2Two fi elds in rotation each year at NE City. 3Clay Center site was not set up until 2014.4Field rotates each year, so same fi eld not used every year.
Table 3. Nitrogen (lb N/ac) removed by baling corn residue across cooperator locations in Nebraska
Nitrogen Removal
Cooperator 2013 2014 2015 SEM1 P- value
Ainsworth 40.7b 84.1a 46.5b 4.40 < 0.01
Norfolk 46.7 45.2 48.7 4.40 0.26
Odessa 32.3a 39.2a 12.5b 4.40 0.02
NE City2 32.1a 10.9b 36.1a 4.40 < 0.01
Clay Center3 — 65.8 47.0 3.58 0.12
Scottsbluff 4 30.2b 52.5a 46.8a 6.20 0.05abMeans within row with diff ering superscripts are diff erent (P < 0.05).1SEM = Pooled standard error mean for response variable2Two fi elds in rotation each year at NE City. 3Clay Center site was not set up until 2014.4Field rotates each year, so same fi eld not used every year.

48 · 2017 Nebraska Beef Cattle Report
aboveground biomass produced, but ranged from 55.1 to 66.0% across locations. Th e Norfolk location had the most variable harvest index due to the site receiving hail in 2014.
Soybean grain yield did not diff er (P = 0.83) for grazed, baled, and control having grain yields of 59.1, 61.3, and 62.0 bushels per acre, respectively (Table 1). Soybean stover produced did not diff er (P = 0.51) between treatments (3,335, 3,807, and 3,452 lb dry mass per acre, respectively).
Based on yield data, there is no evidence that baling, grazing, or leaving residue will change grain yield in the short term. However, Drewnoski et al. (2015 Nebras-ka Beef Report, pp. 53– 55) observed that in the long term, over a 10- year period, grazing corn residue at UNL recommended rates did not impact the subsequent corn yields but improved soybean yields of fi eld’s managed in a corn- soybean rotation.
Among the six cooperator sites over the three years of baling, the average amount of corn residue removed per acre by baling ranged from 1,047–7,306 lbs per acre with the average removed being 4,390 ± 1, 577 lb DM per acre (Table 2). Th ere was substan-tial variation among cooperators in the amount of residue removed relative to the total residue produced per acre with a range from 15– 80%, suggesting that there were considerable diff erences in baling methods.
Nutrient removal from baling corn residue means that nutrients will eventually need to be replaced with fertilizer. Nitrogen, P, K, and Ca are four major nutrients that plants need for growth. Th e concentration of N in the baled residue ranged from 0.68– 1.18% with an average of 0.96 ± 0.162%. Th e concentration of Ca in the bales ranged from 0.24– 0.53% with an average of 0.37 ± 0.09%. Th e concentration of P in the baled residue ranged from 0.04– 0.19% with an average of 0.08 ± 0.033% P and the K in the baled residue averaged 1.11 ± 0.45% with a range of 0.51 to 1.91% K.
Th e amount of N removed by baling corn residue is listed in Table 3 and varied across location (P < 0.01) ranging from 10.9 to 84.1 lb N /acre with an average of 42.3 ± 17.3 lbs removed per acre. Th e amount of Ca (reported as CaCO3 equivalents) is shown in Table 4 and ranged from 10.6 to 60.1 lb CaCO3/acre with an average of 37.3 ± 16.3 lbs CaCO3 /acre. Phosphorus removal (reported as P2O5 equivalents) is
Table 4. Calcium removed as CaCO3 by baling corn residue across cooperator locations
CaCO3 Removal1
Cooperator 2013 2014 2015 SEM2 P- value
Ainsworth 29.0b 59.3a 43.5ab 6.06 0.04
Norfolk 60.1 51.2 54.9 6.06 0.32
Odessa 31.3a 27.0a 10.6b 6.06 < 0.01
NE City3 44.3a 11.5b 34.0a 6.06 < 0.01
Clay Center4 — 46.2 37.6 4.95 0.44
Scottsbluff 5 33.8 53.4 58.9 8.58 0.33abMeans within row with diff ering superscripts are diff erent (P < 0.05).1Nutrient removed by baling in lbs / acre2SEM = Pooled standard error mean for response variable3Two fi elds in rotation each year at NE City.4Clay Center site was not set up until 2014.5Field rotates each year, so same fi eld not used every year.
Table 5. Phosphorus removed as P2O5 by baling corn residue across cooperator locations
P2O5 Removal1
Cooperator 2013 2014 2015 SEM2 P- value
Ainsworth 7.89 8.77 6.62 0.977 0.13
Norfolk 4.33 3.72 3.30 0.977 0.29
Odessa 3.31 3.49 1.38 0.977 0.19
NE City3 2.72a 0.75b 2.93a 0.977 0.05
Clay Center4 — 6.90 5.26 0.798 0.39
Scottsbluff 5 4.17 4.71 3.11 1.38 0.65abMeans within row with diff ering superscripts are diff erent (P < 0.05).1Nutrient removed by baling in lbs / acre2SEM = Pooled standard error mean for response variable3Two fi elds in rotation each year at NE City. 4Clay Center site was not set up until 2014.5Field rotates each year, so same fi eld not used every year.
Table 6. Potassium removed as K2O by baling corn residue across cooperator locations
K2O Removal1
Cooperator 2013 2014 2015 SEM2 P- value
Ainsworth 70.1c 204a 157b 25.7 < 0.01
Norfolk 54.4 73.9 73.0 25.7 0.29
Odessa 88.5ab 136a 32.4b 25.7 < 0.01
NE City3 46.6b 71.6a 22.0c 25.7 < 0.01
Clay Center4 — 249 199 21.0 0.31
Scottsbluff 5 95.4 171 285 36.3 0.10abcMeans within row with diff ering superscripts are diff erent (P < 0.05).1Nutrient removed by baling in lbs / acre2SEM = Pooled standard error mean for response variable3Two fi elds in rotation each year at NE City. 4Clay Center site was not set up until 2014.5Field rotates each year, so same fi eld not used every year.

2017 Nebraska Beef Cattle Report · 49
weigh and sample bales to have an accurate estimate of the amount nutrients that need to be replaced aft er baling of corn residue.
Kristen M. Ulmer, graduate studentJordan L. Cox, graduate studentManbir K. Rakkar, graduate studentRobert G. Bondurant, research technicianHumberto Blanco- Canqui, associate professor, Agronomy and Horticulture, LincolnMary E. Drewnoski, assistant professor, Animal Science, LincolnKarla H. Jenkins, associate professor, Panhandle Research and Extension CenterJames C. MacDonald, associate professor, Animal Science, LincolnRick J. Rasby, professor, Animal Science, Lincoln
shown in Table 5. Th e amount of P removed ranged from 0.75 to 8.77 lbs P202 /ac with an average of 4.31 ± 2.18 lbs P2O5. Lastly, K removal (reported as K2O equivalents) is shown in Table 6 with the range among locations being 22 to 285 lb K2O/ acre.
Conclusions
Results indicate that, in the short term, removing corn residue through grazing or baling provides a potential feed resource with no negative impact on grain yield or harvest index. However, baling results in more loss of ground cover than does grazing. Baling also results in removal of N, P, K, and Ca. Nutrient removal by baling varied considerably among cooperators and among year within cooperators. Th ese data demonstrate that it is important to
50 · 2017 Nebraska Beef Cattle Report
© Th e Board Regents of the University of Nebraska. All rights reserved.
trometer was pushed into the soil at a rate of approximately 1 inch per second. Five measurements were performed per plot. Th e measurement soil depths were: 0- 2, 2- 4, 4- 6, and 6- 8 inches. Th e penetration resistance values were converted to cone index (MPa) by dividing penetration resistance with basal cone area. Bulk density refers to the mass of dry soil per unit volume of soil. It was measured using intact soil cores (2 inch by 2 inch) from the 0- 2, 2- 4, 4- 6, and 6- 8 inch soil depths. Two cores were collected per plot. Th e cores were trimmed, weighed, and oven dried at 221o F for at least 24 h to deter-mine the gravimetric moisture content and bulk density of the soil.
Bulk soil samples collected from the 0- 2 and 2- 4 inch depth were used for the analy-sis of soil organic matter, nutrients, and wet aggregate stability (soil structural quality parameter). Soil samples were air dried, passed through 2 mm sieve, and analyzed for pH, organic matter, nitrogen, potassi-um, phosphorus, calcium, magnesium, and sulfur. To assess the impact of grazing on soil structure, wet aggregate stability was determined using 4.75- 8 mm aggregates by the wet sieving procedure. Th e wet ag-gregate stability indicates the resistance of soil against external disruptive forces (i.e., raindrop impacts during erosion) as well as effi ciency of soil to hold soil C and other nutrients. Cone index measurements and soil sampling were conducted on non- wheel traffi cked positions within each plot.
Data on soil properties were analyzed with grazing treatments (spring grazing, fall grazing, and control) as main eff ect and replications as random eff ect using PROC MIXED in SAS. Treatment eff ects were considered signifi cant at the 0.10 probabil-ity level.
Results
Fall grazing did not aff ect cone index (Figure 1) which mimics resistance to root penetration, bulk density (Figure 2) which indicates the amount of pore space in the
Midwest. Particularly, little is known about the potential eff ects of cattle grazing on soil quality parameters in irrigated systems in the western Corn Belt. Th us, a study was conducted to determine the impact of cattle grazing on soil compaction, structural quality, organic matter, nutrients and to determine whether changes in soil prop-erties due to grazing can impact corn and soybean yield in an irrigated no- till corn- soybean system aft er 16 years of residue grazing management in eastern Nebraska.
Procedure
Th is study was conducted in late spring 2015 on a long- term corn residue graz-ing experiment established in 1997. Th e experiment was established on 90 ac of irrigated cropland managed at the Agricul-tural Research and Development Center of the University of Nebraska- Lincoln located near Mead, NE. Th e soil is a Tomek silt loam (0 to 2% slope). Th e experiment had three treatments: 1) fall/winter grazing (No-vember through late February), 2) spring grazing (late February to the middle of April), and 3) control (no grazing) replicat-ed twice. Grazing treatments were applied using stocker cattle (500 to 700 lb BW). Fall grazing treatment had a stocking rate of 1.8 to 2.5 AUM/ac (1997- 2015). From 1997- 1999, spring grazing treatment had a stock-ing rate of 0.9 to 1.3 AUM/ac. Beginning in 2000, the stocking rate for spring grazing treatment was modifi ed to 2.3 to 3.1 AUM/ac. Th e crop rotation at the experimental site was corn- soybean. Impacts of the three treatments on long- term crop yields were previously presented (2015 Nebraska Beef Report pp. 53- 55). For the present study, only the corn phase plots, which had been managed under no- till since the experiment inception for 16 years, were studied.
To assess the impacts of grazing on soil compaction, indicators of soil compaction such as cone index and bulk density were studied. Cone index was measured using a hand cone penetrometer, which mimics the root penetration in the soil. Th e pene-
Manbir K. RakkarHumberto Blanco
Mary E. DrewnoskiJames C. MacDonaldTerry J. Klopfenstein
Summary with Implications
An experiment was conducted to evaluate the eff ect of long- term (16 years) corn residue grazing with cattle on soil compaction, soil structure, soil organic matter, and nutrients. Th ree treatments: 1) fall grazing (November through January; 1.8 to 2.5 AUM/ac), 2) spring grazing (February to middle April; 2.3 to 3.1 AUM/ac), and 3) control (no grazing) under a no- till irrigated corn- soybean system in eastern Nebraska were studied. Crop yields were increased and soil bulk density and cone index (parameters of soil compac-tion), wet soil aggregate stability (parameter of soil structural quality), and organic matter content were not aff ected by grazing during the fall. Spring grazing slightly increased crop yields while wet soil aggregate stability, bulk density, and organic matter content were unaff ected. During spring grazing, only cone index was increased, but not above threshold levels. Crop residue grazing in the fall has no eff ect on soil and any eff ect from spring grazing is biologically unimportant.
Introduction
Corn residue grazing is an import-ant forage option under increasing costs of feed grains and hay and decreasing grassland area. However, determining the impact of grazing corn residue on soils and crop yields is very important. Data from long- term grazing experiments are needed to better understand the impacts of residue grazing on soil properties and their relations with crop yields. Th is information can assist with developing integrated crop- livestock systems in Nebraska and in the
Eff ect of Long- Term Corn Residue Grazing on Soil Properties

2017 Nebraska Beef Cattle Report · 51
soil and wet soil aggregate stability which is an indicator of the soils ability to resist wa-ter erosion. Both corn and soybean yields following corn grazing were signifi cantly (P < 0.10) improved by fall grazing (2015 Ne-braska Beef Cattle Report, pp 53- 55). Th e spring grazing treatment was specifi cally designed to determine if heavy stocking in the spring aft er the soil is thawed would af-fect soil properties. Soybean yield increased while corn yield was unaff ected by spring grazing. Soil bulk density (Fig. 2) and wet aggregate stability were not aff ected by spring grazing. Only cone index (Fig.1) was signifi cantly increased. Th e values (1.2 to 1.5 MPa) are, however, below the threshold level of 2.0 MPa. Th e threshold level is the level where plant root growth is expected to be inhibited. Th us, this fi nding indicates that that even long term spring grazing at high stocking rates had no eff ect on soil properties of biological signifi cance.
Concerning soil fertility, grazing treatments had no signifi cant eff ect on soil organic matter concentration, but the nu-merical values were greater under fall and spring grazing than under control (Table 1). Th is indicates that long- term removal of corn residues by grazing did not have any negative eff ects on soil organic matter levels, which may be due to the following reasons. First, cattle grazing does not re-move large amount of residue. Th e residue removal rate by cattle grazing is oft en <25%. In the current study, it was estimated that the stocking rates utilized would result in 10 to 13% removal of corn residue in the fall grazing treatment, while the residue re-moval rate in the spring grazing treatment would range between 6 and 9% in the fi rst 3 years and between 16 and 22% in the last 11 years. Th us, signifi cant amounts (≥ 3.2 ton/ac or >78%) of residue were present on the soil surface to protect soil from erosion and as a source of C to soil. Second, grazing cattle adds manure to soil, which can be a source of more stable C than crop residues. In addition, cattle trampling may incorpo-rate the residues into the soil, preventing them from photo- oxidation. Such mecha-nisms reduce the decomposition rate of soil organic matter, which can help with main-taining the organic matter level in the soil.
Grazing treatments had no signifi cant eff ect on soil pH and nutrient concentra-tions except for calcium and sulfur (Table 1). While one can assume that grazing
Cone Index (MPa)So
il de
pth
(inch
es)
Fall grazingSpring grazingControl
P = 0.03
P = 0.05
P = 0.04
P = <0.01
0.0 0.5 1.0 1.5 2.0 2.50
2
4
6
8
Soil
dept
h (in
ches
)
Fall grazingSpring grazingControl
P = 0.03
1.0 1.1 1.2 1.3 1.4 1.5 1.6 1.70
2
4
6
8
Bulk density (g cm-3)
P = 0.18
P = 0.20
P = 0.37
Fig. 2. Soil- depth distribution of bulk density for the 0 to 8 inch depth as aff ected by 16 years of cattle grazing of corn residues under irrigated no- till system on a Tomek silt loam in eastern Nebraska. Th e P- values are reported for each depth interval
Fig. 1. Soil- depth distribution of cone index (soil compaction parameter) for the 0 to 8 inch depth as aff ected by 16 years of cattle grazing of corn residues under irrigated no- till system on a Tomek silt loam in eastern Nebraska. Th e P- values are reported for each depth interval.
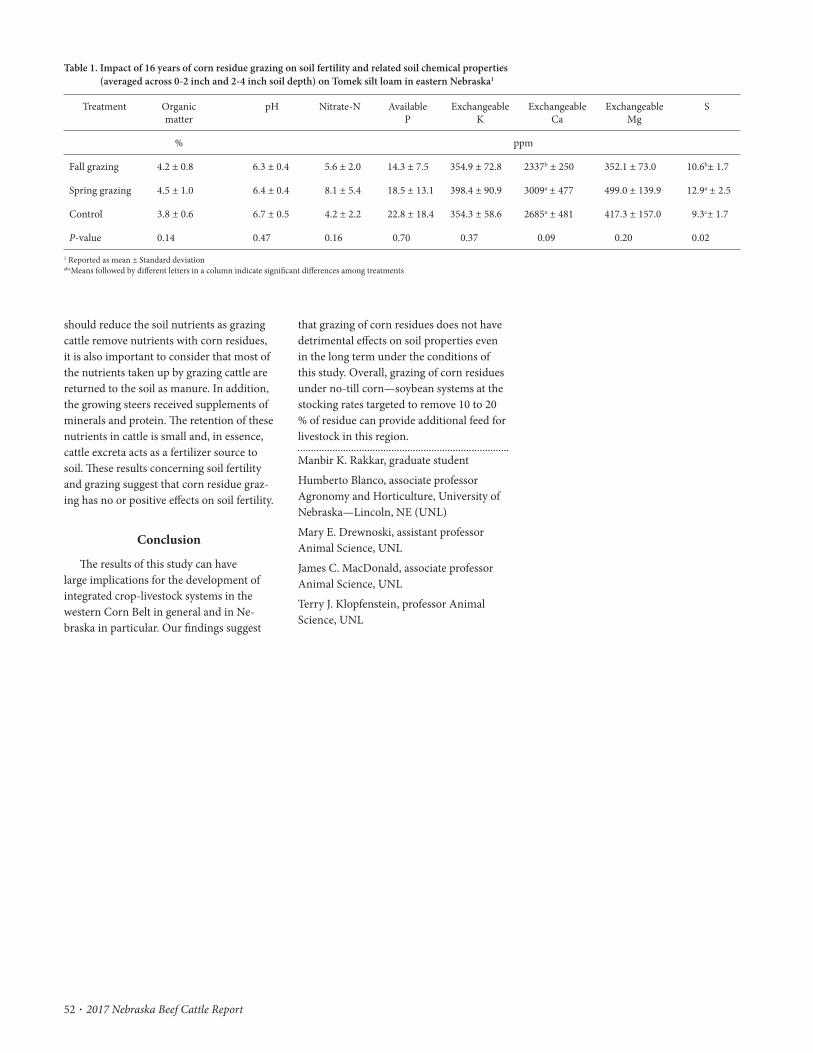
52 · 2017 Nebraska Beef Cattle Report
that grazing of corn residues does not have detrimental eff ects on soil properties even in the long term under the conditions of this study. Overall, grazing of corn residues under no- till corn— soybean systems at the stocking rates targeted to remove 10 to 20 % of residue can provide additional feed for livestock in this region.
Manbir K. Rakkar, graduate studentHumberto Blanco, associate professor Agronomy and Horticulture, University of Nebraska— Lincoln, NE (UNL)Mary E. Drewnoski, assistant professor Animal Science, UNLJames C. MacDonald, associate professor Animal Science, UNLTerry J. Klopfenstein, professor Animal Science, UNL
should reduce the soil nutrients as grazing cattle remove nutrients with corn residues, it is also important to consider that most of the nutrients taken up by grazing cattle are returned to the soil as manure. In addition, the growing steers received supplements of minerals and protein. Th e retention of these nutrients in cattle is small and, in essence, cattle excreta acts as a fertilizer source to soil. Th ese results concerning soil fertility and grazing suggest that corn residue graz-ing has no or positive eff ects on soil fertility.
Conclusion
Th e results of this study can have large implications for the development of integrated crop- livestock systems in the western Corn Belt in general and in Ne-braska in particular. Our fi ndings suggest
Table 1. Impact of 16 years of corn residue grazing on soil fertility and related soil chemical properties (averaged across 0- 2 inch and 2- 4 inch soil depth) on Tomek silt loam in eastern Nebraska1
Treatment Organic matter
pH Nitrate- N AvailableP
ExchangeableK
ExchangeableCa
ExchangeableMg
S
% ppm
Fall grazing 4.2 ± 0.8 6.3 ± 0.4 5.6 ± 2.0 14.3 ± 7.5 354.9 ± 72.8 2337b ± 250 352.1 ± 73.0 10.6b± 1.7
Spring grazing 4.5 ± 1.0 6.4 ± 0.4 8.1 ± 5.4 18.5 ± 13.1 398.4 ± 90.9 3009a ± 477 499.0 ± 139.9 12.9a ± 2.5
Control 3.8 ± 0.6 6.7 ± 0.5 4.2 ± 2.2 22.8 ± 18.4 354.3 ± 58.6 2685a ± 481 417.3 ± 157.0 9.3c± 1.7
P- value 0.14 0.47 0.16 0.70 0.37 0.09 0.20 0.02
1 Reported as mean ± Standard deviationabcMeans followed by diff erent letters in a column indicate signifi cant diff erences among treatments

2017 Nebraska Beef Cattle Report · 53
© Th e Board Regents of the University of Nebraska. All rights reserved.
harvested 2 rows of stem for the low- stem corn residue bales and all 8 rows of stem for the high- stem corn residue. Conventional harvest method was also used on the same fi eld to obtain conventionally harvested corn residue bales (raked and baled). Th e digestion study consisted of 4 periods in which the experimental treatments were applied. Sweet Bran® and brome grass hay were fed at a 9:1 ratio in a fi ft h period for determination of residue digestibility by diff erence. Th is allowed for calculation of total fecal output from the Sweet Bran® and brome grass that contributed to fecal output of the other 4 periods. Digestibility of the residue diets were correct by subtracting the contribution of Sweet Bran® and brome grass hay in feces.
Th e periods were 17 d in length allowing for 10 d of adaptation and 7 d for total fecal collection. Wethers were placed in metabolism crates with fecal bags on the evening of d 10. Feed was off ered twice daily at 0800 and 1600 hrs with 50% of daily DM fed at each feeding. Feed refusals were collected each morning at 0800 and fed back to wethers with adjusted 0800 feeding to prevent sorting of least digestible plant parts. Samples of individual feedstuff s were taken on d 10 and d 14 and dried to correct for DM of each period. At the end of each period, feces were composited and mixed. Subsamples were taken and dried utilizing
from in vivo trials. Developing standards for residues is important to allow for proper adjustments to in vitro digestibility estimates. Various methods are used to dry samples during in vivo trials which may aff ect the digestibility estimates. Th e objec-tives of this study were to 1) determine the eff ect of harvest method (low- stem, high- stem, and conventional) on digestibility and quality of corn residues and 2) determine the eff ect of drying method for feces on digestibility estimates.
Procedure
An 85- d digestion study was conduct-ed utilizing 9 crossbred wethers (initial BW = 93.4 lb, ± 16.3 lb) divided into 3 blocks based on initial BW. Wethers were assigned randomly to 1 of 3 treatments. Th e treatments consisted of 3 residue- based diets containing corn residue harvested with 1 of 3 methods (low- stem, high- stem, and conventional). All diets contained 70 % residue, 27% Sweet Bran®, and 3% brome grass hay (DM basis, Table 1). Corn residues and brome grass hay were ground using a 1- in screen. Low- stem and high- stem corn residues were obtained using a New Holland Cornrower Corn Head (Straeter Innovation, Inc.). Th e Cornrow-er corn head was described in the 2015 Nebraska Beef Cattle Report (pp. 62– 63) and
Tasha M. KingMelissa L. Jolly- Breithaupt
Jana L. GramkowTerry J. KlopfensteinJim C. MacDonald
Summary with Implications
Corn residues can be an economical forage source for producers and advanced harvest methods have increased the quality of baled residue. A digestion study was conducted to evaluate the eff ects of harvest method of corn residues (low- stem, high- stem, and conventional) on digestibility in lambs. Samples from total fecal collection were dried 1 of 3 ways to determine eff ects on digestibility estimates. Corn residue contain-ing low- stem had greatest overall digestibility with high- stem residue being intermediate and conventional harvesting having the low-est digestibility. Drying method had no eff ect on digestibility estimates.
Introduction
Advancements in harvest technolo-gies have improved the feeding quality of baled corn residue. Th e New Holland Cornrower corn head allows producers to adjust the proportion of stem being cut and baled. Changing the bale composition by increasing the ratio of husk and leaf to stem allows for improved digestibility, due to the greater digestibility of husk (2016 Nebraska Beef Cattle Report, pp. 76– 78). Previous experiments (2016 Nebraska Beef Cattle Report, pp. 81– 83) have reported when the proportion of stem in the baled residue is reduced, in vitro OM digestibility (IVOMD) improves. Additionally, improved ADG was observed with low- stem residue (1.71 lb), compared with conventionally baled corn residue (1.39 lb).
In vitro procedures are variable, an issue oft en corrected by using known standards
Eff ect of Harvest Method on Digestibility of Corn Residue
Table 1. Diet composition (% DM)
Low- stem High- stem Conventional SBB1
Low- stem corn residue 64.18
High- stem corn residue 64.18
Conventional corn residue 64.18
Sweet Bran® 29.76 29.76 29.76 86.24
Brome grass hay 3.31 3.31 3.31 9.59
Limestone 0.75 0.75 0.75 2.17
Supplement 2.00 2.00 2.00 2.00
1SBB represents a 9:1 ratio diet of Sweet Bran® to brome grass hay.

54 · 2017 Nebraska Beef Cattle Report
Conclusions
Harvest methods available allow the proportion of stem to be adjusted in the bale. Th e lack of diff erence in overall digest-ibility between high- stem and conventional would suggest similar proportion of plant components were harvested. Decreasing the number of stems cut to produce a low- stem bale, led to an increased overall digest-ibility which is likely due to the increased proportion of husk, leaf, and cob compared to the proportion of stem. Increasing the proportion of highly digestible compo-nents of corn residue in a bale can lead to increased quality.
Tasha M. King, graduate studentMelissa L. Jolly- Breithaupt, research technicianJana L. Gramkow, research technicianTerry J. Klopfenstein, professor emeritus, Animal ScienceJim C. MacDonald, associate professor, Animal Science
digestibility estimates of 76.0, 79.1, and 75.5% for DM, OM, and NDF; respectively. No diff erences in DM intake, OM intake or NDF intake were observed among residue types (P > 0.45). Low- stem had greater DM digestibility (DMD) than conventional (P = 0.02) and had a tendency to be greater than high- stem (P = 0.06). Th ere were no dif-ferences in DMD (P = 0.63) or OMD (P = 0.86) between high- stem and conventional residue. High- stem and conventional both contained all 8 rows of stem, supporting the fi ndings that DMD and OMD were similar allowing an average estimate (47 and 51%, respectively), to be used for the high- stem and conventional residues. High- stem had a NDFD greater than conventional (P < 0.01). Th is observation may suggest the conventional harvest method lost husk and resulted in a larger proportion of stem being gathered into the bale during raking. Low- stem had the greatest OMD and NDFD (P < 0.05) compared with high- stem and conventional which supports previous fi ndings that by decreasing the proportion of stem in the bale, the quality of the corn residue increases.
1 of 3 techniques: 1) 60°C forced air oven for 72 h; 2) 100°C forced air oven for 72 h; or 3) freeze drying. Dried samples were composited and ground through a 1- mm screen of a Wiley mill. Feedstuff samples were ground fi rst through a 2- mm screen of a Wiley mill and additionally through a 1- mm screen. Samples were then analyzed for DM, OM, and NDF.
Data were analyzed using the MIXED procedure of SAS (SAS Institute, Inc., Cary, NC). Lamb served as the experimental unit with period included in the model as a fi xed eff ect. Th e eff ect of drying method, harvest method, and lamb were examined.
Results
Drying method did not aff ect digestibili-ty determination for either OM digestibility (OMD) or NDF digestibility (NDFD; P = 0.63 and 0.62; respectively; Table 2). Intakes and digestibility estimates are reported for residue with Sweet Bran® and brome grass hay component removed (Table 3). Intakes were calculated from feed samples dried with the 60°C forced air oven. Th e Sweet Bran® and brome grass hay component had
Table 2. Eff ect of drying method on digestibility estimates.
60°C 100°C Freeze Dry SEM P- value
OMD, % 52.0 52.8 52.7 0.69 0.63
NDFD, % 52.8 52.4 51.8 0.73 0.62
Table 3. Eff ect of harvest method of corn residue on intake and total tract digestibility.
Low- stem High- stem Conventional SEM P- value
DM
Intake, %BW/d 1.36 1.43 1.49 0.11 0.45
digestibility, % 51.74a 47.22ab 46.05b 1.85 0.05
OM
Intake, %BW/d 1.31 1.32 1.40 0.10 0.60
digestibility, % 55.56a 51.05b 51.41b 1.72 0.06
NDF
Intake, %BW/d 1.13 1.12 1.10 0.08 0.94
digestibility, % 58.53a 52.37b 44.46c 1.85 < 0.01
a,b,cMeans with diff ering superscripts diff er (P < 0.05)
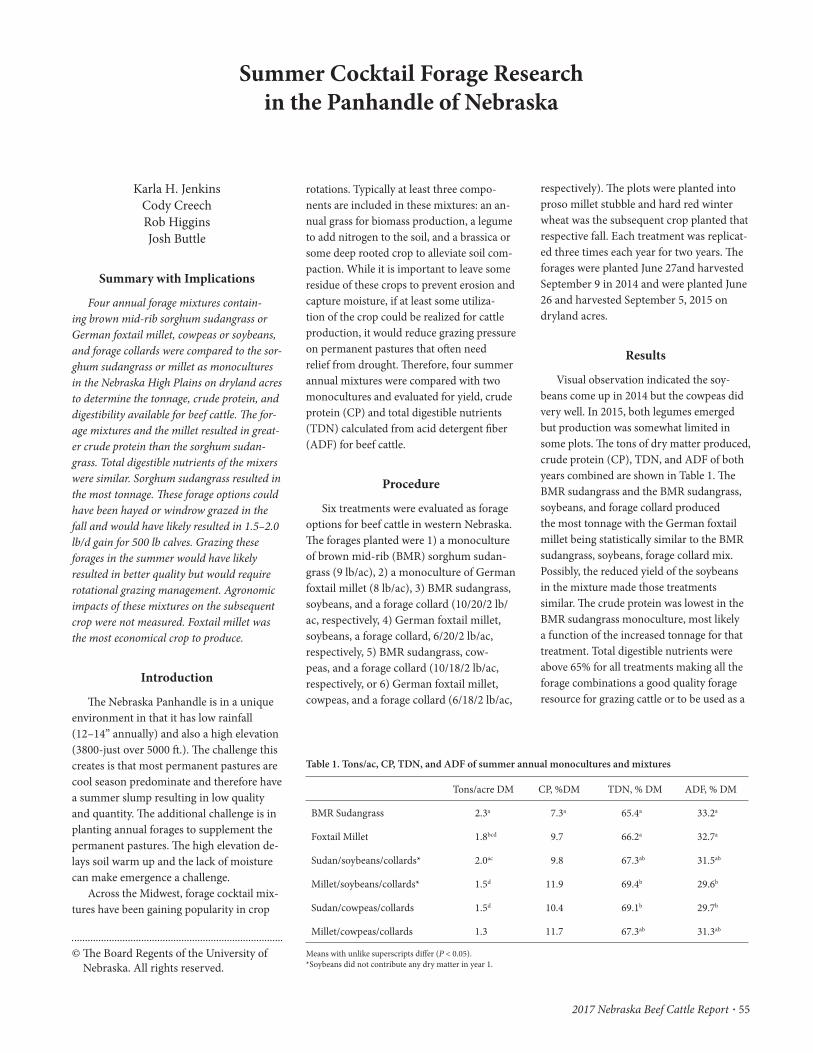
2017 Nebraska Beef Cattle Report · 55
© Th e Board Regents of the University of Nebraska. All rights reserved.
respectively). Th e plots were planted into proso millet stubble and hard red winter wheat was the subsequent crop planted that respective fall. Each treatment was replicat-ed three times each year for two years. Th e forages were planted June 27and harvested September 9 in 2014 and were planted June 26 and harvested September 5, 2015 on dryland acres.
Results
Visual observation indicated the soy-beans come up in 2014 but the cowpeas did very well. In 2015, both legumes emerged but production was somewhat limited in some plots. Th e tons of dry matter produced, crude protein (CP), TDN, and ADF of both years combined are shown in Table 1. Th e BMR sudangrass and the BMR sudangrass, soybeans, and forage collard produced the most tonnage with the German foxtail millet being statistically similar to the BMR sudangrass, soybeans, forage collard mix. Possibly, the reduced yield of the soybeans in the mixture made those treatments similar. Th e crude protein was lowest in the BMR sudangrass monoculture, most likely a function of the increased tonnage for that treatment. Total digestible nutrients were above 65% for all treatments making all the forage combinations a good quality forage resource for grazing cattle or to be used as a
rotations. Typically at least three compo-nents are included in these mixtures: an an-nual grass for biomass production, a legume to add nitrogen to the soil, and a brassica or some deep rooted crop to alleviate soil com-paction. While it is important to leave some residue of these crops to prevent erosion and capture moisture, if at least some utiliza-tion of the crop could be realized for cattle production, it would reduce grazing pressure on permanent pastures that oft en need relief from drought. Th erefore, four summer annual mixtures were compared with two monocultures and evaluated for yield, crude protein (CP) and total digestible nutrients (TDN) calculated from acid detergent fi ber (ADF) for beef cattle.
Procedure
Six treatments were evaluated as forage options for beef cattle in western Nebraska. Th e forages planted were 1) a monoculture of brown mid- rib (BMR) sorghum sudan-grass (9 lb/ac), 2) a monoculture of German foxtail millet (8 lb/ac), 3) BMR sudangrass, soybeans, and a forage collard (10/20/2 lb/ac, respectively, 4) German foxtail millet, soybeans, a forage collard, 6/20/2 lb/ac, respectively, 5) BMR sudangrass, cow-peas, and a forage collard (10/18/2 lb/ac, respectively, or 6) German foxtail millet, cowpeas, and a forage collard (6/18/2 lb/ac,
Karla H. JenkinsCody CreechRob HigginsJosh Buttle
Summary with Implications
Four annual forage mixtures contain-ing brown mid- rib sorghum sudangrass or German foxtail millet, cowpeas or soybeans, and forage collards were compared to the sor-ghum sudangrass or millet as monocultures in the Nebraska High Plains on dryland acres to determine the tonnage, crude protein, and digestibility available for beef cattle. Th e for-age mixtures and the millet resulted in great-er crude protein than the sorghum sudan-grass. Total digestible nutrients of the mixers were similar. Sorghum sudangrass resulted in the most tonnage. Th ese forage options could have been hayed or windrow grazed in the fall and would have likely resulted in 1.5– 2.0 lb/d gain for 500 lb calves. Grazing these forages in the summer would have likely resulted in better quality but would require rotational grazing management. Agronomic impacts of these mixtures on the subsequent crop were not measured. Foxtail millet was the most economical crop to produce.
Introduction
Th e Nebraska Panhandle is in a unique environment in that it has low rainfall (12– 14” annually) and also a high elevation (3800- just over 5000 ft .). Th e challenge this creates is that most permanent pastures are cool season predominate and therefore have a summer slump resulting in low quality and quantity. Th e additional challenge is in planting annual forages to supplement the permanent pastures. Th e high elevation de-lays soil warm up and the lack of moisture can make emergence a challenge.
Across the Midwest, forage cocktail mix-tures have been gaining popularity in crop
Summer Cocktail Forage Research in the Panhandle of Nebraska
Table 1. Tons/ac, CP, TDN, and ADF of summer annual monocultures and mixtures
Tons/acre DM CP, %DM TDN, % DM ADF, % DM
BMR Sudangrass 2.3a 7.3a 65.4a 33.2a
Foxtail Millet 1.8bcd 9.7 66.2a 32.7a
Sudan/soybeans/collards* 2.0ac 9.8 67.3ab 31.5ab
Millet/soybeans/collards* 1.5d 11.9 69.4b 29.6b
Sudan/cowpeas/collards 1.5d 10.4 69.1b 29.7b
Millet/cowpeas/collards 1.3 11.7 67.3ab 31.3ab
Means with unlike superscripts diff er (P < 0.05).*Soybeans did not contribute any dry matter in year 1.

56 · 2017 Nebraska Beef Cattle Report
growth in July and would have been diffi -cult to graze at that time. Rainfall returned to the area in early August and the forages grew rapidly. For producers trying to man-age summer annuals for grazing, this would have been challenging. In 2015 the rainfall totals were 2.10, 1.64, and 0.54 inches for June, July, and August, respectively, result-ing in more consistent growth.
Th ese results suggest if a producer wanted the forages in this experiment for fall windrow grazing or winter hay, they did produce acceptable tonnage and quality by early September. However, the expense of the seed must be carefully evaluated relative to the producers’ production and agronom-ic goals. Th is research was funded by the Nebraska Cattlemen’s Foundation and the seed was supplied by Green Cover Seed in Bladen, NE.
Karla H. Jenkins, associate professor, Animal Science, Panhandle Research and Extension Center, Scottsbluff Cody Creech, assistant professor, Agronomy and Horticulture, Panhandle Research and Extension Center, Scottsbluff Rob Higgins, former manager, High Plains Ag Lab, SidneyJosh Buttle, research technician, Panhandle Research and Extension Center, Scottsbluff
hay crop. Acid detergent fi ber was lowest for treatments containing mixtures.
Th e cost of the seed and the subsequent cost of the tons of forage DM, CP, and TDN were calculated (Table 2). Fertilizer, plant-ing, and harvesting costs were not included in the calculations as they were assumed to be the same for each treatment. Th e mono-culture of German Foxtail Millet produced the least expensive tons of DM, CP, and TDN. Adding the legumes and brassica to the annual grass substantially increased the cost of producing the forage. Th is study did not look at agronomic impacts of planting cocktails, only the quality of the forage mix-tures for beef cattle. Th e agronomic benefi ts on the subsequent crop would need to be substantial to off set the production costs of the mixtures. As previously mentioned, the crops were planted the last week of June. Possibly, more summer growth would have occurred if the crops had been planted the second week of June. Previous research at the High Plains Ag Lab near Sidney, NE has indicated that the window of opportunity for planting summer annuals in the Pan-handle is fairly narrow. In 2014 the rainfall totals for the area were 3.42, 0.35, and 2.91 inches for June, July, and August, respec-tively. As a result of the limited rainfall in July, the forage did not experience a lot of
Table 2. Seed, dry matter production, crude protein, and total digestible nutrients cost per acre of summer monocultures and mixtures
Seed cost/acre, $ Cost/acre for DM tons
produced, $
Cost/acre CP tons produced,$
Cost/acre tons of TDN
produced, $
BMR Sudangrass 13.50 5.87 80.41 8.97
Foxtail Millet 4.50 2.50 25.77 3.78
Sudan/soybeans/collards*
31.00 15.50 158.16 23.03
Millet/soybeans/collards*
19.00 12.67 106.44 18.25
Sudan/cowpeas/collards 34.00 22.67 217.95 32.80
Millet/cowpeas/collards 22.50 16.92 144.64 25.15

2017 Nebraska Beef Cattle Report · 57
© Th e Board Regents of the University of Nebraska. All rights reserved.
with 2 bags per sample per steer. Due to the number of bags, four runs of incubations were performed, one run per replication. Forty- eight bags were placed in a mesh bag and four mesh bags were placed in each steer during each incubation period. Aft er 36 hour incubation, bags were removed from the steers, rinsed 5 times in washing machine using a 1 min agitation and 2 min spin cycle and analyzed for NDF content. Bags were dried in a forced air oven at 100°C for 12 hours and then weighed. Solubles were considered 100% digestible and were calculated by subtracting the percentage of NDF from 100%. Th erefore, true digestibility is the sum of the solubles and digestible NDF (NDF content X NDF digestibility). Th e leaf samples collected on October 8 were not retained and therefore could not be analyzed.
Data were analyzed using the MIXED procedure of SAS (SAS Institute, Inc., Cary, N.C.). Th e experimental unit consisted of fi eld replication incubated within animal. Th e model included the eff ects of plant parts, row spacing, plant population and collection date, and their interactions. Covariate regression was used to deter-mine how plant parts changed over time in regards to NDF content, in situ NDF digestibility.
Results
Th ere was a signifi cant interaction (P < 0.05) of plant parts (PP) and plant popula-tion (POP) on NDF content, NDF digest-ibility and true digestibility of corn residue (Table 1). Th e PP by POP interaction infl u-enced NDF content and NDF digestibility of husk. When seeds were planted at 54,600 plants / acre, the NDF content of husk increased; however NDF digestibility also improved. Similarly, the greatest popula-tion increased NDF content and decreased the true digestibility of stem. At higher population both NDF digestibility and true digestibility of cob were improved. Th ere was no eff ect of row width on NDF content
Report, pp. 42– 43) and decreases as plants mature and NDF content increases (2015 Nebraska Beef Cattle Report, pp. 56– 58). Digestibility also may diff er between parts of the corn residue, and had been demon-strated to be greater for husk and lower for stem and cob (2015 Nebraska Beef Cattle Report, pp. 59– 61). However, the impacts of plant population and row spacing on NDF content and digestibility of corn residue have not been evaluated. Th erefore, the objectives of this project were to evaluate the NDF digestibility of residue parts for corn planted in diff erent row widths and populations over time.
Procedure
Th e experiment was conducted at the University of Nebraska— Lincoln Eastern Nebraska Research and Extension Center near Mead, Neb. Corn seeds of hybrid Stine 9733 and 9728 were planted on May 6, 2013 at 2 row widths: 15 and 30- inch rows, and 3 populations: 25,200, 35,000 and 54,000 seeds / acre. Additionally, corn plants were harvested for grain and corn residue samples collected at four dates October 8, October 24, November 5 and November 19 (Julian Dates 281, 297, 309 and 323 days, respectively). Plots were divided into 4 quarters; each quarter was a replication of the treatments. Samples from each quarter consisted of ten plants in a row repre-sentative of the fi eld and were separated into stem, leaf blade/sheath, husk/shank and cob. Samples were dried in a forced air oven at 60°C for 48 hours and ground through a 2- mm screen in a Wiley mill and analyzed for in situ NDF digestibility. Th e NDF in situ digestibility was expressed as a percentage of the original NDF content de-termined using a fi ber analyzer (ANKOM Technology Corp., Fairport, NY, USA). Two ruminally cannulated steers were used for this study were fed a mixed diet consisting of 70:30 forage- to- concentrate ratio (DM- basis). Approximately 1.25 g of sample were weighed into Dacron bags (50 μm pore size)
Viviane B. FerrariJanessa J. UpdikeJana L. HardingKeith Glewen
Terry J. KlopfensteinJim C. MacDonald
Summary with Implications
Plant density can be changed by altering row width and/or number of plants within a row. Th e use of narrower rows at seeding may increase yield and reduce plant- to- plant competition. Corn seeds were planted at 2 row widths (15 and 30- inch rows) and 3 plant populations (25,200, 35,000 and 54,000 seeds / acre). Samples of corn residue were collected 4 dates (October 8, October 24, November 5 and November 19) post- harvest and separated into cob, stem, leaf and husk to determine changes in quality over time. Th e greatest plant population increased the NDF content and NDF digest-ibility of husk, NDF and true digestibilities of cob, NDF content of stem, and decreased the true digestibility of the stem. Th e NDF content of the leaves and stem increased over time while the NDF and true digestibilities of cob decreased over time. Row width did not aff ect the corn residue. Planting densities and management strategies can aff ect the digestibility of leaf and husk and may impact residue quality.
Introduction
Plant density can be changed by either altering row width and/or number of plants within a row. Th e use of narrower rows at seeding may increase yield per area and reduce plant- to- plant competition by increasing the distance between plants in a row, which allows more effi cient use of light, water and nutrients. However, corn si-lage quality is usually inversely proportional to plant yield (2013 Nebraska Beef Cattle
In Situ Digestibility of Residue Parts of Corn Planted in Diff erent Populations and Row Widths

58 · 2017 Nebraska Beef Cattle Report
(P = 0.19), in situ NDF digestibility (P = 0.37) or true digestibility (P = 0.84).
Time aff ected the quality of parts of corn residue. Th e NDF content increased linearly for leaf (P < 0.01, Figure 1) and quadratically for stem (P =0.05) over time. Th e NDF content of stem increased from 51.54 to 57.93% and leaf NDF from 73.17 to 76.52%. Th ere was a quadratic response of NDF content of cob (P < 0.01) and husk (P = 0.01) over time. However, this variation was small compared to other parts of the plant, ranging from 85.44 to 87.96% for cob and from 77.20 to 80.14% for husk. Th e di-gestibility is expected to decrease due to the increase in NDF as plant matures, which is correlated with decreased soluble content in the plant. However, when all samples were collected the plant was already mature and dry so minimal changes may have occurred due to plant metabolism. It is not clear, but a possible explanation could be the solubles decrease by volatilization or microbial activity increasing the proportion of NDF and altering digestibility.
Th ere were linear decreases (P < 0.01) and quadratic responses (P < 0.01) of in situ NDF digestibility of cob and stem over time (Figure 2), respectively. Cob in situ NDF digestibility decreased 13.2%, ranging from 40.1 to 34.8% from the fi rst to the last col-lection date, being the most negatively af-fected part of the plant over time regarding NDF digestibility. Th e NDF digestibility of husk and leaf remained unaff ected by dates of collection (P > 0.05, Figure 2) which are also the parts of the plant of greatest quality. Th ese results are supported by previous work (2015 Nebraska Beef Cattle Report, pp. 59– 61) which also found a quadratic decrease of cob digestibility and no eff ect on leaf and husk over time.
90
85
80
75
70
65
60
55
50281 286 291 296 301 306 311 316 321 326
COB HUSK LEAVES STEM
Julian Date
ND
F, %
DM
55
50
45
40
35
30281 286 291 296 301 306 311 316 321 326
COB HUSK LEAVES STEM
Julian Date
In si
tu N
DF
dige
stib
ility
, %N
DF
Table 1. Eff ect of plant parts and population on neutral detergent fi ber and in situ neutral detergent fi ber digestibility.
Item Cob Husk Leaf Stem SEM P- value2
25,2001 35,000 54,600 25,200 35,000 54,600 25,200 35,000 54,600 25,200 35,000 54,600 PP POP PP x POP
NDF 85.49 87.32 86.63 77.09b 78.75b 81.02a 73.95 73.96 76.02 54.42ab 53.16b 55.94a 0.72 <0.01 <0.01 0.05
NDFD3 36.47b 36.32b 40.22a 49.86b 51.33ab 52.07a 47.26 47.70 47.93 34.26 34.76 33.64 0.73 <0.01 0.01 <0.01
TD4 45.68b 44.41b 48.19a 61.33 61.70 61.36 61.07 61.40 60.42 64.18ab 65.31a 63.04b 0.74 <0.01 <0.01 0.05
a,b Means with diff erent superscripts are diff erent within each plant part.1 Plant population (number of seeds / acre).2PP = main eff ect for plant part; POP = main eff ect for plant population; PP x POP = interaction of plant part and plant population.3 NDFD = Neutral detergent fi ber digestibility.4 TD = True digestibility.
Figure 1. Neutral detergent fi ber content of corn residue plant parts over time.
Figure 2. Neutral detergent fi ber digestibility of corn residue plant parts over time.

2017 Nebraska Beef Cattle Report · 59
and cob increased regardless the row width. Th e cob was the most negatively aff ected part of the plant by time, with small chang-es for leaf and husk. Harvest techniques could be developed to increase the pro-portion of leaf and husk of corn residue to increase animal intake and performance.
Viviane B. Ferrari, visiting researcher (FAPESP protocol number 2015/17108– 4)Janessa J. Updike, graduate studentJana L. Harding, research technicianKeith Glewen, extension educatorTerry J. Klopfenstein, professor emeritusJim C. MacDonald, associate professor Animal Science, Lincoln
Th e true digestibility of cob, leaf and stem were linearly decreased (P < 0.01, Figure 3) across time, decreasing 9.0, 3.13 and 6.1%, respectively. Th e true digestibility of husk had a quadratic response (P > 0.01), with a small range from 60.56 to 62.67%. Th e true digestibility of stem was greater than reported in previous research (2015 Nebraska Beef Cattle Report, pp. 59– 61), that found true digestibility of approximate-ly 42% and can be explained by the lower NDF content.
Conclusions
When seeds were planted in a greater population, the NDF digestibility of husk
70
65
60
55
50
45
40281 286 291 296 301 306 311 316 321 326
COB HUSK LEAVES STEM
Julian Date
True
dig
estib
ility
, %
Figure 3. True digestibility of corn residue plant parts over time.

60 · 2017 Nebraska Beef Cattle Report
© Th e Board Regents of the University of Nebraska. All rights reserved.
spectively. To determine changes in forage quality throughout each grazing period, 6 ruminally fi stualed steers were allowed to graze the fi eld replications at the initiation and completion of each grazing season. Prior to sampling, rumen contents were removed from each steer. Fistulated steers were then transferred to the corn residue fi eld where 3 steers per replication were allowed to graze. Aft er approximately 30 minutes of grazing, freshly consumed feed was collected from each steer’s rumen and placed in a cooler for later analysis. Former rumen contents were returned to the rumen. Collected samples were analyzed for in vitro organic matter digestibility (IVOMD) using the Tilley and Terry meth-od, which was modifi ed with the inclusion of 1 gram of urea to the buff er. Th e IVOMD values were also adjusted using in vivo corn residue and grass hay standards. Digestible organic matter (DOM) was then calculated by multiplying the IVOMD and percent or-ganic matter of the original residue sample. A starch analysis (Megazyme Total Starch Assay, Megazyme International Ireland Ltd., Ireland) was conducted to determine the percentage of grain within diet samples.
All data were analyzed using the mixed procedure of SAS. Corn plant data included treatment (spring and fall grazed), crop ro-tation, and plant part (husk, leaf blade, and leaf sheath) as fi xed eff ects. Data from corn residue diet samples included treatment (spring and fall) and time (beginning and end of grazing season) as fi xed eff ects.
Th erefore, the direct objective of this study was to determine diet quality of a corn residue fi eld throughout fall and spring grazing periods. A secondary objective was to evaluate the eff ects of crop rotation on subsequent corn residue quality.
Procedures
Corn plant samples
An irrigated cornfi eld located at the Eastern Nebraska Research and Exten-sion Center (ENREC) was utilized in the study. Th e fi eld consisted of 2 sections with diff erent crop rotations: 1) corn- corn rota-tion and 2) corn- soybean rotation. Th ree treatments (fall grazed, spring grazed, and non- grazed) with four replications of each treatment have been applied to the fi eld annually. Ten consecutive whole corn plant samples harvested above the anchor root were collected from each fi eld replica-tion prior to grain harvest. Plant samples were separated into individual plant parts (leaf, sheath, husk) and weighed for DM. Plant parts were then composited within replication and analyzed for in vitro organic matter digestibility (IVOMD), digestible organic matter (DOM), and starch.
Corn residue diet samples
Following grain harvest of the corn fi eld, cow- calf pairs grazed the fall grazed (November to February) and the spring (March) fi eld replications at a stocking rate of 1.4 and 0.5 acres per cow- calf pair, re-
Shelby E. GardineGavin L. Harsh
Robert G. BondurantJana L. GramkowAndrea K. Watson
Terry J. Klopfenstein
Summary with Implications
Changes in in vitro organic matter digest-ibility and digestible organic matter of corn residue were evaluated throughout the fall grazing and spring grazing seasons. In vitro organic matter digestibility and digestible organic matter were greatest at the beginning of fall grazing and declined over time. Slight weathering resulted in lower quality corn residue available at the beginning of spring grazing compared to the beginning of fall grazing. Th e in vitro organic matter digest-ibility of available residue declined 21% over the fall grazing season and 51% throughout the spring grazing season. As the availability of nutrients declines over time, adjustments in feeding management or rotational grazing may be necessary to meet energy require-ments of grazing cattle.
Introduction
With the conversion of much grassland to cropland, supply of traditional forage resources has been challenged. However, an increase in acres being planted for corn production has resulted in greater availabil-ity of corn residue, which can be a valuable feed resource for grazing situations. Over time, corn residue quality will vary due to selective grazing of the higher quality plant parts (husk and leaves) and weath-ering. Characterizing a corn residue fi eld for nutrient quality throughout a grazing period is important because adjustments in feeding management or rotational grazing may be necessary to meet the nutrient requirements of animals grazing the fi eld.
Corn Residue Quality throughout the Grazing Season
Table 1. Yield of residue measured by clipping individual corn plants (% of grain)
Treatment1
Fall grazed Spring grazed Non- grazed SEM P- value
Husk 5.8 6.1 5.3 0.32 0.22
Leaf 17.6 18.2 16.9 1.04 0.68
Sheath 8.6 8.7 8.2 0.49 0.77
Cob 9.1 9.4 8.5 0.39 0.311 Treatments were due to timing of cattle grazing residue 2 years prior to these samples being collected. Ten plants were collected
from each of 4 replications per treatment.

2017 Nebraska Beef Cattle Report · 61
decline in quality over time was greater for spring grazing, 51 and 52% for IVOMD and DOM, respectively.
Starch in the diet samples ranged from 0.04% to 6.44% (average of 1.6%) at the be-ginning of both grazing seasons. Th e broad range in starch content indicates signifi cant variability expressed in grazing selection among steers. Given that corn consists of 70% starch, approximately 2.2 % of the steer’s diet contained corn at the start of the grazing season.
Th e higher DOM of the corn residue diet samples observed at the beginning of both grazing seasons would suggest that cattle are selectively eating the husk and grain within the fi eld. Th e diff erence in DOM observed between the beginning and end of both grazing seasons is evident that as the availability of husk and grain de-creases, cattle begin to consume the leaves. Leaves are lower in IVOMD than husks and even lower in DOM because they have a high ash content (approximately 15% ash). In addition, the lower DOM observed at the beginning of the spring grazing compared to the beginning of the fall grazing would indicate that weathering may be responsible for a portion of DOM reduction.
Conclusion
Th e energy content that a corn residue fi eld provides to grazing cattle is greatest at the beginning of the fall grazing season. However, as cattle selectively consume the higher digestible plant parts and weather-ing deteriorates the corn residue, the fi eld provides less and less energy to the cattle. Characterizing a fi eld for its nutrient profi le is important during the grazing season. As the availability of nutrients declines over time, adjusting feeding management or uti-lizing rotational grazing may be necessary to continue to meet energy requirements of the grazing cattle.
Shelby E. Gardine, graduate studentGavin L. Harsh, undergraduate studentRobby G. Bondurant, research technicianJana L. Gramkow, research technicianAndrea K. Watson, research assistant professorTerry J. Klopfenstein, professor, University of Nebraska- Lincoln Department of Animal Science, Lincoln, NE
were greatest for the husk, intermediate for leaf blade, and least for leaf sheath.
A treatment by time interaction was ob-served for IVOMD of the corn residue diet samples (P < 0.01; Table 4). Th e IVOMD was greatest at the beginning of the fall and spring grazing seasons, intermediate at the end of the fall grazing, and least for the end of the spring grazing season.
A treatment by time interaction was also observed for DOM of the corn residue (P = 0.01). Th e beginning of the fall grazing season had the greatest DOM compared to all other time points within both grazing seasons. Th e beginning of spring grazing had greater DOM than the end of fall grazing. Digestible OM was least for the end of the spring grazing compared to all other grazing time points. From initiation of grazing to the end of the grazing season, IVOMD declined 21% while DOM declined 32% for the fall grazed treatment. Th e
Results
Amount of residue (as a percentage of grain) per plant is shown by treatment (Table 1). Th e average amount of leaf blade, leaf sheath, and husk was 31.8 % of the grain. Th at is 21 lb of residue dry matter/bu of corn at 15.5% moisture. Th is diff ers with previous research in which 15.8 lb of leaf and husk were produced per bu of corn (2016 Nebraska Beef Cattle Report, pg 71- 73). Grain yield averaged 217 bu/acre and was not infl uenced by any treatments.
No signifi cant diff erence was observed for corn residue IVOMD or DOM between the corn- soybean rotation and corn- corn rotation (P- value ≥ 0.95; Table 2). Previous treatment (fall, spring, or non- grazed) also did not aff ect IVOMD or DOM of corn res-idue harvested prior to grazing (P ≥ 0.97). Plant parts did diff er in IVOMD and DOM (P < 0.01; Table 3). Th e IVOMD and DOM
Table 2. In vitro organic matter digestibility and digestible organic matter of corn plant samples by area
Area
Item C- SB1 C- C2 SEM P- value
IVOMD3, % 44.3 44.0 3.0 0.96
DOM4, % 40.8 40.5 3.2 0.951Area that was in a corn- soybean rotation2Area that was in a corn- corn rotation3In vitro organic matter digestibility4Digestible organic matter (as a % of dry matter); calculated as OM content (%) × IVOMD (%)
Table 3. In vitro organic matter digestibility and digestible organic matter of corn plant parts
Husk Leaf Blade Leaf Sheath SEM P- value
IVOMD1, % 60.0a 39.7b 32.7c 0.6 <0.01
DOM2, % 58.1a 33.7b 30.2c 0.6 <0.011In vitro organic matter digestibility2Digestible organic matter (as a % of dry matter); calculated as OM content (%) × IVOMD (%)abcMeans within a row with unique superscripts diff er (P < 0.05)
Table 4. In vitro organic matter digestibility and digestible organic matter of corn residue diet samples by treatment and time1
Fall Spring P- value2
Item Beginning End Beginning End SEM Trt Time Int.
IVOMD
3, %62.1 a 48.9 b 58.6 a 29.0 c 3.0 <0.01 <0.01 <0.01
DOM4, % 58.5 a 40.0 c 53.5 b 25.7 d 2.9 <0.01 <0.01 0.041Treatments are due to timing of grazing (fall or spring) and timing of sample collection (at the beginning or end of grazing).2Trt= fi xed eff ect of treatment; Time= fi xed eff ect of time; Int. = treatment × time interaction3In vitro organic matter digestibility4Digestible organic matter (as a % of DM); calculated as OM content (%) × IVOMD (%); adjusted for ash content of salivaabcdMeans within a row with unique superscripts diff er (P < 0.05)

62 · 2017 Nebraska Beef Cattle Report
© Th e Board Regents of the University of Nebraska. All rights reserved.
during d 1– 12 and reduced to 95% of ad libitum intake for d 13– 21. During the adaptation period, lambs were housed in individual pens with grate fl oors, individual feed bunks and automatic waterers. Feeding occurred twice daily at approximately 0800 and 1500, and orts were collected, weighed, and fed back during the adaptation period.
At the end of the adaption period, lambs were moved to individual metabo-lism crates and fi tted with harnesses and fecal collection bags. Total fecal output was collected twice a day beginning on d 14 at approximately 0800 and 1500, weighed and retained. Orts were collected at feeding, weighed, and retained for analysis. Total fecal material and orts were composited at the end of the collection period and three sub- samples were taken for analysis. Samples were dried in a 60˚C forced air oven (orts for 48 h and feces for 72 h) and then ground through a 1- mm screen in a Wiley mill. Diet and fecal samples were analyzed for dry matter (DM), organic matter (OM) and neutral detergent fi ber (NDF). Ground feed and fecal samples were dried in a 100˚C oven for 24 h to determine lab- adjusted DM, and then incinerated in a muffl e furnace at 600˚C to determine the ash content to calculate OM. Neutral detergent fi ber was determined by refl uxing samples in beakers for 1 h. Total tract apparent digestibility was calculated using DM, OM, and NDF disappearance. Treatment diets were fed over 6 periods, with the non- residue proportion (Sweet bran, Brome grass and mineral) of the diet fed in an additional period at 2% of BW to determine the digestibility of the corn residue by diff erence.
Data were analyzed using the MIXED procedure of SAS (SAS Inst., Inc., Cary, N.C.). Lamb was the experimental unit, and the model included harvest method, ammoniation, period and a harvest method by ammoniation interaction. Period and lamb were treated as fi xed eff ects, and interactions were assessed for inclusion in the model. Signifi cance was declared when α ≤ 0.05.
the proportion of tailings (relative to lower stalk) results in improved in vitro digest-ibility (2015 Nebraska Beef Cattle Report, pp. 62– 63). Although no diff erence in in vivo dry matter digestibility (DMD) was observed between corn residue harvested with 4 Rows (49.9%) vs. 8 Row (48.5%; 2016 Nebraska Beef Cattle Report, pp. 74– 75), more recent results (2017 Nebraska Beef Cattle Report, pp. 53–54) demonstrate residue harvested with 2 rows of stalks being chopped had greater DMD (51.7%) when compared to conventionally baled residue (46.1%). Additionally, ammonia-tion improves both digestibility and intake of low quality forages, such as baled corn residue. Th e objective of this study was to determine the eff ect of harvest method and ammoniation on the intake and digestibility of baled corn residue in lambs.
Procedure
Nine crossbred wether lambs (108.6 ± 16.5 lbs BW) were fed in a 126- d diges-tion trial using an unbalanced 9 x 6 Latin rectangle design with a 3 x 2 factorial treatment structure. Treatment diets con-sisted of corn residue harvested using three diff erent methods: conventional rake and bale (CONV), a New Holland Cornrower™ chopping stalks from all 8 rows (8ROW), and stalks from 2 rows (2ROW) of corn being harvested by the combine into a windrow containing the tailings (leaf, husk and upper stalk) from 8 rows. Anhydrous ammonia was added at 5.5% of DM to a portion of each of the baled residues and allowed to sit for 33 d in black plastic in July of 2015, resulting in three more treatment diets: conventional ammoniated (CONVAM), 8- Row ammoniated (8RAM) and 2- Row ammoniated (2RAM). Diets consisted of 64.2% corn residue, 29.8% Sweet Bran, 3.3% smooth- bromegrass hay, and 2.8% mineral mix (DM basis). Six 21 d periods consisted of 14 d adaptation and 7 d total fecal collection. Lambs were fed ad libitum (110% of the previous day’s DMI)
Ashley C. ConwayTasha M. King
Melissa L. Jolly- BreithauptJames C. MacDonaldTerry J. KlopfensteinMary E. Drewnoski
Summary with Implications
Th e eff ects of three harvest methods, both with and without ammonia treatment, on the in vivo digestibility and intake of baled corn residue were assessed in a digestion trial with lambs. Treatments included three corn residue harvest methods (conventional rake and bale, New Holland Cornrower™ with eight rows or with two rows of corn stalks chopped into the windrow contain-ing the tailings [leaf, husk and upper stalk] from eight harvested rows) and the eff ects of ammoniation at 5.5% of DM compared to no ammoniation of the residue. Th e 2- Row baled residue (51.7%) had greater dry matter digestibility than both 8- Row (47.3%) and CONV (44.7%). Ammoniation increased dry matter digestibility by 24% (10 percentage units) across all residue types. Additionally, ammoniation increased intake. Utilizing alternative harvesting technologies and ammoniation can improve the digestibility of baled residue. Th ese eff ects are additive and combining the two technologies resulted in the greatest improvement in digestibility.
Introduction
Technologies designed to improve the feeding value of corn residue are becoming more relevant for beef producers. Th e New Holland Cornrower™ varies the proportion of lower stalk to leaf, husk, and upper stalk (tailings) in the corn residue bale by chop-ping 2, 4, 6, or 8 rows of stalk from the 8 harvested corn rows in to the windrow that will be baled. Th e digestibility of diff erent parts of the corn plant varies and increasing
Eff ect of Harvest Method and Ammoniation on Digestibility and Intake of Corn Residue

2017 Nebraska Beef Cattle Report · 63
digestibility by 27% (11.9 percentage units; P = 0.01) and 2- Row increasing NDFD by 46% (19.9 percentage units; P < 0.01) over conventionally harvested residue. Digest-ibility of OM was not aff ected (P = 0.12) by harvest method. Ammoniation improved (P < 0.01) DM, OM, and NDF digestibility for all harvest methods (Table 2), resulting in a 24% and 21% (10.1 percentage units; P < 0.01 ) increase in digestibility for DM and OM, respectively, and a 37% increase (16.6 percentage units; P < 0.01) in NDF digestibility.
Conclusions
Consistent with other studies, changing the proportion of husk and leaf to stalk in baled residue can infl uence digestibility characteristics. No diff erence DM and OM digestibility was observed between 2- Row and 8- Row (non- ammoniated) in this study but there was a signifi cant improvement in DM, OM, and NDF digestibility between the 2- Row and conventional rake and bale. Moreover, ammoniation increased intake and all digestibility characteristics of the corn residue regardless of harvest method, and was additive with harvest method.
Ashley C. Conway, Graduate StudentTasha M. King, Graduate StudentMelissa L. Jolly- Breithaupt, Research TechnicianJames C. MacDonald, Associate ProfessorTerry J. Klopfenstein, ProfessorMary E. Drewnoski, Assistant Professor, UNL Department of Animal Science, Lincoln, Neb.
signifi cantly diff erent both from each other and from non- ammoniated diets (P = 0.03). Th ere was no harvest method by ammoni-ation interaction (P ≥ 0.82) for OM, DM or NDF digestibility (NDFD). Harvest method aff ected DMD (P = 0.04) and NDFD (P < 0.01) of the residue (Table 1). Harvesting with the New Holland Cornrower™ with 8 rows of stalks chopped resulted in a 6% increase (2.6 percentage units; P = 0.34) in DMD and harvesting with 2 rows increased DMD by 15% (7 percentage units; P = 0.01) compared to conventional rake and bale method. Th e eff ect was more pronounced in NDFD, with 8- Row increasing NDF
Results
Th ere was a harvest method by ammo-niation interaction (P < 0.01) for ad libitum whole diet DMI (d 7– 11). Th e intake of di-ets containing non- ammoniated residue did not diff er (P ≥ 0.92) among harvest meth-ods and were consistent at 2.6% BW. Con-versely, ammoniation increased intake for all harvest methods, and the amount of re-sponse varied among harvest method. Th is resulted in intake being greatest for 2RAM at 4.1% BW, intermediate for COVAM at 3.6% BW and 8RAM showing the smallest increase in DMI at 3.1% BW, which were all
Table 1. Eff ect of harvest method on dry matter (DMD), organic matter (OMD) and neutral detergent fi ber (NDFD) digestibility of baled corn residue1.
CONV 8- Row 2- Row SEM P- value
Residue DMD,%
44.7 47.3 51.7 1.9 0.03
Residue OMD,%
50.5 51.5 55.4 1.7 0.12
Residue NDFD, %
42.7 54.1 62.7 2.8 <0.01
1Th e non- residue portion of the diet was fed alone in a separate feeding period to determine digestibility. Residue digestibility was calculated by removing the contribution of non- residue component of the diet.
Table 2. Eff ect of post- harvest ammoniation treatment at 5.5% of DM on the dry matter (DMD), organic matter (OMD) and neutral detergent fi ber (NDFD) digestibility of corn residue1.
Non- ammoniated Ammoniated SEM P- value
Residue DMD,% 42.8 53.0 1.4 <0.01
Residue OMD,% 47.4 57.4 1.7 <0.01
Residue NDFD, % 44.8 61.4 2.3 <0.01
1Th e non- residue portion of the diet was fed alone in a separate feeding period to determine digestibility. Residue digestibility was calculated by removing the contribution of non- residue component of the diet.

64 · 2017 Nebraska Beef Cattle Report
© Th e Board Regents of the University of Nebraska. All rights reserved.
from the cows. Forage was also clipped by hand in an eff ort to collect a sample representative of plants and plant parts consumed by cattle. Th is collection was subjective, and attempted to collect what the cows were potentially grazing.
Collections for subirrigated meadow
Fecal samples were directly collected from 10 cows early in the months of July, September, and November of 2015 grazing subirrigated meadow. Th ree esophageally fi stulated cows grazed the meadow pasture and diets were collected, the same time the fecal samples were collected from the cows. Th e meadows were divided into 4 pastures. Th e pasture rotation allowed each pasture to be grazed twice in the growing season.
AssumptionsTwo assumptions were made: 1) the
models used in the NUTBAL program rep-resented similar forage quality and values as native Sandhills grassland in Nebraska; and 2) Fistulated animals were selecting the same diets as the grazing cows.
Other considerations included: 1) To minimize the loss of nitrogen from the manure (cow patty on the ground), fecal samples were taken directly from the cow’s rectum while restrained in a cattle handling facility. 2) Total Digestible Nutrients (TDN) reported for fecal samples was calculated from the NUTBAL energy DOM. Th e NUTBAL DOM was converted to TDN by multiplying the DOM value reported by the GAN lab by 1.06. (NRCS Enhancement Activity 65, 2015). 3) Some nitrogen can be recycled in the saliva of the cows, therefore potentially increasing the CP estimates of the esophageally fi stulated cow’s diet.
Statistical AnalysisData were analyzed using the Mixed
Procedure in SAS with sample collection method used as the fi xed eff ect. Diff erences were considered signifi cant when P < 0.10 were observed.
nology developed by the Grazing Animal Nutrition Lab (GAN Lab) in Temple, TX.
Th e objective of this study was to com-pare forage quality estimations from forage samples collected with fi stulated grazing animals, hand- clipping, and fecal samples collected for NUTBAL analysis on Nebras-ka Sandhills rangelands.
Procedure
Comparisons were made between forage diets collected from esophageally fi stulated cows, fecal samples from cows grazing in the same pastures, and from hand- clipped quadrats. Th e esophageal diets (forage the cow ate, chewed, and expelled into a collec-tion bag when swallowed) and the hand- clipped samples were evaluated for crude protein (CP) and energy (total digestible nutrients [TDN]) by wet chemistry analysis in a commercial laboratory (Ward Labs, Kearney NE). Th e fecal samples were eval-uated for crude protein and energy (in the form of digestible organic matter [DOM]) through the NUTBAL program utilizing NIRS. Two locations were evaluated; upland pastures (warm- season grass dominated) and subirrigated wet meadows (cool- season grass dominated) at the Gudmundsen Sandhills Lab near Whitman, NE. Hand- clipped forage samples were only collected within the upland pastures. Diet, fecal and clipped samples were collected in July, September, and November. Fecal samples were dried at 50 degree C for 72 hours prior to shipping for NUTBAL analysis.
Collections for upland pasture
Fecal samples were directly collected from 10 cows early in the months of July, September, and November of 2015. Cows were grazing upland rangeland at moder-ate stocking rates. Cows were in the same pasture from June to November. Th e cows ranged in age from 3 to 9 years old. Th ree esophageally fi stulated cows grazed the upland pasture and diets were collected, the same time the fecal samples were collected
Bethany M. JohnstonJay D. Jenkins
Jacki A. MusgraveL. Aaron Stalker
Mitchell B. Stephenson
Summary with Implications
Diff erences in forage quality (crude protein and energy) were analyzed between esophageally fi stulated diets, analysis of fecal samples with Nutrition Balance Analyzer (NUTBAL) analysis, and analysis of hand- clipped forage samples. On upland range sites, hand- clipped samples provided forage quality estimates that were closer to esophageally fi stulated diets than samples analyzed with the NUTBAL analysis. Aft er one year of data collection, it appears that there may be some inconstancies with the NUTBAL analysis for estimates on rangeland forage quality in the Nebraska Sandhills. More data is needed to verify these results; however, making man-agement supplementations decisions solely on the NUTBAL analysis may not always be accurate on Sandhills rangeland.
Introduction
Forage quality is diffi cult for beef cattle producers to measure. Researchers use fi stulated animals to collect diets directly from the esophagus or rumen, but most cattlemen do not have access to fi stulated animals. Hand- clipped rangeland forage samples that are analyzed at forage analysis laboratories (e.g., Ward Labs, etc.) do not always refl ect the selectivity of grazing animals. Th e Nutrition Balance Analyzer (NUTBAL) forage quality analysis method attempts to measure forage crude protein and energy through the analysis of fecal samples collected by producers. Near In-frared Refl ectance Spectroscopy (NIRS) is conducted on fecal samples and combined with client information and research/tech-
Comparison of diets collected from esophageally fi stulated cows to forage quality estimated from fecal analysis

2017 Nebraska Beef Cattle Report · 65
Results & Discussion
Th e fi rst year (of a three year study) of data collected from esophageally fi stulated steers compared to NUTBAL analyzed and hand- clipped samples resulted in signifi -cantly diff erent measures in forage quality.
Upland Range: Crude Protein and Energy (TDN):
In July and November, diet samples contained substantially more (P ≤ 0.09) CP than NUTBAL samples, but in September CP content of both diet and NUTBAL samples were similar (P > 0.10) (Table 1). In all three months TDN were infl ated (P < 0.05) by the NUTBAL analysis. In July the NUTBAL estimate of TDN was 2.5 percentage units greater than the fi stulated cow samples, but in November the value was elevated by 7.1 percentage units. A TDN estimate off by 7.1 percentage units has dramatic impact on nutritional status of an animal and would result in erroneous supplementation recommendations.
Hand- clipped samples were lower in CP and TDN than diet samples in all instances, however, the clipped samples were similar to diet samples more oft en than were NUTBAL estimates.
Meadows: Crude Protein and Energy (TDN):
In all three months the NUTBAL meth-od underestimated (P ≤ 0.09) the amount of CP in the diet (Table 2). Diff erences between fi stulated diets and NUTBAL esti-mates of TDN content were not consistent. NUTBAL overestimated (P < 0.01) TDN in July, underestimated (P = 0.09) TDN in September, and was similar (P = 0.99) to the diet in November. No hand- clipped samples were taken on the wet meadows.
Except for upland range samples collected in the month of September, NUTBAL consistently under estimated the amount of CP being consumed by grazing cattle for both upland range and meadow. Generally, NUTBAL overestimated the amount of TDN cattle were consuming on upland range, but was not consistent in the estimate of TDN on meadow. Th e lack
Table 1. Crude protein (CP) and total digestible nutrient (TDN) content of diets collected from upland range by esophageally fi stulated cattle compared with NUTBAL analysis of fecal samples and clipped forage
Item Diet NUTBAL Clipped SE P- value
CP
Jul 9.0a 7.5b 7.6ab 0.5 0.09
Sep 7.2a 7.4a 5.1b 0.4 < 0.01
Nov 6.0b 4.2a 5.3ab 0.5 0.01
TDN1
Jul 60.1b 62.6a 55.8c 0.9 < 0.01
Sep 55.8b 62.0a 54.4b 1.3 < 0.01
Nov 52.9b 60.0a 47.8b 1.3 < 0.01
1Digestible organic matter reported by the Grazing Animal Nutrition Lab report was converted to TDN by multiplying DOM by 1.06.
Table 2. Crude protein (CP) and total digestible nutrient (TDN) content of diets collected from subirrigated meadows by esophageally fi stulated cattle compared with NUTBAL analysis of fecal samples
Item Diet NUTBAL SE P- value
CP
Jul 10.7 6.7 0.6 < 0.01
Sep 9.6 8.5 0.5 0.09
Nov 8.3 4.7 0.3 < 0.01
TDN
Jul 58.7 61.5 0.6 < 0.01
Sep 64.0 62.4 0.7 0.09
Nov 57.8 57.7 1.6 0.99
Table 3. Actual body weight and body condition score of cows grazing upland range or meadow
Item Jun Jul Sep Nov
Upland range
Body Weight, lbs. 954 909 968 1006
Body Condition Score 5.1 5.2 5.4 5.2
Meadow
Body Weight, lbs. 1020 975 1022 1086
Body Condition Score 5.1 5.2 5.3 5.5
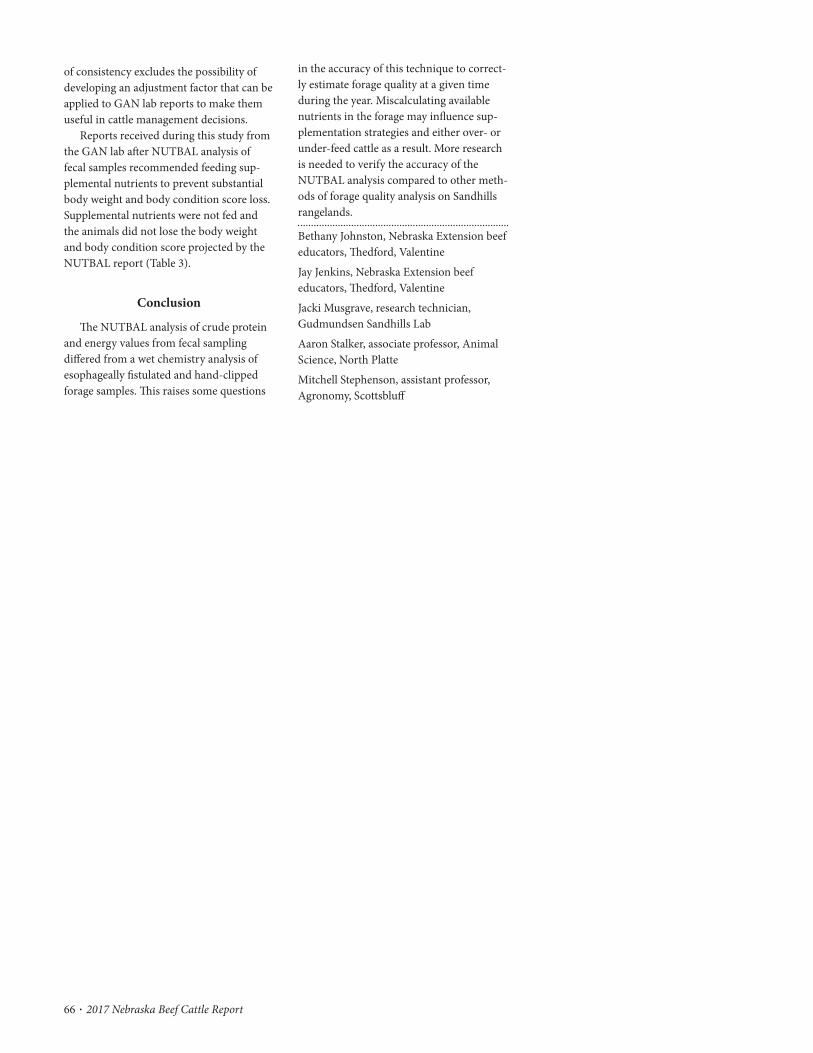
66 · 2017 Nebraska Beef Cattle Report
in the accuracy of this technique to correct-ly estimate forage quality at a given time during the year. Miscalculating available nutrients in the forage may infl uence sup-plementation strategies and either over- or under- feed cattle as a result. More research is needed to verify the accuracy of the NUTBAL analysis compared to other meth-ods of forage quality analysis on Sandhills rangelands.
Bethany Johnston, Nebraska Extension beef educators, Th edford, ValentineJay Jenkins, Nebraska Extension beef educators, Th edford, ValentineJacki Musgrave, research technician, Gudmundsen Sandhills LabAaron Stalker, associate professor, Animal Science, North PlatteMitchell Stephenson, assistant professor, Agronomy, Scottsbluff
of consistency excludes the possibility of developing an adjustment factor that can be applied to GAN lab reports to make them useful in cattle management decisions.
Reports received during this study from the GAN lab aft er NUTBAL analysis of fecal samples recommended feeding sup-plemental nutrients to prevent substantial body weight and body condition score loss. Supplemental nutrients were not fed and the animals did not lose the body weight and body condition score projected by the NUTBAL report (Table 3).
Conclusion
Th e NUTBAL analysis of crude protein and energy values from fecal sampling diff ered from a wet chemistry analysis of esophageally fi stulated and hand- clipped forage samples. Th is raises some questions

2017 Nebraska Beef Cattle Report · 67
© Th e Board Regents of the University of Nebraska. All rights reserved.
All samples were ground through a CT 193 Cyclotec™ Sample Mill using a 2 mm screen for in vitro and a Wiley Mill using a 2 mm screen for in situ. Inoculum for in vitro NDF digestibility was obtained by collecting whole rumen contents from each steer, with three steers per treatment for each run. Each of the strained ruminal fl uid samples were then mixed with McDougall’s buff er (1:1 ratio) containing 1 g urea / L and incubated for 48 h. Th is process was repeated in two runs for each period, and steer inoculum source was the experimental unit (n = 8). Th ree in vitro tubes per experimental unit were averaged for digestibility estimates.
Th e NDF digestibility of samples was also determined utilizing in situ rumen incubation. Th ree bags of each sample were placed in the rumen of each of the six steers, with three steers per treatment and 120 bags per steer separated into four time points (n = 8). Individual bags were placed in mesh zipper bags fi tted with weights and incubated for 36h, 48h, 60h, and 72h. Aft er the incubation period bags were pulled from steers and placed in a washing machine where they were agitated with water in a washing machine for 1 min and spun for 1 min for fi ve cycles. Th ey were then rinsed with distilled water and stored in the freezer. Th e Ankom Fiber Analyzer was used to analyze NDF of the remaining residue. Th is process was repeated in two runs a week apart for each period.
All data were analyzed using the MIXED procedures of SAS. Th is exper-iment used a crossover design with two periods and two runs per period. Th e eff ects of run, diet, time, and sample were examined. Diet by time and diet by time by sample interactions were also tested.
Results
In vitro
No interaction was observed for inocu-lum source and forage type for IVDMD (P = 0.99). Th ere was no interaction between inoculum source and forage type for IVOMD (P = 0.98). Th ere was no eff ect of
byproduct use varied with diet, making the impacts of residue or grass less clear.
Th erefore, the objective of this study was to evaluate the eff ects of inoculum source on in vitro and in situ digestibility estimates (IVDMD, IVOMD, and NDF digestibility), when comparing a 70% hay diet and a 70% corn residue diet, to determine if two sets of donor steers would need to be routinely maintained for these procedures.
Procedure
Six ruminally canulated steers were fed, daily at 8 AM, either a mixed diet consisting of 70% brome grass hay and 30% Sweet Bran or a high corn residue diet with 70% conventionally baled stalks and 30% Sweet Bran. Steers were fed at 2% BW on a DM basis. Th e eff ects of donor diet were assessed as inoculum source using in vitro techniques and as diet for in situ techniques. Th ere were two periods in a crossover design with two runs per period. Periods were 4 weeks long with a 2 week adaptation and 2 weeks for in vitro and in situ runs. One in vitro run and one in situ run were done in each week of the last two weeks of the period.
Residue samples consisting of 2- row, 8- row, conventional bale, husk and husklage were used for residue forage type. To obtain 2 and 8 row bales a New Holland Corn-rower Corn Head was used as previously described (2016 Nebraska Beef Report, pp. 76- 78). Th e husklage was produced with the use of a John Deere 569 round baler that was modifi ed with the Hillco single pass round bale system as previously described (2016 Nebraska Beef Report, pp. 76- 78)
Five chopped hays, with known in vivo values were described previously (2016 Nebraska Beef Report, pp. 84- 86) and consisted of immature smooth bromegrass (good brome), mature smooth bromegrass (poor brome), immature meadow hay (meadow hay), mature brome hay used in an individual barn feeding system (mature brome), and prairie grass hay (prairie hay).Th e prairie hay consisted of a mixture of warm and cool season grass species.
Hannah C. HamiltonJana L. Harding
Jim C. MacDonaldTerry J. Klopfenstein
Summary and Implications
A study was conducted to assess the eff ects of inoculum source at time of incubation on neutral detergent fi ber digestibility, dry matter digestibility, and organic matter digestibility of corn residue samples. Digestibility of neu-tral detergent fi ber was greater for both grass and corn residue when inoculum source came from steers consuming a high corn residue diet. Digestibility of dry matter and organic matter were not diff erent between grass and corn residue. It is not necessary to maintain two sets of donors for in vitro or in situ proce-dures involving corn residue. However, donor diet aff ects neutral detergent fi ber digestibility estimates of residue samples. Th erefore, when trying to assess energy values using in situ or in vitro techniques, a set of standards with established in vivo digestibility values should be used for adjustment when steers are main-tained on a mixed diet.
Introduction
Because forage, grass or residue, plays a major role in most cattle diets, knowing the energy value of forages is critical when estimating feeding values. Whether multi-ple donor diets are necessary to get accurate digestibility estimates of diverse forage samples such as grass or residue is essential. An interaction of forage type and inoculum source may indicate a need to obtain rumen fl uid from donors fed the same forage being tested. A previous study assessed the eff ects of NDF digestibility using four cannulated steers and found an increase in NDF di-gestibility for both grass and residue forage types incubated in an inoculum source from steers fed a high residue diet (2016 Nebraska Beef Report, pp. 84- 86). However,
Impact of Inoculum Source for in vitro and in situ Digestion Procedures Performed on Corn Residue and
Grass Samples
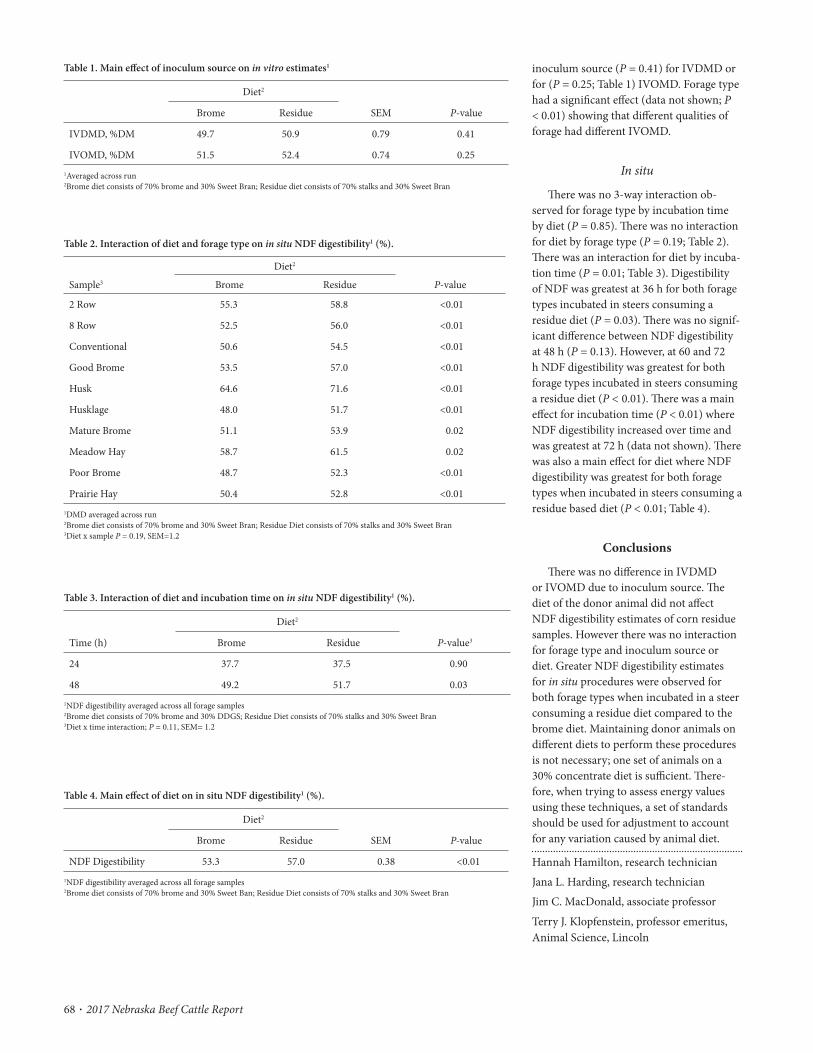
68 · 2017 Nebraska Beef Cattle Report
inoculum source (P = 0.41) for IVDMD or for (P = 0.25; Table 1) IVOMD. Forage type had a signifi cant eff ect (data not shown; P < 0.01) showing that diff erent qualities of forage had diff erent IVOMD.
In situ
Th ere was no 3- way interaction ob-served for forage type by incubation time by diet (P = 0.85). Th ere was no interaction for diet by forage type (P = 0.19; Table 2). Th ere was an interaction for diet by incuba-tion time (P = 0.01; Table 3). Digestibility of NDF was greatest at 36 h for both forage types incubated in steers consuming a residue diet (P = 0.03). Th ere was no signif-icant diff erence between NDF digestibility at 48 h (P = 0.13). However, at 60 and 72 h NDF digestibility was greatest for both forage types incubated in steers consuming a residue diet (P < 0.01). Th ere was a main eff ect for incubation time (P < 0.01) where NDF digestibility increased over time and was greatest at 72 h (data not shown). Th ere was also a main eff ect for diet where NDF digestibility was greatest for both forage types when incubated in steers consuming a residue based diet (P < 0.01; Table 4).
Conclusions
Th ere was no diff erence in IVDMD or IVOMD due to inoculum source. Th e diet of the donor animal did not aff ect NDF digestibility estimates of corn residue samples. However there was no interaction for forage type and inoculum source or diet. Greater NDF digestibility estimates for in situ procedures were observed for both forage types when incubated in a steer consuming a residue diet compared to the brome diet. Maintaining donor animals on diff erent diets to perform these procedures is not necessary; one set of animals on a 30% concentrate diet is suffi cient. Th ere-fore, when trying to assess energy values using these techniques, a set of standards should be used for adjustment to account for any variation caused by animal diet.
Hannah Hamilton, research technicianJana L. Harding, research technicianJim C. MacDonald, associate professorTerry J. Klopfenstein, professor emeritus, Animal Science, Lincoln
Table 1. Main eff ect of inoculum source on in vitro estimates1
Diet2
Brome Residue SEM P- value
IVDMD, %DM 49.7 50.9 0.79 0.41
IVOMD, %DM 51.5 52.4 0.74 0.251Averaged across run2Brome diet consists of 70% brome and 30% Sweet Bran; Residue diet consists of 70% stalks and 30% Sweet Bran
Table 2. Interaction of diet and forage type on in situ NDF digestibility1 (%).
Diet2
Sample3 Brome Residue P- value
2 Row 55.3 58.8 <0.01
8 Row 52.5 56.0 <0.01
Conventional 50.6 54.5 <0.01
Good Brome 53.5 57.0 <0.01
Husk 64.6 71.6 <0.01
Husklage 48.0 51.7 <0.01
Mature Brome 51.1 53.9 0.02
Meadow Hay 58.7 61.5 0.02
Poor Brome 48.7 52.3 <0.01
Prairie Hay 50.4 52.8 <0.011DMD averaged across run2Brome diet consists of 70% brome and 30% Sweet Bran; Residue Diet consists of 70% stalks and 30% Sweet Bran3Diet x sample P = 0.19, SEM=1.2
Table 3. Interaction of diet and incubation time on in situ NDF digestibility1 (%).
Diet2
Time (h) Brome Residue P- value3
24 37.7 37.5 0.90
48 49.2 51.7 0.031NDF digestibility averaged across all forage samples2Brome diet consists of 70% brome and 30% DDGS; Residue Diet consists of 70% stalks and 30% Sweet Bran3Diet x time interaction; P = 0.11, SEM= 1.2
Table 4. Main eff ect of diet on in situ NDF digestibility1 (%).
Diet2
Brome Residue SEM P- value
NDF Digestibility 53.3 57.0 0.38 <0.011NDF digestibility averaged across all forage samples2Brome diet consists of 70% brome and 30% Sweet Ban; Residue Diet consists of 70% stalks and 30% Sweet Bran

2017 Nebraska Beef Cattle Report · 69
© Th e Board Regents of the University of Nebraska. All rights reserved.
wheatgrass (Pascopyrum smithii)), 3 warm- season (C4) grasses (blue grama (Bouteloua gracilis); little bluestem (Schizachyrium scoparium); sideoats grama (Bouteloua curtipendula)), and 2 legumes (leadplant (Amorpha canescens); sweet clover (Meli-lotus offi cinalis)). Forage samples were col-lected at peak vegetative and mature states between late- April and late- August 2015. Peak vegetative stage of growth was defi ned as just before stem elongation for the grass-es and before fl owering for the legumes. At the mature stage, grasses were fully headed and beginning seed ripening. Legumes were past fl owering and in seed development.
Plants were clipped at ground level, shipped overnight on ice to the Ruminant Nutrition Laboratory at the University of Nebraska- Lincoln. Half of the sample was separated by hand into leaf and stem. De-pending on the stage at which the plant was collected, the reproductive portion (fl ower, seed) was also separated. All plant parts and whole plant samples were placed in a 60º C forced air oven for 48 h to determine dry matter. Aft er 48 h, all samples were re-moved from the oven and ground through a Wiley Mill using a 1 mm screen.
Laboratory Analysis
Extractions were performed in duplicate with 0.200– 0.204 g of ground sample. Docosane (C22) and tetratriacontane (C34) were added by weight at a concentration of 0.3 mg / g to serve as internal alkane standards. An internal alcohol standard, n- heptacosanol (1- C27- ol) at a concentration of 1.5 mg / g was added by weight. Samples were extracted overnight using 1M KOH. Hydrocarbons were collected by solid phase extraction using heptane.
Crude alcohol extractions were obtained by solid phase extraction using heptane/ethyl acetate followed by sterol/stanols separation and derivatization with pyridine and acetice anhydride. n- Alkane elutes and LCOH fractions were evaporated to dryness, and re- dissolved in n- dodecane for chromatographic analysis.
marker profi le or signature of a plant. When these profi les are distinctive enough, the composition of cattle diets can be predicted from the pattern of these compounds in the forages ingested. Th e number of plants that can be delineated depends on the number and profi les of ALK and LCOH measured in the individual plants or plant- parts. As the complexity of a sward increases, such as within mixed species grassland, the number of markers needed to distinguish plants increases. Th e objective of this study was to assess the ability to delineate the plant com-position of corn residue and of a diverse western rangeland.
Procedure
Corn plant
Cob, stalk, husk and leaf samples were taken from a 98.8 acre irrigated corn fi eld located at the Eastern Nebraska Research and Extension Center located near Mead, NE. Ears and leaf blade were removed on site prior to transport to prevent loss. Stalks were cut at the top of the crown roots and bundled. Leaves and stalks were stored to air dry in an open air barn. Ears were husked and separated. Samples were bagged and left open inside a climate controlled building to allow the plant parts to dry. Stalk, cob and leaf samples were all chopped using the Ohio Mill, and then through a Wiley Mill using 1 mm screen. Samples were then composited by plant part.
Western rangeland
Forage samples were collected at the West Central Research and Extension Center (WCREC) in North Platte, NE. Collection sites were primarily native mixed- grass rangeland within the rolling plains and breaks of Major Land Resource Area 73. Ecological sites included loamy upland, loamy lowland and loess breaks. Th e forages were 3 cool- season (C3) grasses (cheatgrass (Bromus tectorum); needle- and- thread (Hesperostipa comata); western
Hannah C. HamiltonJerry D. VoleskyRonald M. Lewis
Summary with Implications
Although key to the effi ciency of a cattle operation, feed intake is challenging to evalu-ate in a grazing setting. However, even within forage- based systems, plant- wax markers may be used to predict dietary choices and feed intake. Plant- waxes are a complex mixture of lipids found on the surface of plants. When suffi ciently unique among plants, the composition of diets can be determined from the pattern of these compounds in the forages ingested. Th ese markers were used to delineate the parts of the corn plant and, separately, 8 western rangeland grasses and legumes. Using plant waxes, the components of the corn plant were clearly distinguished. Th is technique therefore could be useful in a monoculture, such as a corn residue fi eld, to determine the plant parts predominating in the diet. Delin-eating plants in a complex sward was more diffi cult, particularly among like species. Th e use of more markers may help to more explic-itly distinguish plants within diverse pastures, such as western rangelands.
Introduction
Within the beef and dairy industry, it has become increasingly important to determine the factors that aff ect animal intake. One approach for doing so is based on plant- wax markers. Plants contain a complex mixture of aliphatic lipid com-pounds on their external surface that are essentially inert within the digestive system. Of particular interest are the n- alkanes (ALK; saturated straight- chain hydrocar-bons) and long- chain alcohols (LCOH). Th e concentrations of these compounds can diff er greatly among plant species, and even among plant parts, oft en providing a unique
Evaluation of Plant- waxes to Estimate Forage Intake in Grazing Cattle

70 · 2017 Nebraska Beef Cattle Report
(biplots) based on the ALK and LCOH concentrations of plants or plant- parts. Th rough these biplots, it was possible to see whether the plant- wax profi les of the indi-vidual plant and plant- parts were distinct enough to separate them.
For the parts of the corn plant, 4 ALK (C27, C29, C31 and C33) and 3 LCOH (C26OH, C28OH and C30OH) concentrations were considered. For the plant species in the western rangelands, an additional ALK (C35) and 2 additional LCOH were used (C24OH and C32OH) as markers given the greater complexity of the plant mixture. Th e concentrations of C24OH and C32OH compound were estimated from nearby standard response factors. Because the concentrations of ALK and LCOH diff ered appreciably among the plant species, the concentrations were normalized to a unit scale within ALK and within LCOH by dividing individual concentrations by their respective sum.
Results
Corn Plant
Th e ALK and LCOH concentration of the 5 corn plant parts are provided in Table 1. Th ere was large variation in the plant- wax contents of the plant parts. Th e concentration of C27 was relatively low in all plant components. Th e C26OH compound was predominant in the husk compared to all other parts. Th e concentrations of all compounds were consistently higher in the leaf of the plant with the exception of C26OH. Grain, stalks and cobs seemed to have the lowest overall concentrations of all compounds.
Based on the PCA, 79.9% of the variation in the plant- wax concentrations among plant parts was described along the fi rst or x- axis, while a further 18.1% of the variation was defi ned along the second or y- axis (Figure 1). With eff ectively all vari-ation (98%) being explained in just these 2- dimensions, the plant- wax profi les of the various parts of a corn plant allowed them to be clearly distinguished. Leaf had greater concentrations of C30OH and C24OH mak-ing its cluster very distinct. Husk and cob clusters were also discernable because of the higher concentrations in C29 in both, yet still distinct from each other due to their diff ering C31 and C26OH concentrations,
known amounts of the internal standards (C22, C34 and C27OH).
Statistical analyses were based on prin-cipal component analysis (PCA) conducted using GenStat for Windows 17th Edition. Th e PCA technique is used to explain the variation found in a set of observations by drawing out their strongest or most dominant patterns. It is oft en used to make data easier to visualize. In this study, PCA was used to generate 2- dimesional plots
Quantifi cation of ALK and LCOH was carried out by gas chromatography (GC), using an Agilent 7820A GC. Samples of an ALK and LCOH standard solution mixture (C21 to C36; C20OH to C30OH) were included in the GC analyses to determine peak identifi cation and standard response factors. Peak areas were determined with auto- integration and manual review of chromatograms. Th e ALK and LCOH concentrations were calculated relative to
Table 1. Mean n- alkane and long- chain alcohol concentrations (mg • kg- 1 DM) for corn plant parts.
n- alkane Long- chain alcohol
Plant part C27 C29 C31 C33 C26OH C28OH C30OH
Cob 4.61 11.1 7.42 5.42 19.7 3.23 3.87
Husk 4.25 17.1 19.5 9.80 70.3 25.7 30.9
Leaf 9.29 30.1 56.5 45.6 54.9 57.2 74.2
Stalk 2.59 3.21 3.65 4.77 20.1 5.10 5.52
Grain 3.00 2.28 2.29 3.31 18.3 2.24 4.34
1.0
0.5
0.0
-0.5
-1.0
-1.5 -1.0 -0.5 0.0 0.5 1.0
C33U
C28OHU
C30OHU
C27U
C31U
C29U
C26OHU
CNSCNG
CNH CNC
CNL
Figure 1. Biplot showing the 5 corn plant parts in a 2- dimensional space derived from principal compo-nent analysis based on concentrations of 4 n- alkanes (C27U, C29U, C31U and C33U) and 3 long- chain alcohols (C26OHU, C28OHU and C30OHU) once normalized to a unit scaled. Th e corn plant parts were Corn Plant Cob (CNC), Corn Plant Leaf (CNL), Corn Plant Husk (CNH), Corn Plant Stalk (CNS) and Corn Plant Grain (CNG).

2017 Nebraska Beef Cattle Report · 71
respectively. Stalk and grain were the most closely related with higher concentrations in C27. However, stalks contained more C33 allowing it to appear separate from grain.
Western Rangeland
Th e ALK and LCOH concentrations of the 8 plant species found in western rangelands are provided in Table 2. Th ere was large variation in the plant- wax content of plants within and across growth stages. Leadplant and sweet clover contained higher concentrations of C29 during both vegetative and mature states. Blue grama had higher concentrations of C33 when compared to other plants. All plants had low concentrations of C35. Th e LCOH amounts, when present, were consider-ably higher than ALK concentrations. Th e concentration of C28OH was highest in cheatgrass and needle- and- thread at matu-rity. Th e compound C32OH only appeared at extremely high concentrations in mature warm- season grasses (blue grama, little bluestem and sideoats grama).
Th e PCA for vegetative plants showed 55.3% of the variation between plant parts was described on fi rst or x- axis (Figure 2). An additional 35.2% was defi ned along the second or y- axis, for a total of 90.5% of variation being defi ned in these 2- dimsensions. For mature plants, 65.8% of
Table 2. Mean n- alkane and long- chain alcohol concentrations (mg • kg- 1 DM) for 8 forage species at peak vegetative and mature (shown in parentheses) stages of growth.
n- alkane Long- chain alcohol
Class1 Specie C27 C29 C31 C33 C35 C24OH C26OH C28OH C30OH C32OH
C3 Cheatgrass 47.2 (42.2)
57.7 (152.4)
39.6 (94.1)
39.9 (22.3)
3.2 (1.7)
351.2 (77.9)
74.0 (144.4)
1308.5 (5066.2)
58.5(72.0)
0(0)
Needle- and- thread
30.7 (30.7)
84.9 (92.1)
89.8 (113.7)
28.5 (22.4)
29.8 (15.5)
0(75.9)
84.8 (411.6)
4126.4 (8962.5)
180.3 (252.9)
0(54.1)
Western wheatgrass
9.6 (50.9)
31.1 (56.6)
59.1 (34.5)
25.5 (6.3)
1.4 (0.8)
0(0)
40.9 (28.7)
560.1 (39.3)
29.5 (21.6)
0(0)
C4 Blue grama 13.8 (12.4)
49.0 (47.0)
179.4 (148.7)
121.2 (75.1)
21.1 (18.8 )
0(28.6)
0(0)
727.2 (111.9)
141.2 (125.4)
2703.3 (11252.9)
Little bluestem 18.2 (57.7)
28.0 (44.8)
50.5 (58.8)
8.4 (18.9)
1.2 (4.4)
0(68.9)
44.2 (140.5)
337.0 (134.7)
196.2 (120.4 )
5871.8 (13200.2)
Sideoats grama 29.1 (35.5)
28.6 (45.5)
21.2 (35.6)
15.7 (19.4)
7.0 (3.7)
0(26.1)
77.7 (324.5)
1268.9 (1624.2)
157.7 (262.3)
900.5 (1244.9)
Leg. Leadplant 93.4 (48.8)
143.8 (273.4)
38.3 (181.4)
5.5 (16.5)
0.4 (0.1)
193.0 (234.8)
658.2 (757.4 )
2856.0 (2057.4)
1076.6 (537.6)
0(94.9)
Sweet clover 38.8 (37.0)
268.3 (440.0)
53.0 (51.3)
22.2 (7.5)
1.4 (1.2)
188.6 (219.1)
2464.0 (689.7 )
159.8 (108.1)
522.6 (116.0)
0(0)
1Specie classifi cations were cool- season (C3) and warm- season (C4) grass, and legume (Leg.).
Figure 2. Biplot showing the 8 forage species at their peak vegetative state in a 2- dimensional space derived from principal component analyses based on concentrations of 5 n- alkanes (C27U, C29U, C31U, C33U and C35U) and 5 long- chain alcohols (C24OHU, C26OHU, C28OHU, C30OHU and C32OHU) once normalized to a unit scaled. Th e forage species were Sweet Clover (SC), Leadplant (LP), Cheatgrass (CG), Sideoats grama (SG), Needle- and- thread (NT), Western Wheatgrass (WW), Blue Grama (BG) and Little Bluestem (LB).
1.0
0.5
0.0
-0.5
-1.0-1.0 -0.5 0.0 0.5 1.0
C28OHU
CG
C27UC24OHU
C35U
C33U
C31U
C32OHU
C26OHU
C30OHU
C29U
WW
NT
SGLP
LB
BG
SC

72 · 2017 Nebraska Beef Cattle Report
Such information may benefi t management decisions, including deciding when animals might be moved to alternative grazing areas. However, to delineate choices in a complex sward such as western rangelands, additional plant markers will be needed to more clearly distinguish plant species.
Hannah C. Hamilton, research technicianJerry D. Volesky, full professor, agronomy and horticulture, West Central Research and Extension Center, North PlatteRonald M. Lewis, full professor, animal science, Lincoln
sideoats grama clustered together and were not separable based on their ALK and LCOH profi les alone.
Conclusions
Using ALK and LCOH concentrations, the parts of the corn plant could be clearly delineated. However, the specie- specifi c profi les of the plant- wax markers were not distinct enough to distinguish among plants comprising a complex western rangeland. Th at issue is explored further elsewhere (2017 Nebraska Beef Report, pp. 73–75). Th e plant- wax characteristics appear useful for assessing dietary choices in cattle grazing a monoculture like corn residue.
the variation was described along the fi rst axis, followed by 27.4% explained along the second axis, totaling 93.2% of the varia-tion being defi ned along the fi rst two axes (Figure 3).
Th e spread of the 8 forage species in the biplots clearly showed the ability to dis-criminate legumes from grasses. Th e greater concentrations of C29, C24OH and C26OH in legumes resulted in their clustering. High concentrations of C32OH made C4 grasses stand out, particularly blue grama that also had high concentrations of C33. Stronger separation of the grasses was captured along the y- axis, but they still could not be unequivocally diff erentiated. Cheatgrass, western wheatgrass, little bluestem and
1.5
1.0
0.5
0.0
-0.5
-1.0
-1.0 -0.5 0.0 0.5 1.0 1.5
C26OHU
SC
CG
WW
SG
NT
LP
BG
LS
C24OHU
C30OHU
C29U
C27U
C31U
C35U
C33U
C32OHU
C28OHU
Figure 3. Biplot showing the 8 forage species at their mature state in a 2- dimensional space derived from principal component analyses based on concentrations of 5 n- alkanes (C27U, C29U, C31U, C33U and C35U) and 5 long- chain alcohols (C24OHU, C26OHU, C28OHU, C30OHU and C32OHU) once nor-malized to a unit scaled. Th e forage species were Sweet Clover (SC), Leadplant (LP), Cheatgrass (CG), Sideoats grama (SG), Needle- and- thread (NT), Western Wheatgrass (WW), Blue Grama (BG) and Little Bluestem (LB).
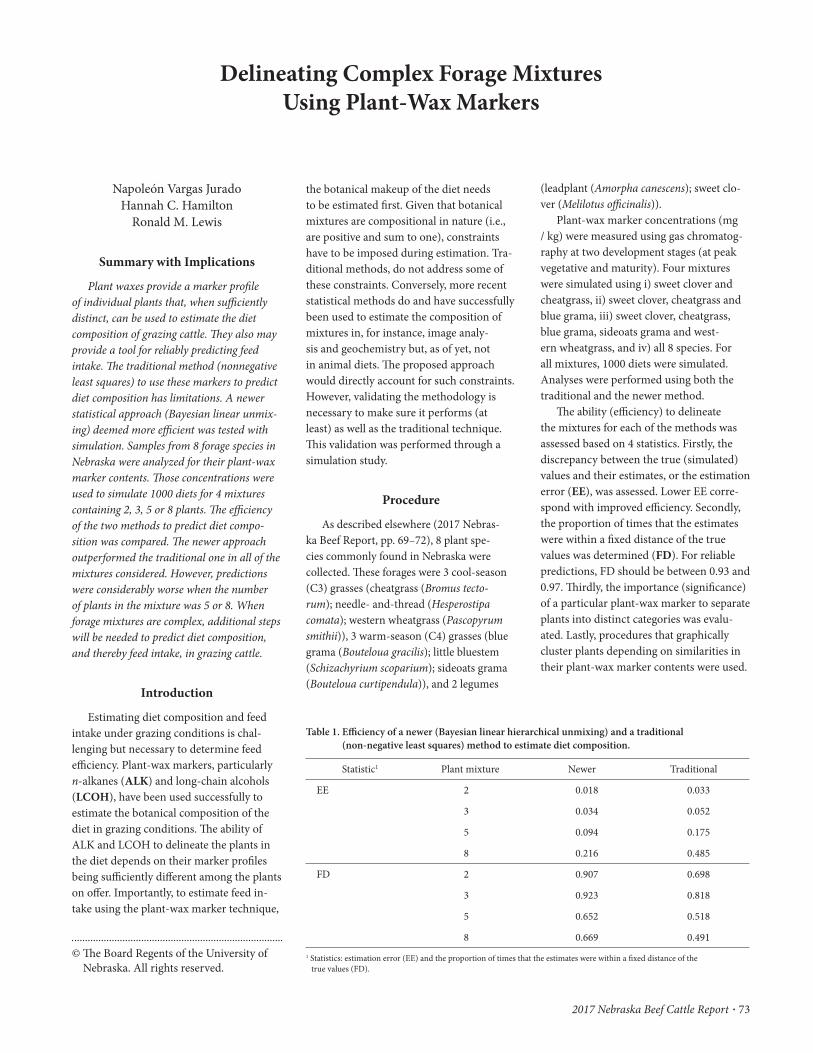
2017 Nebraska Beef Cattle Report · 73
© Th e Board Regents of the University of Nebraska. All rights reserved.
(leadplant (Amorpha canescens); sweet clo-ver (Melilotus offi cinalis)).
Plant- wax marker concentrations (mg / kg) were measured using gas chromatog-raphy at two development stages (at peak vegetative and maturity). Four mixtures were simulated using i) sweet clover and cheatgrass, ii) sweet clover, cheatgrass and blue grama, iii) sweet clover, cheatgrass, blue grama, sideoats grama and west-ern wheatgrass, and iv) all 8 species. For all mixtures, 1000 diets were simulated. Analyses were performed using both the traditional and the newer method.
Th e ability (effi ciency) to delineate the mixtures for each of the methods was assessed based on 4 statistics. Firstly, the discrepancy between the true (simulated) values and their estimates, or the estimation error (EE), was assessed. Lower EE corre-spond with improved effi ciency. Secondly, the proportion of times that the estimates were within a fi xed distance of the true values was determined (FD). For reliable predictions, FD should be between 0.93 and 0.97. Th irdly, the importance (signifi cance) of a particular plant- wax marker to separate plants into distinct categories was evalu-ated. Lastly, procedures that graphically cluster plants depending on similarities in their plant- wax marker contents were used.
the botanical makeup of the diet needs to be estimated fi rst. Given that botanical mixtures are compositional in nature (i.e., are positive and sum to one), constraints have to be imposed during estimation. Tra-ditional methods, do not address some of these constraints. Conversely, more recent statistical methods do and have successfully been used to estimate the composition of mixtures in, for instance, image analy-sis and geochemistry but, as of yet, not in animal diets. Th e proposed approach would directly account for such constraints. However, validating the methodology is necessary to make sure it performs (at least) as well as the traditional technique. Th is validation was performed through a simulation study.
Procedure
As described elsewhere (2017 Nebras-ka Beef Report, pp. 69–72), 8 plant spe-cies commonly found in Nebraska were collected. Th ese forages were 3 cool- season (C3) grasses (cheatgrass (Bromus tecto-rum); needle- and- thread (Hesperostipa comata); western wheatgrass (Pascopyrum smithii)), 3 warm- season (C4) grasses (blue grama (Bouteloua gracilis); little bluestem (Schizachyrium scoparium); sideoats grama (Bouteloua curtipendula)), and 2 legumes
Napoleón Vargas JuradoHannah C. Hamilton
Ronald M. Lewis
Summary with Implications
Plant waxes provide a marker profi le of individual plants that, when suffi ciently distinct, can be used to estimate the diet composition of grazing cattle. Th ey also may provide a tool for reliably predicting feed intake. Th e traditional method (nonnegative least squares) to use these markers to predict diet composition has limitations. A newer statistical approach (Bayesian linear unmix-ing) deemed more effi cient was tested with simulation. Samples from 8 forage species in Nebraska were analyzed for their plant- wax marker contents. Th ose concentrations were used to simulate 1000 diets for 4 mixtures containing 2, 3, 5 or 8 plants. Th e effi ciency of the two methods to predict diet compo-sition was compared. Th e newer approach outperformed the traditional one in all of the mixtures considered. However, predictions were considerably worse when the number of plants in the mixture was 5 or 8. When forage mixtures are complex, additional steps will be needed to predict diet composition, and thereby feed intake, in grazing cattle.
Introduction
Estimating diet composition and feed intake under grazing conditions is chal-lenging but necessary to determine feed effi ciency. Plant- wax markers, particularly n- alkanes (ALK) and long- chain alcohols (LCOH), have been used successfully to estimate the botanical composition of the diet in grazing conditions. Th e ability of ALK and LCOH to delineate the plants in the diet depends on their marker profi les being suffi ciently diff erent among the plants on off er. Importantly, to estimate feed in-take using the plant- wax marker technique,
Delineating Complex Forage Mixtures Using Plant- Wax Markers
Table 1. Effi ciency of a newer (Bayesian linear hierarchical unmixing) and a traditional (non- negative least squares) method to estimate diet composition.
Statistic1 Plant mixture Newer Traditional
EE 2 0.018 0.033
3 0.034 0.052
5 0.094 0.175
8 0.216 0.485
FD 2 0.907 0.698
3 0.923 0.818
5 0.652 0.518
8 0.669 0.4911 Statistics: estimation error (EE) and the proportion of times that the estimates were within a fi xed distance of the
true values (FD).

74 · 2017 Nebraska Beef Cattle Report
Figure 1. Plant- wax marker importance for 8 plant species at their early (vegetative) stage of growth) based on concentrations of 5 n- alkanes (C27, C29, C31, C33 and C35) and 5 long- chain alcohols (C24OH, C26OH, C28OH, C30OH and C32OH).
Results
Mean ALK and LCOH concentrations for the 8 plant species were presented in 2017 Nebraska Beef Report, pp. 69–72. In general, ALK concentrations are lower than those of LCOH, which is in accordance with other studies.
With regards to the effi ciency of de-lineating forage mixtures, for the 2- plant mixture the newer method was clearly more effi cient, with EE of 0.018 compared to that of traditional method of 0.033 (Table 1). Th at represented a 50% improvement in effi ciency. Th e FD also was better with the new method, although somewhat lower than the expected range. For the 3- plant mixture similar results were obtained although the reduction in EE was smaller, 0.034 and 0.052 for the new and traditional method, respectively. Still the diff erence between the two methods represented a 35% improvement in effi ciency. In addition, the FD for the new method was close to the range expected, while that for the tradition-al method was well below.
For the 5- plant mixtures, the EE were 0.094 and 0.175 for the new and traditional method, respectively; however, FD was considerably reduced for both methods to 0.652 (new) and 0.518 (traditional). A similar result was obtained for the 8- plant mixture, with lower effi ciencies for both methods: the estimation errors increased substantially and the proportion of times true and estimated values coincided decreased considerably. However, the new method was still around 50% more effi cient than the traditional. One likely reason for this signifi cant decline in ability to deter-mine diet composition may be insuffi cient diff erences in the ALK and LCOH profi les among the plants when more and similar species were combined.
With this particular set of plant species, delineating relatively simple mixtures (2 or 3 plants) using the new method is quite feasible. However, increasing the number of plants in the mixture dramatically reduced the effi ciency of the both methods. As shown in Figure 1, the C32OH and C24OH help the least in species delineation, pos-sibly due to many of the plant species not having these two markers present. When evaluating the similarities in plant- waxes profi les for the diff erent plants, C31, C33, C35 and C28OH were common to the cool-
2017 Nebraska Beef Cattle Report · 75
Conclusion
In conclusion, the reliability of predic-tions of diet composition was improved by using a more sophisticated statistical approach in the evaluation. However, fur-ther developments in the application of the plant- wax marker technique are still needed to determine the dietary choices and feed intakes of cattle grazing complex swards typical to western rangelands.
Napoleón Vargas Jurado, graduate StudentHannah C. Hamilton, graduate studentRonald M. Lewis, full professor, animal science, Lincoln
and warm- season grasses, while C26OH was important to distinguish the legumes. Although the C32OH was less important than many other markers to delineate plant species generally, in was unique to C4 grasses; therefore, it facilitated separating the cool- and warm- season grasses.
One possible way to increase the effi -ciency of the plant- wax methodology, when considering mixtures of more plants, is to add other plant markers such as long- chain fatty acids and alkenes. Additionally, plants could be grouped based on their taxonomy or function to simplify the complexity of the sward being characterized. Such an ap-proach may be particularly valuable when the primary aim is to predict feed intake.

76 · 2017 Nebraska Beef Cattle Report
© Th e Board Regents of the University of Nebraska. All rights reserved.
stover, solubles, DDG, and supplement. Th e corn stover for this treatment was harvest-ed using a single pass round baler pulled behind the combine. Th e corn residue that was left was raked into wind rows and baled with a conventional square baler. Th e third experiment used fi ve dietary treatments comparing an 80% DRC- based diet (Corn) with one of two supplemental fat sources (Tallow or Cornoil) to diets with 25.5% distillers solubles (Solubles), or 56% wet DGS (WDGS).
Regression
Regression was used to relate digestible OM to TDN. Th e initial model included experiment, animal within experiment, and treatment within experiment. Individual points were used to represent animal within period for each experiment in Figures 2– 4. For Exp. 1 and 2, a combined treatment average was used for each experiment and experiments will be henceforth referred to as 45% HMC and 18% MDGS, respective-ly. Regression models for the relationship between the diff erences in DIGOM, TDN, and GE were developed used treatment average as the observation.
Results
Intercepts for a unifi ed regression model were not signifi cant (P = 0.316). A signifi -cant treatment within experiment eff ect (P < 0.01) resulted in independent regression models for each experiment. An isopleth was indicated with a dotted line to show relative diff erences of slope. Treatments for Exp. 1 were signifi cantly diff erent (P < 0.01) for DIGOM relative to TDN. However, Exp. 1 showed no treatment eff ect for DIGOM. Th erefore, a single slope with a linear rela-tionship was used (Figure 1) and designated as a treatment average (45% HMC) for further analysis. Treatments for Exp. 2 were signifi cantly diff erent (P < 0.01) for DIGOM relative to TDN. However, Exp. 2 showed no treatment eff ect for DIGOM. Th erefore,
tent of the feed and feces can be measured using bomb calorimetry to directly measure DE. Th e objective of this study was to com-pare digested organic matter (DIGOM), determined by previous digestibility trials utilizing diets with or without distillers grains, DE, and calculated TDN values using bomb calorimetry.
Procedure
Th is study utilized three previously conducted digestion trials where total tract collection and OM analysis of feed and fe-ces were measured to determine OMD. Or-ganic matter digestibility values were then multiplied by dietary OM content to deter-mine digested organic matter (DIGOM, % DM). Dietary DE was calculated from heat of combustion of feed and feces, measured using a bomb calorimeter. Conversion of DE to TDN was assumed to be 2.0 Mcal DE / lb TDN. Regression models were developed using GLM Procedures of SAS. Digestion data were analyzed using the Mixed Procedures of SAS with treatment as a fi xed eff ect and steer as experimental unit. Comparisons were made across and within experiments.
Description of Experiments
Th e fi rst experiment fed a basal diet consisting of 40% Sweet Bran®, 45% high moisture corn (45% HMC), 10% corn silage, and 5% supplement (DM basis) with or without enzyme. Th e second experiment (18% MDGS) had four dietary treatments. Th e negative control (negcontrol) contained 60% untreated corn stover, 18% MDGS, 18% distillers solubles and 4% supplement (DM basis). Th e positive control (poscon-trol) consisted of 60% CaO treated corn stover, 18% MDGS, 18% distillers solubles, and 4% supplement. Th e third treatment (pelletC) was a pellet containing the same proportions of CaO treated corn stover, sol-ubles, MDGS and supplement. Treatment four (pelletS) was also a pellet containing the same proportions of CaO treated corn
Hannah C. HamiltonJana L. Gramkow
Jim C. MacDonaldGalen E. EricksonAndrea K. Watson
Terry J. Klopfenstein
Summary and Implications
Th e relationship between organic matter digestibility and total digestible nutrients is unestablished for diets containing distillers grains. Th ree cattle digestion studies were used to evaluate the relationship between total digestible nutrients and digestible organic matter. Results suggest digestible organic matter is consistent relative to total digestible nutrients content for traditional, corn based diets. In fi nishing and growing diets containing distillers grains additional digestible energy supplied by distillers grains is not accounted for when evaluating only digestible organic matter. Measuring digest-ible energy content of diets used in digestion trials is essential.
Introduction
Total digestible nutrients (TDN) are directly related to digestible energy (DE). Th en, TDN can be converted to DE using 1 lb of TDN equal to 2 Mcal of DE. Previous-ly, TDN was based on proximate analysis, which is no longer commonly used. Th ese analyses were also based on diets contain-ing primarily corn, fat, and alfalfa, but none containing distillers grains. Organic matter digestibility (OMD) is related to TDN and is commonly measured in digestion studies to estimate feeding values. However, the relationship between OMD and TDN is unestablished for diets containing distillers grains. When the amount of wet distillers grains plus solubles (WDGS) is increased in a diet there is an increase in feed effi ciency but a decrease in OMD. Total energy con-
Relationship between Dietary Total Digestible Nutrients and Digestible Organic Matter in Beef Cattle Finishing and
Growing Diets With or Without Distillers Grains

2017 Nebraska Beef Cattle Report · 77
a single slope with a linear relationship was used (Figure 2) and designated as a treatment average (18% MDGS) for further analysis. In Exp. 3, there was a tendency for a treatment eff ect (P > 0.14). Th erefore treatments were evaluated using separate regression lines (Figure 3) and treatments remained separate for further analysis (Corn, CornOil, Tallow, Solubles, WDGS).
Th e diff erence between TDN (% of DM) and DIGOM (% of DM) was greatest for the 18% MDGS (Exp. 2) with 11.1 percent-age units (PPT) diff erence (Table 1). Th e WDGS treatment followed with 10.0 PPT diff erence. Th e solubles, 45% HMC (Exp. 1), and Tallow treatments were 5.9, 3.6, and 0.3 PPT diff erence, respectively. Corn oil and corn treatments had greater DIGOM than TDN showing a PPT diff erence of- 0.4 and- 4.0, respectively.
Th ere were no signifi cant diff erences for OM intake (kg) across all treatments (P = 0.88; Table 2). Th ere were no signifi cant diff erences in energy intake (Mcal) across all treatments (P = 0.28). However, OM excreted (kg) was signifi cantly diff erent (P < 0.01), with WDGS and 18%MDGS treatments having the greatest OM excreted, Corn, 45% HMC, Corn Oil and Tallow being intermediate, and solubles having the least OM excreted. Th ere were signifi cant diff erences (P < 0.01) in energy excreted (Mcal) with WDGS and 18% MDGS having the greatest energy excreted, Corn, Corn Oil, Tallow, and 45% HMC being intermediate, and Solubles having the least energy excreted. Th e ratio for consumed energy relative to consumed OM was diff erent across treatments (P < 0.01), with WDGS and 18% MDGS having the greatest ratio, solubles the next greatest ratio, followed by 45% HMC. Corn oil and tallow had the fourth greatest ratio and Corn had the lowest ratio. Th e ratio for excreted OM relative to excreted energy was signifi cantly diff erent (P < 0.01), with solubles and WDGS having the greatest ratio, corn, corn oil, tallow, and 45% HMC being intermediate, and 18% MDGS hav-ing the lowest ratio (Table 2).
Th e DIGOM is consistent relative to TDN content of traditional corn based diets. Results from Exp. 2 and 3 with diets contain-ing DGS showed there was some portion of DE that was not accounted for when using only DIGOM. Additional DE is likely due to the protein and fat content of DGS which
95
90
85
80
75
70
65
60
5555 60 65 70 75 80 85 90 95
ControlEnzymeTD
N, %
DM
DIGOM, % DM
95
90
85
80
75
70
65
60
55
TDN
, % D
M
55 60 65 70 75 80 85 90 95OMdig, % DM
negcontrolposcontrolpelletCpelletS
95
90
85
80
75
70
65
60
55
TDN
, % D
M
55 60 65 70 75 80 85 90 95OMdig, % DM
Tallow
WDGS
Corn Oil
Corn
Solubles
Figure 1. TDN vs DIGOM in 2 fi nishing diets without DGS (Exp. 1). Control (diamonds) and enzyme (squares) data are shown in the graph where individual data points indicate animal as the experimental unit. Th e regression equation for the data was TDN = [0.967 (±0.106) × DIGOM] + 6.16 (±8.20) % (R2 =0.892).
Figure 3. TDN vs DIGOM in 5 fi nishing diets (Exp. 3). Tallow (circles), WDGS (squares), Corn Oil (triangles), Corn (exes), and Solubles (asterisks) data are shown in the graph where individual data points indicate animal as the experimental unit. Th e regression equation for the Tallow treatment was TDN = [0.990 (±0.0433) × DIGOM] + 1.09(±3.44) % (R2 =0.994). Th e regression equation for the WDGS treatment was TDN = [1.15 (±0.0471) × DIGOM]- 0.887(±3.49) % (R2 =0.995). Th e regression equation for the Corn Oil treatment was TDN = [1.10 (±0.0712) × DIGOM]- 7.70(±5.44) % (R2 =0.987). Th e regression equation for the Corn treatment was TDN = [1.11 (±0.0519) × DIGOM]- 12.5(±4.12) % (r2 =0.993). Th e regression equation for the Solubles treatment was TDN = [1.24 (±0.0833) × DIGOM]- 13.9(±6.72) % (R2 =0.987).
Figure 2. TDN vs DIGOM of growing diets with DGS (Exp. 2). NEGCONTROL (diamond), POSCONTROL (square), pelletC (triangle), and pelletS (exes) data are shown in the graph where individual data points indicate animal as the experimental unit. Th e regression equation for the data was TDN = [1.10 (±0.0786) × DIGOM] + 4.59 (±5.14) % (R2 =0.852).

78 · 2017 Nebraska Beef Cattle Report
supplies additional energy relative to OM content. All treatments consumed the same amount of OM but varied in energy intake. Th is was more apparent when expressed as a ratio with energy intake. Th e average of all treatments in Exp. 2 had the greatest ratio for energy intake relative to OM intake. Conversely, the average of all treatments had the smallest ratio for energy excreted relative to OM excreted. Th ese data suggest that there is more energy being consumed but not being excreted in the feces. Th e fi ber content of DGS could reduce energy supplied, but would remain in feces as OM, which is why greater OM was excreted from treatments containing DGS.
Conclusions
Th e diff erence between TDN and DIGOM is much greater for diets con-taining DGS. When the percent diff erence between TDN and DIGOM is expressed in terms of GE within an individual experi-ment, the relationship becomes uniform across diets. Th erefore, it is essential to measure digestible energy content of diets in digestion trials, especially diets includ-ing distillers grains.
Hannah Hamilton, research technicianJana L. Harding, research technicianJim C. MacDonald, associate professorTerry J. Klopfenstein, professor, Animal science, Lincoln
Table 1. Average TDN and DIGOM for treatments for experiments 1– 3.
Treatments1 TDN2, % of DM DIGOM2, % of DM Diff erence3
Exp. 1
45% HMC 80.5 76.9 3.6
Exp. 2
18% MDGS 76.4 65.3 11.1
Exp. 3
Corn 75.2 79.2 - 4.0
CornOil 75.9 76.2 - 0.4
Tallow 79.7 79.3 0.3
Solubles 86.6 80.7 5.9
WDGS4 83.7 73.8 10.01Treatments from Exp. 1; Contains control and enzyme treatments which both contain 45% HMC; HMC: High moisture corn;
Treatments from Exp. 2; Contains poscontrol, negcontrol, pelletS and pellet which all contain 18% MDGS; MDGS: Modifi ed distillers grains; Treatments from Exp. 3; WDGS: Wet distillers grains
2Treatment average across animal and period; TDN: Total digestible nutrients; DIGOM: Digested organic matter3 Percentage unit diff erence4 56% inclusion (DM basis) of WDGS in the diet
Table 2. Diff erence in diet and fecal energy relative to OM1 content for all experiment treatments.
Treatment
Corn 45% HMC2
Corn Oil
Tallow Solubles WDGS3 18% MDGS4
SEM P- Value
Consumed
OM, lb 10.7 9.53 9.34 10.0 9.34 10.0 9.93 0.84 0.88
Energy, Mcal
46.4 44.9 42.7 45.6 45.1 51.0 50.9 4.23 0.28
Excreted
OM, lb 1.92bc 1.80bc 2.01bc 1.87bc 1.35c 2.32ab 2.71a 0.30 <0.01
Energy, Mcal
9.61bc 9.17bc 10.5bc 9.58bc 7.30c 12.4ab 13.5a 1.49 <0.01
Energy, Mcal/lb OM 5
Con-sumed
4.32e 4.72c 4.56d 4.56d 4.83b 5.07a 5.11a 0.025 <0.01
Excreted 5.00bc 5.11bc 5.25ab 5.18abc 5.40a 5.36a 5.00c 0.087 <0.011 OM: Organic matter2Treatment average for Exp. 1; Contains control and enzyme treatments which both contain 45% HMC; HMC: High moisture
corn3 56% inclusion (DM basis) of WDGS in the diet4 Treatment average for Exp. 2; Contains poscontrol, negcontrol, pelletS and pelletC which all contain 18% MDGS; MDGS:
Modifi ed distillers grains5 Consumed: Consumed energy (Mcal) was divided by consumed OM (lb). Excreted: Excreted energy (Mcal) was divided by
consumed OM (lb).

2017 Nebraska Beef Cattle Report · 79
© Th e Board Regents of the University of Nebraska. All rights reserved.
pens (10 pens per simple eff ect treatment) with 14– 21 steers per pen (equal steers/pen within block). During processing on d 1, all steers were identifi ed with an individual ear tag (3 tags total), individually weighed, and vaccinated with Somnu Shield® (Novartis Animal Health) administered at 2ml/steer and Dectomax® injectable (Zoetis Animal Health) administered at 1ml/110 lb of BW. Steer ID was utilized for treatment assignment to vaccine treatment based on odd or even numbers. All odd number ID tags were vaccinated with VacPH- M (2ml/steer), while all even numbered tags were vaccinated with VacPH (2ml/steer).
All four treatments were fed a common diet consisting of 97% RAMP and 3% fi ne ground corn based supplement (DM Basis). Supplements contained either 0 or 25 g/ton of Rumensin® (DM basis). Both supple-ments contained 435 g/ton of decoquinate (Deccox®; Zoetis Animal Health). Aft er the 28- d receiving trial, steers were limit- fed (to minimize gut fi ll variation) a diet of 50% forage, 50% Sweet Bran (DM basis) at 2% of BW for 5 consecutive days before weighing for ending BW. Ending BW was an average of 2 consecutive day weights collected before feeding each day.
Performance data (BW, DMI, ADG, G:F) were analyzed using the MIXED procedure of SAS (SAS Inst., Inc., Cary, N.C.) with pen as the experimental unit. Th e model included Rumensin®, vaccine, and Rumensin® × vaccine interaction. Block (arrival) was included in the model as a fi xed eff ect. Morbidity incidence was evaluated as the number of fi rst treatments or the number of steers treated in the pen divided by the total number of steers in the pen. Additionally, the morbidity rate of two or more treatments was calculated as the number of steers treated two times divided by the total number of steers treated once. Morbidity data were analyzed with the GLIMMIX procedure of SAS using a bino-mial distribution and a logit- link function.
Titanium® 5 + NUPLURA® PH (VacPH) (Elanco Animal Health) are both BRD vaccinations intended for beef cattle. Th e vaccine VacPH- M is labeled to deliver eff ective immune response against bacteria (Mannheimia haemolytica and Pasteurella multocida) and viruses (bovine viral diar-rhea (BVD) types 1 and 2, infectious bovine rhinotracheitis (IBR), parainfl uenza- 3 virus (PI3) and bovine respiratory syncytial virus (BRSV)). Th e vaccine VacPH is labeled similarly to VacPH- M excluding protection against Pasteurella multocida. One common practice for receiving cattle today is feeding RAMP®, a complete starter product (Cargill Corn Milling) which contains a high level of Sweet Bran® and a minimal amount of forage (2013 Nebraska Beef Report, pp. 84– 85). Th e objective of this study was to eval-uate the eff ects of VacPH- M versus VacPH on steer growth performance and morbidity over a 28- d receiving period when steers are fed RAMP with or without Rumensin®.
Procedure
A feedlot receiving study was conducted to determine the eff ectiveness of vaccine at arrival on growth performance and health of steers over a 28- d receiving period when fed RAMP with 0 or 25 g/ton (DM basis) of Rumensin®. Th e experiment was conducted at the University of Nebraska- Lincoln Eastern Nebraska Research and Extension Center (ENREC) near Mead, NE. Crossbred steers (n = 704; initial BW = 593 ± 49 lb) were utilized in a randomized block design with a 2×2 factorial treatment design. Upon arrival, steers were allowed access to water and processed within 6 hours. Steers were weighed on d 1 to establish initial BW. Steers were assigned to one of four treatments (pen) based on processing order with steers assigned singly to treatment in sets of 4, and repeated until 4 pens were fi lled (1 replicate). Once a pen replicate was fi lled, new pen replicates were started until all steers were assigned to 40
Robert M. JonesCurt J. Bittner
F. Henry HilscherMallorie F. Wilken
Rick A. StockGalen E. Erickson
Summary with Implications
A receiving study was conducted to eval-uate the eff ects of RAMP® with Rumensin® concentration (0 or 25.0 g/ton) given with one of two viral vaccinations (Titanium® 5 PH- M or Titanium® 5 plus NUPLURA® PH) on steer growth performance and morbidity. Th ere were no signifi cant vaccine by diet interactions observed. Neither vaccine treat-ment nor Rumensin® level aff ected intake, gain, or feed conversion. Vaccine type did not aff ect fi rst pull (P = 0.19) or second pull mor-bidity rates (P = 0.52). Th ese fi ndings suggest that neither vaccine type nor Rumensin® concentration had any eff ect on steer growth performance or morbidity rate.
Introduction
Rumensin® (Elanco Animal Health) is an ionophore that has been shown to alter the rumen microbial population and is widely used in the feedlot industry to improve feed effi ciency. However, there has been limited current research evaluating the performance and morbidity impacts of feeding Rumensin® during the adaptation or receiving period in feedlot steers. A common perception is that calves cannot be started on Rumensin® without decreasing intake dramatically. Th e most prevalent disease in the beef industry is bovine respi-ratory disease (BRD). Respiratory disease can be caused by a combination of viral and bacterial pathogens, usually as a result of stress factors all interacting to cause morbid cattle. Titanium® 5 PH- M (VacPH- M) and
Comparison of Titanium® 5 PH- M versus Titanium® 5 plus NUPLURA® PH with the Presence or Absence of Monensin on
Health and Performance of Newly Received Feedlot Calves Fed RAMP®

80 · 2017 Nebraska Beef Cattle Report
Results
No signifi cant Rumensin® × vaccine interactions (P > 0.27) were noted for growth performance or morbidity (Table 1). Rumensin concentration did not aff ect DMI (P = 0.28), ADG (P = 0.94), F:G (P = 0.65), or ending BW (P = 0.83). While steers fed Rumensin® ate less feed numeri-cally, the diff erence was small (2%) and was not statistically signifi cant. Th e DM off ered across the 28- day receiving period is shown in Figure 1. Th e DM off ered was consis-tent across both treatments. Th ere was a tendency (P = 0.10) for steers fed 25.0 g/ton of Rumensin® to have a lower percentage of fi rst and second pulls as compared to steers receiving 0 g/ton of Rumensin®.
Vaccine type did not aff ect DMI (P = 0.52), ADG (P = 0.95), F:G (P = 0.79), or ending BW (P = 0.58). Th e number of steers pulled and treated for BRD one or more times was not diff erent (P = 0.19) for VacPH- M compared to VacPH. However, the numerical diff erence between vac-cine types was similar to the numerical diff erence between steers fed Rumensin® or not. While not signifi cant, steers vaccinated with VacPH had numerically lower fi rst pulls. No diff erence (P = 0.52) was observed when comparing second pull rates between vaccine types.
Conclusion
Results suggest that neither vaccine type nor Rumensin® concentration had any eff ect on steer growth performance or morbidity rate for the fi rst 28- d of receiving. Including Rumensin® from day 1 of receiving does not dramatically alter DMI of newly received calves.
Robert M. Jones, graduate studentCurt J. Bittner, research technicianF. Henry Hilscher, research technicianMallorie F. Wilken, Elanco Animal HealthRick A. Stock, Cargill, Blair, NEGalen E. Erickson, professor, Animal Science, Lincoln
25
20
15
10
5
00 1 2 3 4 5 6 7 8 9 10 11 12 13 14 15 16 17 18 19 20 21 22 23 24 25 26 27 28
Days on Feed
DM
offe
red,
lb/d
ay
Control
Rumensin
Table 1. Main eff ect comparisons of feeding Rumensin® and vaccine type on performance and morbidity over a 28- d receiving period.
Rumensin® Vaccine1
Item 0 g/ton
25 g/ton
P- value
VacPH- M VacPH P- value
SEM Interaction
Initial BW, lb
592 594 0.75 596 591 0.46 5.0 0.55
Ending BW, lb
680 682 0.83 683 679 0.58 6.0 0.59
DMI, lb/day
13.7 13.4 0.28 13.6 13.4 0.52 0.2 0.94
ADG, lb 3.28 3.27 0.94 3.28 3.27 0.95 0.09 0.81
Feed:Gain2 4.14 4.08 0.65 4.13 4.09 0.79 - 0.79
Morbidity
First pull, %3
22.6 17.4 0.10 22.0 17.9 0.19 2.3 0.38
Second pull, %4
22.5 13.8 0.21 15.7 20.0 0.52 5.3 0.27
1 VacPH- M is Titanium 5 PH- M and VacPH is Titanium 5 +Nuplura PH.2 Gain:Feed analyzed statistically, which is the reciprocal of Feed:Gain.3 Percentage of steers treated one or more times as a % of total steers within the pen.4 Percentage of steers treated two or more times, expressed as a % of steers pulled once.
Figure 1. Daily DM off ered to steers consuming a RAMP diet with or without Rumensin®.

2017 Nebraska Beef Cattle Report · 81
© Th e Board Regents of the University of Nebraska. All rights reserved.
block design, with the blocking factor be-ing source/arrival time of the steers. Steers were assigned to pens by sorting every two steers into one of three pens before processing. Pens were assigned randomly to one of three treatments within arrival block. Steers were administered one of three implant treatments; 1) Revalor®- IS (80 mg of TBA and 16 mg of E) on day 1; 2) Revalor®- IS on day 1 and Revalor®- 200 (200 mg of TBA and 20 mg of E) on day 67; 3) Revalor®- XS (200 mg of TBA and 40 mg of E) on day 1. All treatments received a terminal implant, Revalor®- 200, at 133 days on feed. At initial processing all steers received a Vista 3, Safeguard oral suspen-sion of wormer (Safeguard) in conjunction with an Avermectin product, along with the assigned initial implant. Mean days on feed across all blocks was 215, with the second and third implants administered on average at day 67 and 133, respectively. A
as an initial implant and re- implanted with Revalor®- 200. A more intensive evaluation of implant protocols in calf- fed steers is needed. Th e objectives of this study were to determine the eff ect of three initial implant programs: Revalor®- IS (day 1), Revalor®- IS (day 1) and Revalor®- 200 (day 67), or Revalor®- XS (day 1), all followed by a terminal Revalor®- 200 (day 133) on feedlot performance and carcass traits of weaned calf- fed steers fed for 200 to 220 days.
Procedure
A commercial feedlot experiment was conducted at a commercial feedlot in cen-tral Nebraska (Hi- Gain Feedlot, Farnam, NE). Crossbred steer calves (n = 1,350; ini-tial BW = 623 lb; ±23 lb) from ranches and auction barns in NE, IA, UT, SD, ID, and CA were utilized for this trial. Th is study was conducted as a randomized complete
Colton R. OneyGalen E. EricksonAndrea K. Watson
Marshall N. StreeterRobert J. Cooper
Bill D. DickeD. J. Jordon
Tony L. Scott
Summary with Implications
A commercial feedlot study utilizing 1,350 calf- fed steers (initial BW = 623 lb; ±23 lb) compared three initial implant strate-gies: Revalor®- IS (day 1), Revalor®- IS (day 1) and Revalor®- 200 (day 67), or Revalor®- XS (day 1). Each initial implant strategy was followed by a terminal Revalor®- 200 implant (day 133) to determine eff ects on perfor-mance and carcass traits. No diff erences in fi nal body weight, intake, gain, or feed conversion were observed on either a live, or carcass adjusted basis. Th ere were also no diff erences in hot carcass weight, USDA qual-ity grade, or USDA yield grade. Results from this study suggest initial implant strategy has minimal impact on feedlot and carcass performance when following with a terminal Revalor®- 200 implant.
Introduction
Steers have shown the ability to respond to higher dose single implant protocols with increased growth performance and leaner body composition when cattle are harvested on an equal day basis. Increasing trenbolone acetate (TBA) and estradiol (E) levels in re- implant protocols have resulted in mixed results. Regardless, industry use of steer protocols providing a Revalor®- IS ini-tially, followed by 2 Revalor®- 200 implants, approximately 65 days apart in steers fed for 200 to 220 days, has become increasingly common. Only two studies have evaluated aggressive protocols utilizing Revalor®- XS
Eff ect of Th ree Initial Implant Programs with a Common Terminal Revalor®- 200 on Feedlot Performance and
Carcass Traits of Weaned Steers
Table 1. Performance of steers Implanted with either Revalor®- IS (Rev- IS), Revalor®- IS and Revalor®- 200 (Rev- IS/200), or Revalor®- XS (Rev- XS) followed by a terminal Implant of Revalor®- 200.
Variable Rev- IS Rev- IS/200 Rev- XS SEM P- value
Pens 6 6 6
Steers 451 449 450
Initial BW, lb 625 621 624 3.0 0.47
Live performance1
Final BW, lb2 1460 1459 1463 6.0 0.91
DMI, lb/d 22.9 22.7 22.8 0.1 0.19
ADG, lb 3.89 3.91 3.92 0.03 0.95
G:F 0.170 0.172 0.172 0.002 0.55
F:G 5.88 5.81 5.84 - 0.55
Carcass adjusted performance
Final BW, lb3 1457 1461 1462 7.9 0.60
ADG, lb 3.88 3.92 3.91 0.04 0.38
G:F 0.170 0.173 0.172 0.002 0.16
F:G 5.90 5.80 5.831Finishing performance was calculated with dead and rejected animals removed from the analysis.2Final BW is the average pen weight shrunk 4.0%. Subsequent ADG and F:G are calculated from 4.0% shrunk fi nal BW.3Calculated as HCW divided by the average dressing % of 64.25. Subsequent ADG and F:G re- calculated from carcass adjusted
fi nal BW.

82 · 2017 Nebraska Beef Cattle Report
step- up period consisting of three adaption diets was used to adapt cattle to the fi nish-ing ration. Th e fi nishing ration was identi-cal across treatments and contained 58.2% steam fl aked corn (range 74.6– 26.0%), 17.5% WDG (range 25.0– 9.0%), alfalfa hay 7.6% (range 32.0– 0.0%), mixed hay 5.1% (range 7.0– 4.0%), corn silage 4.7% (range 7.0– 3.0%), steer liquid supplement 4.9% (range 5.2– 4.1%), micro 0.04%, and 1.86% fat (range 2.7– 0.0%), all on a DM basis. All ration changes that occurred during the feeding period were the same for all cattle on trial. Pen weights were collected on day 1 and performance was calculated from pen BW. Final live BW was determined at shipping using the average of the pen weight shrunk by 4.0% to adjust for gut fi ll. Carcass- adjusted performance was calculated using fi nal BW, based on HCW divided by a common dressing percentage of 64.25 (overall trial average dressing percentage). Cattle were slaughtered at a commercial harvest facility on three dates. On day 1 of harvest HCW was recorded, aft er a 48- hour chill USDA quality and yield grades were recorded. Statistical anal-yses of both feedlot and carcass data were conducted using the GLIMMIX procedure of SAS (SAS Institute, Inc., Cary, N.C.). In addition, morbidity, mortality plus removals, and bullers were evaluated using PROC GLIMMIX of SAS. Alpha values ≤ 0.05 were considered signifi cant.
Results
No diff erences were observed in any of the performance variables measured, including fi nal BW, DMI, ADG, or F:G (P > 0.19; Table 1). No diff erences were observed for fi nal BW, ADG, or F:G (P > 0.16) on a carcass- adjusted basis (Table 1). As expect-ed, with a lack of diff erence in performance, there were no diff erences in HCW, dressing percentage, USDA yield grades 1– 5, or in USDA quality grading (P > 0.19).
No diff erences were noted in interim performance from day 1– 67 (P > 0.05) as expected due to implant payout (Table 3). A statistical diff erence in BW was observed on day 133. Cattle initially implanted with Revalor®- IS were lighter compared to the other two treatments (P < 0.01). Th e diff erence in BW was driven by the fact that cattle initially implanted with Revalor®- IS gained less (P < 0.01) from day 67 through
Table 2. Carcass characteristics of steers Implanted with either Revalor®- IS (Rev- IS), Revalor®- IS and Revalor®- 200 (Rev- IS/200), or Revalor®- XS (Rev- XS) followed by a terminal Implant of Revalor®- 200.
Variable Rev- IS Rev- IS/200 Rev- XS SEM P- value
HCW, lb 936 939 940 5.10 0.59
Dressing % 64.17 64.34 64.24 3.10 0.93
Yield Grade1,2
1 2.1 1.8 1.2 0.78 0.71
2 15.9 19.8 15.1 1.89 0.22
3 57.2 60.6 61.9 2.76 0.48
4 23.9 16.5 20.9 2.68 0.19
5 0.9 1.3 1.0 0.43 0.88
Quality Grade1,2
Prime 2.0 0.5 0.0 0.44 0.21
Choice 67.2 68.8 68.7 2.21 0.85
Select 29.0 28.6 28.0 2.02 0.95
Standard 0.9 0.9 2.4 0.64 0.21
Commercial 0.9 1.2 0.9 0.71 0.951Yield grade and quality grade are called USDA values.2All numbers are expressed as percentages.
Table 3. Interim performance of steers Implanted with either Revalor®- IS (Rev- IS), Revalor®- IS and Revalor®- 200 (Rev- IS/200), or Revalor®- XS (Rev- XS) followed by a terminal Implant ofRevalor®- 200.
Variable Rev- IS Rev- IS/200 Rev- XS SEM P- value
D 1– 67
Initial BW, lb 625 621 624 3.0 0.47
D 67 BW, lb 922 911 923 2.7 0.06
DMI, lb/d 21.9 21.6 21.9 0.06 0.06
ADG, lb 4.43 4.35 4.43 0.05 0.49
G:F 0.203 0.201 0.202 0.002 0.87
F:G 4.94 4.97 4.94 - 0.87
D 67– 133
D 133 BW, lb 1139b 1165a 1162a 1.6 <0.01
DMI, lb/d 22.4 22.4 22.7 0.24 0.62
ADG, lb 3.42c 4.01a 3.76b 0.05 <0.01
G:F 0.153b 0.179a 0.166ab 0.004 0.02
F:G 6.56 5.59 6.06 - 0.02
D 1– 133
D 133 BW, lb 1139b 1165a 1162a 1.6 <0.01
DMI, lb/d 22.0 21.8 22.0 0.26 0.76
ADG, lb 3.93b 4.18a 4.10ab 0.04 0.03
G:F 0.177b 0.191a 0.185ab 0.003 0.05
F:G 5.65a 5.26b 5.42ab - 0.05
D 133– 215
D 215 BW, lb 1460 1459 1463 6.0 0.91
DMI, lb/d 24.5 24.2 24.5 0.26 0.78
ADG, lb 3.53 3.21 3.21 0.09 0.11
G:F 0.146 0.133 0.132 0.005 0.21
F:G 6.85 7.52 7.58 - 0.21a,b,c Means within a row with diff erent superscripts diff er (P ≤ 0.05).
2017 Nebraska Beef Cattle Report · 83
implant, Revalor®- 200, had similar overall feedlot and carcass performance. Interim data suggest the cattle more aggressively implanted early gained faster through the fi rst two- thirds of the trial, but by conclu-sion of the study had lost the gain and feed effi ciency advantage. Th ese data suggest the use of more aggressive initial implant strat-egies has minimal impact on both feedlot and carcass performance.
Colton Oney, graduate studentGalen Erickson, professorAndrea Watson, research assistant professor, Animal Science, LincolnMarshall Streeter, Merck Animal HealthRob Cooper, Cattlemens Nutrition ServicesD.J. Jordon, Cattlemens Nutrition ServicesTony Scott, Cattlemens Nutrition ServicesBill Dicke, Dicke Consulting
133 compared to the other two treatments. Consequently, F:G was poorer (P ≤ 0.02) through that same time as well. Interest-ingly, cattle that received a Revalor®- 200 on day 67 gained better than the other two treatments from day 67 through 133 (P < 0.01) and were more effi cient (P ≤ 0.02) than cattle that initially received a Revalor®- IS, but were similar in effi ciency (P > 0.05) to cattle that initially received a Revalor®- XS. No diff erences were noted in any of the performance variables measured between days 133 and 215 (P > 0.05). Steers that ini-tially received a Revalor®- IS had numerical-ly greater ADG and lower F:G compared to the other treatments which likely resulted in no overall diff erences in performance from day 1– 215.
Conclusion
In conclusion, steers implanted with Revalor®- IS, Revalor®- IS/200, or Revalor®- XS followed by a common terminal
84 · 2017 Nebraska Beef Cattle Report
© Th e Board Regents of the University of Nebraska. All rights reserved.
was gradually introduced in the diet while replacing grass hay and corn silage. Th e supplement was formulated for 30 g/ton of DM as Rumensin® (Elanco Animal Health) and to provide 90 mg/steer daily of Tylan® (Elanco Animal Health). Steers were fed once daily between 0700 and 0900 hours.
Optafl exx was initiated when steers were 35 days from their projected endpoints. Steers were pen weighed on the day of treatment initiation and every 7 d thereaf-ter. Steers were removed from their pens (approximately 0700 hours) prior to feeding and pen weights were collected using a pen scale. Pen weights (4% pencil shrink applied) were collected every 7 d to evaluate live performance over the Optafl exx treat-ment phase. All residual feed remaining in the bunk was removed and weighed. Optafl exx was delivered daily during the treatment phase via dry supplement in the total mixed ration at 300 mg/steer daily, with fi ne ground corn as the carrier. Two dry supplements were used during the treatment phase, one that contained no Optafl exx and one that provided 300 mg of Optafl exx.
Initially, all steers were implanted with Component® TE- IS (Elanco Animal Health). Given variable harvest dates, multiple terminal implanting dates were established to standardize the terminal implant window to 90 days. All steers were re- implanted with the terminal implant Component® TE- 200 (Elanco Animal Health). On day of shipping, steers to be shipped were pulled out of pens, weighed to determine fi nal live BW, then placed back in pens and were fed 50% of the previous days feed called. In the aft ernoon all steers to be shipped were pulled from pens and loaded onto the truck. All steers were harvested at a commercial abattoir (Greater Omaha) aft er 118, 139, 160, or 174 days on feed, depending on treatment. Hot carcass weight and liver scores were recorded on day of harvest. Aft er a 48- hour chill, LM area, USDA marbling score, and 12th rib fat thickness were recorded. Yield grade
and fed to larger fi nished weights common today with increased days on feed (DOF). Th erefore, the objective of this experiment was to evaluate the eff ects of increasing DOF and feeding Optafl exx on perfor-mance of large yearlings.
Procedure
A feedlot study was conducted at the University of Nebraska- Lincoln Eastern Nebraska Research and Extension Cen-ter (ENREC) near Mead, NE. Crossbred yearling steers (n = 342; initial BW = 917 ± 74 lb) were utilized in a randomized block design (3 BW blocks) with a 2 × 3 + 1 factorial treatment design. Factors included Optafl exx dosage (0 or 300 mg/steer daily) and days on feed (118, 139, or 160 d) plus cattle fed 2 weeks longer (174 d) without Optafl exx. Prior to initiation of trial, steers were limit fed at 2% of BW for 5 days a diet consisting of 50% Sweet Bran® (Cargill) and 50% alfalfa hay (DM basis) to minimize variation in gastrointestinal fi ll. Steers on the 118 d treatment were fed to a target endpoint of approximately 1000 lb HCW or 0.5 in. of fat thickness. Steers on the 139 d treatment were fed to a target endpoint of 1050 lb HCW, and 160 d steers were fed to a target of 1100 lb HCW. Lastly, steers on the 174 d treatment were not fed Optafl exx to compare the impact of just feeding cattle longer. Steers were weighed two consecutive days (day 0 and 1) to establish initial BW. Steers were blocked by day 0 BW, strati-fi ed by BW within blocks (light, medium, heavy), and assigned randomly to 42 pens. Pens were assigned randomly to one of 7 treatments with 6 pens per treatment (8 steers/pen). Light, medium, and heavy blocks consisted of 2, 3, and 1 replications, respectively. All steers were adapted to a common fi nishing diet over a 21- day period consisting of four adaptation diets. Th e amounts of Sweet Bran and supplement included in each adaptation diet were held constant at 40 and 5% (DM basis), respec-tively. Th e amount of high moisture corn
Robert M. JonesCurt J. Bittner
F. Henry HilscherMallorie F. WilkenGalen E. Erickson
Summary with Implications
A feedlot study evaluated the eff ects of ractopamine hydrochloride (Optafl exx®) dosage (0 or 300 mg/steer daily) and days on feed (118, 139, 160, 174 DOF) as a 2 × 3 + 1 factorial (steers fed 174 d were not fed Optafl exx) on performance of big yearlings. No interaction was observed between Opta-fl exx and days on feed. Feeding Optafl exx improved live fi nal BW, carcass- adjusted ADG, carcass- adjusted feed conversion, and calculated yield grade. Increasing days on feed linearly increased live fi nal BW, carcass- adjusted feed conversion, HCW, dressing percent, and marbling score but not ADG. Furthermore, a quadratic increase in LM area, 12th rib fat, and calculated yield grade was observed with days on feed. Th e response in added carcass weight due to feeding Optafl exx is the same with diff erent lengths of time cattle are fed, and for large yearlings placed on feed.
Introduction
Feeding β– adrenergic agonists has been shown to increase protein accretion and decrease fat deposition in animal growth (Journal of Animal Science, 1998, 76:160). Ractopamine hydrochloride (trade name Optafl exx®; Elanco Animal Health) has been widely used in the industry since 2004 to increase fi nal BW, HCW, and improve feed effi ciency in fi nishing cattle. Optafl exx has been approved for feeding the last 28 to 42 days at the label dose of 70– 430 mg/head to fi nishing cattle before harvest. However, limited data exist evaluating the eff ects of feeding Optafl exx to large yearling steers,
Evaluation of 0 or 300 mg of Optafl exx® on Growth Performance and Carcass Characteristics of
Steers Fed to Diff erent Degrees of Finish

2017 Nebraska Beef Cattle Report · 85
d fed cattle and low positive ADG for 139 d cattle. During these time points, weather was adverse with low comprehensive cli-mate index (CCI) numbers resulted in lack of change in BW or low ADG. Th e negative impact of weather on ADG impacted cattle performance measured on cattle fed for 118 or 139 d more so than cattle fed longer as cattle fed longer than 139 d had time to recover in performance.
Despite weather challenges, there were no signifi cant dose × days on feed interac-tions (P > 0.40) observed for growth perfor-mance; therefore, main eff ects will be dis-cussed. Live fi nal BW was 28 lb heavier (P = 0.01) for steers fed 300 mg of Optafl exx as compared to steers fed 0 mg. Steers fed 300 mg of Optafl exx had greater (P = 0.04) carcass- adjusted ADG (4.15 lb) compared to steers fed 0 mg (4.00 lb). Feeding 300 mg of Optafl exx resulted in an improvement (P = 0.05) in carcass- adjusted F:G. Carcass- adjusted DMI was not diff erent (P = 0.24)
Results
Cattle performance was negatively infl uenced by wet, cold, muddy conditions in December and January, which lowered ADG and HCW compared to targeted fi nish weights/HCW for the study. Cattle ADG was dramatically lowered during the time periods of d 90– 97 and 111– 118. Days 90– 97 (1/6/16– 1/13/16) of the trial, cattle on both treatments had a negative ADG response (control =- 0.12 and Optafl exx =- 0.09) as well as a loss of 1 lb in live interim BW. During days 111 to 118 (1/27/16– 2/3/2016), cattle performance suff ered a reduction in live interim BW for steers fed 118 d for both Optafl exx and control treatments (2 and 10 lb, respectively). Fur-thermore, cattle fed 139 d only had a slight increase in live interim BW for both control and Optafl exx treatments, 2 and 3 lb re-spectively. Th e reduction in live interim BW could be the result of negative ADG for 118
was calculated from the following formula: 2.50 + (2.50* fat thickness, in) + (0.2* 2.5 [KPH]) + (0.0038* HCW, lb)– (0.32* LM area, in2). Final live BW were pencil shrunk 4% to calculate dressing percent and live animal performance. A common dressing percentage of 63% was used to calculate carcass- adjusted performance to determine fi nal BW, ADG, and F:G.
Animal performance and carcass characteristics were analyzed as a 2 × 3 + 1 factorial using the MIXED procedure of SAS (SAS Institute, Inc., Cary, N.C.), with pen as the experimental unit. Steers that were removed during experiment were not included in the analysis. Th e model included Optafl exx dose treatment, days on feed, and dose × days on feed interaction. Block was treated as a fi xed eff ect. Treat-ment diff erences were declared signifi cant at P ≤ 0.05.
Table 1. Performance of yearling steers fed 0 or 300 mg/steer daily of Optafl exx for the last 35 days and fed overall for 118, 139, 160 or 174 d.
Days on Feed: 118 d 139 d 160 d 174 d P- value
Optaflexx Dosage: 0 300 0 300 0 300 0 SEM Int. Dose Days on Feed
Live Performance: Linear Quad.
Initial BW, lb 917 917 917 918 916 916 919 1.7 0.98 0.90 0.89 0.57
Final BW, lb 1 1407 1433 1457 1501 1539 1553 1587 14.5 0.51 0.01 <0.01 0.39
DMI, lb/d 29.9 30.3 29.4 30.0 28.4 28.4 28.6 0.4 0.56 0.25 <0.01 0.75
ADG, lb 2 4.16 4.38 3.91 4.23 3.92 4.00 3.87 0.10 0.43 <0.01 <0.01 0.25
F:G 3 7.23 6.98 7.59 7.13 7.29 7.11 7.42 — 0.57 <0.01 0.33 0.28
Carcass- Adjusted Performance:
Final BW, lb 4 1394 1418 1449 1481 1567 1581 1611 15.5 0.82 0.05 <0.01 0.22
ADG, lb 5 4.04 4.25 3.83 4.05 4.07 4.15 3.98 0.11 0.76 0.04 0.78 0.15
F:G 3 7.58 7.23 7.87 7.48 7.07 6.97 7.24 — 0.92 0.05 0.02 0.16
Live Treatment Phase Performance 6:
Initial BW, lb 1327 1336 1382 1404 1446 1434 1473 13.3 0.40 0.51 <0.01 0.59
DMI, lb/d 28.4 29.9 26.0 27.7 23.5 24.1 23.8 0.5 0.45 < 0.01 <0.01 0.05
ADG, lb 2 2.29 2.77 2.18 2.85 2.75 3.47 3.37 0.19 0.78 < 0.01 <0.01 <0.01
F:G 3 12.6 11.1 12.1 9.97 8.82 7.07 7.20 — 0.43 < 0.01 <0.01 <0.011Live fi nal BW measured by weighing cattle on pen scale day of shipping and applying a 4% pencil shrink.2Calculated using live fi nal BW.3Analyzed as G:F, the reciprocal of F:G.4Calculated from HCW divided by a common dressing percent (63%).5Calculated using carcass- adjusted fi nal BW.6Performance the last 35 days based on live performance when Optafl exx was fed.

86 · 2017 Nebraska Beef Cattle Report
Optafl exx. Additionally, 174 d steers tended to have an improved (P = 0.09) F:G as compared to steers fed 160 d fed 300 mg of Optafl exx. Th ese changes can be confound-ed with changes in weather observed during the study, as cattle were not fed during the same conditions when fed longer.
Conclusions
Feeding Optafl exx improved live fi nal BW, carcass- adjusted ADG, carcass- adjusted F:G, and calculated yield grade similar to other studies suggesting a similar response in big yearlings. Feeding steers longer increased fatness and weights. While feeding longer decreased ADG calculated on live BW, carcass- adjusted ADG re-mained constant as days fed increased.
Robert M. Jones, graduate studentCurt J. Bittner, research technicianF. Henry Hilscher, research technicianMallorie F. Wilken, Elanco Animal HealthGalen E. Erickson, professor, Animal Science, Lincoln
stant (P > 0.15) which lead to a small linear improvement (P = 0.02) in F:G, due to the reduction in DMI. Hot carcass weight, dressing percent, and marbling score were increased (P < 0.01) linearly as days on feed increased. LM area, 12th rib fat, and CYG increased (P < 0.01) quadratically as days on feed increased.
Steers fed 174 d had a greater (P < 0.01) live ADG during the treatment phase (last 35 d) as compared to the 118, 139 and 160 d fed steers. Steers fed 118 d had the highest (P < 0.01) DMI (29.1 lb) during the treat-ment phase, with 160 d steers having the lowest. Steers fed 174 d had the lowest (P < 0.01) F: G as compared to steers fed 118, 139, and 160 d.
Numerically, steers fed 174 d that received 0 mg of Optafl exx were 34.8 lb heavier (P = 0.07) compared to steers that were fed 160 d and received 300 mg of Optafl exx. Th ere were no diff erences (P = 0.23) in carcass- adjusted ADG between steers fed 174 d receiving 0 mg of Optafl exx compared to 160 d steers fed 300 mg of
between Optafl exx doses. Carcass- adjusted fi nal BW was 23 lb greater (P = 0.05) for steers fed 300 mg of Optafl exx compared to 0 mg (Table 1).
Th ere were no signifi cant dose × days on feed interactions for carcass data; therefore main eff ects will be discussed. Hot carcass weight tended to be 15.3 lb greater (P = 0.06) for steers fed 300 mg of Optafl exx as compared to 0 mg. Calculated yield grade was improved (P < 0.01) for steers fed 300 mg of Optafl exx (3.7) as compared to 0 mg (3.9). Fat thickness tended to be lower for steers fed Optafl exx compared to steers not fed Optafl exx. Dressing percentage and marbling score were not impacted (P > 0.31) by Optafl exx treatment (Table 2).
As days on feed increased, live fi nal BW and carcass- adjusted fi nal BW increased linearly (P < 0.01). Intake and live ADG decreased linearly (P < 0.01) as days on feed increased, which lead to no change (P > 0.28) in F:G (on a live basis) with increased days on feed. Because of increased dressing percent, carcass- adjusted ADG was con-
Table 2. Carcass characteristics of yearling steers fed 0 or 300 mg/steer daily of Optafl exx for the last 35 days and fed overall for 118, 139, 160 or 174 d.
Days on Feed: 118 d 139 d 160 d 174 d P- Value
Optafl exx Dosage: 0 300 0 300 0 300 0 SEM Int. Dose Days on Feed
Carcass Characteristics: Linear Quad.
HCW, lb 878 894 913 933 987 996 1015 9.8 0.82 0.06 <0.01 0.22
Dressing, %1 62.4 62.3 62.7 62.1 64.2 64.1 63.9 0.3 0.56 0.34 <0.01 0.48
Marbling2 505 492 558 537 578 577 612 14.8 0.76 0.31 <0.01 0.57
LM area, in2 13.1 13.8 12.9 13.4 13.5 14.0 13.7 0.2 0.85 <0.01 <0.01 0.01
12th rib fat, in 0.48 0.46 0.63 0.60 0.64 0.61 0.64 0.02 0.92 0.08 <0.01 <0.01
Calculated Yield Grade
3.4 3.2 4.0 3.8 4.1 3.8 4.1 0.09 0.99 <0.01 <0.01 <0.01
1DP = Dressing Percent; calculated from HCW divided by live BW, with a 4% pencil shrink applied.2Marbling Score: 300 = Slight, 400 = Small, 500 = Modest, etc.
2017 Nebraska Beef Cattle Report · 87
© Th e Board Regents of the University of Nebraska. All rights reserved.
ruary. Average initial BW for long yearlings was 904 lb. Furthermore, within each steer age class, pen means were grouped based upon initial BW (500 to 1200 lb, in 100 lb increments) when starting the fi nishing diet. Th e data set included 1,002 pens of calf- feds, 1,144 pens of short yearlings, and 435 pens of long yearlings. In total, the data set in-cluded 92 experiments consisting of 23,438 steers. Dietary treatments within each exper-iment were ignored in the data set.
Weekly DMI during the feeding period, as a percentage of current BW, was calculat-ed for each pen in the data set. Using initial pen BW and carcass adjusted ADG over the entire feeding period, weekly pen BW were calculated by increasing carcass- adjusted ADG by 0.00658 lb/d up to 50% of DOF and then decreasing carcass- adjusted ADG by 0.00658 lb/d beyond 50% DOF (Wilken et al., 2015 PAS pp. 224– 236). Body weight gain for each pen was calculated weekly and added to pen BW from the previous week. Finally, weekly DMI for each pen was divid-ed by the pen BW for the same week to determine DMI as a percent of current BW.
Average daily gain was calculated from HCW adjusted to a common dressing percentage (63%). Performance data from each pen of steers were used in the pooled- analysis. Experiments were weighted by the number of initial BW classes within each experiment to prevent artifi cial responses from experiments that consisted of few pen means in each initial BW class. Linear and quadratic regression coeffi cients were calculated using the mixed procedures of SAS (SAS Institute, Inc., Cary, N.C.). Th e signifi cances of the linear and quadratic coeffi cients were tested for each response variable using the mixed procedures of SAS. Experiment was included in the model as a random eff ect.
Results
As initial BW class increased, DMI (lb/d) increased quadratically (P < 0.01; Table 1) in calf- fed steers and averaged 22.8
predict feedlot performance of varying ages of steers entering the feedlot is valuable for marketing decisions. Numerous factors aff ect steer growth performance during the fi nishing period such as diet, age, tempera-ture, weather, etc. A common practice is to background steers on forages, such as crop residue or pastureland, for a certain period of time before starting the fi nishing phase. In Nebraska, the abundance of crop resi-dues, such as cornstalks, allows producers to background spring- born calves during the winter months at a relatively inexpen-sive cost of gain. Furthermore, grazing pas-ture allows producers to further prolong the backgrounding period and add weight to the animal. Th erefore the objective of this pooled analysis was to determine how age and body weight (BW) of steers at feedlot entry aff ects DMI, ADG and F:G over the fi nishing phase.
Procedure
A pooled- analysis from pens at the University of Nebraska- Lincoln Eastern Nebraska Research and Extension Center feedlot examined the eff ects of steer age and initial BW on feedlot growth performance in studies conducted from 2002 to 2015. Spring born, predominately black, crossbred steers were purchased each fall by the feedlot. For data analysis, pens were divided into 3 subclasses based on steer age (calf- fed, short yearling, or long yearling) when they started the fi nishing diet. Calf- feds were defi ned as starting the fi nishing diet in the fall, usually November, and then fi nished the following spring, typically May. Average initial BW for calf- feds was 689 lb. Short yearlings grazed corn residue or were grown in dry- lot from November to April, and then started on the fi nishing diet in May and were harvested in September or October. Short yearlings had an initial BW of 820 lb. Long yearlings back-grounded from November to April similar to short yearlings, grazed pasture from May to September, and then started fi nishing in Oc-tober and were harvested in January or Feb-
Curtis J. BittnerAndrea K. WatsonJim C. MacDonaldGalen E. Erickson
Summary with Implications
A pooled- analysis of UNL feedlot pens examined the eff ects of steer age and body weight on feedlot growth performance. For data analysis, pens were divided into 3 subclasses based on steer age (calf- fed, short yearling, or long yearling) and, grouped based upon initial body weight (500 to 1200 lb, in 100 lb increments) within each age class. As initial body weight increased, DMI (lb/d) for the whole feeding period increased quadratically in calf- fed steers and increased linearly in short and long yearlings. A quadratic increase in ADG was observed in calf- feds as initial body weight increased. No diff erences in ADG were observed for short and long yearlings due to initial body weight. As heavier cattle were placed within age group, feed conversion increased linearly. Predicting DMI is more consistent when expressed as % of body weight. Predicting intake and growth performance over the entire feeding period, in order to facilitate management decisions, is dependent upon steer age and initial weight when starting the fi nishing diet.
Introduction
Predicting feedlot growth performance over the feeding period is critical when determining the nutritional requirements of the animal at diff erent stages of growth. For diet formulation, knowing DMI and ADG at the beginning of the feeding period is more critical than knowing overall average performance for the entire feeding period, as the requirement for protein is greatest at the beginning of the feeding period. Also, the capability for feedlot managers to
Predicting Feedlot Growth Performance over the Feeding Period Utilizing Steer Age and Body Weight

88 · 2017 Nebraska Beef Cattle Report
Table 1. Eff ect of initial BW class (lb.) when starting the fi nishing phase on steer growth performance
Initial BW Class 500 600 700 800 900 1000 1100 1200 SEM Linear1 Quad2
Calf- feds
Pens, n 81 500 349 72
Head, n 826 4794 3379 805
DMI, lb/d 21.5 22.2 23.1 24.4 - - - - 0.2 <0.01 <0.01
ADG, lb3 3.75 3.79 3.81 3.97 - - - - 0.06 <0.01 0.03
F:G4 5.71 5.85 6.05 6.18 - - - - - <0.01 0.48
DMI, % CBW5 2.26 2.28 2.25 2.23 - - - - - - -
Short Yearlings
Pens, n 21 521 400 180 22
Head, n 210 4320 3261 1522 206
DMI, lb/d - 24.3 25.1 25.8 26.6 27.6 - - 0.5 <0.01 0.54
ADG, lb3 - 3.83 3.84 3.84 3.86 3.89 - - 0.13 0.64 0.87
F:G4 - 6.35 6.51 6.71 6.88 7.12 - - - <0.01 0.93
DMI, % CBW5 - 2.57 2.43 2.35 2.28 2.19 - - - - -
Long Yearlings
Pens, n 77 141 141 63 8 5
Head, n 780 1318 1337 561 74 45
DMI, lb/d - - 25.3 26.6 28.1 29.2 29.7 31.1 0.73 <0.01 0.16
ADG, lb3 - - 3.78 3.82 4.02 4.03 3.93 4.01 0.17 0.05 0.13
F:G4 - - 6.68 6.96 6.94 7.25 7.48 7.60 - <0.01 0.99
DMI, % CBW5 - - 2.56 2.48 2.32 2.20 2.23 2.30 - - -
1Linear contrasts for initial BW class within steer age group.2Quadratic contrasts for initial BW class with steer age group.3Calculated using carcass- adjusted fi nal BW.4Analyzed as G:F, the reciprocal of F:G.5Dry matter intake calculated as a percent of current BW (CBW) over the entire feeding period.
Calf-fed
Long Yearling
Short Yearling
3.5
3.0
2.5
2.0
1.5
1.0
0.5
0.00 10 20 30 40 50 60 70 80 90 100
% of DOF
DM
I, %
of c
urre
nt B
W
Figure 1. Dry matter intake as a percent of current BW across DOF

2017 Nebraska Beef Cattle Report · 89
Conclusion
Delaying the time (i.e., increasing age) in which steers start the fi nishing phase resulted in poorer feed conversions. Evaluating DMI as a percent of current BW reduces variation due to steer age and BW; however, as days on feed increases, intake as a percent of current BW decreases. Predict-ing intake and growth performance over the entire feeding period is critical for pro-ducers to meet the nutritional requirements of the animal at certain stages of growth and varies depending on steer age and BW when started on the fi nishing diet.
Curtis J. Bittner, research technicianAndrea K. Watson, research assistant professorJim C. MacDonald, associate professorGalen E. Erickson, professor, University of Nebraska, Department of Animal Science, Lincoln, NE
phase at 1000 lb compared to 600 lb short yearlings. Lastly, F:G increased linearly (P < 0.01) as initial BW class increased for long yearlings. Feed conversions were 13.8% poorer for long yearlings starting the fi n-ishing phase at 1200 lb compared to 700 lb. Th ese data support what many producers already know, bigger cattle are less effi cient (greater F:G) than lighter cattle. Th is com-mon observation holds true within cattle age group though as well. Overall, DMI was quite variable for all age groups of steers with a range of 21.4 to 31.0 lb/d being ob-served. However, when calculating DMI as a percent of current BW (Table 1), DMI was relatively constant over the entire feeding period with a range of 2.2 to 2.6% for all age groups and initial BW class of steers. Dry matter intake as a percent of current BW is presented in Figure 1. Intake as percent of current BW was greatest early in the fi nish-ing period and decreased as days on feed increased. Th roughout much of feeding period, DMI as percent of current BW was lowest for calf- fed steers.
lb/d over the entire feeding period. Howev-er, in short yearlings, DMI increased linear-ly (P < 0.01) as initial BW class increased, with DMI averaging 25.9 lb/d. Likewise, DMI increased linearly (P < 0.01) as initial BW class increased for long yearlings and averaged 28.3 lb/d. A quadratic increase (P = 0.02) in carcass- adjusted ADG was observed in calf- feds as initial BW class increased. Numerically, ADG was greatest for calf- fed steers that started the fi nishing phase at an initial BW class of 800 lb. No diff erences (P > 0.63) in carcass- adjusted ADG were observed for short yearlings. Carcass- adjusted ADG increased linearly (P = 0.05) as initial BW class increased for long yearlings. Feed conversion (F:G) increased linearly (P < 0.01) as initial BW class for calf- fed steers increased. Feed conversion in calf- feds was 7.7% poorer for steers starting the fi nishing phase at an initial BW of 800 lb compared to steers at 500 lb. For short yearlings, F:G increased linearly (P < 0.01) as initial BW class increased. Feed conversions were 12.1% poorer for steers starting the fi nishing

90 · 2017 Nebraska Beef Cattle Report
© Th e Board Regents of the University of Nebraska. All rights reserved.
the wet milling industry. Likewise, the 40FIB treatment was formulated to mimic 40MDGS by adding 3% SEM and 14% wet corn bran. On a DM basis, all diets contained 12% high moisture corn (HMC), 8% corn silage, 3% alfalfa hay, and supple-ment fed at either 5% or 8%. Th e control, 20FIB, and 40FIB had a greater inclusion of supplement because 3% soybean meal was fed in addition to urea as a RDP source. Th e supplement also provided Tylan- 40® (Elan-co Animal Health) at 90 mg per steer daily and Rumensin- 90® (Elanco Animal Health) at 30 g per ton DM.
Blocks 1, 2, and 3 were implanted with Revalor- 200 99 days prior to harvest and block 4 was implanted 113 days prior to harvest. Cattle in the three heavier blocks were fed for 134 days and the light block was on feed for 148 days. Steers were shipped to Greater Omaha for slaughter, and carcass data were recorded. On day of harvest, hot carcass weight and liver score were collected. Following a 48- hour chill, USDA marbling score, LM area, and 12th rib fat thickness were recorded. Animal perfor-mance and carcass characteristics were an-alyzed as an unstructured treatment design using a protected F- test, where block was included as a fi xed eff ect. Treatment design was also analyzed as a 2x2+1 with two feed sources (MDGS or Fiber) and two inclusion levels (20 or 40%) plus a control. Inter-actions for the 2x2 factorial design were evaluated. Linear and quadratic orthogonal contrasts were used to evaluate inclusion of MDGS or fi ber in the diet with the control being the 0% inclusion level. Data were analyzed using the MIXED procedure of SAS (SAS Institute, Inc. Cary, N.C.), where pen was the experimental unit. Treatment diff erences were declared signifi cant at P ≤ 0.05. One steer from the control treat-ment died on day 147 and a steer from the 40MDGS treatment was removed on day 86 due to repeated bloating. Th ese two steers were removed from performance data.
study (2016 Nebraska Beef Cattle Report, pp. 122– 23). A diff erent experiment con-cluded that feeding individual components did not mimic performance of WDGS, but including fi ber, protein, fat and solubles combined together gave the same perfor-mance as feeding WDGS (2016 Nebraska Beef Cattle Report, pp. 124– 127). Th ese fi ndings demonstrate that the interactions between fi ber, protein, fat, and solubles in WDGS are important, and have a similar feeding value to WDGS. Th e objective of this study was to determine the value of the fi ber in modifi ed distillers grains plus solubles for fi nishing cattle performance.
Procedure
A fi nishing experiment conducted at the Eastern Nebraska Research and Extension Center utilized 800 crossbred yearling steers (initial BW = 915 lb ± 53 lb). For fi ve days before the beginning of the trial, cattle were limit- fed a diet of 50% alfalfa and 50% Sweet Bran (DM Basis) at 2% of BW to re-duce variation in gastrointestinal fi ll. Cattle were weighed on day 0 and 1 to establish an accurate initial BW. Steers were split into four blocks according to their initial BW with each block consisting of 200 head. A total of 100 pens were used on the study with 8 steers per pen. Pens were assigned randomly to treatment with fi ve treatments and 20 pens per treatment. All cattle were adapted to the fi nishing treatments over a fi ve step adaptation process by replacing alfalfa with dry- rolled- corn (DRC).
Th e fi ve treatments consisted of a corn control diet (CON), 20% (20MDGS) or 40% (40MDGS) modifi ed distillers grains plus solubles (MDGS), plus two diets formulated with corn germ meal and corn bran to equal the fi ber content of the two MDGS diets (20FIB and 40FIB; Table 1). To mimic the nutrient composition of the 20MDGS treatment, the 20FIB treatment contained 1.5% solvent extracted germ meal (SEM) and 7% wet corn bran from
Jordan E. BurhoopLiesel J. Schneider
Curtis J. BittnerF. Henry HilscherJim C. MacDonaldRodney A. Moxley
David R. SmithGalen E. Erickson
Summary with Implications
A fi nishing study was conducted to determine the value of the fi ber in distillers grains plus solubles on cattle performance. Five treatments were evaluated: a corn control diet, 20 or 40% modifi ed distillers grains plus solubles, plus two diets containing corn germ meal and corn bran balanced to equal the fi ber content of the two modifi ed distillers grains plus solubles diets. Th ere was a signifi cant improvement in ADG and F:G for cattle fed modifi ed distillers grains plus solubles compared to control. Cattle fed the corn germ meal and bran diets had increased DMI, slightly lower ADG, and poorer F:G compared to the control. Th e isolated fi ber component had 83– 90% the feeding value of corn, while modifi ed distillers grains plus solubles had 107– 108%. Other components in distillers besides fi ber must improve the value of distillers compared to corn.
Introduction
Distillers grains are commonly fed in fi nishing diets. Th e ethanol industry has recently started removing components of distillers grains, such as fi ber components and corn oil, which changes the nutrient content of distillers grains plus solubles that are available to be fed. In recent years, research has been done using these compo-nents to formulate diets that give the same performance as feeding distillers grains. Feeding the fi ber portion resulted in the closest performance to the DGS diet in one
Evaluation of the Value of Fiber in Distillers Grains Plus Solubles on Performance of Finishing Cattle

2017 Nebraska Beef Cattle Report · 91
Results
Initial BW (P = 0.63; Table 2) was not infl uenced by treatment, based on alloca-tion. Intakes were impacted by treatment (P < 0.01) and DMI increased with MDGS inclusion, with steers fed 20MDGS having the greatest DMI. Steers fed 40MDGS or 40FIB had similar DMI (P = 0.76), whereas steers fed 20MDGS consumed more (P < 0.01) than steers fed 20FIB. When 40FIB was fed, DMI increased linearly (P = 0.01) relative to CON. Dietary treatment impact-ed ADG (P < 0.01), as ADG increased with MDGS inclusion, and equal ADG between 20MDGS and 40MDGS (P = 0.96). Feeding 20FIB and 40FIB slightly reduced ADG but not statistically (P > 0.14) compared to CON. As a result of increased ADG, F:G improved linearly (P < 0.01) for steers fed MDGS. When steers were fed 20FIB or 40FIB, F:G increased linearly (P < 0.01) due to an increase in DMI and numerical decrease in ADG compared to CON. Th e feeding value of MDGS relative to corn (diff erence between test G:F and control G:F divided by control G:F, then divided by by- product inclusion level) was 107% for 20MDGS and 108% of corn for 40MDGS. Th e isolated fi ber treatments had feeding values that were lower than the control at 83% for 20FIB and 90% for 40FIB. Th e cat-tle performed as expected with the MDGS treatments showing the best performance and the fi ber treatments having reduced performance. Steers on the MDGS treat-ments had the greatest HCW (P < 0.01) and fat thickness (P < 0.01) compared to the other three treatments. Cattle fed 20MDGS had the highest marbling (P < 0.01), with the other four treatments being lower and not signifi cantly diff erent from each other.
Table 1. Composition (% of diet DM) of dietary treatments fed to yearling steers.
Ingredient Treatment1
CON 20MDGS 40MDGS 20FIB 40FIB
Dry- rolled corn 68.5 51.5 31.5 60 51.5
High- moisture corn 12 12 12 12 12
MDGS2 - 20 40 - -
SEM3 - - - 1.5 3
Wet Corn Bran - - - 7 14
Corn Silage 8 8 8 8 8
Alfalfa hay 3.5 3.5 3.5 3.5 3.5
Supplement4 - - - - -
Fine Ground Corn 1.228 2.635 2.899 1.361 1.856
Limestone 1.615 1.599 1.585 1.633 1.604
Tallow 0.2 0.125 0.125 0.2 0.2
Urea 1.377 0.25 - 1.2 0.75
SBM 3 - - 3 3
Potassium Chloride 0.189 - - 0.215 0.199
Salt 0.3 0.3 0.3 0.3 0.3
Beef Trace Minerals 0.05 0.05 0.05 0.05 0.05
Vitamin A- D- E 0.015 0.015 0.015 0.015 0.015
Rumensin- 90®5 0.017 0.017 0.017 0.017 0.017
Tylan- 40®6 0.009 0.009 0.009 0.009 0.009
Nutrient Composition, % of DM
CP 14.1 15.1 19.8 14.1 13.3
NDF 11.0 16.7 22.0 16.6 22.2
ADF 4.5 6.6 8.6 6.0 7.5
Lignin 1.7 2.3 2.9 1.9 2.21 Treatments included CON- control; 20MDGS- 20% modifi ed distillers grains plus solubles; 40MDGS- 40% modifi ed distillers
grains plus solubles; 20FIB- fi ber fed from concentrated ingredients to mimic fi ber provided by 20MDGS; 40FIB- fi ber fed from concentrated ingredients to mimic fi ber provided by 40MDGS.
2 MDGS: Modifi ed distillers grains plus solubles,3 SEM: solvent extracted germ meal4 Supplement fed at 8% of dietary DM for CON, 20FIB, and 40FIB and 5% of dietary DM for 20MDGS and 40MDGS5 Formulated to supply Rumensin- 90® (Elanco Animal Health) at 30 g per ton DM6 Formulated to supply Tylan- 40® (Elanco Animal Health) at 90 mg per steer daily

92 · 2017 Nebraska Beef Cattle Report
Jordan E. Burhoop, graduate studentLiesel J. Schneider, graduate student, Mississippi State UniversityCurtis J. Bittner, research technicianF. Henry Hilscher, research technicianJim C. MacDonald, associate professor Animal Science, LincolnRodney A. Moxley, School of Veterinary Medicine and Biomedical Sciences, LincolnDavid R. Smith, professor, Mississippi State UniversityGalen E. Erickson, professor Animal Science, Lincoln
Conclusion
Th ese data illustrate that F:G was poorer if only the fi ber components that typically comprise distillers grains replace corn. Th ese data suggest that the isolated fi ber component does not give equal perfor-mance to feeding MDGS. It is unclear what impact a removal of a portion of the fi ber from distillers may have, if other com-ponents are concentrated. Th ese data are based on fi ber isolated from the wet milling process, but presumably applies for fi ber from distillers grains plus solubles as both are isolated from corn grain.
Table 2. Eff ect of feeding modifi ed distillers grains (MDGS) at 20 or 40% compared to fi ber to mimic NDF provided by 20 or 40% MDGS on feedlot performance and carcass characteristics
Treatment1 P- values2
CON 20MDGS 40MDGS 20FIB 40FIB SEM F- TEST INT SOURCE INCLUSION
Feedlot Performance
Initial BW, lb 915 916 916 915 915 0.9 0.63 0.53 0.26 0.89
Final BW, lb3 1439b 1473a 1472a 1428b 1429b 5.5 <0.01 0.90 <0.01 0.96
DMI, lb/d 25.7c 26.9a 26.4b 26.0bc 26.3b 0.2 <0.01 0.03 0.01 0.54
ADG, lb 3.81b 4.05a 4.04a 3.73b 3.74b 0.04 <0.01 0.93 <0.01 0.98
F:G 6.75b 6.64ab 6.53a 6.97c 7.03c - <0.01 0.09 <0.01 0.47
Carcass Characteristics
HCW, lb 907b 928a 928a 900b 901b 3.5 <0.01 0.90 <0.01 0.96
LM area, in2 13.7 13.7 13.5 13.6 13.6 0.1 0.42 0.12 0.73 0.45
Marbling4 477b 496a 476b 465b 476b 6.0 <0.01 0.01 0.01 0.45
12th rib fat, in 0.53b 0.58a 0.59a 0.52b 0.55b 0.01 <0.01 0.27 <0.01 0.12
Liver Abscess (n)5 10 7 15 12 9 - 0.59 0.14 0.99 0.54
a- cMeans with diff erent subscripts diff er (P < 0.05)1 Treatments included CON- control; 20MDGS- 20% modifi ed distillers grains plus solubles; 40MDGS- 40% modifi ed distillers grains plus solubles; 20FIB- fi ber fed from concentrated ingredients to
mimic fi ber provided by 20MDGS; 40FIB- fi ber fed from concentrated ingredients to mimic fi ber provided by 40MDGS.2 INT=interaction between fi ber source and inclusion, SOURCE = P- value for main eff ect of fi ber source, INCLUSION = main eff ect of fi ber or MDGS inclusion.3 Calculated from HCW/common dressing percentage (63%)4 Marbling score: 400 = Slight00, 450 = Slight50, 500 = Small00, 550 = Small50
5 Liver Abscess Score: total number of A- , A, or A+ liver scores per treatment (159 or 160 steers per treatment group). Only two steers were observed with A+ abscesses.

2017 Nebraska Beef Cattle Report · 93
© Th e Board Regents of the University of Nebraska. All rights reserved.
Procedure
A fi nishing study was conducted utiliz-ing crossbred beef steers (96 steers, 12 pens) to study the eff ects of feeding mannan oli-gosaccharide (Agrimos; Lallemand Animal Nutrition; Montreal, Canada) and fi nely ground wheat straw on steer performance, body temperature, panting score, and blood metabolites during summer condi-tions. Steers were fed at the University of Nebraska- Lincoln (UNL) Eastern Nebraska Research and Extension Center research feedlot near Mead, Nebraska.
Cattle were limit- fed a diet consisting of 50% Sweet Bran (Cargill, Blair, Neb) and 50% alfalfa hay at an estimated 2% of BW for fi ve days prior to an initial BW being col-lected. Initial BW were collected over a 2 d period on day 0 and 1 of the experiment and averaged. Steers were stratifi ed by initial BW and assigned randomly to pen within strata. Treatment was assigned randomly to pen.
has been shown to increase the amount of short chain fatty acids present in the cecum which can provide oxidative protection to intestinal cells. Th e addition of fi ber to a fi nishing diet may also displace some energy therefore reducing metabolic heat load. Th is is supported by a study where a decrease in steer body temperature with the addition of increased fi ber levels to the diet was observed (1997 Nebraska Beef Cattle Report, pp. 85– 88).
Environmental stress has been a researched topic for the past few decades however, little is known about how feeding a yeast supplement or fi ne ground wheat straw will aff ect feedlot steer performance and body temperature. Th erefore, the objec-tive of the current study was to determine the eff ect of feeding a yeast supplement or adding fi nely ground wheat straw on steer performance, body temperature, panting scores, and blood metabolites.
Bradley M. BoydTerry L. Mader
Curt BittnerHenry HilscherGene Wijff els
John B. GaughanMegan Sullivan
Judy Cawdell- SmithGalen E. Erickson
Summary with Implications
Crossbred beef steers (12 pens, n=96) were used to determine the eff ect of adding Agrimos or 5% ground (1 in.) wheat straw compared to a control on body tempera-ture, panting score and performance. Th ere were no diff erences in fi nal BW, ADG, and DMI among treatments. Feed conversion was increased for cattle fed 5% additional ground straw when compared to control and Agrimos. Hot carcass weight, dressing %, LM area, and marbling score were not diff erent among treatments. Cattle fed the control had greater 12th rib fat depth and USDA yield grade than cattle fed straw or Agrimos. Both average and maximum body temperatures were slightly greater for cattle fed Agrimos than for cattle fed control or added straw. Panting scores were decreased slightly for cattle fed the extra straw when compared to control and Agrimos. Th e addition of Agri-mos or wheat straw to the diet had minimal eff ects on heat stress measures.
Introduction
Feeding prebiotics in an eff ort to reduce the negative eff ects of heat stress has pri-marily been studied in poultry. Studies have shown that feeding mannan oligosaccharide in the diet of poultry helped reduce some of the detrimental eff ects of heat stress in terms of reducing oxidative damage to the small intestine. In addition to feeding probiotics, feeding increased levels of fi ber
Th e Eff ect of Supplementing Mannan Oligosaccharide or Finely Ground Fiber, during the Summer on Body Temperature,
Performance, and Blood Metabolites of Finishing Steers
Table 1. Main eff ect of treatment on animal performance and carcass characteristics
Control Straw Agrimos SEM P- Value
Performance
Initial BW, lb 1056 1057 1056 5 0.98
Final BW, lb 1525 1501 1519 13 0.38
DMI, lb/d 27.3 28.0 27.1 0.5 0.43
ADG, lb 3.97 3.76 3.93 0.10 0.24
Hot Period DMI1, lb/d 26.2 27.7 26.3 0.6 0.19
NEg Intake, Mcal/d 14.50 14.02 14.38 0.25 0.39
F:G, 6.89b 7.46a 6.94b 0.12 0.02
Carcass Characteristics
HCW, lb 961 945 957 8 0.38
Dressing % 62.3 61.7 62.0 0.3 0.36
LM Area, in2 13.5 13.7 13.8 0.2 0.45
12th Rib Fat, in 0.60b 0.51a 0.53a 0.02 0.01
Marbling2 474 471 476 8 0.38
USDA Yield Grade3 3.9b 3.5a 3.5a 0.3 0. 36
Values within rows with unique superscripts are diff erent (P < 0.05)1Period between 6/25/2015 and 7/27/20152300 = slight, 400 = Small, 500 = Modest.3Calculated as 2.5 + (2.5 x 12th rib fat) + (0.2 x 2.5[KPH]) + (0.0038 x HCW)– (0.32 x REA)

94 · 2017 Nebraska Beef Cattle Report
sen between June 25, 2015 and July 27, 2015 and body temperatures and panting score were analyzed separately from the previously stated analysis for this timeframe.
Results
Th ere was no diff erence (P ≥ 0.19; Table 1) between treatments for initial BW, fi nal BW, ADG, DMI, warm period DMI, or NEg intake. However, F:G became poorer (P < 0.05) for STRAW when compared to CON or MOS cattle. Hot carcass weight, dressing %, LM area, and marbling score were not diff erent (P ≥ 0.36) between treatments. However, a diff erence (P < 0.02) in 12th rib fat depth and USDA yield grade was observed. Cattle fed CON had the greatest 12th rib fat depth and USDA yield grade when compared to MOS and STRAW cattle which were not diff erent (P > 0.05).
Average and maximum body tempera-ture were greatest (P < 0.05; Table 2) for cattle fed MOS when compared to CON and STRAW treatments, which were not diff erent (P > 0.05). Cattle fed STRAW had reduced panting scores (P < 0.05) when compared to cattle fed CON and MOS, which were not diff erent (P > 0.05). Average and maximum body temperature were also greater (P < 0.01; Table 2) for MOS cattle during the selected warm period. Panting scores also followed a similar pattern and were the greatest (P < 0.05) for MOS cattle and least for STRAW, with CON cattle being intermediate. Th ere was no observed diff erence in area under the curve for body temperature (P > 0.05) between treatments. Numerically, cattle fed MOS had greater area under the curve body temperature (P = 0.18) suggesting that the addition of MOS to the diet had little impact on physical heat stress experienced by the animal.
Th ere was a treatment ˟ time interaction (P < 0.05; Table 3) observed for hemoglobin and hematocrit levels. Th ese interactions would suggest that over time and as envi-ronmental conditions changed, there are diff erences in how these dietary treatments aff ect how the steers react metabolically. Th e observed interaction for hemoglobin, and hematocrit levels could be of importance as other research would suggest these me-tabolites are correlated with environmental temperature. Bilirubin has also been found
resulted in a total of 7 blood collections throughout the duration of the trial.
Environmental temperature, humidity, solar radiation, wind speed and baromet-ric pressure were collected automatically every 30 min throughout the duration of the trial using a Davis Vantage Pro 2 (Davis Instruments Vernon, IL) weather station located on site directly behind the pens. All cattle received a SmartStock (SmartStock; LLC. Pawnee, OK) temperature monitor-ing rumen bolus during the fi rst blood collection on d 21 of the trial. Boluses were programmed to transmit individual body temperature in twenty minute intervals to a receiver and transmitted to a central computer. In addition to body temperature, panting scores were collected by a trained individual each weekday at 1400. Scores were taken from outside the pen in the feed alley as to not disturb the animals.
Performance and carcass data were an-alyzed using the MIXED procedure of SAS (SAS Institute, Inc. Carry, N. C.) with pen as the experimental unit. Body temperatures were analyzed using the GLIMMIX proce-dure of SAS (SAS Institute, Inc.) with pen as the experimental unit. Average, maximum and area under the curve (AUC) were eval-uated for body temperature. Panting scores were also analyzed using the GLIMMIX procedure of SAS. A warm period was cho-
Th e trial was conducted during the summer of 2015 utilizing summer yearlings (initial BW = 1055±25 lb). Cattle were on feed for 121 days with the trial starting on May 26, 2015 and cattle harvested on September 23, 2015 at Greater Omaha.
Th e study was a completely random-ized design with three treatments and four replications per treatment. Th e basal diet consisted of 34.25% high- moisture corn (HMC), 34.25 dry- rolled corn (DRC), 20% modifi ed distillers grains plus solubles, 7.5% sorghum silage, and 4% supplement. Cattle were adapted onto the fi nishing diet over a 21- d period by reducing alfalfa inclusion in the diet and increasing levels of HMC/DRC blend. Th e fi rst treatment was a control (CON) consisting of only the basal diet. Th e second treatment included feeding Agrimos (MOS; Lallemand Animal Nutrition, Montreal, Canada) at 30g/steer daily added into the supplement. Th e third treatment consisted of feeding ground (1 in.) wheat straw (STRAW) at 5% of the diet DM replacing 5% of the DRC/HMC blend.
Blood samples were collected from each steer via jugular venous puncture. An initial measure was collected on day 23, aft er cattle were fully adapted to the fi nishing diet. Blood samples were collected from every steer on days 23, 37, 44, 51, 58, 65, and 79 of the trial. Th is blood collection schedule
Table 2. Main eff ect of treatment on body temperature and panting measurements
P- Value
Control Straw Agrimos SEM Trt Interaction1
Overall2
Average 102.3a 102.3a 102.6b 0.1 <0.01 <0.01
Maximum 105.0a 104.9a 105.5b 0.1 <0.01 <0.01
AUC3 2456 2455 2462 1 0.18 0.95
Panting Score4 1.75b 1.72a 1.76b 0.01 <0.01 <0.01
Hot Period5
Average 102.5a 102.5a 102.8b 0.05 <0.01 <0.01
Maximum 105.5a 105.4a 105.9b 0.07 <0.01 <0.01
AUC3 2460 2460 2467 3 0.18 0.95
Panting Score4 1.87ab 1.84a 1.90b 0.01 0.05 <0.01
Values within rows with diff erent superscripts are diff erent (P < 0.05)1 Interaction between day and treatment2 Mean values for the entire feeding period3 Area under the curve = Total magnitude of individual animal body temperature change within each treatment4 Panting scores based on 0 to 4 scale with 0 = no panting and 4 = severe distress5 Values for the selected warm period between days 31 and 62 of the trial (6/25/2015– 7/27/2015)

2017 Nebraska Beef Cattle Report · 95
to change in response to environmental con-ditions. In the current study, an interaction (P = 0.02; Table 3) was observed between treatment and time for bilirubin levels. Bilirubin may be important as injury to the small intestine remains an issue that can re-sult in decreased animal performance due to heat stress and some research would suggest that bilirubin has a protective eff ect in the small intestine towards oxidative injury.
Conclusion
In the present study there were no observed performance benefi ts for cattle supplemented with MOS or STRAW. Th e addition of MOS to the diet slightly increased body temperature both overall and during the selected warm period. Th e addition of STRAW increased F:G. However, no other performance traits were aff ected. While body temperature remained unchanged by the addition of STRAW to the diet, panting scores were decreased slightly when compared to both the CON and MOS diets, possibly suggesting that the addition of fi nely ground wheat straw to the diet may elevate some of the environmental stress experienced by the steers.
Bradley M. Boyd, graduate studentTerry L. Mader, professor emeritus, University of Nebraska— Lincoln Department of Animal ScienceCurt Bittner, research technicianHenry Hilscher, feedlot managerGene Wijff els, senior research scientist, CSIRO, Queensland, AustraliaJohn B. Gaughan, associate professor, University of Queensland, Queensland AustraliaMegan Sullivan, postdoctoral research fellow, University of Queensland, Queensland, AustraliaJudy Cawdell- Smith, Senior Lecturer, University of Queensland, Queensland AustraliaGalen E. Erickson, professor, University of Nebraska— Lincoln Department of Animal Science, Lincoln, NE
Table 3. Simple eff ect means for blood measure in the presence of a collection time × diet interaction
P- Value
Blood Measure Control Straw Agrimos SEM1 Trt Int2
Bilirubin, mg/dL 0.01 0.26 0.02
d 23 0.18a 0.20a 0.19a
d 37 0.15a 0.15a 0.17a
d 44 0.16a 0.18a 0.17a
d 51 0.19a 0.18a 0.19a
d 58 0.17a 0.18a 0.20b
d 65 0.19a 0.19a 0.20a
d 79 0.19a 0.15b 0.18a
Red blood cell, cells/L 0.16 0.15 <0.01
d 23 8.34ab 8.61b 8.11a
d 37 8.22a 8.21a 7.81b
d 44 8.13a 8.24a 7.92a
d 51 8.03ab 8.24a 7.78b
d 58 8.35ab 8.41a 8.01b
d 65 8.09a 8.35a 8.00a
d 79 8.18a 7.94a 7.92a
Hematocrit, % 0.5 0.10 <0.01
d 23 37.5a 37.1ab 36.2b
d 37 37.2a 35.8b 35.6b
d 44 37.7a 36.7a 37.0a
d 51 37.5a 37.0a 36.6a
d 58 39.3a 37.9b 37.9b
d 65 37.9a 37.7a 37.8a
d 79 38.6a 36.7b 37.1b
Hemoglobin, g/dL 0.2 0.07 <0.01
d 23 13.2a 13.0ab 12.7b
d 37 13.4a 12.9b 12.8b
d 44 13.5a 13.2a 13.2a
d 51 13.5a 13.3a 13.1a
d 58 14.1a 13.6b 13.5b
d 65 13.6a 13.5a 13.5a
d 79 14.0a 13.3b 13.4b
Values within rows with unique superscripts diff er P < 0.051 Pooled SEM, n = 7 collections/mean2 Interaction between blood collection and treatment

96 · 2017 Nebraska Beef Cattle Report
© Th e Board Regents of the University of Nebraska. All rights reserved.
Procedures
Th e study was a 2 x 2 plus 1 factorial design within a randomized block design. Th ere were two inclusions of modifi ed distillers grains plus solubles (MDGS); two diets formulated with corn germ meal and corn bran to equal NDF content of the MDGS diets, and a corn control diet. A total of 100 pens of 800 steers (initial BW=915 lb; SD=53 lb) were fed during the summer of 2015 at the University of Nebraska- Lincoln Eastern Nebraska Research and Extension Center (ENREC). Two- day body weights were measured and steers were allocated into blocks accord-ing to BW. Within each of 4 blocks, 25 feedlot pens (n=8 steers/pen) were assigned randomly to the following diets: (1) corn control (CON); (2) 20% MDGS as % of diet DM (20MDGS); (3) 40% MDGS as % of DM (40MDGS); (4) corn fi ber isolate
O45, O103, O111, O121, O145, and O157. Distillers grains are used frequently in the fi nishing ration of feedlot cattle. Previous studies have shown that increased inclusion of distillers grains (40 to 50% DM) in the fi nishing diet increased probability for col-onization (Journal of Food Protection, 2007; 70:2568) and fecal shedding (Applied and Environmental Microbiology, 2010, 76:8238) of E. coli O157:H7 compared to feeding a control corn diet or 20% DM distillers grains; however, the mechanism by which this occurs is not understood Journal of Food Protection, 2007; 70:2568; Applied and Environmental Microbiology, 2010, 76:8238). Th e objective of this study was to determine whether the presence of distillers grains in the diet explains the probability to detect the seven serogroups of EHEC in the feces of feedlot steers, and if this is primar-ily caused by changes in dietary fi ber that occur when distillers grains are fed.
Liesel G. SchneiderCurt J. Bittner
Jordan E. BurhoopF. Henry HilscherGalen E. Erickson
Terry J. KlopfensteinRodney A. Moxley
David R. Smith
Summary with Implications
Increased probability for fecal shed-ding and colonization by Escherichia coli O157:H7 has been observed in previous studies when steers are fed increased inclu-sions of distillers grains. A feeding study was conducted to determine if distillers grains or fi ber from distillers grains in the fi nishing ration of feedlot steers aff ected fecal shedding prevalence of seven serogroups of enterohe-morrhagic Escherichia coli (EHEC- 7). For EHEC O45 and EHEC O103, the greatest prevalence of shedding occurred when steers were fed increased distillers grains For all EHECs except for O111, fecal shedding prev-alence was similar between the corn control and either of the corn fi ber isolate diets. Decreased prevalence for shedding O111 was observed in steers fed increased distillers grains at higher fi ber level compared to steers fed corn fi ber isolate diets. Dietary treatment did not impact EHEC O145 or EHEC O157 shedding. Th ese data suggest that dietary factors aff ecting EHEC fecal shedding diff er by serogroup.
Introduction
Enterohemorrhagic Escherichia coli (EHEC) are important foodborne patho-gens capable of causing severe human illness. Cattle populations are known to be important reservoirs for EHEC. Th ere are seven serogroups of EHEC (EHEC- 7) that have been declared adulterants in raw beef by USDA FSIS that include: O26,
Eff ects of Distillers Grains or Fiber on Enterohemorrhagic Escherichia coli in Steers
Table 1. Composition (% of diet DM) of dietary treatments fed to yearling steers.
Ingredient Treatment1
CON 20MDGS 40MDGS 20FIB 40FIB
Dry- rolled corn 68.5 51.5 31.5 60 51.5
High- moisture corn
12 12 12 12 12
MDGS2 - 20 40 - -
SEM3 - - - 1.5 3
Wet Corn Bran - - - 7 14
Corn Silage 8 8 8 8 8
Alfalfa Hay 3.5 3.5 3.5 3.5 3.5
Supplement 8 5 5 8 8
Nutrient Composition, % of DM
CP 14.1 15.1 19.8 14.1 13.3
NDF 11.0 16.7 22.0 16.6 22.2
ADF 4.5 6.6 8.6 6.0 7.5
Lignin 1.7 2.3 2.9 1.9 2.21 Treatments included CON- control; 20MDGS- 20% modifi ed distillers grains plus solubles; 40MDGS- 40% modifi ed distillers
grains plus solubles; 20FIB- fi ber fed from concentrated ingredients to mimic fi ber provided by 20MDGS; 40FIB- fi ber fed from concentrated ingredients to mimic fi ber provided by 40MDGS.
2 MDGS: Modifi ed distillers grains plus solubles,3 SEM: solvent extracted germ meal
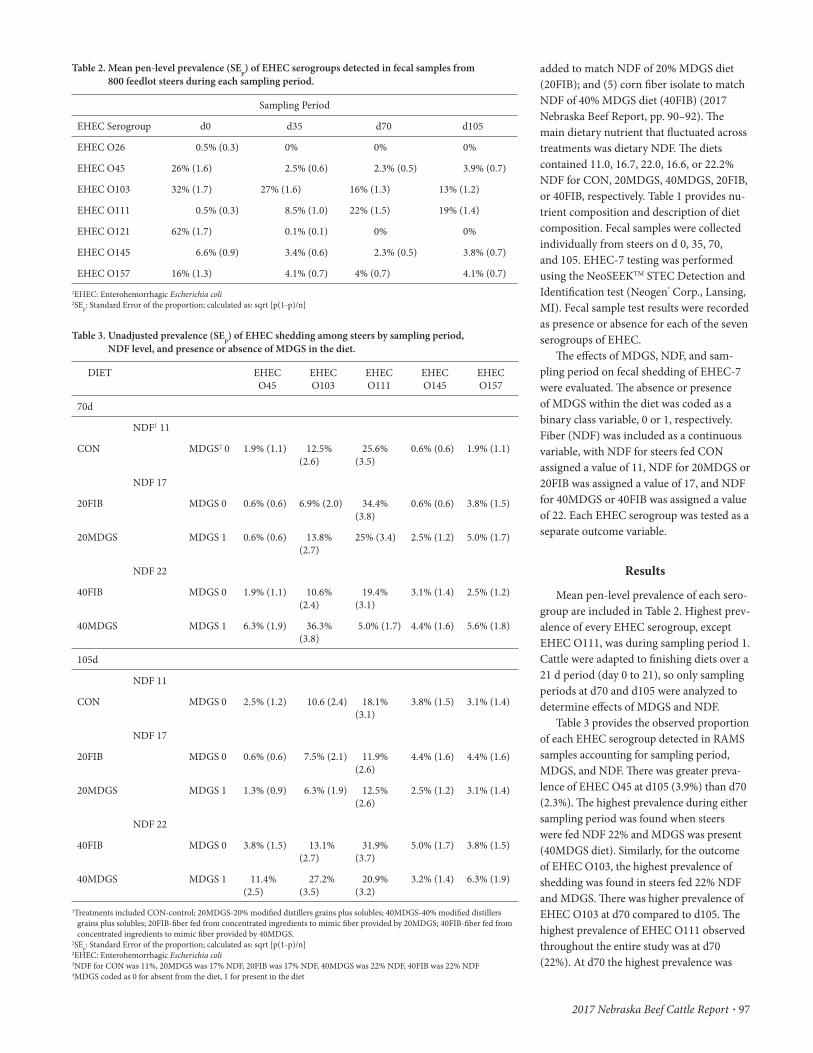
2017 Nebraska Beef Cattle Report · 97
added to match NDF of 20% MDGS diet (20FIB); and (5) corn fi ber isolate to match NDF of 40% MDGS diet (40FIB) (2017 Nebraska Beef Report, pp. 90–92). Th e main dietary nutrient that fl uctuated across treatments was dietary NDF. Th e diets contained 11.0, 16.7, 22.0, 16.6, or 22.2% NDF for CON, 20MDGS, 40MDGS, 20FIB, or 40FIB, respectively. Table 1 provides nu-trient composition and description of diet composition. Fecal samples were collected individually from steers on d 0, 35, 70, and 105. EHEC- 7 testing was performed using the NeoSEEKTM STEC Detection and Identifi cation test (Neogen® Corp., Lansing, MI). Fecal sample test results were recorded as presence or absence for each of the seven serogroups of EHEC.
Th e eff ects of MDGS, NDF, and sam-pling period on fecal shedding of EHEC- 7 were evaluated. Th e absence or presence of MDGS within the diet was coded as a binary class variable, 0 or 1, respectively. Fiber (NDF) was included as a continuous variable, with NDF for steers fed CON assigned a value of 11, NDF for 20MDGS or 20FIB was assigned a value of 17, and NDF for 40MDGS or 40FIB was assigned a value of 22. Each EHEC serogroup was tested as a separate outcome variable.
Results
Mean pen- level prevalence of each sero-group are included in Table 2. Highest prev-alence of every EHEC serogroup, except EHEC O111, was during sampling period 1. Cattle were adapted to fi nishing diets over a 21 d period (day 0 to 21), so only sampling periods at d70 and d105 were analyzed to determine eff ects of MDGS and NDF.
Table 3 provides the observed proportion of each EHEC serogroup detected in RAMS samples accounting for sampling period, MDGS, and NDF. Th ere was greater preva-lence of EHEC O45 at d105 (3.9%) than d70 (2.3%). Th e highest prevalence during either sampling period was found when steers were fed NDF 22% and MDGS was present (40MDGS diet). Similarly, for the outcome of EHEC O103, the highest prevalence of shedding was found in steers fed 22% NDF and MDGS. Th ere was higher prevalence of EHEC O103 at d70 compared to d105. Th e highest prevalence of EHEC O111 observed throughout the entire study was at d70 (22%). At d70 the highest prevalence was
Table 2. Mean pen- level prevalence (SEp) of EHEC serogroups detected in fecal samples from 800 feedlot steers during each sampling period.
Sampling Period
EHEC Serogroup d0 d35 d70 d105
EHEC O26 0.5% (0.3) 0% 0% 0%
EHEC O45 26% (1.6) 2.5% (0.6) 2.3% (0.5) 3.9% (0.7)
EHEC O103 32% (1.7) 27% (1.6) 16% (1.3) 13% (1.2)
EHEC O111 0.5% (0.3) 8.5% (1.0) 22% (1.5) 19% (1.4)
EHEC O121 62% (1.7) 0.1% (0.1) 0% 0%
EHEC O145 6.6% (0.9) 3.4% (0.6) 2.3% (0.5) 3.8% (0.7)
EHEC O157 16% (1.3) 4.1% (0.7) 4% (0.7) 4.1% (0.7)1EHEC: Enterohemorrhagic Escherichia coli2SEp: Standard Error of the proportion; calculated as: sqrt [p(1- p)/n]
Table 3. Unadjusted prevalence (SEp) of EHEC shedding among steers by sampling period, NDF level, and presence or absence of MDGS in the diet.
DIET EHEC O45
EHEC O103
EHEC O111
EHEC O145
EHEC O157
70d
NDF1 11
CON MDGS2 0 1.9% (1.1) 12.5% (2.6)
25.6% (3.5)
0.6% (0.6) 1.9% (1.1)
NDF 17
20FIB MDGS 0 0.6% (0.6) 6.9% (2.0) 34.4% (3.8)
0.6% (0.6) 3.8% (1.5)
20MDGS MDGS 1 0.6% (0.6) 13.8% (2.7)
25% (3.4) 2.5% (1.2) 5.0% (1.7)
NDF 22
40FIB MDGS 0 1.9% (1.1) 10.6% (2.4)
19.4% (3.1)
3.1% (1.4) 2.5% (1.2)
40MDGS MDGS 1 6.3% (1.9) 36.3% (3.8)
5.0% (1.7) 4.4% (1.6) 5.6% (1.8)
105d
NDF 11
CON MDGS 0 2.5% (1.2) 10.6 (2.4) 18.1% (3.1)
3.8% (1.5) 3.1% (1.4)
NDF 17
20FIB MDGS 0 0.6% (0.6) 7.5% (2.1) 11.9% (2.6)
4.4% (1.6) 4.4% (1.6)
20MDGS MDGS 1 1.3% (0.9) 6.3% (1.9) 12.5% (2.6)
2.5% (1.2) 3.1% (1.4)
NDF 22
40FIB MDGS 0 3.8% (1.5) 13.1% (2.7)
31.9% (3.7)
5.0% (1.7) 3.8% (1.5)
40MDGS MDGS 1 11.4% (2.5)
27.2% (3.5)
20.9% (3.2)
3.2% (1.4) 6.3% (1.9)
1Treatments included CON- control; 20MDGS- 20% modifi ed distillers grains plus solubles; 40MDGS- 40% modifi ed distillers grains plus solubles; 20FIB- fi ber fed from concentrated ingredients to mimic fi ber provided by 20MDGS; 40FIB- fi ber fed from concentrated ingredients to mimic fi ber provided by 40MDGS.
2SEp: Standard Error of the proportion; calculated as: sqrt [p(1- p)/n]2EHEC: Enterohemorrhagic Escherichia coli3NDF for CON was 11%, 20MDGS was 17% NDF, 20FIB was 17% NDF, 40MDGS was 22% NDF, 40FIB was 22% NDF4MDGS coded as 0 for absent from the diet, 1 for present in the diet
98 · 2017 Nebraska Beef Cattle Report
Conclusion
Th ese results suggest that the dietary factors aff ecting fecal shedding are not the same for every EHEC serogroup.
Acknowledgement
Th is material is based upon work that is supported by the U.S. Department of Agriculture (USDA), National Institute of Food and Agriculture under award 2012– 68003– 30155.
Liesel Schneider, graduate student, College of Veterinary Medicine, Mississippi State UniversityCurtis Bittner, research technicianJordan Burhoop, graduate studentHenry Hilscher, research technicianGalen Erickson, professor Animal Science, LincolnTerry Klopfenstein, professor Animal Science, LincolnRodney Moxley, professor Veterinary Medicine and Biomedical Sciences, LincolnDavid Smith, professor College of Veterinary Medicine, Mississippi State University.
observed in steers fed 20FIB diet; however, at d105 the highest prevalence was seen in steers fed the 40FIB diet. Th ere was a higher prevalence of EHEC O145 detected at d 105 (3.8%) than at d70 (2.3%). At d70 steers fed 40MDGS had higher prevalence of shed-ding, but at d105 steers fed 40FIB had higher prevalence of shedding. Similar EHEC O157 shedding prevalence was observed for 70 and d105, and steers fed 40MDGS had highest prevalence. Neither EHEC O26 nor EHEC O121 was detected in any fecal samples at d70 or d105.
Discussion
For EHEC O45, EHEC O103, EHEC O145 (at d70), and EHEC O157, the highest shedding prevalence was observed when cattle are fed 40% MDGS. Th is suggests that the increased risk for fecal shedding of EHEC by cattle on 40% MDGS diets was not due to higher fi ber levels from distillers grains, but some other components of the ration contributed by MDGS. Compared to the other EHEC serogroups, diff erent eff ects were observed regarding shedding prevalence of EHEC O111 in relation to fi ber levels and presence of MDGS.

2017 Nebraska Beef Cattle Report · 99
© Th e Board Regents of the University of Nebraska. All rights reserved.
high speed ultracentrifuge from day 2, 8, and 14. Th e SR was isolated from each day 2 sample. Both mitochondria and SR samples were analyzed for PUFA content using gas chromatography, and phospholipid content using thin layer chromatography. Mito-chondria from days 2 and 8 were artifi cially oxidized using an iron and ascorbic acid mixture. Calcium measurements were performed at Ward Labs (Kearny, NE) using Inductively Coupled Plasma Optical Emission Spectra (ICP- OES).
Statistical Analysis
Th e Proc Glimmix procedure in SAS (SAS Institute, Inc., Cary, N.C.) was used to test the main eff ects of dietary treatment, aging period, PUFA content, phospholipid content, and oxidation and their interac-tions on the calcium retention of the mito-chondria. All means were separated using the LS MEANS statement and the TUKEY adjustment with an alpha level of 0.05.
Results
In both organelles, the DG diet samples had higher 18:2 and total PUFA content
Calpains aide in the tenderization of meat postmortem. Th erefore, altering the PUFA content in the SR membrane could lead to improved tenderness postmortem by increasing the amount of calcium avail-able to activate calpains. Even though the SR is diffi cult to study, mitochondria, the secondary Ca- sequestering organelles in the muscle, are relatively easy to isolate intact and provide the opportunity to study Ca release under carefully controlled and tightly defi ned conditions. Th e objective was to isolate mitochondria from cattle fed DG and corn to determine the infl uence of diet and oxidation on Ca release.
Procedure
Steers (n = 48) were fed a corn- based fi nishing diet with or without deoiled, dried DG (50% DM basis) for 156 days. Aft er harvest, strip loins were collected and steaks from each loin were aged for 2, 8, 14, and 21 days, powdered using liquid nitrogen, and stored at - 112° F for lab analysis. Samples (n = 12) were randomly selected from each diet group for all aging periods. Mitochondria were isolated using
Emery K. KunzeNicolas J. Herrera
Katherine I. Domenech- PerezMichael D. ChaoChris R. Calkins
Summary with Implications
Feeding dried distillers grains (DG) may infl uence calcium fl ux postmortem by disrupting the stability of the sarcoplasmic reticulum (SR) membrane, thus leading to a higher post- rigor calcium leakage, result-ing in greater activation of calpains and improved tenderness. Mitochondria provide the opportunity to study calcium fl ux in a controlled, tightly defi ned environment as a model system for the SR. Cattle were fi nished on diets containing either 0% DG or 50% DG. Feeding DG increased proportions of PUFA in the SR and mitochondrial mem-brane. Oxidized mitochondria retained less calcium than non- oxidized mitochondria. Mitochondria from cattle fi nished on corn tended to retain more Ca than mitochondria from cattle fi nished on DG. Th ese fi ndings suggest that feeding DG in the fi nishing diet can possibly increase meat tenderness through altered calcium fl ux.
Introduction
Research at the University of Nebraska- Lincoln has found that feeding distillers grains (DG) increases polyunsaturated fatty acid (PUFA) content within the sarco-plasmic reticulum (SR) membrane. Th e amount of PUFA infl uences SR membrane fl uidity and can compromise the ability of the organelle to retain calcium (its primary contents). Th e PUFA are highly susceptible to oxidation, which can lead to membrane collapse postmortem. If the SR membrane collapses early postmortem calcium (Ca) leakage may occur. Calcium activates proteolytic enzymes known as calpains.
Th e Infl uence of Diet and Oxidation on Calcium Retention of the Mitochondria in Fresh Beef
Table 1. Eff ect of diet on 18:2 and polyunsaturated fatty acid (PUFA) content of the SR and mitochondrial membranes.
Organelle Fatty acid (%) Corn DDGS 50%x
SR 18:2 8a 17b
PUFA 10a 17b
Mitochondria 18:2 9a 15b
PUFA 15a 24b
a,b Means within a row with diff erent superscripts diff er (P < 0.05).x DDGS= dried distillers grains plus solubles
Table 2. Eff ect of aging on 18:2 and polyunsaturated fatty acid (PUFA) content of the mitochondrial membrane.
Aging (days) 18:2 (%) PUFA (%)
2 12a 19a
8 9a 16a
14 15b 23b
a,b Means within a column with diff erent superscripts diff er (P < 0.05).

100 · 2017 Nebraska Beef Cattle Report
(P < 0.01) compared to corn samples (Table 1), which was consistent with previous studies. Day 14 mitochondrial lipids had higher 18:2 (P < 0.01) and total PUFA (P < 0.05) contents compared to day 2 and 8 mitochondrial lipids (Table 2). Th is was expected because during aging of meat oxidation propagates the formation of additional trans double bonds in other fatty acids, creating more unsaturated fatty acids. Phospholipid contents (phosphati-dylethanolamine, phosphatidylcholine, and phosphatidylinositol) of the mitochondria and SR were unaff ected by diet (P > 0.10). Oxidized mitochondria retained signifi -cantly less Ca than non- oxidized (P < 0.01) mitochondria (Fig. 1). Th is supported the hypothesis that as oxidation increases, the membrane stability decreases, thus allowing calcium to leak from the organelle. Day 2 mitochondria retained signifi cantly less Ca than day 8 (P < 0.01) mitochondria (Fig. 2), which is opposite of the results that were expected, because the total PUFA content was not signifi cantly diff erent between the two aging periods. Overall, mitochondria from cattle fi nished on corn tended (P = 0.08) to retain more Ca than mitochondria from cattle fi nished on DG, which support-ed the hypothesis (Fig. 3).
Conclusion
Results indicate that greater PUFA con-tent deposited in organelles may aff ect Ca fl ux by increased susceptibility to oxidation. A DG diet may infl uence Ca fl ux and ulti-mate tenderness by this mechanism.
Acknowledgment
Th is project was funded in part by Th e Beef Checkoff
Emery K. Kunze, graduate studentNicolas J. Herrera, undergraduate studentKatherine I. Domenech- Perez, graduate studentMichael D. Chao, assistant professor, College of Agriculture, California State University- Chico, ChicoChris R. Calkins, professor, Animal Science, Lincoln
6.54 b
4.57a
oxidized x non-oxidizeda, b P< 0.05x mitochondria were artificially oxidized or non-oxidized
7
6
5
4
3
2
1
0
M C
a2+/
g m
itoch
ondr
ial p
rote
in
6.48 b
4.64a
2 day aged 8 day ageda, b P< 0.05
7
6
5
4
3
2
1
0
M C
a2+/
g m
itoch
ondr
ial p
rote
in
5.036.15
Corn 50% DDGSDiet
M C
a2+/
g m
itoch
ondr
ial p
rote
in 7.00
6.00
5.00
4.00
3.00
2.00
1.00
0.00
xDDGS=dried distillers grains plus solubles
Figure 1. Eff ect of Oxidation on Mitochondrial Calcium Retention.
Figure 3. Eff ect of Diet on Mitochondrial Calcium Retention.
Figure 2. Eff ect of Aging on Mitochondrial Calcium Retention.

2017 Nebraska Beef Cattle Report · 101
© Th e Board Regents of the University of Nebraska. All rights reserved.
evaluation was conducted, six cores (1/2- inch diameter) were removed parallel to the muscle fi ber orientation of each steak and were measured with a Food Texture Analyz-er with a Warner- Bratzler blade.
Subjective Discoloration (Visual Discoloration)
Percent discoloration was estimated daily for seven days by six graduate students during the fi rst year and eight graduate stu-dents during the second year, all of whom had previous experience with subjective color scoring.
Objective Color (L*, a*, b* values)
During retail display, objective color was assessed daily with a Minolta Colorimeter (CR- 400, Minolta Camera Company, Osa-ka, Japan). Th e D65 illuminant setting and 2° observer were used with an 8 mm diame-ter measurement area. Th e colorimeter was calibrated daily and color measures were obtained by averaging 6 readings from dif-ferent areas of the steak surface. Th e CIE L* measured lightness (black = 0, white = 100), a* measured redness (red = positive values, green =negative values) and b* measured yellowness (yellow = positive values, blue = negative values).
Lipid Oxidation (TBARS)
Frozen samples (from retail display days 0, 4 and 7) were diced into small pieces, with no subcutaneous fat, and fl ash frozen in liquid nitrogen. Th e frozen pieces were homogenized in a Waring commercial blender and a 5 g sample was weighed in duplicate to conduct the TBARS protocol.
Fatty Acid Profi le
Frozen samples, with no subcutaneous fat, were diced into small pieces and fl ash frozen in liquid nitrogen. Samples were then homogenized in a Waring commer-
Procedure
A total of 232 crossbred cattle (repli-cated over 2 yrs; steers during year one, heifers during year 2) were subjected to one of three background treatments on crested wheatgrass pastures with either: 1) no supplement, 2) fi eld peas at 0.5% BW, or 3) dry- rolled corn supplemented at 0.5% BW and one of two fi nishing treatments: 1) supplemented with fi eld peas (20% on a DM basis) or 2) no peas were added to the diet. Each background treatment consisted of 4 replications with 10 hd per pasture for a total of 40 hd per treatment per year. A 3- inch thick slice of the anterior portion of the strip loin was collected at the 12/13th rib area from every side of every carcass. All samples were immediately fabricat-ed and then aged for 14 days. Right loin samples were fabricated into ¾- inch thick steaks and 1- inch steaks. Th e ¾- inch steak was used for laboratory analysis of fatty acid composition while the 1- inch steak was used for tenderness measurement [Warner- Bratzler Shear Force (WBSF) and Slice Shear Force (SSF)] for day 0 of retail display. Left loin samples were fabricated into ½- inch thick steaks and 1- inch steaks. Th e ½- inch steak was used to measure lipid oxidation while the 1- inch steak was used for visual discoloration and tenderness measurements for day 7 of retail display.
Tenderness— Warner- Bratzler Shear Force (WBSF) & Slice Shear
Force (SSF)
For all steaks (never frozen), an internal raw temperature and weight were recorded. Steaks were cooked to a target temperature of 160°F on a Belt Grill (TBG60- V3 Magi-Gril, MagiKitch’n Inc., Quakertown, PA). Aft er cooking, an internal temperature and weight were recorded and slice shear force evaluation was conducted using a Food Tex-ture Analyzer with a Slice Shear Force blade. Th e remainder of the steak was individually bagged and stored in a cooler (maintained at 33°F). Approximately 24 hours aft er SSF
Hope R. VoegeleKatherine I. Domenech
Emery K. KunzeFelipe A. RibeiroKarla H. Jenkins
Jim C. MacDonaldChris R. Calkins
Summary with Implications
Th is study was conducted over two years to evaluate the use of fi eld peas during two phases of production (grazing and fi nishing) on overall fresh beef quality. Th e back-grounding treatments included: no sup-plement, fi eld peas, or dry- rolled corn and fi nishing treatments included the presence or absence of fi eld peas. Loin samples (n = 232) were aged for 14 d and placed under retail display conditions for 7 d. Dietary treatments had no eff ect on tenderness (WBSF or SSF) or visual discoloration and minimal eff ects on objective color, lipid oxidation and fatty acid composition. Th ese data indicate fi eld peas may be used as an alternative feed for growing and fi nishing cattle with minimal to no negative impact on fresh meat quality.
Introduction
Field peas have become a viable feed supplement for beef cattle. Field peas are an annual cool- season legume crop primarily produced in South Dakota, North Dakota and the western panhandle of Nebraska. Th ey compare favorably with other grains for several nutrients including crude protein, starch and fat. However, the impact of feed-ing fi eld peas on fresh meat quality has not been well studied. Th erefore, this study was conducted to determine the eff ect of feeding fi eld peas on shelf- life, tenderness, lipid oxidation, and fatty acid profi les of beef.
Eff ect of Feeding Field Peas on Fresh Beef Quality

102 · 2017 Nebraska Beef Cattle Report
Table 1. Amount1 of fatty acids of beef from cattle fed corn, fi eld peas or no supplement (L. dorsi)
No supplement on pasture
Field Peas on pasture Corn onpasture
P- value
Fatty Acid Corn Finishing
Field Peas Finishing
Corn Finishing
Field Peas Finishing
Corn Finishing
Field Peas Finishing
Pasture Finishing Pasture* Finishing
SEM2
C10:0 3.97 5.11 5.40 5.11 4.41 4.45 0.28 0.52 0.44 0.69
C12:0 4.20 5.56 4.70 4.87 4.53 4.35 0.69 0.30 0.31 0.61
C14:0 185.96 204.88 179.51 184.02 180.12 184.34 0.34 0.28 0.73 11.40
C14:1 44.88 49.22 40.92 45.31 42.25 44.67 0.41 0.16 0.94 3.50
C15:0 32.89 32.62 29.51 29.41 31.40 29.48 0.23 0.63 0.88 2.12
C15:1 40.40 49.64 51.02 43.43 45.72 45.02 0.76 0.90 0.03 3.48
C16:0 1,688.57 1,852.63 1,655.76 1,627.45 1,653.85 1,677.08 0.32 0.47 0.55 98.37
C16:1 240.45 271.14 241.89 254.20 251.59 260.25 0.81 0.13 0.70 15.12
C17:0 99.61 110.05 104.09 95.75 103.14 94.50 0.61 0.68 0.24 7.00
C17:1 94.98 102.52 98.79 85.78 89.13 85.12 0.21 0.55 0.29 7.10
C18:0 1,059.83 1,158.86 1,059.53 1,006.33 1,010.95 1,009.54 0.25 0.77 0.46 66.97
C18:1 2,892.93 3,209.57 2,886.72 2,801.20 2,876.43 2,973.08 0.41 0.39 0.44 169.91
C18:1v 114.01 124.05 115.85 115.97 100.62 104.09 0.16 0.54 0.86 9.98
C19:0 44.65 36.22 32.02 39.54 33.51 33.20 0.30 0.91 0.22 5.06
C18:2TT 273.28 252.67 267.17 255.87 272.13 238.71 0.93 0.20 0.87 23.96
C18:2 230.40 239.45 298.65 252.77 223.82 225.08 0.04a 0.49 0.37 23.02
C18:3ω3 11.37 15.39 15.59 15.00 14.16 14.04 0.25 0.24 0.10 1.35
C20:0 22.94 20.97 26.18 20.64 24.52 23.83 0.47 0.06 0.37 1.95
C20:1 26.04 26.02 24.20 23.55 22.01 27.76 0.70 0.41 0.31 2.83
C20:3ω6 14.01 15.24 14.47 14.28 14.96 13.46 0.91 0.84 0.35 1.03
C20:4ω6 41.11 42.05 43.15 41.96 43.01 41.34 0.91 0.73 0.83 2.44
C22:5 12.45 14.57 11.98 12.07 12.28 11.56 0.13 0.50 0.26 0.94
Total 7,106.65 7,749.47 7,092.94 6,894.24 7,000.84 7,059.18 0.41 0.57 0.49 387.66
Other 22.77 49.72 46.15 27.79 52.25 50.93 0.32 0.80 0.14 12.48
SFA2 3,123.64 3,372.91 3,075.65 2,994.65 3,024.53 3,040.94 0.33 0.65 0.60 179.91
UFA2 3,983.02 4,376.57 4,017.30 3,899.59 3,976.32 4,018.24 0.49 0.51 0.42 214.44
SFA:UFA2 0.78 0.78 0.77 0.77 0.77 0.76 0.54 0.69 0.95 0.02
MUFA2 3,433.64 3,817.86 3,429.83 3,358.83 3,419.25 3,505.81 0.44 0.38 0.46 199.74
PUFA2 549.38 558.70 587.47 540.77 557.07 512.43 0.60 0.26 0.57 32.44
ω6 52.56 52.93 54.63 54.21 55.24 51.30 0.83 0.57 0.72 3.07
ω3 11.37 15.39 15.59 15.00 14.16 14.04 0.25 0.24 0.10 1.35
ω6:ω3 4.59 3.90 3.96 3.81 4.66 4.00 0.34 0.06 0.64 0.38
1Amount (mg/100 g tissue) of fatty acid in powdered loin sample determined by gas chromatography.2SEM = Standard Error of the Mean, SFA = Saturated fatty acids, UFA= Unsaturated fatty acids, SFA:UFA = Saturated fatty acids: Unsaturated fatty acids, MUFA= Monounsaturated fatty acids, and
PUFA=Polyunsaturated fatty acidsaFor C18:2, peas on pasture treatment were higher than the corn on pasture (P = 0.04), no supplement on pasture was not diff erent to peas or corn on pasture.

2017 Nebraska Beef Cattle Report · 103
content of saturated fatty acids, unsaturated fatty acids, monounsaturated fatty acids or polyunsaturated fatty acids (P > 0.05; Table 1). Th ere was a signifi cant interaction between pasture and fi nishing treatments for C15:1 but the range in values was relative low and no implications from these diff erences could be identifi ed. Supplement-ing cattle on pasture with fi eld peas resulted in signifi cantly more C18:2 fatty acids than when cattle were supplemented with corn, while cattle without supplement were in-termediate. However, these diff erences did not carry over into total PUFA content, and diff erences among treatments could not be identifi ed. Th us, subtle diff erences in fatty acid composition that occurred from the treatments did not infl uence meat quality.
Overall, there were minimal changes in discoloration, color, or tenderness. In con-clusion, these data indicate fi eld peas may be used as an alternative diet for growing and fi nishing cattle with minimal to no negative impact on fresh meat quality.
Hope R. Voegele, graduate studentKatherine I. Domenech, graduate studentEmery K. Kunze, graduate studentFelipe A. Ribeiro, graduate studentKarla H. Jenkins, associate professor, Animal Science, University of Nebraska— Lincoln Panhandle Research and Extension Center, Scottsbluff Jim C. MacDonald, associate professor, Animal Science, LincolnChris R. Calkins, professor, Animal Science, Lincoln
Results
In general, there were minimal eff ects due to diet. Tenderness (measured with WBSF and SSF) only presented diff erences due to retail display, showing an increase in tenderness with days of retail display (P < 0.0001). Neither backgrounding, nor fi nishing treatment infl uenced tender-ness measurements. A strong correlation between WBSF and SSF was observed (r = 0.65; P = < 0.0001).
Discoloration, L* and a* had triple interactions of retail display, by pasture, by fi nishing diets (P < 0.0001, p=0.0524 and p=0.024, respectively). In general, samples placed under retail display did not exhibit meaningful discoloration as samples only reached 1.47% discoloration by d 7 irrespective of dietary treatment during both combined years. Although these interactions were statistically signifi cant, no consistent patterns due to treatments could be identifi ed. Similarly, the magni-tude of diff erence would require extended aging periods to visually infl uence the color diff erences perceived by consumers.
Meat from cattle fi nished with fi eld peas had slightly greater lipid oxidation than samples from cattle not receiving fi eld peas during fi nishing (1.56 vs. 1.44 mg malonal-dehyde/kg tissue, respectively; P = 0.0541), although this is not a meaningful diff erence. As expected, lipid oxidation increased over time of simulated retail display (0d = 0.94, 4d = 1.46 and 7d = 2.11 mg malonaldehyde/kg tissue; P < 0.0001).
Dietary treatment had no eff ect on
cial blender and a 1 g sample was weighed out to conduct fatty acid determination via gas chromatography. Total fatty acids converted to methyl esters were separated on a fused silica column (Chromopack CP- Sil; 0.25mm x 100m) which was placed in an oven programmed from 284°F for 10 min to 428°F at a rate of 35°F/min and held at 428°F for 20 min. Total run time was 70 min. Th e injector and detector were programmed to work at 518°F and 572°F, respectively. Each lipid extract was separated into fatty acids by using helium as the carrier gas at a fl ow rate of 1mL/min. Individual fatty acids of each sample were determined by comparison of retention times with known standards and the percent of fatty acid was determined by the peak area in the chromatograph.
Statistical Analysis
Th is study was conducted with a treatment design of a 3 x 2 factorial (backgrounding diet x fi nishing diet) and analyzed using SAS® 9.4 package, SAS Insti-tute, Inc., USA. Objective color and percent discoloration were analyzed for treatment main eff ects using the PROC GLIMMIX procedure of SAS with day as repeated mea-sures when traits were measured over time. All other analyses were conducted with PROC GLIMMIX as well; all means were separated with the LS MEANS statement and TUKEY adjustment with an alpha level of 0.05 and tendencies were considered at an alpha level of 0.1.

104 · 2017 Nebraska Beef Cattle Report
© Th e Board Regents of the University of Nebraska. All rights reserved.
acids were identifi ed by their retention times in relation to known standards and the percent of fatty acid was determined by the peak area in the chromatograph. Data were converted from percentage of individual fatty acids to mg/100 g of tissue aft er determining the overall fat content of each sample.
Superoxide Dismutase Activity
Superoxide dismutase (SOD) activity was determined with a colorimetric assay kit (ab65354; Abcam, Cambridge, MA). Th e SOD units of activity are reported over mg of protein (SOD U/mg protein).
Statistical analysis
Th e experimental design was a com-pletely randomized design where the PROC GLIMMIX procedure in SAS (SAS Inst., Inc., Cary, N.C.) was used to determine the eff ects of dietary treatment on fatty acid content as well as superoxide dismutase activity. All means were separated with the LS MEANS statement and the TUKEY adjustment with an alpha of 0.05.
Results
In an earlier beef report (2016 Nebraska Beef Report, pp. 161– 163) the fatty acid data were presented on this set of cattle on a percentage basis. However, aft er adjusting composition data with total fat content of samples, several fatty acids were found to diff er in terms of total content on a mg/100 g sample basis (Table 1). Beef from cattle supplemented throughout the entire fi nish-ing phase had more (P < 0.05) C18:1, C18:2, C19:0, total, unsaturated fatty acids (UFA), and mono- unsaturated fatty acids (MUFA) in relation to beef from cattle supplement-ed through the receiving phase. However, beef from non- supplemented cattle did not diff er from supplemented cattle (P > 0.05).
Th ere was more (P = 0.05) C20:5ω3 fatty acid in beef from the non- supplemented
aging periods and retail display times. Th us, the objectives of this research were to assess the impact of feeding OmniGen- AF on beef fatty acid profi les as well as attempting to decipher a mechanism of how added oxida-tive stability could be achieved by quantify-ing superoxide dismutase activity.
Procedure
A total of 288 steers were sorted into three treatment groups (96 hd/treat-ment): a control group that received no OmniGen- AF supplementation and two groups supplemented with OmniGen- AF either at receiving (fi rst 28 d at the feedlot) or throughout fi nishing (210 d). At the receiving phase, cattle were fed 30 % alfalfa hay, 30% dry rolled corn, 36% Sweet Bran® (corn gluten feed, Cargill, Blair, NE), and 4% supplement. Th e fi nishing diet consisted of 50% high moisture corn, 40% Sweet Bran®, 5% wheat straw, and 5% supplement. At both the receiving and fi nishing phases, OmniGen- AF was top dressed at 4 g/45.4 kg BW/hd/d. Cattle were sorted 8 hd/pen for a total of 12 pens/treatment. Aft er har-vest, 24 USDA low Choice carcasses were selected within each dietary treatment (n = 72) and strip loins were obtained. Vacuum packaged loins were aged 8, 22 and 29 days (33°F). At 8 days of age, a portion of the strip loin was fabricated at which time a ½- inch steak was trimmed of subcutaneous fat (for fatty acid analysis) and was vacuum packaged and stored immediately in an ultra- low freezer (- 112°F) until analysis. Similarly, at 29 days of age and aft er 7 days of retail display, ½- inch steak were vacuum packaged and stored in an ultra- low freezer (- 112°F) for superoxide dismutase activity determination.
Fatty acid profi le
Frozen samples were diced into small pieces, with no subcutaneous fat, and fl ash frozen in liquid nitrogen. Gas chroma-tography was done using a Chromopack CP- Sil (0.25 mm x 100 m) column. Fatty
Katherine I. DomenechMichael D. Chao
Joe O. BuntynTy Schmidt
Chris R. Calkins
Summary with Implications
Beef fatty acid profi les and superoxide dismutase activity were determined for cattle receiving OmniGen- AF supplemen-tation (a patented nutritional supplement) at receiving (fi rst 28 d at the feedlot) or throughout fi nishing (all 210 d of fi nishing) vs. a control group (non- supplemented). Th e most meaningful change in fatty acid composition from inclusion of OmniGen- AF was total poly- unsaturated fatty acid (PUFA) content where beef from the fi nishing group had more PUFA content in relation to the receiving group and was not diff erent from the control group. Despite this increase in PUFA, cattle supplemented through fi nishing tended to have less lipid oxidation than the other two treatments yet this diff erence could not be explained by the superoxide dismutase activity.
Introduction
OmniGen- AF (Phibro Animal Health, Quincy, IL) is a patented nutritional supple-ment designed to augment and support the immune system of cattle. Th is nutritional supplement consists of live yeast and pre-mixes of vitamins and minerals that have been carefully selected through nutrige-nomics to aid in the nutritional modulation of genetic expression to promote cellular health. Although originally designed with dairy cattle in mind, the beef cattle industry might benefi t from using this supplement to further improve the immune response of cattle under stress as well as potentially incorporating antioxidants into muscle foods to maintain meat quality over longer
Fatty Acid Composition of Beef Fed OmniGen- AF at Receiving or Finishing

2017 Nebraska Beef Cattle Report · 105
group than the receiving group, with the fi nishing group being intermediate. Th e saturated to unsaturated fatty acid ratio (SFA:UFA) was greater (P = 0.05) in beef from the receiving group, intermediate in beef from the non- supplemented group, and lowest in beef from the fi nishing group.
More importantly in terms of evaluating beef shelf life, dietary treatment did alter total poly- unsaturated fatty acid (PUFA) content in beef samples. Beef from the fi n-ishing and non- supplemented groups had greater (P = 0.01) PUFA content than the receiving group.
Typically, greater PUFA content leads to greater lipid oxidation under retail display conditions and thus shortens meat shelf life. However, based on lipid oxida-tion measures previously reported (2016 Nebraska Beef Report, pp. 161– 163), beef from cattle supplemented throughout the fi nishing phase with OmniGen- AF had a tendency (P = 0.10) of having decreased lipid oxidation values despite having greater PUFA content. Superoxide dismutase activ-ity (SOD) was determined in an attempt to further understand and explore the added oxidative stability seen in the supplemented fi nishing group. Superoxide dismutase is an enzyme that helps combat the accumulation of excessive amounts of reactive oxygen species (the initiators of lipid oxidation). It is thought to be the primary line of defense that converts superoxide’s (most toxic reactive oxygen form) to less toxic forms of oxygen, at which point other enzymes such as catalase and glutathione peroxidase can further detoxify the reactive oxygen forms to less toxic compounds for the cell and thus provide cells a built- in antioxidant mediation system. Figure 1 shows the pri-mary and secondary antioxidant mediators that can be explored to better understand oxidative stability, with SOD being the lead-ing innate mechanism of interest. Figure 2 depicts the major reactive oxygen species, where the top of the pyramid represents the most toxic reactive oxygen form (superox-ide anion) and the bottom contains second-ary reactive oxygen species that are derived as by- products of primary free radicals.
Despite the fact that meat from the fi n-ishing group had increased PUFA content as well as decreased lipid oxidation, meat from cattle fed OmniGen- AF throughout fi nishing did not show meaningful diff er-ences (P = 0.92) in superoxide dismutase
Table 1. Fatty acid changes due to supplementation with OmniGen- AF on steaks aged for 8 d
Dietary Treatment1
Fatty acid2 Control OmniGen- AF at Receiving
OmniGen- AF at Finishing
SEM P- value
C4:0 40.68 40.18 55.84 13.61 0.64
C10:0 6.48 7.39 6.64 1.23 0.57
C12:0 7.50 7.38 7.78 0.52 0.82
C13:0 7.29 6.42 7.58 0.78 0.48
C14:0 328.19 309.13 324.29 15.76 0.68
C14:1 97.61 98.07 96.90 6.78 0.99
C15:0 62.36 61.35 60.70 4.22 0.94
C15:1 62.03 52.88 61.18 3.56 0.14
C16:0 2,823.89 2,766.27 2,889.82 74.91 0.51
C16:1T 54.08 40.47 45.83 7.45 0.44
C16:1 429.65 414.61 443.86 19.58 0.58
C17:0 156.40 150.63 159.87 6.66 0.61
C17:1 134.23 124.41 131.46 7.27 0.65
C18:0 1,471.92 1,469.44 1,582.63 49.94 0.19
C18:1T 230.04 220.63 254.45 14.85 0.23
C18:1 4,290.04ab 4,141.40b 4,546.06a 113.48 0.05
C18:1V 725.56 625.80 763.83 44.97 0.09
C18:2TT 24.45 16.27 15.67 2.89 0.08
C18:2 414.88ab 376.39b 443.09a 15.40 0.01
C18:3ω6 8.68 8.57 9.41 0.41 0.35
C18:3ω3 18.09 17.40 19.64 0.70 0.08
C19:0 16.66ab 16.20b 18.26a 0.62 0.05
C20:1 56.28 57.96 62.03 3.33 0.46
C20:2 3.89 3.83 6.77 2.30 0.39
C20:3ω6 27.50 22.97 27.84 1.62 0.07
C20:4ω6 80.23 67.05 78.89 4.94 0.13
C20:5ω3 7.92a 6.04b 7.50ab 0.54 0.05
C22:5 34.38 17.13 19.54 7.68 0.24
C24:1 13.23 11.80 12.29 0.67 0.31
Total 11,570.06ab 11,112.04b 12,107.25a 263.78 0.04
Other 113.44 103.14 123.68 12.72 0.52
SFA 4,895.38 4,826.70 5,082.91 127.02 0.34
UFA 6,674.69ab 6,285.33b 7,024.34a 158.61 0.01
SFA:UFA 0.74ab 0.77a 0.73b 0.01 0.05
MUFA 6,076.35ab 5,758.73b 6,414.27a 146.87 0.01
PUFA 598.34a 526.60b 610.07a 20.05 0.01
Trans 213.25 245.05 312.04 21.17 0.09
ω6 113.10 97.84 110.89 5.85 0.14
ω3 22.41 21.34 23.22 1.16 0.54
ω6: ω3 5.28 4.73 4.71 0.31 0.321Control: no OmniGen- AF supplementation; OmniGen- AF at Receiving: fi rst 28 d at the feedlot; OmniGen- AF throughout
Finishing: all 210 d at the feedlot. OmniGen- AF was top dressed at 4 g/45.4 kg BW/hd/d.2Fatty acids reported on a mg/100 g tissue basisa- bDiff erent superscripts indicate diff erences within each row (P < 0.05)

106 · 2017 Nebraska Beef Cattle Report
activity compared to meat from cattle that were not supplemented (18.98 vs. 19.11 U/mg protein, respectively).
In summary, dietary supplementation with OmniGen- AF did alter the fatty acid composition with the most meaningful dif-ference being the increased PUFA content in beef from cattle supplemented through-out fi nishing. Despite greater propensity for lipid oxidation due to increased PUFA content, supplementing with OmniGen- AF for long periods of time tended to enhanced lipid stability (determined by TBARS). Even though SOD activity was not found to diff er with the extended supplement feeding, it could be speculated that the tendency for added lipid stability could potentially be coming from downstream enzymes follow-ing SOD such as catalase and glutathione peroxidase. Another alternative could sim-ply be that phenolic- rich compounds in the supplement can successfully be incorpo-rated into tissues thus providing oxidative stability during retail display.
Conclusion
In conclusion, OmniGen- AF did not negatively impact beef shelf life despite causing an increase in PUFA content when supplemented throughout the fi nishing phase. In order for OmniGen- AF to be considered as a potential antioxidant source for beef cattle the supplement may need to be fed at greater concentrations.
Katherine I. Domenech, graduate studentMichael D. Chao, assistant professor, California State University- Chico College of AgricultureJoe Buntyn, graduate studentTy Schmidt, assistant professorChris R. Calkins, professor, University of Nebraska— Lincoln Department of Animal Science
Most important antioxidant system
Least important antioxidant system
Secondary“Dietary”
Antioxidants
Primary“Endogenous”Antioxidants
SOD
CAT
Gpx
Carotenoids (Vit E)
Flavonoids (Vit A, C)
Minerals and Proteins
Most reactive oxygen species
Least reactive oxygen species
Secondaryfree radicals
Primaryfree radicals
O2Superoxide
anion
H2O2Peroxides
OHHydroxyl radicals
O2Singlet oxygen
ROOPeroxyl radicals
Figure 1. Mechanisms to protect against toxic oxygen forms. Primary or endogenous mechanisms include: Superoxide dismutase, Catalase and Glutathione peroxidase. Secondary or dietary mechanisms include: Vitamins, Minerals and Proteins.
Figure 2. Reactive oxygen forms. Toxicity of free radicals increases towards top of pyramid. Primary free radicals are highly reactive and eventually form secondary free radicals. Th e function of SOD is to convert superoxide’s to less toxic forms such as peroxides and singlet oxygen.

2017 Nebraska Beef Cattle Report · 107
© Th e Board Regents of the University of Nebraska. All rights reserved.
retail display where a subjective color panel (8– 10 panelists) evaluated discoloration daily. In addition, L*, a*, and b* values were measured daily using a Minolta colorim-eter. Delta E values were then calculated from the L*, a*, and b* values using the following formula: ΔE = √[(L1- L0)2 + (a1- a0)2 + (b1- b0)2]. Day 0 was used as the initial value from each sample to compare the rate of discoloration. Six independent replicates were conducted.
Statistical Analysis
Th e PROC GLIMMIX of SAS 9.4 (SAS Inst., Inc., Cary, NC) was used to determine the eff ects of organic acids and application methods on the reduction of E. coliRif and ground beef color. All means were separat-ed with the LS- means (LSM) statement and the Tukey adjustment with an alpha of 0.05.
Results
All treatments reduced (P <0.01) E. coliRifcounts when compared to the inoculated control (0.39– 1.13 log CFU/cm2 reduction) when using E. coli/coliform petrifi lm. When using ACP petrifi lm, all treatments reduced (P < 0.01) E. coliRif counts except BX ESS (P = 0.423 log CFU/cm2), LA ESS (P = 0.328 log CFU/cm2) and PAA ESS (P = 0.088 log CFU/cm2). Th ere were no interactions between organic acids and application methods, however, dip and spray applications were more eff ective (P < 0.001) at reducing E. coliRif when compared to the ESS method (Table 1) using both ACP and E. coli/coliform petrifi lm. Additionally, LA had the greatest reduction while BX had the smallest reduction for organic acid type on E. coliRif (Table 2) using both ACP and E. coli/coliform petrifi lm. Reductions of E. coliRif on the outer fat surface (0.85 log CFU/cm2) was greater (P < 0.01) than re-duction of E. coliRif on the inner lean surface (0.59 log CFU/cm2) of the clod roast. Th is may be due to the buff ering capabilities of the lean tissue versus fat tissue. Microbial
Procedure
Rifampicin Resistant E. coli
Eleven beef shoulder clods were cut in half prior to inoculation to form clod roasts. Since fat and lean tissue have diff er-ent buff ering capabilities, one half was used as the outer fat surface and the other half was used as the inner lean surface of clod roasts for inoculation and application of an organic acid. Each half was inoculated with a fi ve strain cocktail (~5.6 log CFU/cm2) of Rifampicin resistant E. coli (E. coliRif). Aft er inoculation, fi ve core samples (3.92 in2) were taken from the inoculated surface for initial inoculation concentrations. Th en 4.5% lactic acid (LA), 2.5% Beefxide™ (BX, lactic acid + citric acid), or 380 ppm peroxyacetic acid (PAA) was applied at 67– 74˚F to each clod roasts using spray (5 sec, 20 psi), dip (15 sec), or electrostatic spray (ESS, 10 sec). Additionally, a non- inoculated control was used to assure that there were no E. coliRif naturally present and inoculated control was used to compare treatments to assure that the antimicrobial was eff ective. Aft er antimicrobial treatment, fi ve core samples (3.92 in2) were taken from the treated surface to determine the reduction of E. coliRif concentrations. Each clod roast was then ground and a 25 gram sample was collected for microbial analysis. All samples were extracted in peptone water containing Rifampicin and then enumerat-ed on ACP and E. coli/coliform Petrifi lm. Th is process was replicated three times.
Color and Total Plate Counts
Beef shoulder clods were treated with the same concentrations of LA, BX and PAA using spray (11 sec/side, 20 psi), dip (15 sec), or ESS (10 sec/side). Beef shoulder clods were ground and a 25 gram sample was collected for microbial analysis using ACP Petrifi lm. Microbial analysis was done on days 0, 1, 3, 5, and 7. Approximately one pound portions were formed using a Co-losimo press and were placed in simulated
Kelly A. McCartyGary A. SullivanDennis E. Burson
Summary with Implications
Small processors normally grind beef shoulder clods for ground beef that have not been previously tested for shiga toxin- producing E. coli. Th ree antimicrobial solutions were applied using three applica-tion methods to beef sub- primals to evaluate the eff ectiveness of reducing E. coli and the eff ects on quality attributes. Antimicrobi-als eff ectively reduced Rifampicin resistant E. coli. However, none of the treatments changed color attributes or total plate counts compared to a control. Th ese results suggest that an appropriate antimicrobial solution and application method can be selected for use by small meat processors without aff ect-ing quality attributes.
Introduction
Small meat processing operations oft en purchase beef shoulder clods for grinding that have not been tested for shiga toxin- producing E. coli (STEC). However, E. coli O157:H7 and other STEC are considered to be adulterants in raw, non- intact beef prod-ucts due to signifi cant health risks. Th e use of antimicrobial interventions applied to the surface of beef shoulder clods may off er small processors a method to reduce the risk of STEC in ground beef. Th e objectives of this research were to evaluate the eff ect of organic acid type and application method applied to the surface of beef shoulder clods as a means to reduce the risk of STEC and the eff ects on color and shelf life of the ground beef produced.
Organic Acids and Applications used for Reduction of E. coli on Beef Shoulder Clods used for Ground Beef

108 · 2017 Nebraska Beef Cattle Report
were minimal. Th e use of antimicrobials to minimize the risk of STEC may be applied to beef sub- primals by small meat proces-sors without impacting the color character-istics of ground beef in retail display.
Kelly A. McCarty, graduate student, Animal Science, LincolnGary A. Sullivan, assistant professor, Animal Science, LincolnDennis E. Burson, professor, Animal Science, Lincoln
Tukey’s adjustment. Th ere was no organic acid type or application method eff ect on discoloration (P > 0.23). Delta E values and discoloration percentages both increased (P < 0.001) with increased days of display.
Total plate counts of ground beef in dis-play exhibited an organic acid by applica-tion method interaction (P <0.01) showing that LA ESS had more aerobic growth than all other treatments. Total plate counts increased growth (P < 0.001) from day 0 (LSM = 2.03 log CFU/g) to day 7 (LSM = 4.11 log CFU/g).
Conclusions
Small meat processors can select an antimicrobial treatment to reduce the risk of STEC on the surface of beef sub- primals and in ground beef. Processors should con-sider either the LA or PAA organic acids as these were more eff ective at reducing E. coliRif counts on the surface of beef shoulder clods. In addition, when looking at the shelf life and color of the ground beef, a small meat processor can consider the use of any of the organic acids or application treatments as the impacts on ground beef quality as measured by L*, a*, or b* values, Delta E values, or discoloration percentages
samples of ground beef produced from the clod roasts showed that E. coliRif counts for only the spray and dip treatments were diff erent than the inoculated control (P < 0.001). Additionally, ground beef E. coliRif counts were greater (P < 0.001) from roasts treated on the lean surface (3.74 log CFU/g) than roasts treated on the fat surface (3.32 log CFU/g). It is possible that the application time or the application distance used for ESS from the meat surface reduced the amount of organic acid that adhered to the surface of the clod roasts to reduce the impact of the organic acid on E. coliRif.
In an organic acid by application method interaction (P < 0.001) for L* values of ground beef, PAA Spray (LSM = 48.23) resulted in a darker colored surface area than LA spray (LSM = 49.88), BX spray (LSM = 49.91), and PAA dip (LSM = 49.96). An organic acid by application method interaction (P < 0.01) showed BX dip and BX spray increased in b* values (yellowness) while LA ESS decreased in b* values. As expected, L*, a*, and b* values all decreased (P < 0.001) with increasing days of display. Delta E values, a measure of color change, showed an organic acid by application method interaction (P < 0.05) but no means separation occurred aft er applying
Table 1. Eff ect of application method on the reduction of E. coliRif (log CFU/cm2) on beef shoulder clods using 15 s dip, 10 s ESS at 6– 12 inches, and 5 s spray at 6– 12 inches.
Application Method
Dip Electrostatic Spray
Spray SEM P- value
E. coli/coliform Petrifi lm
0.875a 0.466b 0.830a 0.075 < 0.001
ACP Petrifi lm 0.621a 0.115b 0.608a 0.071 < 0.001
a,b Means within a row without a common superscript are signifi cantly diff erent
Table 2: Eff ect of organic acid type on the reduction in E. coliRif (log CFU/cm2) on beef shoulder clods using 2.5% Beefxide™, 4.5% lactic acid, and 380 ppm peroxyacetic acid.
Organic Acid Type
Beefxide™ Lactic Acid Peroxyacetic Acid
SEM P- value
E. coli/coliform Petrifi lm
0.547b 0.863a 0.762ab 0.075 < 0.001
ACP Petrifi lm 0.289b 0.493ab 0.563ab 0.071 < 0.05
a,b Means within a row without a common superscript are signifi cantly diff erent

2017 Nebraska Beef Cattle Report · 109
© Th e Board Regents of the University of Nebraska. All rights reserved.
GLIMMIX procedure of SAS. Statistical signifi cance was determined at P ≤ 0.05.
Results
Salt has a bacteriostatic eff ect in meat products, and some greater concentrations will slow or even halt bacterial growth. Th ere was a storage time by salt concen-tration interaction for APC in samples (P = 0.016; fi gure 1). Aerobic bacterial growth for all treatments increased until week 8, where growth reached a plateau. At weeks 0 and 2, there was a positive linear response, where growth was increased as salt increased. From weeks 6 to 18, there was a negative response where increasing salt concentration reduced aerobic bacterial growth. Similarly, there was a storage time by salt concentration interaction for AnPC (P = 0.020). Anaerobic bacterial growth generally increased until around week 8 for all treatments. On weeks 4, 10, 12, 14, and 16 there was a negative linear response to salt concentration where anaerobic bacte-rial growth decreased as salt increased. On the remaining weeks, there was no signifi -cant salt concentration response.
Th e majority of vegetative cells are destroyed during the cooking process, therefore most bacteria present on the fi nished product is introduced during slicing or packaging. Furthermore, growth throughout storage time may be altered by packaging, ingredients, storage temperature and many other intrinsic or extrinsic fac-tors. In the current study, family Pseudomo-nadaceae was dominant throughout storage time, regardless of salt concentration. Figure 2 shows the relative abundances of various microbial families based on salt concentration and storage time. Th ere were no changes in the microbial fl ora due to salt concentration; pseudomonads dominated spoilage regardless of treatment. At week 0, Pseudomonadaceae relative abundance was 58.9%, increased at week 2, and remained between 84% and 99.7% of all bacteria for the remainder of storage time. Th e current results indicate that salt concentrations
health stigma sometimes associated with processed meats. Th e objectives of this study were to determine the eff ects of salt reduction on the quality, textural, and shelf life properties of deli- style roast beef, and identify changes in the microbial communi-ty caused by varying salt concentrations.
Procedure
Ground and formed deli- style roast beef was produced at the UNL Loeff el Meat Laboratory using four diff erent salt concentrations, 1.0%, 1.5%, 2.0%, and 2.5%, calculated on a meat block basis. For each treatment, a brine for 25% extension was formulated to contain the appropriate salt concentration plus 1.0% sugar and 0.35% sodium phosphates (on a meat block basis) and added water. Brine was mixed and added to 20 lbs. of ½” ground beef top round, and vacuum tumbled for 90 min. Tumbled meat was stuff ed into 3.5” diameter pre- stuck fi brous casings using a vacuum stuff er, pressed, clipped, weighed, and hung on a smokehouse truck. Roast beef rolls were cooked to 160° F, chilled overnight at 35° F, and sliced the following day. Slices were vacuum packaged and stored in a covered opaque plastic container under refrigeration at 35° F for shelf life analyses. Water activity, cooking yield, and fi nal salt concentration were analyzed on the day of slicing. Th e following were mea-sured every two weeks starting on the day of slicing for 18 w of shelf life: Hardness, cohesiveness, springiness, and chewiness using texture profi le analysis (TPA), pH, aerobic plate count (APC), anaerobic plate count (AnPC), and objective color (CIE L*, a*, b*). Change in color (ΔE) during storage was calculated using objective color values. For 14 w of storage time, bacterial communities were analyzed by sequencing of 16S rRNA using the Illumina MiSeq platform. Data were analyzed for interac-tions and main eff ects of salt concentration as a continuous variable, and storage time as a repeated measure, using the PROC
Chad G. BowerRegan E. Stanley
Samodha C. FernandoGary A. Sullivan
Summary with Implications
Concerns with excessive sodium intake have led to increased pressure on meat processors to reduce added salt in meat prod-ucts. Quality characteristics and microbial growth were evaluated on deli- style roast beef slices formulated to contain varying concentrations of added salt. Salt concentra-tion had no eff ect on microbial community composition, however increasing salt slowed microbial growth over time. Increasing salt increased cooking yield and decreased water activity. Salt reduction negatively impacts the texture, yield, and shelf life of deli- style roast beef, however salt concentrations within this range do not signifi cantly alter spoilage fl ora community composition.
Introduction
Excess sodium intake has been a health concern for many years, however renewed eff orts to reduce sodium in the diet have emerged recently. Much of the sodium in processed meat products is from added salt, therefore to achieve suffi cient sodium reduction, added salt must be reduced. Yet, salt is essential to produce processed meats. Th e multi- functional properties of salt have been well documented and are necessary to provide the texture, fl avor, bind, water holding capacity, and extended shelf life of processed meat. Salt can also alter the microbial composition of meat products, potentially shift ing the spoilage fl ora toward slower growing, less detrimental groups of bacteria. Processed meats are essential in adding value to lower quality or less mar-ketable cuts of beef, and sodium reduction is a major step in reducing the negative
Eff ect of Salt Reduction on the Quality and Shelf Life Characteristics of Deli- Style Roast Beef

110 · 2017 Nebraska Beef Cattle Report
within this range do not aff ect microbial community composition, but rather the makeup up of the initial load may have the most impact.
In processed meats, salt is responsi-ble for protein extraction, which alters product bind and texture. Texture profi le analysis (TPA) was used to instrumentally determine the texture diff erences caused by increasing salt concentration. Hard-ness showed a quadratic response to salt concentration (P < 0.001) where hardness decreased from 1.0% to 1.5% and 1.5% to 2.0% salt, but decreased less rapidly from 2.0% to 2.5%. Cohesiveness and springi-ness both displayed a linear response (P < 0.001 and P = 0.002, respectively) where cohesiveness decreased and springiness increased as salt concentration increased. Chewiness had a quadratic response, which increased greatly from 1.0% to 1.5% and 1.5% to 2.0% salt, and increased less rapidly from 2.0% to 2.5%.
Salt concentration aff ected objective color, having a cubic response for L* (lightness; P = 0.034), a quadratic response for b* (yellowness; P < 0.001), and a linear response for a* (redness; P < 0.001). Sam-ples decreased in lightness from 1.0% to 2.0% salt, and then increased in lightness from 2.0% to 2.5%. Yellowness decreased from 1.0% to 2.0%, and increased from 2.0 to 2.5%. As salt concentration increased, redness decreased. Salt concentration did not aff ect ΔE (overall color change during storage time).
Th roughout storage time, the growth of lactic acid bacteria results in lactic acid production, reducing meat pH. Sample pH was aff ected by storage time, where pH increased from week 0 to week 6, and then decreased from week 6 for the remainder of storage time. Th ere was a cubic response on pH from salt concentration, where pH decreased from 1.0% to 1.5%, increased from 1.5% to 2.0%, and decreased again from 2.0% to 2.5%. Cooking yield displayed a cubic response (P < 0.001), where yield increased greatly from 1.0% to 1.5% salt, but increased at a diminishing rate from 1.5% to 2.0%, and 2.0% to 2.5%. Both water activity and measured salt concentration in the fi nished product showed a linear response (P < 0.001), where water activity decreased as salt increased, and measured salt in the fi nished product increased as ingoing salt concentration increased.
9
8
7
6
5
4
3
2
1
00 2 4 6 8 10 12 14 16 18
1.0%
1.5%
2.0%
2.5%
Storage Time (Weeks)
Log
CFU
/g
Other
Flavobacteriaceae
Carnobacteriaceae
Lactobacillaceae
Enterobacteraceae
Listeriaceae
Pseudomonadaceae
Other
Flavobacteriaceae
Carnobacteriaceae
Lactobacillaceae
Enterobacteraceae
Listeriaceae
Pseudomonadaceae
1.0 1.5 2.0 2.5Salt Concentration (%)
Storage Time (Weeks)0 2 4 6 8 10 12 14
Rela
tive A
bund
ance
(%)
Rela
tive A
bund
ance
(%)
100
90
80
70
60
50
40
30
20
10
0
100%
90%
80%70%60%50%40%30%
20%
10%
0%
Figure 1. Interaction of salt concentration (%) and storage time on aerobic plate count in deli- style roast beef
Figure 2. Relative abundances of bacterial families as aff ected by salt concentration and storage time in deli- style roast beef slices

2017 Nebraska Beef Cattle Report · 111
amplifi ed as salt concentration was reduced. Although salt concentration had a statisti-cally signifi cant eff ect on instrumental col-or, diff erences in color values in this study are likely of little practical value. Microbial community dynamics of cooked deli meats should be further explored, especially with regard to antimicrobials or other ingredi-ents that may have a more profound eff ect on microbial communities, as well as any changes in product quality caused by such ingredients.
Chad G. Bower, graduate studentRegan E. Stanley, graduate studentSamodha C. Fernando, assistant professor, Animal Science, LincolnGary A. Sullivan, assistant professor, Animal Science, Lincoln
Conclusions
Results of this study indicate that besides reducing total bacterial growth, salt concentration between 1.0% and 2.5% has a minimal eff ect on microbial commu-nity composition. Furthermore, although Pseudomonadaceae growth is typically suppressed in cooked, vacuum packaged products, a signifi cant initial load of pseu-domonads may cause them to dominate microbial populations. Decreasing salt concentration resulted in poorer textural properties of roast beef likely related to reduced protein solubilization and cross-linking during processing and cooking. Increasing salt concentration resulted in increased cooking yield through improved moisture retention during cooking process. Th e negative eff ects of salt reduction were
Table 1. Main eff ects of salt concentration on various quality and microbiological measurements of deli- style roast beef slices.
Salt Concentration P Value
1.0% 1.5% 2.0% 2.5% SE Linear Quadratic Cubic
Cooking Yield (%)
72.79 84.43 87.16 90.60 0.67 <0.001 <0.001 0.014
Water Activity 0.986 0.983 0.983 0.980 0.001 <0.001 0.487 0.099
Measured Salt (%)
0.78 1.06 1.36 1.68 0.04 <0.001 0.625 0.987
pH 6.06 6.00 6.05 6.03 0.03 0.715 0.288 0.026
L* 60.02 59.40 58.18 58.57 0.36 <0.001 0.031 0.034
a* 8.61 8.34 8.12 8.03 0.12 <0.001 0.277 0.836
b* 9.42 8.78 8.43 8.64 0.16 <0.001 <0.001 0.558
Color Change (ΔE)
1.76 1.43 1.54 1.41 0.24 0.185 0.524 0.339
Hardness 1917.0 1664.9 1483.1 1424.0 47.5 <0.001 0.007 0.161
Cohesiveness 0.313 0.308 0.293 0.288 0.007 0.012 0.458 0.074
Springiness 0.355 0.356 0.380 0.391 0.017 <0.001 <0.001 0.678
Chewiness 213.17 182.43 164.73 160.36 13.07 <0.001 0.970 0.211
APC (log CFU/g) 1
6.26 6.22 6.25 5.29 0.27 — — —
AnPC (log CFU/g)1
2.77 1.41 1.90 1.12 0.61 — — —
1Indicates a signifi cant salt concentration by storage time interaction (P ≤ 0.05) for aerobic plate count (APC) and anaerobic plate count (AnPC), therefore main eff ect P values are not reported.

112 · 2017 Nebraska Beef Cattle Report
© Th e Board Regents of the University of Nebraska. All rights reserved.
consultants and producers. Online- survey soft ware was used to create, distribute, and store data for both surveys. Surveys were distributed using an electronic mailing list of crop consultants and producers devel-oped by University of Nebraska Extension educators. Th e survey was open from January 15, 2015 to February 15, 2015. Th e Institutional Review Board (IRB) at the University of Nebraska- Lincoln approved this study.
Results
Background Information
Th e survey return rate was 24.9% (234/940) for the consultant survey. Most consultants directly farmed either 0 acres (31.5%) or 1– 999 acres (45.3%). Consul-tants indicated that the majority of their land was either irrigated by sprinkler or rain- fed. Seventy- six percent of consul-tants infl uenced 4000 or more acres. Th e majority of infl uenced acres were either sprinkler irrigated or rain- fed acres with,
of Nebraska’s corn residue acres are grazed. It can only be postulated that concerns of degrading soil and associated impacts on subsequent grain yield or the limited num-ber of cows in the area to graze the residue could be some reasons for the low percent-age of corn residue being grazed.
Even though corn residue is a potential forage source for grazing cattle, how the residue is used or managed post- harvest is determined by the land owner. Th erefore, this survey was developed to better under-stand the factors infl uencing perceptions and behaviors of crop consultants and producers in Nebraska regarding grazing corn residue.
Procedures
Crop consultants (940) and crop pro-ducers (545) in Nebraska were surveyed. Th e survey had 16 questions for consul-tants and 14 for producers. Th ere were some similar questions across surveys to allow for comparison between responses of
Jordan L. CoxKristen M. Ulmer
Manbir RakkarLisa Franzen- Castle
Humberto Blanco- CanquiMary E. Drewnoski
James C. MacDonaldRichard J. Rasby
Summary with Implications
A survey was conducted to explore factors infl uencing corn residue grazing recommen-dations by crop consultants and producer practices in Nebraska. Approximately 80% of consultants recommended grazing corn residue, while 63% of producers allowed grazing. Of producers who did not graze, about 50% cited concerns related to soil compaction, inconvenience (lack of water, fencing, and land/equipment damage), and lack of access to livestock. Producers who allowed and consultants who recommend-ed grazing were more likely to perceive that grazing residue increased subsequent grain yields. Most consultants (56.0%) and producers (43.8%) reported making decisions in regards to grazing based on their own observation. Findings from this survey can be used to design extension education and re-search involving the impacts of grazing corn residue on subsequent grain yield and soil attributes. Extension could also be a conduit linking cattle owners with crop producers that reported not having access to livestock for grazing.
Introduction
While crop yields, soil properties, and animal impacts due to grazing of corn resi-due have been assessed by research studies, consultants and producers perceptions and factors infl uencing producer decision to graze or not graze corn residue are still un-clear. Currently, it is estimated that only 25%
Perceptions of crop consultants and producers on grazing corn residue in Nebraska
Figure 1. Percent of farmers grazing corn residue with their own livestock, renting corn residue to others or not grazing corn residue.
Grazed by own cattle
Rented out for grazing
Grazed by own cattle and rented out for grazing
Not grazed
Percent of Producers
37%
6%
17%
40%
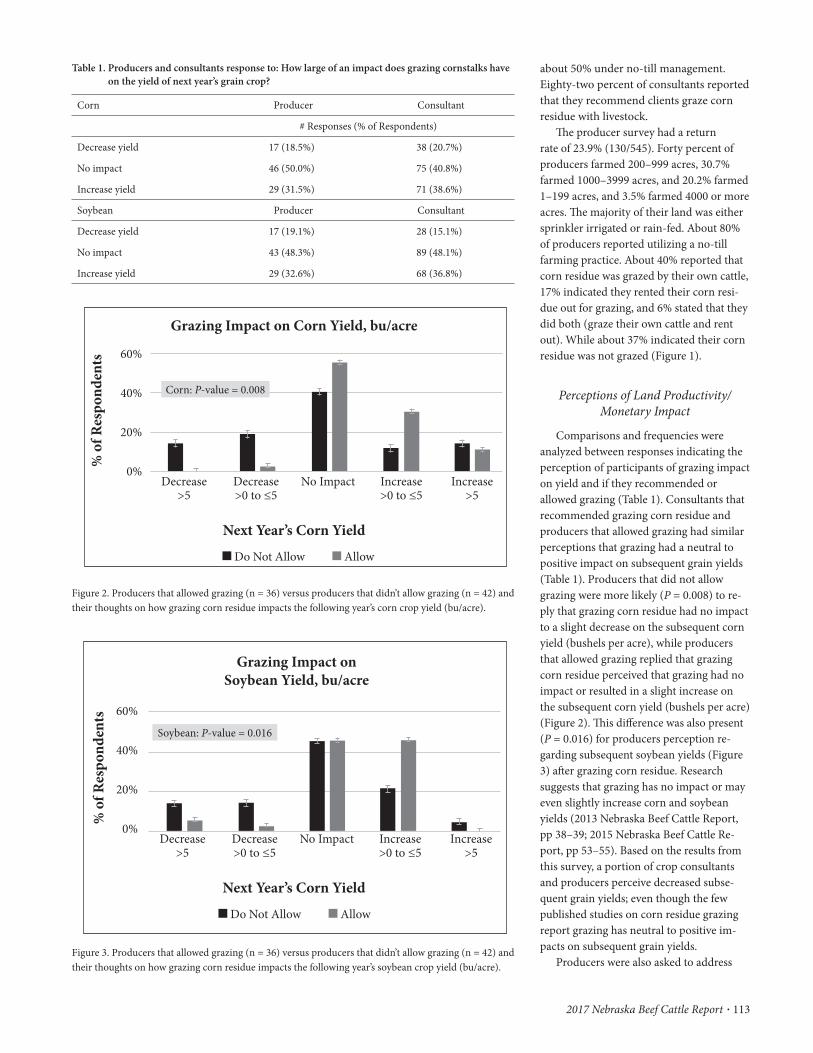
2017 Nebraska Beef Cattle Report · 113
about 50% under no- till management. Eighty- two percent of consultants reported that they recommend clients graze corn residue with livestock.
Th e producer survey had a return rate of 23.9% (130/545). Forty percent of producers farmed 200– 999 acres, 30.7% farmed 1000– 3999 acres, and 20.2% farmed 1– 199 acres, and 3.5% farmed 4000 or more acres. Th e majority of their land was either sprinkler irrigated or rain- fed. About 80% of producers reported utilizing a no- till farming practice. About 40% reported that corn residue was grazed by their own cattle, 17% indicated they rented their corn resi-due out for grazing, and 6% stated that they did both (graze their own cattle and rent out). While about 37% indicated their corn residue was not grazed (Figure 1).
Perceptions of Land Productivity/Monetary Impact
Comparisons and frequencies were analyzed between responses indicating the perception of participants of grazing impact on yield and if they recommended or allowed grazing (Table 1). Consultants that recommended grazing corn residue and producers that allowed grazing had similar perceptions that grazing had a neutral to positive impact on subsequent grain yields (Table 1). Producers that did not allow grazing were more likely (P = 0.008) to re-ply that grazing corn residue had no impact to a slight decrease on the subsequent corn yield (bushels per acre), while producers that allowed grazing replied that grazing corn residue perceived that grazing had no impact or resulted in a slight increase on the subsequent corn yield (bushels per acre) (Figure 2). Th is diff erence was also present (P = 0.016) for producers perception re-garding subsequent soybean yields (Figure 3) aft er grazing corn residue. Research suggests that grazing has no impact or may even slightly increase corn and soybean yields (2013 Nebraska Beef Cattle Report, pp 38– 39; 2015 Nebraska Beef Cattle Re-port, pp 53– 55). Based on the results from this survey, a portion of crop consultants and producers perceive decreased subse-quent grain yields; even though the few published studies on corn residue grazing report grazing has neutral to positive im-pacts on subsequent grain yields.
Producers were also asked to address
Grazing Impact on Corn Yield, bu/acre
Next Year’s Corn Yield
% o
f Res
pond
ents 60%
40%
20%
0%
Do Not Allow Allow
Decrease>5
No Impact Decrease>0 to ≤5
Increase>0 to ≤5
Increase>5
Corn: P-value = 0.008
Next Year’s Corn Yield
Grazing Impact on Soybean Yield, bu/acre
% o
f Res
pond
ents 60%
40%
20%
0%
Do Not Allow Allow
Decrease>5
No Impact Decrease>0 to ≤5
Increase>0 to ≤5
Increase>5
Soybean: P-value = 0.016
Table 1. Producers and consultants response to: How large of an impact does grazing cornstalks have on the yield of next year’s grain crop?
Corn Producer Consultant
# Responses (% of Respondents)
Decrease yield 17 (18.5%) 38 (20.7%)
No impact 46 (50.0%) 75 (40.8%)
Increase yield 29 (31.5%) 71 (38.6%)
Soybean Producer Consultant
Decrease yield 17 (19.1%) 28 (15.1%)
No impact 43 (48.3%) 89 (48.1%)
Increase yield 29 (32.6%) 68 (36.8%)
Figure 3. Producers that allowed grazing (n = 36) versus producers that didn’t allow grazing (n = 42) and their thoughts on how grazing corn residue impacts the following year’s soybean crop yield (bu/acre).
Figure 2. Producers that allowed grazing (n = 36) versus producers that didn’t allow grazing (n = 42) and their thoughts on how grazing corn residue impacts the following year’s corn crop yield (bu/acre).

114 · 2017 Nebraska Beef Cattle Report
corn residue rental rates (Table 2). Of the producers that currently rent out grazing, 23.5% reported not charging a rental fee, 58.8% had a rental fee rate ranging from $1 to $15 per acre, and 17.7% charged $16 to $25 per acre. Forty- two percent of producers that did not allow corn residue grazing indicated they would allow cattle to graze corn residue if off ered $15 per acre or less, 18% would allow cattle to graze corn residue for $16 to $35 plus per acre, and the remaining 40% would not allow grazing regardless of the rental fee off ered.
Of the producers that were currently not grazing residue, the reasons for not grazing corn residue were compared between those that would allow grazing for a rental fee with those that would not allow grazing regardless of the rental fee (Table 3). Th e majority of respondents that would not allow grazing regardless of rental fee indi-cated that they felt grazing caused compac-tion (65%) on their fi eld or had a negative impact on their farming practices (tillage or planting; 55%). Sixty percent of the pro-ducers that would allow grazing for a rental fee selected “other”, and based on their comments approximately 70– 75% of those respondents indicated they did not have access to livestock for grazing. Consultants that did not recommend grazing indicated the following reasons were very or some-what important: grazing had a negative impact on farming practices (73%), grazing reduces subsequent grain yields (63%), and livestock producers would not pay the perceived value of corn residue (56%).
Source of Information Regarding Grazing Corn Residue
Fift y- six percent of consultants indicat-ed they based client recommendations re-garding grazing corn residue on their “own observation”, while 31.6% indicated they received information from the University of Nebraska Extension (Figure 4). Produc-er responses to this question were similar to consultants, with 43.8% basing their decisions regarding grazing corn residue on their “own observation”, followed by 22.3% basing decisions on information received from University of Nebraska Extension. For both consultants and producers, their own observation and the University of
Table 2. Comparisons between producers that currently rent out grazing and currently do not allow grazing and their perceptions on grazing rental rates.
Grazing rental fee1 Currently rent out for grazing(n=26), %
Currently Do Not Allow(n=50), %
Free 23.5 14.0
$1 to $15 per acre 58.8 28.0
$16 to $25 per acre 17.7 8.8
$26 to $35 per acre 0.0 4.0
> $35 per acre 0.0 6.0
Would not allow grazing regardless of rental fee
— 40.0
1What rental fee do you charge (currently rent) vs. what rental fee would you need (do not allow) for cattle to graze corn residue.
Table 3. Comparisons between producers who currently do not graze but would consider grazing for a fee and those that would not consider grazing regardless of the rental fee.
What are the reasons your corn residue is not grazed?1
Do not Allow, but would Rent for a Fee
(n=30), %
Would not Allow Regardless of Rental Fee
(n=20), %
Reduces subsequent year’s crop yields
0.0 10.0
Negative impact on farming practice
10.0 55.0
Lack of water for livestock 26.7 40.0
Lack of fencing 10.0 30.0
Livestock producers will not pay the perceived value of stalks
30.0 25.0
Interferes with fall fi eld work 23.3 25.0
Causes compaction 20.0 65.0
Other 60.0 30.0
1Th is question was a select all that apply so percentages will be over 100%.

2017 Nebraska Beef Cattle Report · 115
Manbir Rakkar, graduate student, Agronomy and Horticulture, LincolnLisa Franzen-Castle, associate professor, Nutrition and Health Sciences, LincolnHumberto Blanco- Canqui, associate professor, Agronomy and Horticulture, LincolnMary E. Drewnoski, assistant professor, Animal Science, LincolnJames C. MacDonald, associate professor, Animal Science, LincolnRichard J. Rasby, professor, Animal Science, Lincoln.
tants recommend grazing. Th e results also indicated that producers who did not allow grazing did so mostly because of concerns related to soil compaction, inconvenience (lack of water, fencing, and land/equipment damage), and lack of access to livestock. To our knowledge, this survey was the fi rst to investigate factors infl uencing corn residue grazing recommendations of crop consul-tants and practices of producers.
Jordan L. Cox, graduate student, Animal Science, LincolnKristen M. Ulmer, graduate student, Animal Science, Lincoln
Nebraska Extension remained the fi rst and second choice regardless of whether they recommended/allowed grazing or did not recommend/allow grazing.
Conclusions
Th e purpose of the survey was to gain a better understanding of factors that infl uenced perceptions, attitudes, and be-haviors of crop consultants and producers relative to grazing corn residue. Th e results indicated that the majority of consultants and producers had a neutral perception toward grazing impact on subsequent crop yields and that a large portion of consul-
Where Survey Respondents Received Information
% of Respondents
Sour
ce
Consultants
Producers
13.721.5
18.516.2
13.1
56
14.1
43.8
17.9
16.7
8.5
2.35.1
22.331.6
3.1
0 20 40 60 80 100
Have not received this Information
Farm Magazines/Newsletters
Your Observation
Other Producer(s)
Crop Consultant
Seed Dealer
Other University
Nebraska Extension
Figure 4. Where Survey Respondents Received Information.

© Th e Board Regents of the University of Nebraska. All rights reserved.
Th e purpose of beef cattle and beef product research at UNL is to provide reference information that rep-resents the various populations (cows, calves, heifers, feeders, carcasses, retail products, etc) of beef pro-duction. Obviously, the researcher cannot apply treatments to every member of a population; therefore he/she must sample the population. Th e use of statistics allows the researcher and readers of the Nebraska Beef report the opportunity to evaluate separation of random (chance) occurrences and real biological eff ects of a treatment. Following is a brief description of the major statistics used in the beef report. For a more detailed description of the expectations of authors and parameters used in animal science see Journal of Animal Sci-ence Style and Form at: http://jas.fass.org/misc/ifora.shtml.
— Mean: Data for individual experimental units (cows, steers, steaks) exposed to the same treatment are gen-erally averaged and reported in the text, tables and fi gures. Th e statistical term representing the average of a group of data points is mean.
— Variability: Th e inconsistency among the individual experimental units used to calculate a mean for the item measured is the variance. For example, if the ADG for all the steers used to calculate the mean for a treatment is 3.5 lb then the variance is zero. But, this situation never happens! However, if ADG for individual steers used to calculate the mean for a treatment range from 1.0 lb to 5.0 lb, then the variance is large. Th e variance may be reported as standard deviation (square root of the variance) or as standard error of the mean. Th e standard error is the standard deviation of the mean as if we had done repeated samplings of data to calculate multiple means for a given treatment. In most cases treatment means and their measure of variability will be expressed as follows: 3.5 0.15. Th is would be a mean of 3.5 followed by the standard error of the mean of 0.15. A helpful step combining both the mean and the variability from an experi-ment to conclude whether the treatment results in a real biological eff ect is to calculate a 95% confi dence interval. Th is interval would be twice the standard error added to and subtracted from the mean. In the example above, this interval is 3.2- 3.8 lb. If in an experiment, these intervals calculated for treatments of interest overlap, the experiment does not provide satisfactory evidence to conclude that treatments eff ects are diff erent.
— P Value: Probability (P Value) refers to the likelihood the observed diff erences among treatment means are due to chance. For example, if the author reports P 0.05 as the signifi cance level for a test of the diff er-ences between treatments as they aff ect ADG, the reader may conclude there is less than a 5% chance the diff erences observed between the means are a random occurrence and the treatments do not aff ect ADG. Hence we conclude that, because this probability of chance occurrence is small, there must be diff erence between the treatments in their eff ect on ADG. It is generally accepted among researchers when P values are less than or equal to 0.05, observed diff erences are deemed due to important treatment eff ects. Authors occasionally conclude that an eff ect is signifi cant, hence real, if P values are between 0.05 and 0.10. Further, some authors may include a statement indicating there was a tendency or trend in the data. Authors oft en use these statements when P values are between 0.10 and 0.15, because they are not confi dent the diff er-ences among treatment means are real treatment eff ects. With P values of 0.10 and 0.15 the chance random sampling caused the observed diff erences is 1 in 10 and 1 in 6.7, respectively.
— Linear & Quadratic Contrasts: Some articles contain linear (L) and quadratic (Q) responses to treat-ments. Th ese parameters are used when the research involves increasing amounts of a factor as treatments. Examples are increasing amounts of a ration ingredient (corn, by- product, or feed additive) or increasing amounts of a nutrient (protein, calcium, or vitamin E). Th e L and Q contrasts provide information regard-ing the shape of the response. Linear indicates a straight line response and quadratic indicates a curved response. P- values for these contrasts have the same interpretation as described above.
— Correlation (r): Correlation indicates amount of linear relationship of two measurements. Th e correlation coeffi cient can range from 1 to 1. Values near zero indicate a weak relationship, values near 1 indicate a strong positive relationship, and a value of 1 indicates a strong negative relationship.
Statistics Used in the Nebraska Beef Report and Th eir Purpose

AcknowledgementsAppreciation is expressed to the following fi rms, associations, or agencies who provided
grant support for research in the beef cattle program.
Agriculture and Food Research Initiative Competitive Grant/USDA/NIFA Foundation Program: Animal Reproduction
Th e Beef Checkoff , Centennial, ColoCargill Corn Milling, Blair, Neb.CSIRO, Commonwealth Scientifi c and Industrial Research
Organization, Dickson, ACT, AustraliaElanco Animal Health, Indianapolis, Ind.Huvepharma Inc. Peachtree City, GADr. Kenneth and Caroline McDonald Eng Foundation
San Antonio, Tex.Lallemand Animal Nutrition. Montreal, Quebec, CanadaMerck Animal Health, Madison, NJNational Cattlemen’s Beef Association, Centennial, Colo.Nebraska Beef Council, Kearney, Neb.Nebraska Cattlemen Research and Education Foundation,
Lincoln, Neb.
Nebraska Center for Energy Sciences Research, University Of Nebraska, Lincoln, Neb
Nebraska Corn Board, Lincoln, Neb.Nebraska Environmental Trust, Lincoln, Neb.Novus International, Saint Charles, MOPellet Technology USA, Gretna, Neb.Prince Agri Products, Inc. Quincy, ILRich Porter. Reading, KSSyngenta. Greensboro, NCUSDA MultiState Hatch Funds (Pasture work)USDA NIFA Climate Change (Samodha)USDA NIFA Award 2012 68003-30155USDA grant Award 2012-68002-19823USDA SARE
Appreciation is also expressed to the following fi rms who provide products or services
Beefmaster Breeders UnitedBirko Corporation. Henderson, COCargill Corn Milling, Blair, Neb.Cattlemen’s Nutrition Services, LLC, Lincoln, NEElanco Animal Health, Indianapolis, Ind.Greater Omaha Packing Company, Omaha, Neb.Iowa Limestone, Des Moines, Iowa
Kalle USA Inc. Gurnee, ILNovus International, Inc., St. Charles, Mo.Sladky Farms. Wahoo, Neb.Tyson Foods. Springdale, ARUS Meat Animal Research Center, Clay Center, Neb.USDA Meat Grading and Certifi cation Branch, Omaha, Neb
Appreciation is also expressed to the following Research Technicians, Unit Managers, and Crew involved in the research Programs at our various locations.
Animal Science http://animalscience.unl.edu
Curriculum: Th e curriculum of the Animal Science Department at the University of Nebraska– Lincoln is designed so that each student can select from a variety of options oriented to specifi c career goals in professions ranging from animal production to veterinary medicine. With unique opportunities to double major in Grazing Livestock Systems (http://gls.unl.edu) or complete the Feedlot Management Internship Program (http://feedlot.unl.edu/intern)
Careers:Animal HealthBanking and FinanceAnimal ManagementConsultant
EducationMarketingTechnical ServiceMeat Processing
Meat SafetyQuality AssuranceResearch and DevelopmentVeterinary Medicine
Scholarships: Th e Animal Science Department also off ers scholarships to incoming freshmen and upperclassmen. Th e department awards over $30,000 each year to Animal Science students.ABS Global ScholarshipBaltzell- Agri- Products, Inc. ScholarshipMaurice E. Boeckenhauer Memorial ScholarshipMike Cull Judging and Activities ScholarshipDon Geweke Memorial AwardParr Young Senior Merit AwardNebraska Pork Producers Association ScholarshipWaldo Family Farms ScholarshipFrank and Mary Bruning ScholarshipArt and Ruth Raun ScholarshipAnimal Science Department Freshman ScholarshipFeedlot Management ScholarshipRobert Boeckenhauer Memorial ScholarshipBurnell Scholarship FundDoane ScholarshipLincoln Coca- Cola Bottling Company Scholarship.
William J. and Hazel J. Loeff el ScholarshipNutrition Service Associates ScholarshipParr Family Student Support FundChris and Sarah Raun Memorial ScholarshipWalter A. and Alice V. Rockwell ScholarshipStandard Manufacturing Co. ScholarshipMax and Ora Mae Stark ScholarshipD. V. and Ernestine Stephens Memorial ScholarshipDwight F. Stephens ScholarshipArthur W. and Viola Th ompson ScholarshipTh omas H. Wake, III ScholarshipFrank E. Card ScholarshipDerrick Family ScholarshipG. H. Francke Livestock Judging ScholarshipEric Peterson Memorial AwardWinkler Memorial Livestock Judging Scholarship
Agriculture Research & Development Center, Ithaca
Sam CairesKen CejkaAndrew DonahueAlex FrerichsTara HarmsBump KraegerAaron Lauer
Michael LubenSteve MaserBrett MehomAllison MillerKarl MolineJustin MooreChuck Rezac
Ken RezacBen SchneiderMark SchroederMatt SillivanKeith Street
Department of Animal Science, Lincoln
Jeff BergmanKevin BahrCurt BittnerBethany BlackburnRobby BondurantBradley BoydClay BoylesZac CarlsonRoger Carpenter
Jana GramkowHannah HamiltonBrent JohnsonMelissa JollyTommi JonesScott KurzErin MarotzClyde NaberSamantha Powell
Kyle ReganCalvin SchrockPayton ShanklandDavid ShieldsAdam ShreckDarren StrizekCurtis Wetovick
Gumundsen Sandhills Laboratory, Whitman
Andy ApplegarthJacki Musgrave
John Nollette
Panhandle Research & Extension Center, Scottsbluff
Josh ButtleNabor Guzman
Jacob HansenDoug Pieper
West Central Research & Extension Center, North Platte
Mike KirbyJess Milby
T. L. MeyerJim Teichert
High Plains Ag Laboratory
Rob Higgins Paul McMillian
Electronic copies of Nebraska Beef Reports and Summaries available at: http://beef.unl.edu, click on reports.

Extension is a Division of the Institute of Agriculture and Natural Resources at the University of Nebraska—Lincoln cooperating with the C ounties and the United States Department of Agriculture.
University of Nebraska—Lincoln Extension educational programs abide with the nondiscrimination policies of the University of Nebraska—Lincoln and the United States Department of Agriculture.
Coyright © 2016 Th e Board of Regents of the University of Nebraska. All rights reserved.
Agricultural Research DivisionUniversity of Nebraska Extension
Institute of Agriculture and Natural ResourcesUniversity of Nebraska–Lincoln
Non Profi tUS Postage
PAIDUNLP.O. Box 830908
C220 ANSCLincoln, NE 68583-0908 USA
NE
BR
AS
KA
MP104
2017Beef Cattle
Report
2017 Beef Cattle Report
MP104