Embed Size (px)
Citation preview

U.S. Outbound Tourism Market Research

Table of Content
• U.S. Outbound Tourism Market Overview…………………………………………………………………
• The Number of U.S. Outbound Tourists & Destinations…………………………………………………
• U.S. Outbound Tourists Profiles & Travel Behaviors……………………………………………………
• Travel Information Sources for U.S. Tourists………………………………………………………………
• China Tourism Market Overview on U.S. Tourists to China/Guizhou/Guiyang………………………
71
72
79
112
128
1

U.S. Outbound Tourism Market Overview
• U.S continued to see a slow economic recovery in 2016. The economy was not likely to have a strong rebound due
to inflation, uncertain fiscal policy, unbalanced economic structure, etc.
• Despite the negative factors mentioned above, U.S. outbound tourism remained a sustained growth, with the
number of U.S. outbound tourists reaching 72.56 million from Jan. – Nov. 2016, up by 8% from the same period
last year.
• Among all global destinations, Canada and Mexico were the most favored ones chosen by over half of the U.S.
outbound travelers. Other popular oversea destinations mainly scatter around European and Caribbean areas, like
UK, Dominica, France, etc.
• The boom of digital media has encouraged more U.S. tourists to review travel website like TripAdvisor when
planning for the next trip overseas.
2

The Number of U.S. Outbound Tourists & Destinations
3

The Number of U.S. Outbound Tourists
Data Source:US National Travel and Tourism Office
2,702.3 2,850.2 2,901.5 3,078.0 3,278.9 3,182.4
2,008.4 2,036.7 2,085.1 2,588.2
2,819.5 2,780.1
1,159.7 1,185.4 1,147.8
1,151.5 1,246.8 1,293.4
56.6%
3.8% 1.0%
11.1% 7.7% 8.0%
0%
10%
20%
30%
40%
50%
60%
0
1,000
2,000
3,000
4,000
5,000
6,000
7,000
8,000
2011 2012 2013 2014 2015 2016.1-11
The Number of U.S. Outbound Tourists 2011-2016 (10,000 Persons)
Other Overseas Destinations Mexico Canada YoY Growth Rate
6,134.4
6,817.6 7,345.3 7,256.0
During 2011 – 2016, the number of U.S. outbound tourists was on the rise year by year, reaching 72.56 million from
Jan. – Nov. 2016, which was up by 8% from the same period last year.
5,870.4 6,072.3
4

The Number of U.S. Tourists to Overseas Destinations
Data Source:US National Travel and Tourism Office Note: Excluding data of U.S. tourists to Mexico and Canada
0
50
100
150
200
250
300
350
400
450
Jan Feb Mar Apr May Jun Jul Aug Sep Oct Nov Dec
The Number of U.S. Outbound Tourists Per Month 2013-2016(10 Thousand People)
2013 2014 2015 2016
From 2013 to 2016, the number of U.S. tourists to overseas destinations (excluding Mexico and Canada) fluctuated
periodically. The peak time was June and July as the summer holiday for U.S. students lasted from June to August.
The next peak time was in November, when the Christmas season approached.
5

U.S. Outbound Travel Destinations
Data Source:Phocuswright’s Good Travels: The Philanthropic Profile of the American Traveler
Data from a research in 2015 showed, European destinations appealed to the majority of U.S. travelers, particularly
for tourists aged 18-34. However, U.S. tourists aged 35-54 showed more interests in Mexico than in other destinations,
accounting for 23% of the overall group.
35%
24%
24%
18%
11%
13%
18%
23%
15%
8%
9%
9%
9%
15%
5%
9%
7%
2%
Europe
Mexico
Canada
Central America
Asia
South America
The Appeal of Overseas Destinations to U.S. Travelers by Age 2015
18-34 35-54 55+
6

Data Source:US National Travel and Tourism Office Note: Excluding data of U.S. tourists to Mexico and Canada
39.3%
38.6%
38.4%
39.5%
22.6%
23.3%
23.3%
22.3%
14.9%
14.6%
14.8%
15.2%
6.0%
5.8%
5.7%
5.6%
8.6%
8.8%
8.5%
8.3%
2.0%
2.0%
2.0%
2.0%
5.4%
5.8%
6.2%
6.1%
1.2%
1.2%
1.1%
1.0%
0% 10% 20% 30% 40% 50% 60% 70% 80% 90% 100%
2013
2014
2015
2016.1-11
U.S. Outbound Travel Destinations Distribution 2013-2016
Europe Caribbean Asia South America Central America Oceania Middle East Africa
From 2013 to 2016, the most popular overseas destinations (excluding Mexico and Canada) for U.S. travelers were
mainly located in European and Caribbean area. The tourists to these two areas accounted for over half of all the US
outbound tourists. It should be noted that preference for South American destinations saw a gradual drop, and Asian
destinations ranked the third at 15%.
U.S. Outbound Travel Destinations
7

Data Source:US National Travel and Tourism Office Note: Excluding data of U.S. tourists to Mexico and Canada
In 2015, among all the overseas destinations (except Mexico and Canada) which U.S. tourists traveled to, UK and
Dominica shared the 1st place with a 9% share respectively. However, when it came to business travel, the top 4
countries were UK, Germany, China and France with 10%, 9%, 9% and 7% respectively.
9%
9%
7%
6%
5%
5%
4%
4%
3%
3%
3%
3%
3%
3%
9%
10%
8%
7%
5%
5%
4%
3%
3%
4%
3%
3%
2%
3%
10%
3%
7%
4%
9%
2%
3%
9%
3%
2%
3%
3%
5%
2%
UK
Dominica
France
Italy
Germany
Jamaica
Spain
China
New Zealand
Bahamas
Costa Rica
India
Japan
Philippines
U.S. Outbound Travel Destinations Distribution 2015
All U.S.Tourists Vacation & Visiting Relatives and Friends Business & Convention
U.S. Outbound Travel Destinations
8

Data Source:US National Travel and Tourism Office Note: Excluding data of U.S. tourists to Mexico and Canada
U.S. Outbound Travel Destinations Distribution 2015
All U.S. Tourists Vacation & Visiting
Relatives and Friends
Business &
Convention
Europe 35% 35% 39%
UK 9% 9% 10%
France 7% 8% 7%
Italy 6% 7% 4%
Germany 5% 5% 9%
Spain 4% 4% 3%
New Zealand 3% 3% 3%
Ireland 2% 3% 1%
Switzerland 2% 2% 2%
Austria 1% 1% 2%
Caribbean
area 24% 27% 12%
Dominica 9% 10% 3%
Jamaica 5% 5% 2%
Bahamas 3% 4% 2%
Aruba 2% 2% 1%
South
America 7% 7% 8%
Columbia 2% 2% 3%
Peru 2% 2% 1%
All U.S.
Tourists
Vacation & Visiting
Relatives and Friends
Business &
Convention
Central
America 8% 8% 7%
Costa Rica 3% 3% 3%
Africa 3% 3% 4%
Middle East 6% 5% 6%
Israel 2% 1% 1%
Asia 19% 17% 28%
China 4% 3% 9%
India 3% 3% 3%
Japan 3% 2% 5%
Philippines 3% 3% 2%
Hong Kong 2% 1% 4%
Taiwan 2% 2% 3%
South Korea 2% 1% 3%
Oceania 2% 2% 2%
Australia 2% 1% 2%
U.S. Outbound Travel Destinations
9

U.S. Outbound Tourists Profiles & Travel Behaviors
10
U.S. Outbound Tourists Overview
Data Source:ASTA + PSB’s 2017 “How America Travels” National Study
Age: US Global Travelers
Visited 4+ countries in past 10 years
39%
19%
42%
Millennials (25-39)
Gen X’ers (40-51)
Boomers (52-71)
Age: Others
Visited 0-3 countries in past 10 years
45%
28% 27%
16% 38% 40% 37% 41%
18%
$50K $50-100K $100+
14%
82%
35% 53%
5% 11%
HS or less Some college College degree
US Global Travelers
Others
Education: Income:
Millennials (25-39)
Gen X’ers (40-51)
Boomers (52-71)
11
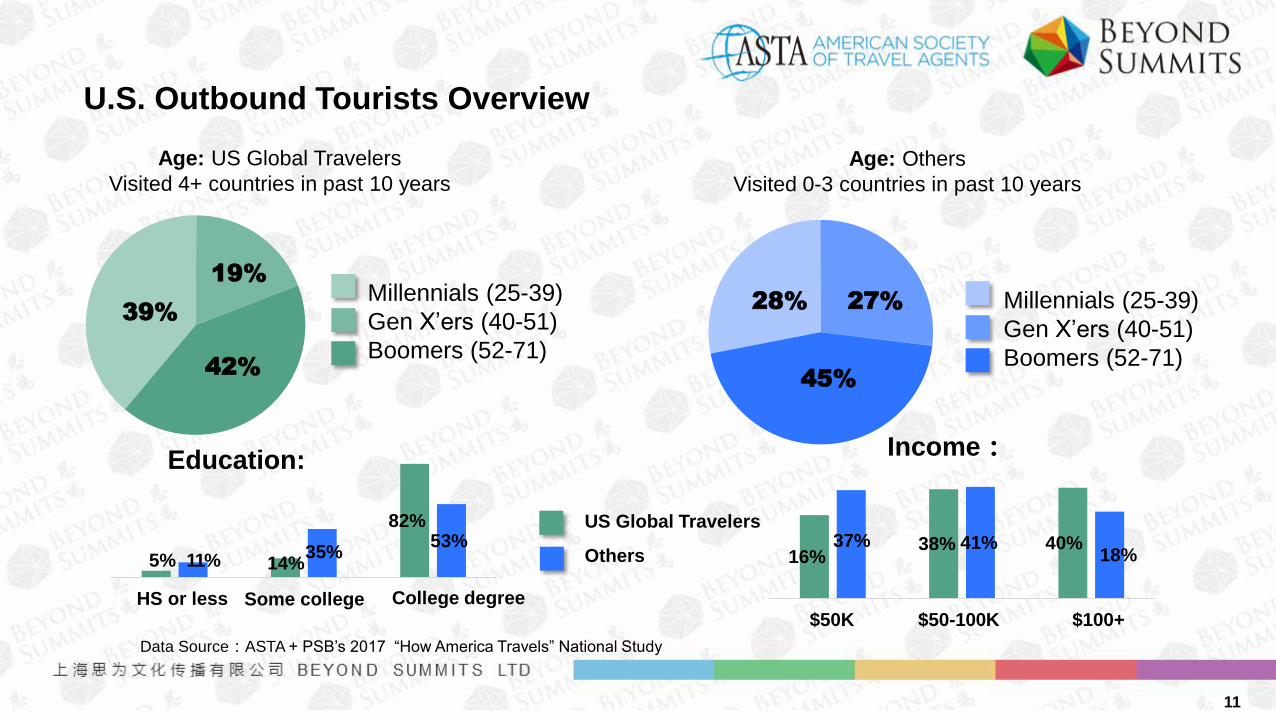
Gender and Age of U.S. Outbound Tourists
Data Source:US National Travel and Tourism Office Note: not include data of U.S. tourists to Mexico and Canada
• In 2015, among all the U.S. tourists to overseas destinations, the number of males was almost equal to that of
females. But it should be noted that, male travelers were much more than female travelers when the travel purpose
was to attend meetings or for business. Females were more likely to travel for visiting relatives or for vacations.
• Generally, U.S. male outbound travelers were older than female travelers, with an average age of 40-50.
68%
46%
50%
32%
54%
50%
0% 20% 40% 60% 80% 100%
Business &Convention
Vacation & VisitingRelatives and
Friends
All U.S. Tourists
Gender of U.S. Outbound Tourists 2015
Male Female
45.0 45.4
45.6
43.5
44.1
42.9
40
42
44
46
All U.S. Tourists Vacation&VisitingRelatives and Friends
Business&Convention
Average Age of U.S. Outbound Tourists 2015
Male
Female
12

Occupations of U.S. Outbound Tourists
Data Source:US National Travel and Tourism Office Note: Excluding data of U.S. tourists to Mexico and Canada
In 2015, 41% of the U.S. outbound tourists were engaged in work related to administration, trade, science and art;
among those who traveled for business and meetings, the proportion was even higher reaching 66%.
66%
39%
41%
3%
17%
15%
7%
12%
11%
3%
10%
11%
9%
7%
7%
2%
6%
5%
1%
3%
3%
6%
4%
6%
0% 10% 20% 30% 40% 50% 60% 70% 80% 90% 100%
Business &Convention
Vacation & VisitingRelatives and Friends
All U.S. Tourists
Occupations of U.S. Outbound Tourists 2015
Admin/Trade/Science/Art Retired Service Industry Students Sales Housewife Military&Goverment Others
13
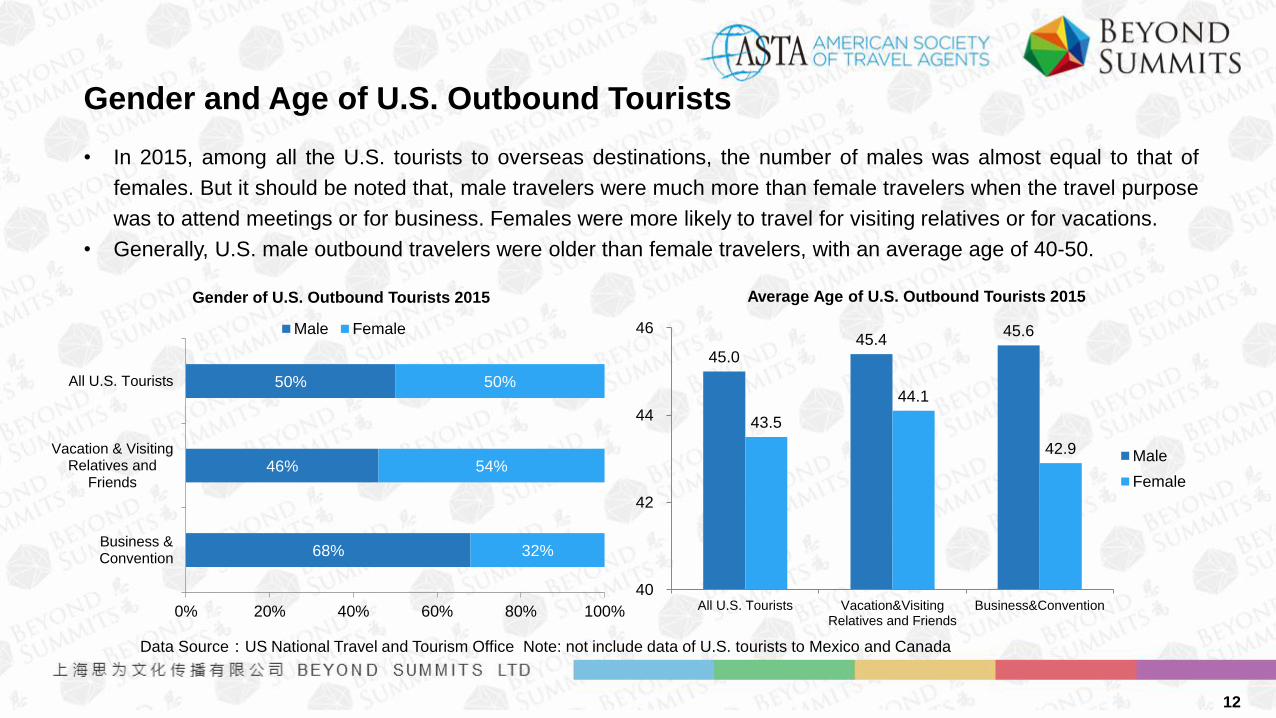
Household Income of U.S. Outbound Tourists
Data Source:US National Travel and Tourism Office Note: Excluding data of U.S. tourists to Mexico and Canada
In 2015, the average household income of U.S. outbound tourists reached $124,633 per year; travelers that went
abroad for business and meetings had an annual household income of $152,868.
124,633 122,107
152,868
100,000 95,000
120,000
0
20,000
40,000
60,000
80,000
100,000
120,000
140,000
160,000
180,000
All U.S. Tourists Vacation & Visiting Relatives and Friends Business & Convention
Average Annual Household Income of U.S. Outbound Tourists 2015 (US dollars)
Average Median
14

The Number of Overseas Destinations Visited by U.S. Tourists
Data Source:US National Travel and Tourism Office Note: Excluding data of U.S. tourists to Mexico and Canada
In 2015, U.S. outbound tourists mainly traveled to 1 destination overseas, accounting for 57% of the total; 23% of all
the U.S. outbound travelers visited 2 destinations.
1 destination,
2 destinations,
≥3 destinations,
The Number of Overseas Destinations Visited by U.S. Tourists 2015
15
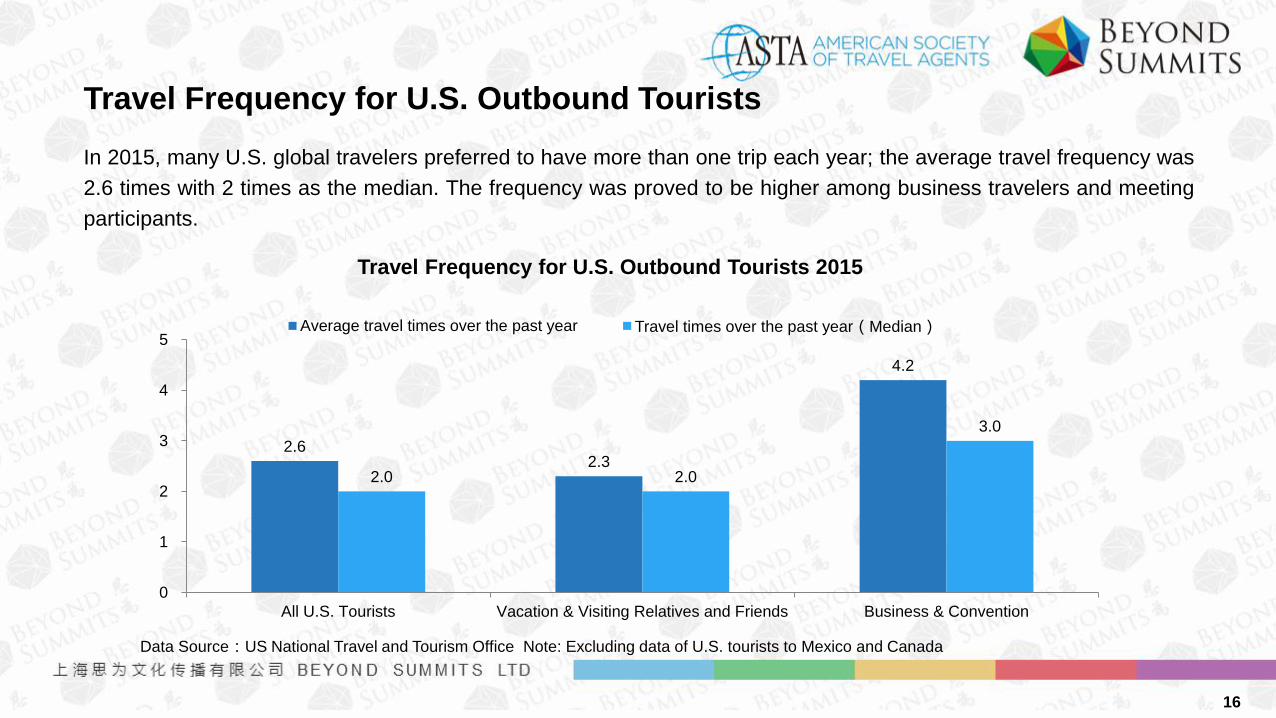
Travel Frequency for U.S. Outbound Tourists
Data Source:US National Travel and Tourism Office Note: Excluding data of U.S. tourists to Mexico and Canada
In 2015, many U.S. global travelers preferred to have more than one trip each year; the average travel frequency was
2.6 times with 2 times as the median. The frequency was proved to be higher among business travelers and meeting
participants.
2.6 2.3
4.2
2.0 2.0
3.0
0
1
2
3
4
5
All U.S. Tourists Vacation & Visiting Relatives and Friends Business & Convention
Travel Frequency for U.S. Outbound Tourists 2015
Average travel times over the past year Travel times over the past year(Median)
16

Income VS Travel Frequency
Data Source:2016 IXI Economic Cohorts / GfK MRI (2015 Doublebase Survey of the American Consumer)
According to the research based on the data of the past 3 years, U.S. travelers with higher income had higher
frequency of outbound traveling.
0%
5%
10%
15%
20%
25%
1 Time 2 Times 3 Times 4 Times 5+ Times
Travel Frequency of U.S. Outbound Tourists with Different Level of Income Over the Past 3 Years
Low(Under $50,000) Medium($50,000-$100,000) High($100,000-$200,000) Elite(Over $200,000)
17

Age VS Travel Frequency
Data Source:2016 IXI Economic Cohorts / GfK MRI (2015 Doublebase Survey of the American Consumer)
Over the past three years, among U.S. travelers of different age groups, middle-age travelers have been the major
group for overseas trips.
0%
2%
4%
6%
8%
10%
12%
14%
16%
1 Time 2 Times 3 Times 4 Times 5+ Times
Travel Frequency of US Outbound Tourists by Age over the Past 3 Years
Under 35 35-54 55-64 Over 65
18

Age VS Travel Duration
Data Source:2016 IXI Economic Cohorts / GfK MRI (2015 Doublebase Survey of the American Consumer)
Over the past three years, travelers of all age groups were more willing to stay for 3-7 days in overseas destinations.
Yet for tourists aged over 65, they would like to have an 8-14 days trip overseas.
0%
2%
4%
6%
8%
10%
12%
14%
16%
1-2 Days 3-7 Days 8-14 Days 30+ Days
Travel Duration of US Outbound Tourists by Age over the Past 3 Years
Under 35 35-54 55-64 Over 65
19
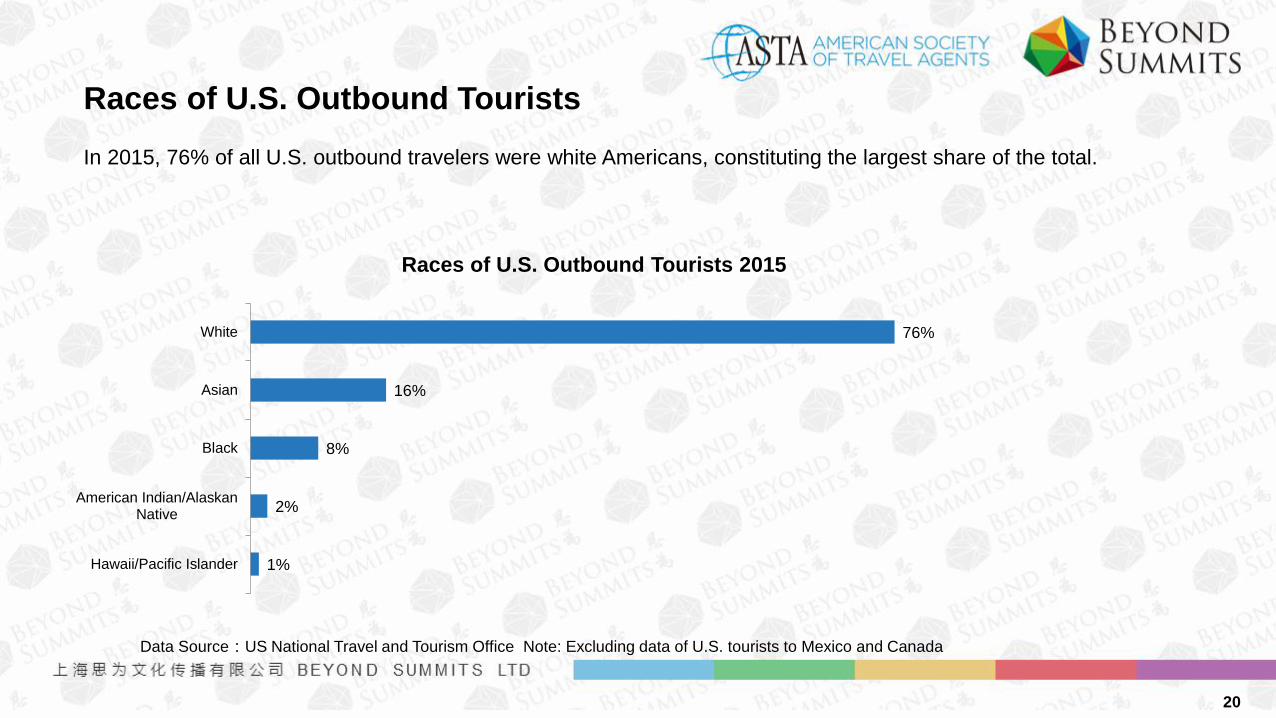
Races of U.S. Outbound Tourists
Data Source:US National Travel and Tourism Office Note: Excluding data of U.S. tourists to Mexico and Canada
In 2015, 76% of all U.S. outbound travelers were white Americans, constituting the largest share of the total.
76%
16%
8%
2%
1%
White
Asian
Black
American Indian/AlaskanNative
Hawaii/Pacific Islander
Races of U.S. Outbound Tourists 2015
20

Source Areas of U.S. Outbound Tourists
Data Source:US National Travel and Tourism Office Note: Excluding data of U.S. tourists to Mexico and Canada
In 2015, U.S. outbound tourists mainly lived around Mid-Atlantic, South Atlantic and Pacific areas, such as New York,
Florida, Texas, etc.
Region/State/City Share of All Tourists
New England 7% Massachusetts 4%
Boston 2%
Middle Atlantic 20% New York 10%
New York City 8%
New Jersey 5%
Pennsylvania 5%
Philadelphia 3%
East North Central 10% Michigan 3%
Detroit 2%
Illinois 3%
Chicago 2%
Ohio 2%
West North Central 4% Minnesota 2%
East South Central 3%
South Atlantic 23% Florida 8%
Region/State/City Share of All Tourists
Miami 2%
Ft. Lauderdale 2%
Virginia 3%
Georgia 3%
Atlanta 3%
North Carolina 3%
Maryland 3%
D.C. Metro Area 3%
East South Central 3%
West South Central 12%
Texas 9%
Houston 3%
Dallas 3%
Mountain 5% Colorado 2%
Pacific 15% California 11%
Los Angeles 3%
Washington 2%
Seattle 2%
Source Areas of U.S. Outbound Tourists 2015
21
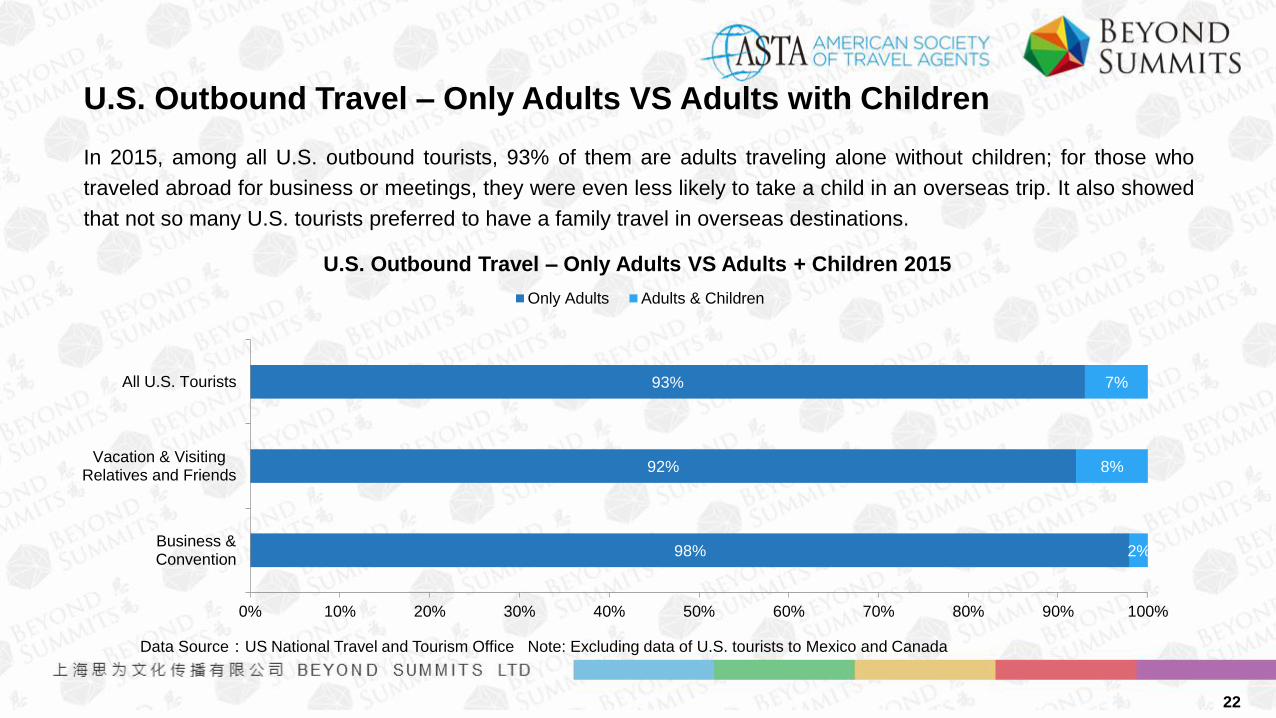
U.S. Outbound Travel – Only Adults VS Adults with Children
Data Source:US National Travel and Tourism Office Note: Excluding data of U.S. tourists to Mexico and Canada
In 2015, among all U.S. outbound tourists, 93% of them are adults traveling alone without children; for those who
traveled abroad for business or meetings, they were even less likely to take a child in an overseas trip. It also showed
that not so many U.S. tourists preferred to have a family travel in overseas destinations.
98%
92%
93%
2%
8%
7%
0% 10% 20% 30% 40% 50% 60% 70% 80% 90% 100%
Business &Convention
Vacation & VisitingRelatives and Friends
All U.S. Tourists
U.S. Outbound Travel – Only Adults VS Adults + Children 2015
Only Adults Adults & Children
22

First Outbound Travel Experience for U.S. Tourists
Data Source:US National Travel and Tourism Office Note: Excluding data of U.S. tourists to Mexico and Canada
In 2015, only 5% of all U.S. outbound tourists traveled abroad for the first time, as most of them traveled abroad
before.
7%
7%
5%
93%
93%
95%
0% 10% 20% 30% 40% 50% 60% 70% 80% 90% 100%
Business &Convention
Vacation & VisitingRelatives and Friends
All U.S. Tourists
Outbound Travel Experience of U.S. Tourists 2015
First overseas travel Traveled abroad before
23

U.S. Outbound Travel Departure Ports
Data Source:US National Travel and Tourism Office Note: Excluding data of U.S. tourists to Mexico and Canada
In 2015, U.S. outbound tourists mainly departed from large cities in U.S., such as New York topping the other ports at
14%. Next came Atlanta and Philadelphia, which accounted for 10% and 8% each.
14%
10%
8%
7%
7%
7%
6%
5%
5%
5%
3%
3%
2%
14%
10%
9%
7%
7%
6%
6%
5%
5%
5%
3%
3%
2%
11%
10%
5%
8%
9%
7%
8%
5%
6%
6%
5%
5%
2%
New York
Atlanta
Philadelphia
Los Angeles
Delas/Fort Worth
Houston
Miami
Newark
Washington
Chicago
Boston
Los Angeles
Charlotte
Departure Ports of U.S. Outbound Travel 2015
All U.S. Tourists Vacation & Visiting Relatives and Friends Business & Convention
24

Travel Purposes of U.S. Outbound Tourists
Data Source:US National Travel and Tourism Office Note: Excluding data of U.S. tourists to Mexico and Canada
In 2015, U.S. tourists traveled to overseas destinations mostly for vacations (53%), and the secondary purpose
was to visit relatives and friends with a share of 27%.
Vacation, 53%
Visiting Relatives and Friends, 27%
Business, 10%
Education, 4%
Expo/Meeting, 3%
Religion/Pilgrimage, 2%
Health Tour, 1%
Travel Purposes of U.S. Outbound Tourists 2015
25

Travel Reasons for U.S. Outbound Tourists
Data Source:ASTA + PSB’s 2017 “How America Travels” National Study
Americans would love to travel abroad to get relaxed, spend happy time with families, go sight seeing, etc.
65%
53% 53% 48%
42% 37%
28% 25%
22% 20%
69%
62%
40% 35%
18%
24%
16%
30% 27%
14%
0%
10%
20%
30%
40%
50%
60%
70%
80%
Relax Spend quality timewith family
See natural sights See historic sights Explore othercultures
Experience differentfood
Visit museums Go to the beach Spend quality timewith friends
Enjoy a luxurioushotel stay
U.S. Tourists Tourists from Other Countries
Top 10 Most Important Reasons for Outbound Travel
26

U.S. Outbound Tourists’ Concerns
Data Source:ASTA + PSB’s 2017 “How America Travels” National Study
Compared to travelers from other countries, US outbound travelers were less concerned about transportation
accidents, but significantly more concerned about theft and terrorism.
27%
24%
12%
15%
5% 3%
7%
4% 2%
1%
26%
21% 21%
11%
4% 6%
3% 5%
2% 1%
0%
5%
10%
15%
20%
25%
30%
Theft Terrorism Transportationaccident
Violent crime Getting injured Contracting adesease
Discrimination orharassment
Natural disasters Civil unrest Others
U.S. Outbound Tourists’ Concerns
U.S. Tourists Tourists from Other Countries
27

U.S. Outbound Tourists’ Travel Spend Per Trip
Data Source:ASTA + PSB’s 2017 “How America Travels” National Study
U.S. outbound tourists tended to spend more per trip comparing with tourists from other countries; roundtrip
transportation fees, among all the travel expenses, occupied the largest share at $689.4 per person.
689.4
333.1
213.9
117.5
391.73
244.98
147.93
80.17
0
100
200
300
400
500
600
700
800
Roundtrip transportation (excluding rental cars) Tours and activities Lodging (per person, per night) Rental cars
U.S. Outbound Tourists’ Average Spend Per Trip (US dollars)
U.S. Tourists Tourists from Other Countries
28

Data Source:US National Travel and Tourism Office Note: Excluding include data of U.S. tourists to Mexico and Canada
In 2015, the total spend per U.S. outbound tourist reached up to $2,731, among which air fare had a share of over
45% at $1,243. Besides, tourists who joined travel groups usually spent less than individual travelers, with an average
spend of $2,669 per person.
2,731
1,243
2,669
0
500
1,000
1,500
2,000
2,500
3,000
Total spend Air tickets Travel group fees
U.S. Outbound Tourists’ Average Spend Per Capita 2015 (US dollars)
U.S. Outbound Tourists’ Average Spend Per Capita
29

Travel Companions of U.S. Outbound Tourists
Data Source: US National Travel and Tourism Office Note: Excluding visitors to Mexico and Canada
In 2015, most of U.S. outbound tourists traveled alone, accounting for 63%, followed by traveling with spouses or
companions, accounting for 23%. Family travel only occupied a share of 12%.
63%
23%
12%
5%
1%
1%
58%
28%
14%
5%
0%
1%
83%
9%
3%
1%
5%
0%
Travelling Alone
With Spouses/Companions
With Family/Relatives
With Friends
With Business Partners
In Tour Groups
Travel Companions of U.S. Outbound Tourists 2015 (Multiple Choices)
All U.S. Tourists Vacation & Visiting Relatives and Friends Business & Convention
30
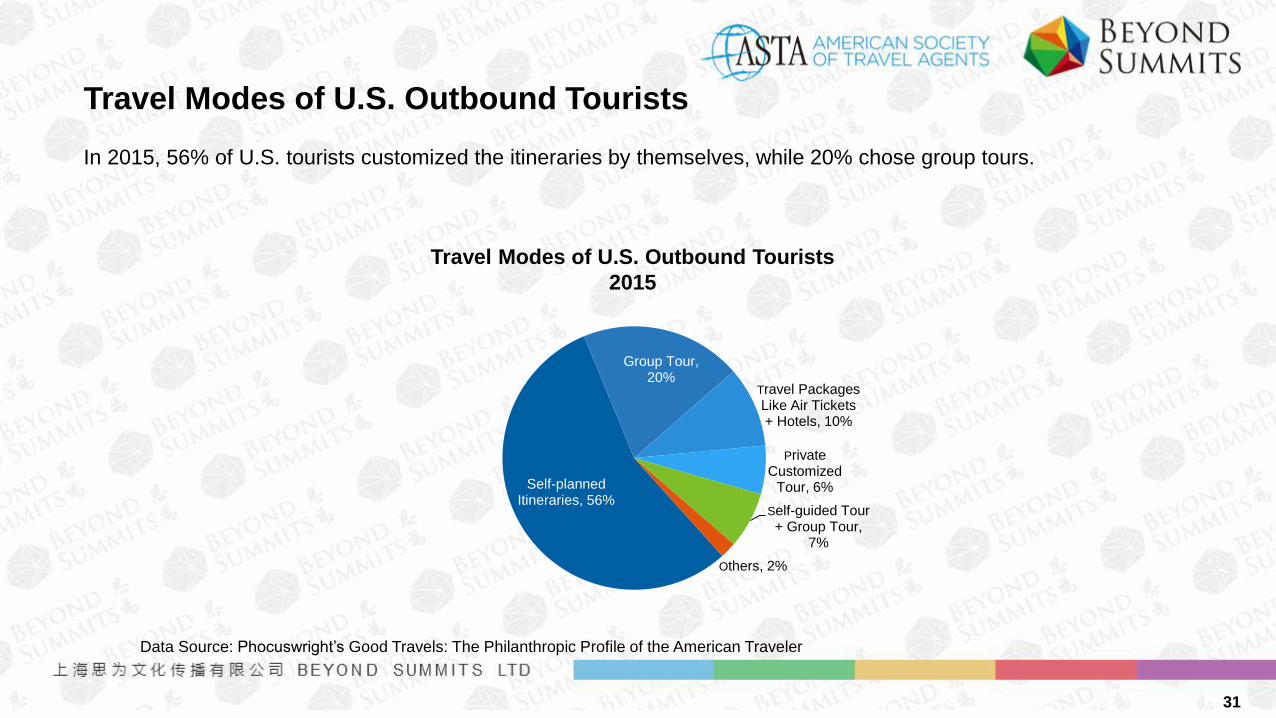
Travel Modes of U.S. Outbound Tourists
Data Source: Phocuswright’s Good Travels: The Philanthropic Profile of the American Traveler
In 2015, 56% of U.S. tourists customized the itineraries by themselves, while 20% chose group tours.
Self-planned Itineraries, 56%
Group Tour, 20%
Travel Packages Like Air Tickets + Hotels, 10%
Private Customized
Tour, 6%
Self-guided Tour + Group Tour,
7%
Others, 2%
Travel Modes of U.S. Outbound Tourists
2015
31
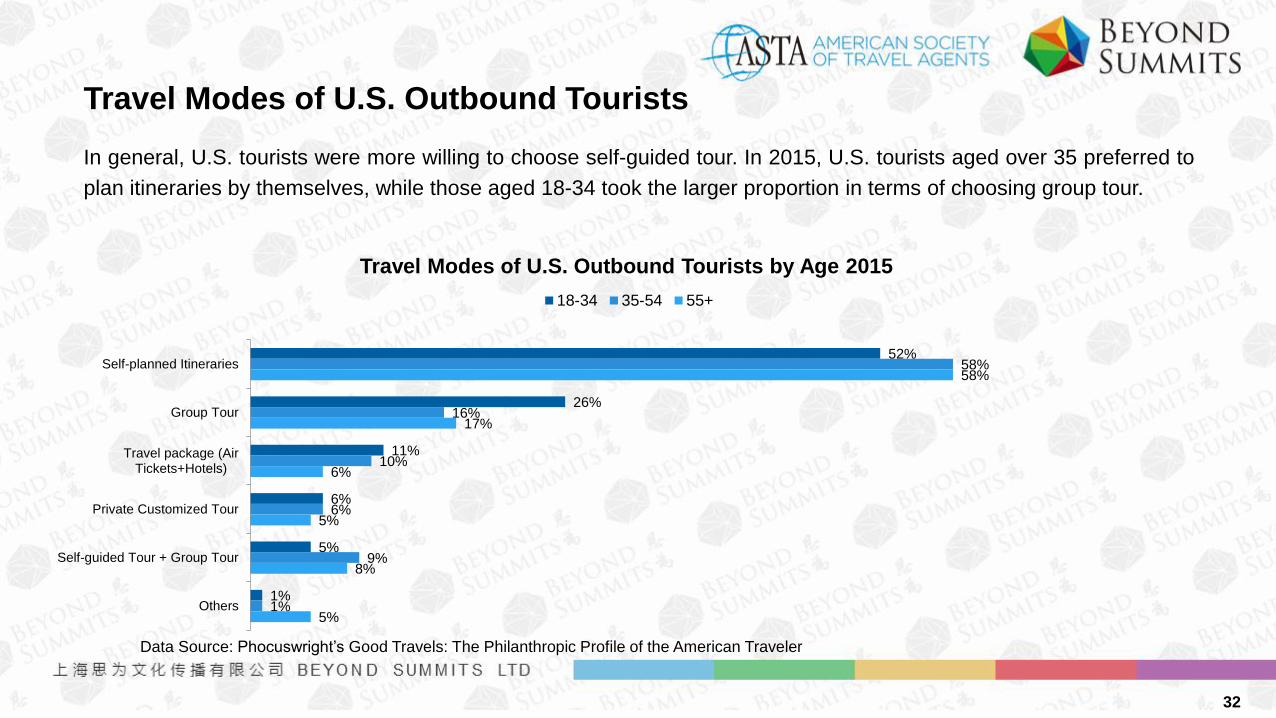
Travel Modes of U.S. Outbound Tourists
Data Source: Phocuswright’s Good Travels: The Philanthropic Profile of the American Traveler
In general, U.S. tourists were more willing to choose self-guided tour. In 2015, U.S. tourists aged over 35 preferred to
plan itineraries by themselves, while those aged 18-34 took the larger proportion in terms of choosing group tour.
52%
26%
11%
6%
5%
1%
58%
16%
10%
6%
9%
1%
58%
17%
6%
5%
8%
5%
Self-planned Itineraries
Group Tour
Travel package (AirTickets+Hotels)
Private Customized Tour
Self-guided Tour + Group Tour
Others
Travel Modes of U.S. Outbound Tourists by Age 2015
18-34 35-54 55+
32

Leisure and Recreational Activities for U.S. Outbound Tourists
Data Source: US National Travel and Tourism Office Note: Excluding visitors to Mexico and Canada
In 2015, for U.S. outbound tourists, sightseeing was still the most popular activity among all travel activities chosen by
81% of all U.S. tourists. In the second place and third place were shopping and activities in rural areas, accounting for
76% and 43% respectively. It also showed that U.S. tourists preferred sightseeing and rural travel.
81%
76%
43%
40%
40%
37%
32%
32%
30%
24%
21%
13%
10%
82%
77%
45%
42%
41%
39%
33%
33%
32%
25%
23%
14%
10%
71%
68%
29%
40%
28%
22%
26%
23%
22%
17%
11%
9%
6%
Sightseeing
Shopping
Small Town/ Rural Area
Cuisine
Historic Sites
Docent-guided Tours
Art Gallery / Museum
National Cultural Heritage Attractions
National Parks / Monuments
Nightclub / Dancing
Water Sports
Concert / Music Theater
Entertainment / Theme Park
Major Leisure & Recreational Activities for U.S. Outbound Tourists 2015
All U.S. Tourists Vacation/ Visiting Relatives and Friends Business & Convention
33

The Sources of Travel Advice Trusted by U.S. Outbound Tourists
Data Source: American travelers' behavioral habit in 2015
• A growing number of affluent travelers (annual household income over $ 150,000) were inclined to get travel advice
from strangers through travel review websites rather than from family members and friends.
• In addition, less affluent travelers sought advice from friends and families when searching for inspiring travel ideas.
Only 37% of them thought that the advice from friends and families was influential, down by 11% over the last year.
• 41% of affluent travelers used travel review websites to search for information, up by 7% compared to 2014.
• 53% of affluent travelers trusted travel review websites more than institutes or organizations with AAA ratings or
listed in Forbes.
• In terms of choosing destinations and travel suppliers, TripAdvisor took the lead and accounted for 87% of the total
market share.
34

U.S. Tourists’ Considerations When Choosing Travel Suppliers
Data Source: Phocuswright’s Good Travels: The Philanthropic Profile of the American Traveler
In 2015, the No.1 factor U.S. tourists considered was price when choosing travel suppliers of air tickets & hotels and
travel agencies, accounting for 59%, followed by product diversification at 48%.
Price
Diversification
Previous
Experience
35
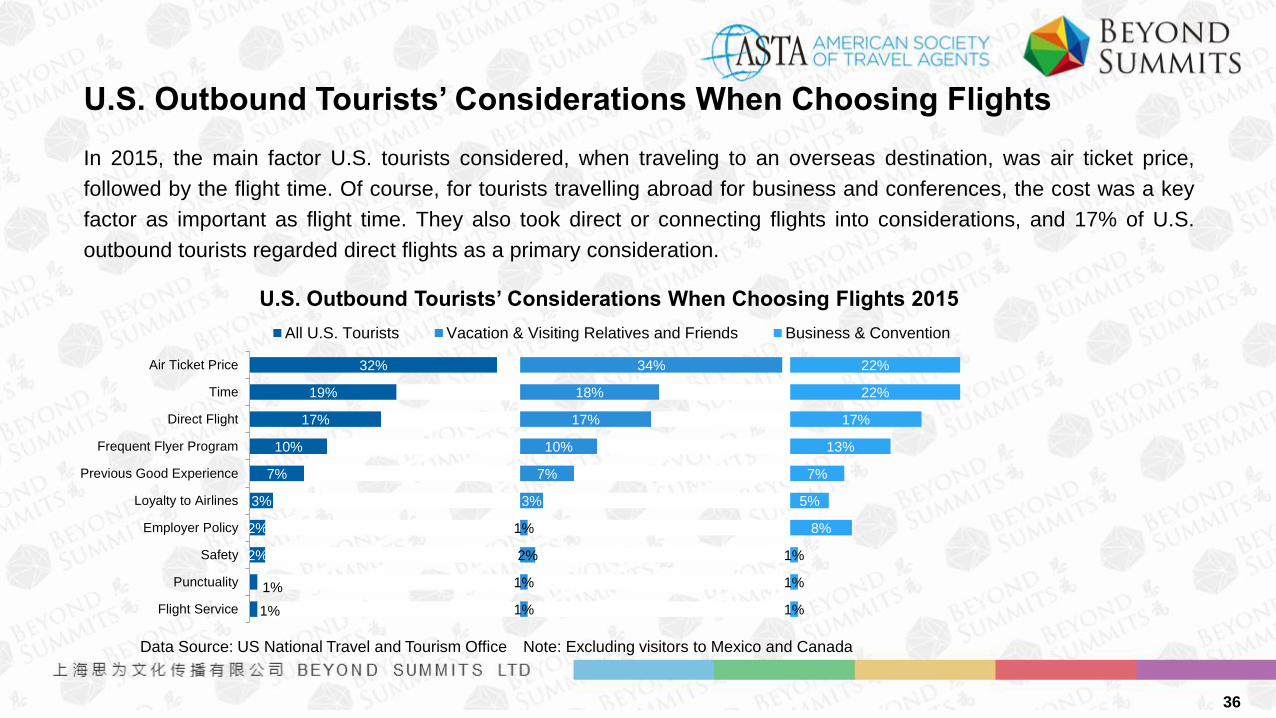
U.S. Outbound Tourists’ Considerations When Choosing Flights
Data Source: US National Travel and Tourism Office Note: Excluding visitors to Mexico and Canada
In 2015, the main factor U.S. tourists considered, when traveling to an overseas destination, was air ticket price,
followed by the flight time. Of course, for tourists travelling abroad for business and conferences, the cost was a key
factor as important as flight time. They also took direct or connecting flights into considerations, and 17% of U.S.
outbound tourists regarded direct flights as a primary consideration.
32%
19%
17%
10%
7%
3%
2%
2%
1%
1%
34%
18%
17%
10%
7%
3%
1%
2%
1%
1%
22%
22%
17%
13%
7%
5%
8%
1%
1%
1%
Air Ticket Price
Time
Direct Flight
Frequent Flyer Program
Previous Good Experience
Loyalty to Airlines
Employer Policy
Safety
Punctuality
Flight Service
U.S. Outbound Tourists’ Considerations When Choosing Flights 2015
All U.S. Tourists Vacation & Visiting Relatives and Friends Business & Convention
36

Flight Class Selected by U.S. Outbound Tourists
Data Source: US National Travel and Tourism Office Note: Excluding visitors to Mexico and Canada
In 2015, among all U.S. outbound tourists, 78% chose economic class, followed by 14% choosing senior economy
class. Tourists traveling for business and conferences were more likely to select higher class flight seats than tourists
traveling for vacations or visiting relatives/friends.
64%
80%
78%
21%
13%
14%
12%
4%
5%
4%
3%
3%
0% 10% 20% 30% 40% 50% 60% 70% 80% 90% 100%
Business &Convention
Vacation & VisitingRelatives and Friends
All U.S. Tourists
Flight Class Selected by U.S. Outbound Tourists 2015
Economic Class Senior Economy Class Business Class First Class
37

Accommodation Types of U.S. Outbound Tourists
Data Source: US National Travel and Tourism Office Note: Excluding visitors to Mexico and Canada
In 2015, 63% of all U.S. outbound tourists were in favor of hotels to accommodate themselves. For business and
MICE travelers, the proportion was even higher at 79%. Besides, 41% chose to stay in private houses. It was
noteworthy that, on average, U.S. tourists stayed almost two times longer in private houses than in hotels, which
proved that U.S. tourists would be keen on short-term house rental in recent years.
All U.S. Tourists Vacation & Visiting
Relatives and Friends
Business &
Convention
Hotel 63% 61% 79%
Average Time of Stay (Night) 9.9 8.7 9.9
Median Time of Stay (Night) 7.0 7.0 6.0
Private House 41% 45% 25%
Average Time of Stay (Night) 19.4 18.0 22.6
Median Time of Stay (Night) 12.0 12.0 10.0
Others 7% 7% 8%
Average Time of Stay (Night) 14.7 11.6 15.2
Median Time of Stay (Night) 7.0 7.0 6.0
38
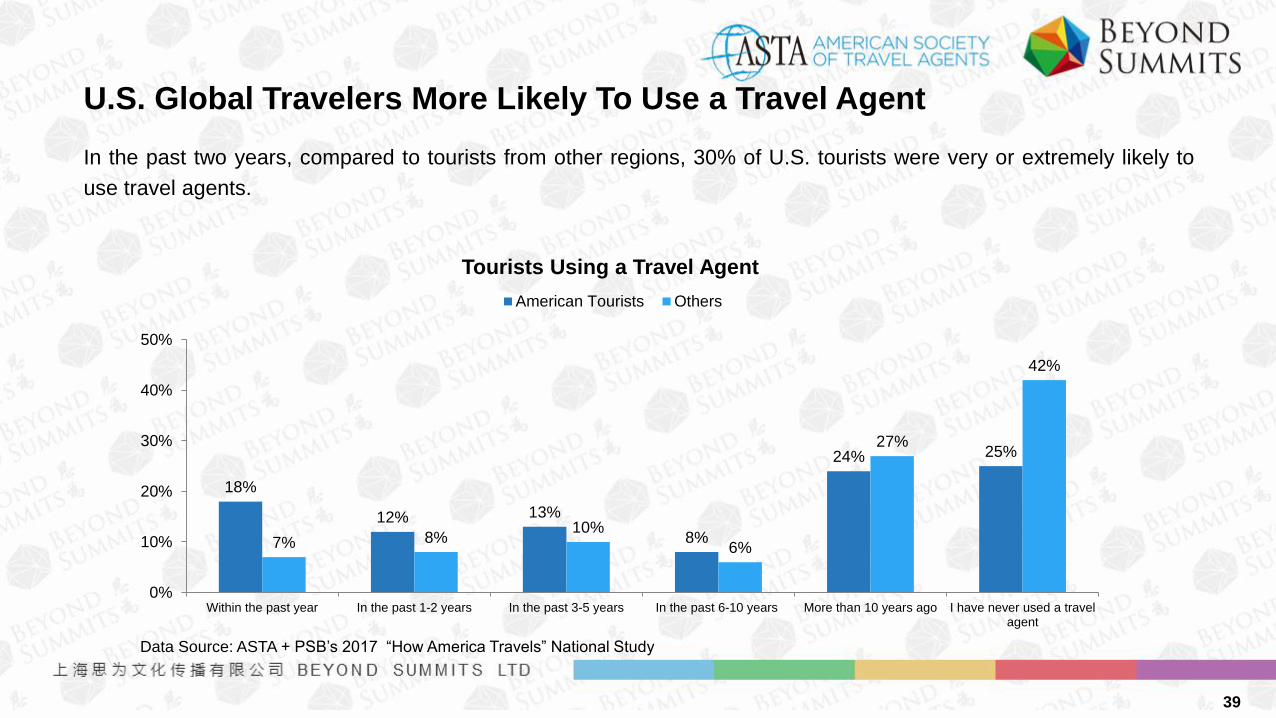
U.S. Global Travelers More Likely To Use a Travel Agent
Data Source: ASTA + PSB’s 2017 “How America Travels” National Study
In the past two years, compared to tourists from other regions, 30% of U.S. tourists were very or extremely likely to
use travel agents.
18%
12% 13%
8%
24% 25%
7% 8% 10%
6%
27%
42%
0%
10%
20%
30%
40%
50%
Within the past year In the past 1-2 years In the past 3-5 years In the past 6-10 years More than 10 years ago I have never used a travelagent
Tourists Using a Travel Agent
American Tourists Others
39

The Roles of Travel Agents on U.S. Outbound Tourism
Data Source: ASTA + PSB’s 2017 “How America Travels” National Study
U.S. tourists relied on travel agents in terms of selecting flights and hotels, booking cruises, etc.
43%
34%
29%
27%
24%
20%
20%
18%
17%
16%
Selecting flights
Selecting hotels
Booking a cruise
Recommending activities
Organizing tours
Selecting a destination
Buying travel insurance
Selecting ground transportation
Making special requests to hotels
Organizing group travel
Top 10 Roles of Travel Agents on U.S. Outbound Tourism
40

Travel Decisions & Booking Time for U.S. Outbound Tourists
Data Source: US National Travel and Tourism Office Note: Excluding visitors to Mexico and Canada
In 2015, on average, a U.S. outbound traveler made a travel decision 101.5 days ahead of the departure time and
booked air tickets 69.9 days in advance. Compared with tourists traveling for vacations or visiting relatives and friends,
business and MICE travelers tended to make a travel decision or book a flight much more earlier.
101.5 108.1
56.0
69.9 75.5
36.9
0
20
40
60
80
100
120
All U.S. Tourists Vacation & Visiting Relatives and Friends Business & Convention
Travel Decisions & Booking Time for U.S. Outbound Tourists 2015
Average Days ahead of departure (Travel decisions) Average Days ahead of departure (Air booking)
41

Payment Methods of U.S. Outbound Tourists
Data Source: US National Travel and Tourism Office Note: Excluding visitors to Mexico and Canada
In 2015, more than half of U.S. outbound tourists used credit cards for payment when shopping overseas, while 18%
used local currencies exchanged in advance.
Credit card, 56%
Cash exchanged indance,
18%
Cash withdrawn via credit card,
11%
Debit card, 9%
Cash withdrawn via debit card, 7%
Payment Methods of U.S. Outbound Tourists 2015
42

Travel Information Sources for U.S. Tourists
43

Top 10 Tourism-Related Websites in the U.S.
Data Source: SimilarWeb, 2016
1 Tripadvisor.com
2 Airbnb.com
3 Expedia.com
4 Southwest.com
5 Aa.Com
6 Kayak.com
7 Delta.com
8 United.com
9 Priceline.com
10 Booking.com
44

Information Sources for U.S. Tourists When Booking a Trip
Data Source: Destination Analyst
Based on the data released in January 2015, 50.2% of U.S. tourists would refer to User Generated Content (UGC) for
travel booking, and 43.8% would rather look for info from print materials.
50.2%
43.8%
37.0%
0%
20%
40%
60%
User Generated Content (UGC) Print Publications Social Media
Info Sources for U.S. Tourists When Booking a Trip in January 2015 (Multiple Choices)
45
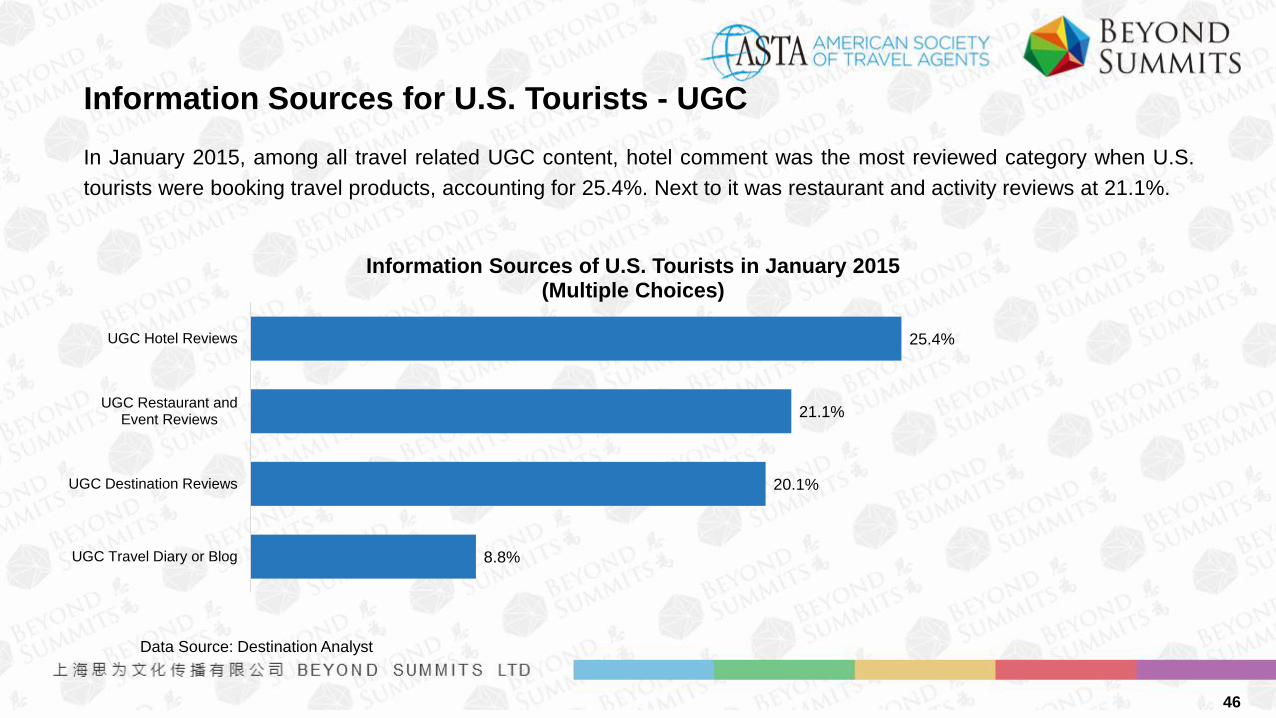
Information Sources for U.S. Tourists - UGC
Data Source: Destination Analyst
In January 2015, among all travel related UGC content, hotel comment was the most reviewed category when U.S.
tourists were booking travel products, accounting for 25.4%. Next to it was restaurant and activity reviews at 21.1%.
25.4%
21.1%
20.1%
8.8%
UGC Hotel Reviews
UGC Restaurant andEvent Reviews
UGC Destination Reviews
UGC Travel Diary or Blog
Information Sources of U.S. Tourists in January 2015 (Multiple Choices)
46
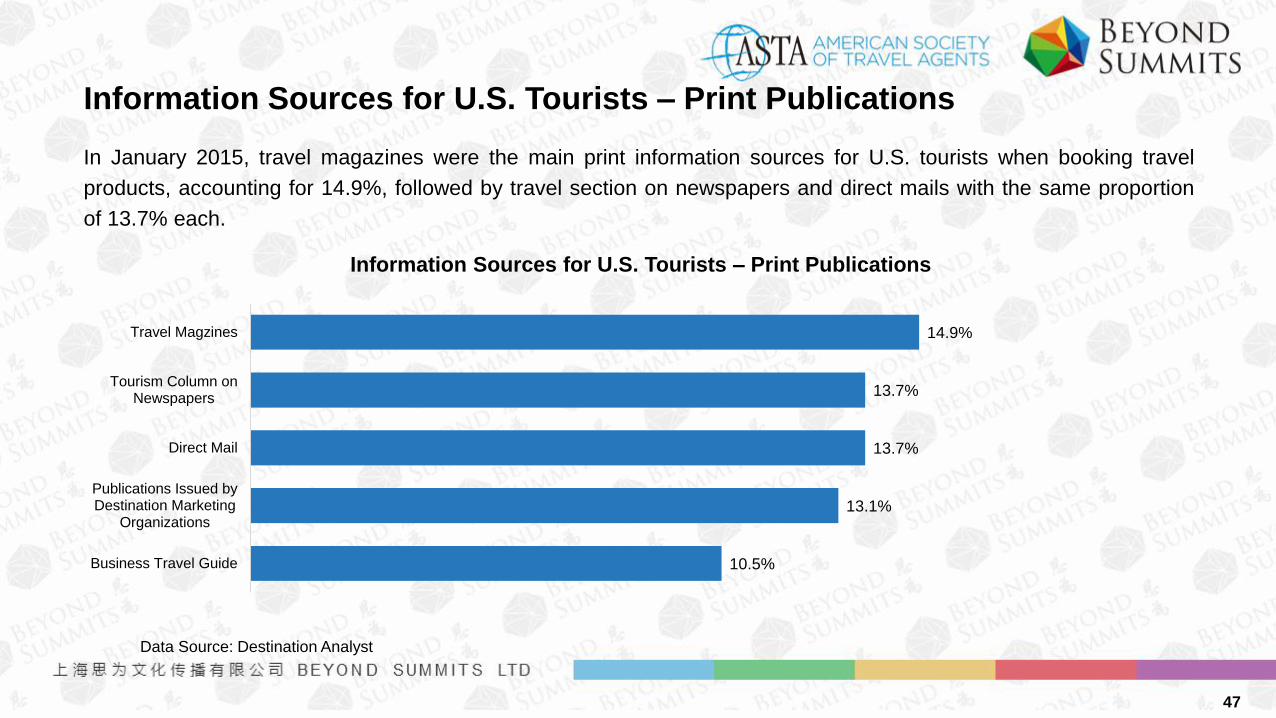
Information Sources for U.S. Tourists – Print Publications
Data Source: Destination Analyst
In January 2015, travel magazines were the main print information sources for U.S. tourists when booking travel
products, accounting for 14.9%, followed by travel section on newspapers and direct mails with the same proportion
of 13.7% each.
14.9%
13.7%
13.7%
13.1%
10.5%
Travel Magzines
Tourism Column onNewspapers
Direct Mail
Publications Issued byDestination Marketing
Organizations
Business Travel Guide
Information Sources for U.S. Tourists – Print Publications
47

Information Sources for U.S. Tourists – Social Media
Data Source: Destination Analyst
In January 2015, U.S. travelers preferred to get information from social media when booking travel products. Facebook
was the most popular social media platform. 12% of tourists followed official pages of travel destinations on social media.
Other information sources included Google +, Instagram and Twitter.
21.4%
12.0%
9.6%
7.8%
7.6%
4.2%
3.4%
Social Media Pages ofDestinations
Google+
Photo Sharing Websites
Social Bookmarking Websites
Information Sources for U.S. Tourists – Social Media 2015 (Multiple choices)
48

Information Sources for U.S. Tourists - Others
Data Source: Destination Analyst
In addition to UGC, print and social media, U.S. tourists also obtained information from map websites and preferred to
seek advice from relatives and friends.
51.5%
42.9%
37.1%
30.1%
22.5%
21.0%
12.8%
12.5%
12.3%
12.3%
4.2%
3.4%
Map Websites
Advice from Friends, Colleagues andRelatives
Travel Information Obtained through MobilePhones
Destination Marketing Agency Websites
iPad / Laptops / Desktop Computers
Group-buying Websites
Travel Related Emails or Press Releases
Online Videos
Travel Related Television Programs
Travel Agencies
Travel Related Radio Programs
Audio Files / Blogs
Information Sources for U.S. Tourists in January 2015- Others (Multiple choices)
49

Information Sources for U.S. Tourists When Booking a Trip
Data Source: ASTA + PSB’s 2017 “How America Travels” National Study
More than half of all U.S. tourists were used to getting information about a trip from travel review websites, OTA
websites or official airline websites.
52%
52%
50%
47%
45%
37%
29%
28%
23%
23%
22%
18%
17%
16%
Travel Review Websites
Booking Websites
Official Airline Websites
Official Hotel Websites
Travel Search Websites
Friends' Suggestions
Tourism Bureau Official Websites
Family Members' Suggestions
Cruise Company Official Websites
Guidebooks
Ticket Transaction Websites
Travel TV Programs
Social Media
Travel Experts
Information Sources for U.S. Tourists When Booking a Trip
50

Devices or Tools Used by U.S. Tourists to Acquire Travel Information
Data Source: Destination Analyst
According to a survey in January 2015, U.S. tourists were using different tools to acquire travel information before and
during the trip. Before the trip, especially when the tourists were planning the itinerary, desktop computers and laptops
were used by 69.9% of the tourists, taking the largest proportion. However, during a trip, a growing number of tourists
would like to get information through smart phones, tablets and the prints.
Desktop Computers/
Laptops
Tablets
Smart Phones
How U.S. Tourists Acquire Travel Information Before Trips
Desktop Computers/
Laptops
Tablets
Smart Phones
How U.S. Tourists Acquire Travel Information During Trips
51
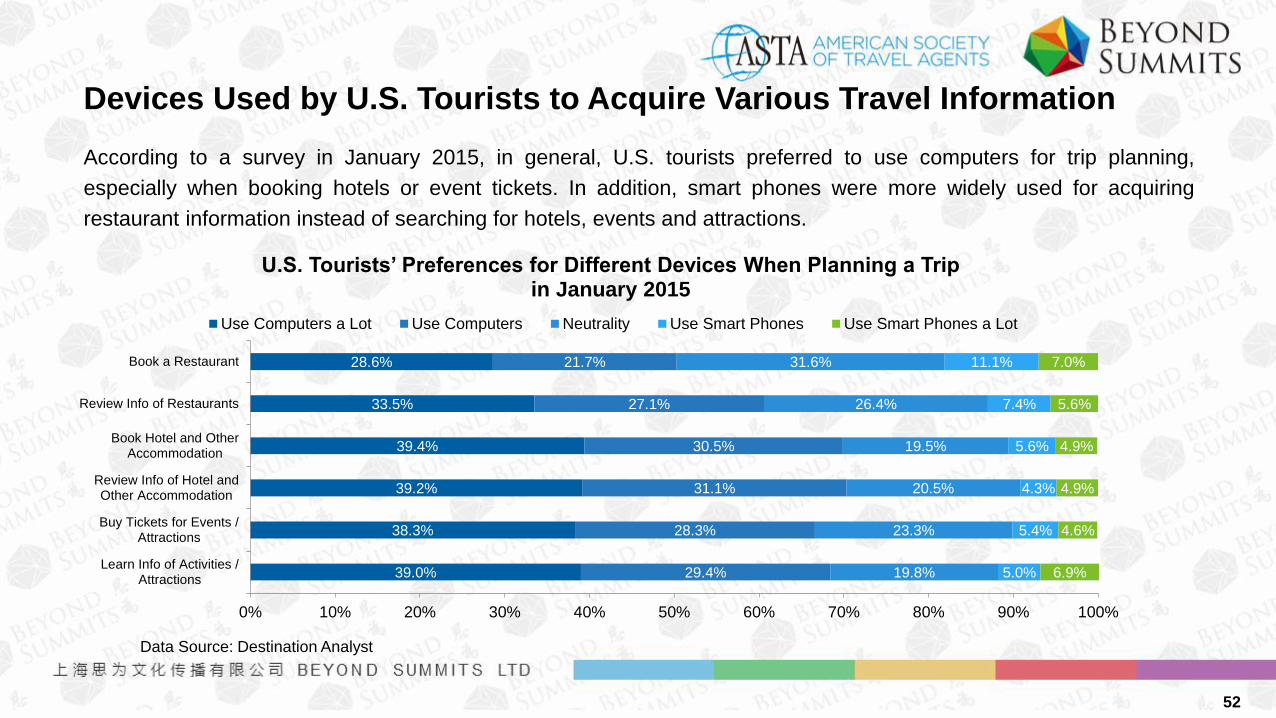
Devices Used by U.S. Tourists to Acquire Various Travel Information
Data Source: Destination Analyst
According to a survey in January 2015, in general, U.S. tourists preferred to use computers for trip planning,
especially when booking hotels or event tickets. In addition, smart phones were more widely used for acquiring
restaurant information instead of searching for hotels, events and attractions.
39.0%
38.3%
39.2%
39.4%
33.5%
28.6%
29.4%
28.3%
31.1%
30.5%
27.1%
21.7%
19.8%
23.3%
20.5%
19.5%
26.4%
31.6%
5.0%
5.4%
4.3%
5.6%
7.4%
11.1%
6.9%
4.6%
4.9%
4.9%
5.6%
7.0%
0% 10% 20% 30% 40% 50% 60% 70% 80% 90% 100%
Learn Info of Activities /Attractions
Buy Tickets for Events /Attractions
Review Info of Hotel andOther Accommodation
Book Hotel and OtherAccommodation
Review Info of Restaurants
Book a Restaurant
U.S. Tourists’ Preferences for Different Devices When Planning a Trip in January 2015
Use Computers a Lot Use Computers Neutrality Use Smart Phones Use Smart Phones a Lot
52
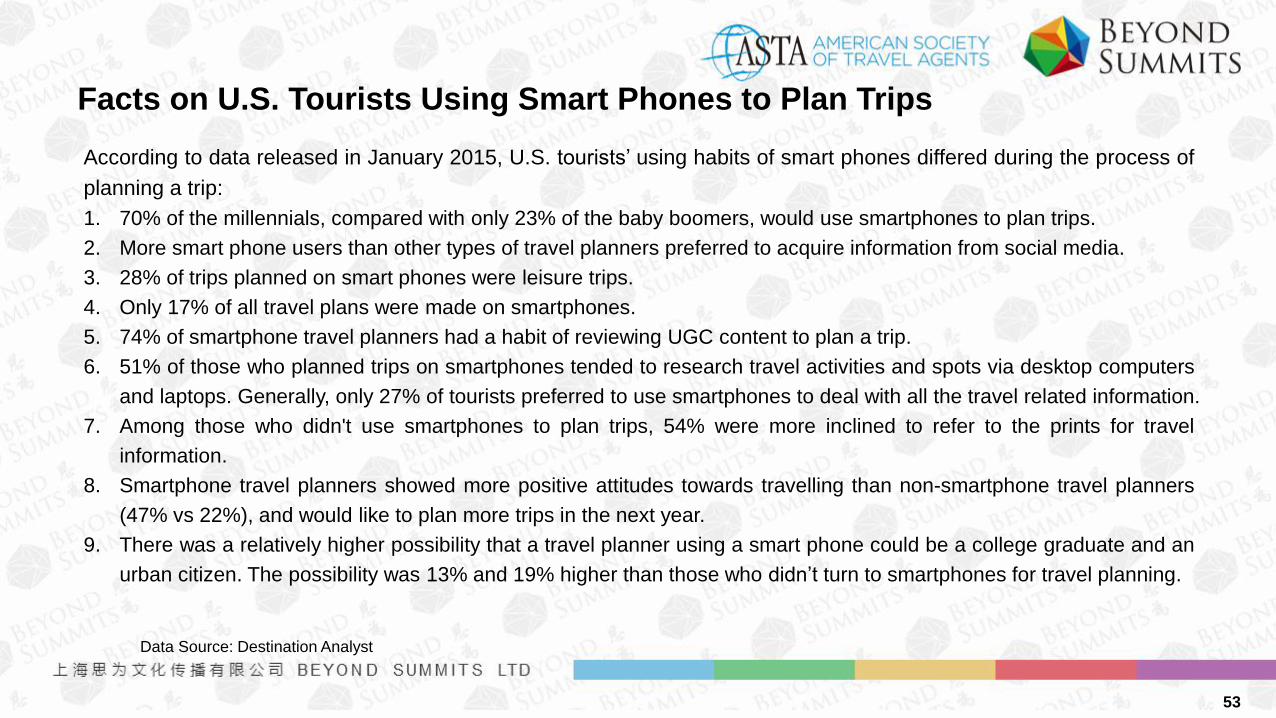
Facts on U.S. Tourists Using Smart Phones to Plan Trips
Data Source: Destination Analyst
According to data released in January 2015, U.S. tourists’ using habits of smart phones differed during the process of
planning a trip:
1. 70% of the millennials, compared with only 23% of the baby boomers, would use smartphones to plan trips.
2. More smart phone users than other types of travel planners preferred to acquire information from social media.
3. 28% of trips planned on smart phones were leisure trips.
4. Only 17% of all travel plans were made on smartphones.
5. 74% of smartphone travel planners had a habit of reviewing UGC content to plan a trip.
6. 51% of those who planned trips on smartphones tended to research travel activities and spots via desktop computers
and laptops. Generally, only 27% of tourists preferred to use smartphones to deal with all the travel related information.
7. Among those who didn't use smartphones to plan trips, 54% were more inclined to refer to the prints for travel
information.
8. Smartphone travel planners showed more positive attitudes towards travelling than non-smartphone travel planners
(47% vs 22%), and would like to plan more trips in the next year.
9. There was a relatively higher possibility that a travel planner using a smart phone could be a college graduate and an
urban citizen. The possibility was 13% and 19% higher than those who didn’t turn to smartphones for travel planning.
53
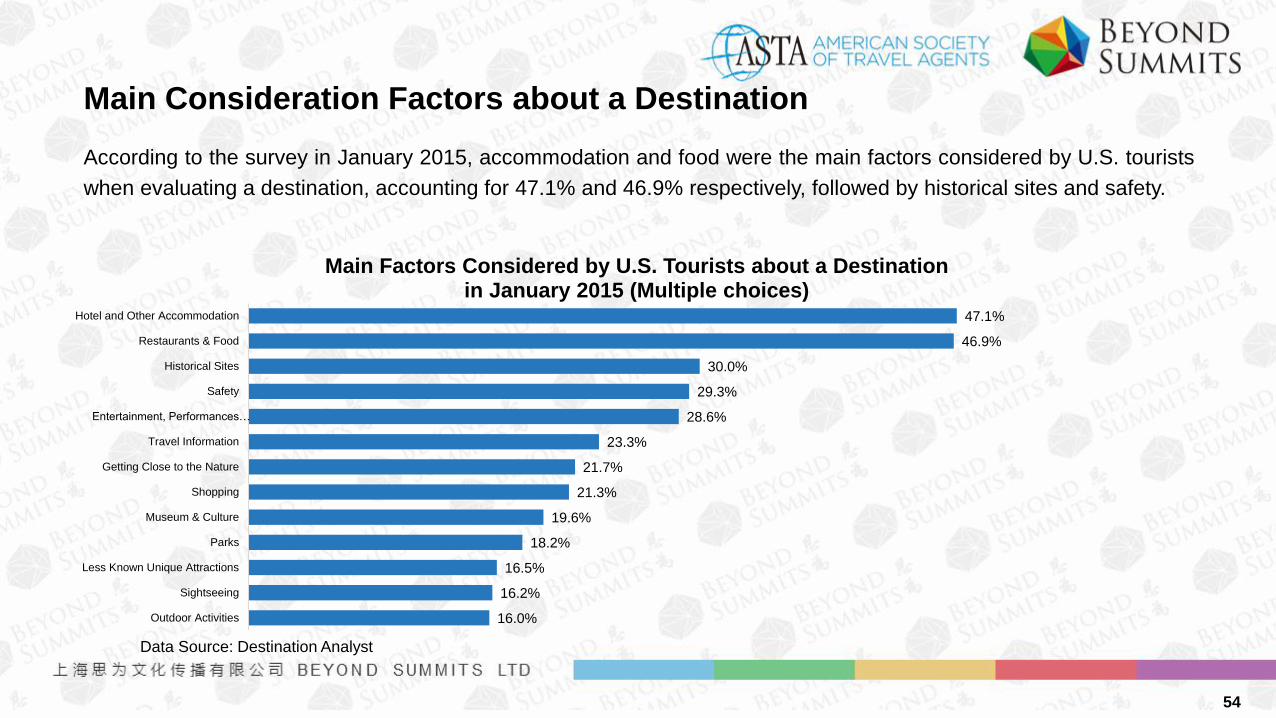
Main Consideration Factors about a Destination
Data Source: Destination Analyst
According to the survey in January 2015, accommodation and food were the main factors considered by U.S. tourists
when evaluating a destination, accounting for 47.1% and 46.9% respectively, followed by historical sites and safety.
47.1%
46.9%
30.0%
29.3%
28.6%
23.3%
21.7%
21.3%
19.6%
18.2%
16.5%
16.2%
16.0%
Hotel and Other Accommodation
Restaurants & Food
Historical Sites
Safety
Entertainment, Performances…
Travel Information
Getting Close to the Nature
Shopping
Museum & Culture
Parks
Less Known Unique Attractions
Sightseeing
Outdoor Activities
Main Factors Considered by U.S. Tourists about a Destination in January 2015 (Multiple choices)
54
U.S. Outbound Tourists Searching for and Booking Travel Products
Data Source: American Travelers' Behavioral Habit in 2015
• According to the research, OTA faced a challenge that travelers were shifting from OTAs to brand websites for
searching and booking travel products.
• In 2015, only 58% of travelers acquired travel information through OTA, much lower than the proportion of 84% in
2014.
• In terms of booking via OTA, the situation was even more severe: only 13% of the travelers who visited OTA for
information search and trip planning finally booked their trips on these OTA websites, dropping from 36%
compared to one year ago.
• People interviewed explained that they believed direct sales channels would provide them a better price (64%),
and these channels were more convenient than OTA (67%).
55

How U.S. Outbound Tourists Book Air Tickets
Data Source: US National Travel and Tourism Office Note: Excluding visitors to Mexico and Canada
In 2015, among all U.S. outbound tourists, the biggest proportion of them (39%) booked air tickets directly from
airlines, followed by those booking through online service providers and travel agents, accounting for 31% and 18%
respectively. However, for travelers for business and conferences, their air tickets were usually booked by the staff in
the dedicated travel department of their companies, taking 40% of the total.
39%
31%
18%
9%
7%
3%
40%
34%
19%
4%
7%
3%
30%
20%
13%
40%
2%
2%
Book Directly Through Airlines
Online Booking Service
Travel Agencies
Business Travel Departments
Tour Operators / Clubs
Others
US Outbound Tourists’ Ways of Booking Air Tickets 2015 (Multiple Choices)
All U.S. Tourists Vacation & Visiting Relatives and Friends Business & Convention
56
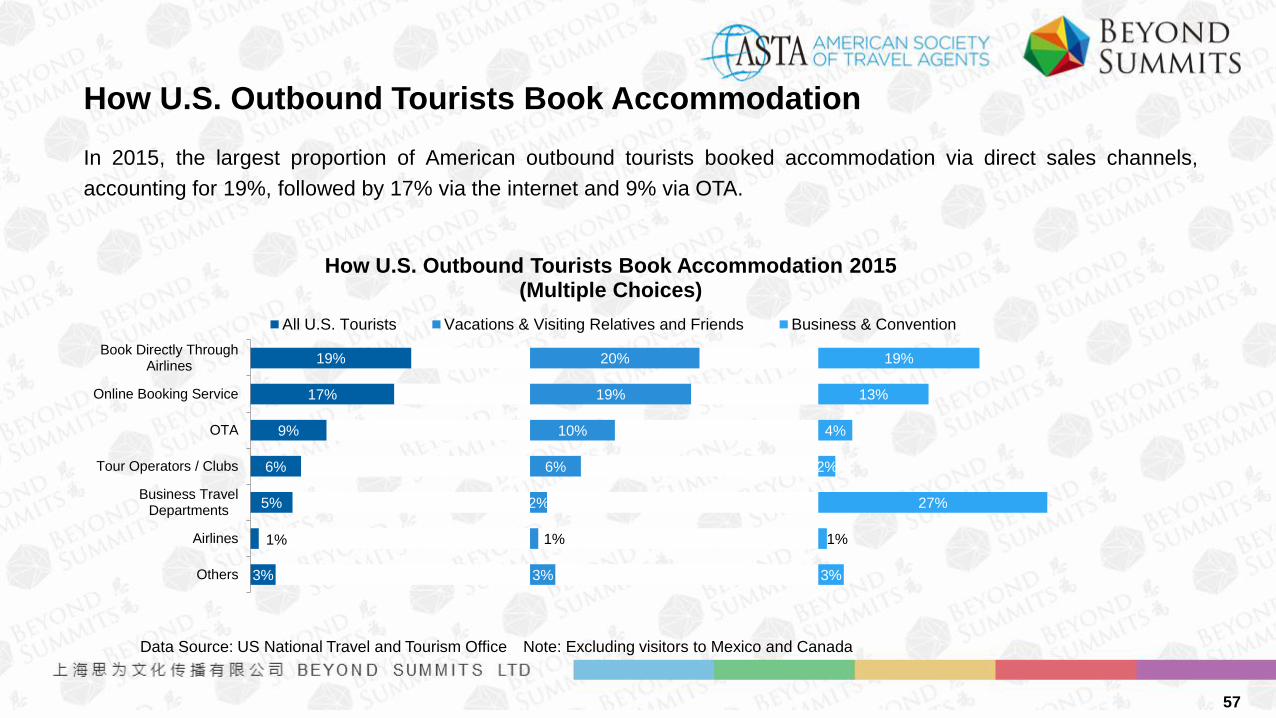
How U.S. Outbound Tourists Book Accommodation
Data Source: US National Travel and Tourism Office Note: Excluding visitors to Mexico and Canada
In 2015, the largest proportion of American outbound tourists booked accommodation via direct sales channels,
accounting for 19%, followed by 17% via the internet and 9% via OTA.
19%
17%
9%
6%
5%
1%
3%
20%
19%
10%
6%
2%
1%
3%
19%
13%
4%
2%
27%
1%
3%
Book Directly ThroughAirlines
Online Booking Service
OTA
Tour Operators / Clubs
Business TravelDepartments
Airlines
Others
How U.S. Outbound Tourists Book Accommodation 2015 (Multiple Choices)
All U.S. Tourists Vacations & Visiting Relatives and Friends Business & Convention
57

How U.S. Outbound Tourists Get Information about Air Tickets
Data Source: US National Travel and Tourism Office Note: Excluding visitors to Mexico and Canada
In 2015, 52% of U.S. outbound tourists received air ticket information from airlines, followed by 32% from OTA and
20% from friends’ recommendations.
52%
32%
20%
17%
9%
8%
7%
4%
53%
35%
22%
17%
4%
8%
8%
4%
48%
32%
11%
13%
40%
3%
4%
3%
Airlines
OTA
Friends' Recommendations
Offline Travel Agencies
Travel Department
Tour Operators / Clubs
Tour Guides
Travel Bureaus
How U.S. Outbound Tourists Get Information about Air Tickets 2015 (Multiple Choices)
All U.S. Tourists Vacation & Visiting Relatives and Friends Business & Convention
58

China Tourism Market Overview on U.S. Tourists to China/Guizhou/Guiyang
59

U.S. Tourists’ Willingness About China’s Scenic Spots
Data Source:2014年美国来华旅游舆情调查报告
Among all the popular scenic spots in China, 6.9% of U.S. tourists were willing to visit the Huangguoshu Waterfall.
73.3%
44.9%
20.0%
16.5%
15.3%
14.5%
13.1%
11.0%
10.4%
9.6%
7.3%
7.3%
7.3%
6.9%
6.9%
6.7%
6.5%
6.5%
6.1%
5.3%
The Great Wall
The Forbidden City
The Temple of Heaven
Terra-Cotta Warriors
The Summer Palace
the Ming Tombs
Shaolin Monastery
Chongqing Dazu Cliff Rock Carvings
The Three Gorges
Ancient City of Ping Yao
The Panda Base in Sichuan
Phoenix Town
Suzhou Gardens
West Lake
The Huangguoshu Waterfall
Changbai Mountains
Temple of Confucius, Qufu
Lijiang River in Guilin
Mount Tai
Wudang Mountains
U.S. Tourists’ Travel Willingness about Scenic Spots in China
60

U.S. Tourists’ Positive Impression on China’s Tourism Resources
Data Source: ASTA + PSB’s 2017 “How America Travels” National Study
For U.S. tourists, what impressed them most are China’s long history, rich culture as well as scenic spots and
historical sites.
80.5%
74.7%
44.0%
41.5%
35.7%
29.5%
13.7%
10.8%
10.4%
History
Culture
Natural Landscape
Architecture
Panda
Food
Modern Facilities
Social Development
Business Opportunies
U.S. Tourists’ Positive Impression on China’s Tourism Resources
61

Most Popular Topics of U.S. Tourists to China on Social Media
Data Source:传奇智旅,社交媒体大数据预测美国来华游客前景,2011.3-2016.3
For U.S. tourists visiting China, their most popular topics on social media were tour & sight seeing (22%) and cities &
scenic spots (16%). And the top attractions for them were Panda, the Forbidden City and Terra-Cotta Warriors.
22%
16%
11%
11%
10%
8%
7%
6%
5%
4%
Tour & Sightseeing
Cities & Scenic Spots
Panda
Beijing
Accommodation & Hotels
Tour Guide
Food and Drink
Shanghai
The Forbidden City
History
Most Popular Topics of U.S. Tourists to China on Social Media
62

Channels for U.S. Tourists to Acquire Travel Information about China
Data Source:传奇智旅,社交媒体大数据预测美国来华游客前景,2011.3-2016.3
31% of U.S. tourists acquired travel information about China via Trip Advisor, which was the Top 1 information channel.
Besides, the traditional media of TV/Broadcasting also played an important role with a proportion of 31%.
31%
31%
9%
9%
6%
4%
3%
2%
1%
1%
1%
TripAdvisor
TV/Broadcasting
Travel Agency
OTA
YouTube
U.S. Tourists’ Information Channels about China Tourism
134

European & U.S. Tourists to Guizhou & China
Data Source:中国旅游统计年鉴,中国国家旅游局
The data of 2010-2015 showed that among the four countries of the U.S., the U.K., France and Germany, tourists
from the U.K. and France are more likely to travel to Guizhou. In 2015, U.S. tourists to Guizhou accounted for 1.5% of
all U.S. tourists to China.
1.2%
1.5%
2.0% 1.8%
1.6% 1.5%
2.2%
2.7%
3.5%
3.0% 2.9%
3.1%
1.1% 1.3%
1.7%
1.5% 1.5% 1.7%
2.0%
2.7%
3.4%
4.0%
0.0%
1.5%
3.0%
4.5%
2010 2011 2012 2013 2014 2015
European & U.S. Tourists - To Guizhou Against To China 2010-2015
US UK German France
64

U.S. – 2nd Biggest Source Country of Oversea Tourists to Guizhou
Data Source:贵州省统计局
In 2016, the U.S. was the 2nd biggest source country of oversea tourists to Guizhou with a total number of 54,568,
increasing largely by 32.2% compared to last year.
0
10,000
20,000
30,000
40,000
50,000
60,000
70,000
South Korea U.S. Japan France U.K. Singapore Malaysia Canada Russia Germany
TOP 10 Source Countries of Oversea Tourists to Guizhou 2016(Number of Visits)
65

U.S. – No. 1 Source Country of Oversea Tourists (Online) to Guiyang
Data Source:携程,2017年贵阳旅游大数据报告
In 2016 Guiyang saw a rapid development of online inbound tourism. The oversea tourists booking via online
channels to Guiyang grew by 17% compared to last year with the U.S. being the No. 1 source country.
U.S. South Korea Taiwan, China Canana U.K. Japan Singapore France Hongkong, China Australia
TOP 10 Source Countries/Areas of Oversea Tourists to Guiyang (Online) 2016
66

U.S. – No. 1 Source Country of Overnight Oversea Visitors to Guiyang
Data Source:中国旅游统计年鉴
In 2015, U.S. ranked TOP1 in terms of the total number of overnight oversea visitors to Guiyang, accounting for 7.1%
of all overnight oversea visitors to Guiyang.
U.S., 7.1%
South Korea, 6.7% Japan, 5.8%
Canada, 4.8%
U.K., 4.6%
Singapore, 4.0%
Germany, 4.0%
France, 3.9%
Australia, 3.5%
Others, 55.7%
Overnight Oversea Visitors to Guiyang by Country 2015
67
ACS 2017 Will Greatly Boost the Inbound Tourism of Guiyang
ASTA China Summit 2017 (ACS 2017) will greatly boost the inbound tourism of Guiyang, Guizhou. A promising rising
trend is clearly foreseen based on the historical data from American Society of Travel Agents (ASTA).
• In the destination promotion events organized by ASTA, 98% participants were willing to cooperate with new
suppliers and book relevant products in the future;
• Among the participants attending the destination promotion events organized by ASTA, 94% of them tended to
recommend the event to another organization;
• Among the participants attending the destination promotion events organized by ASTA, over half of them declared
that the sales volume of their travel products of the relevant destinations had increased as a result;
• Participants were exposed to the promotion info of various sponsors on site and had face-to-face talks with
representatives from different companies. As a result, 76% of all the participants were willing to further develop
business cooperation with the sponsors of the events;
• ASTA events brought great experience to the participants with 77% of them expecting to send more clients to the
relevant destinations in the future.
By leveraging trade meetings, marketing and promotion activities and communication mechanism set up during ACS
2017, Guiyang, Guizhou is expected to be a new growth point of North-American inbound tourists to China.
68