Embed Size (px)
Citation preview

23052 Alicia Pkwy #609, Mission Viejo, CA 92692 NSSGA Aggregates Forecast 2016-20
1
US National & State Aggregates Forecast 2015-2020
January 11, 2016

23052 Alicia Pkwy #609, Mission Viejo, CA 92692 NSSGA Aggregates Forecast 2016-20
2
Table of Contents
x Executive Summary
x Note on the FAST Highway Bill
x Alternative Economic Scenarios 2016-2020
9 Baseline Assumptions 9 Steady-State Assumptions
x Aggregates Demand Forecasts 9 Baseline Outlook 9 Steady-State Outlook
x Excel Data Backup File [Attached Separately]

23052 Alicia Pkwy #609, Mission Viejo, CA 92692 NSSGA Aggregates Forecast 2016-20
3
NSSGA Aggregates Forecast for 2016 – 2020
Executive Summary After steady recovery in US aggregates consumption over the years 2011 to 2015, following the Great Recession, SC-MA projects an additional year of good growth in 2016. Thereafter, we consider two alternative paths for the economy and aggregates demand. In the “Baseline Scenario” a mild 2-year cyclical slowdown negatively impacts demand in 2017 & 2018. For aggregates producers the expected pullback will be cushioned somewhat by the recently announced FAST Act and, at its projected low point in 2018, average US consumption will only have dropped to approximately the average for 2014 & 2015. In subsequent years, the economy, construction activity and aggregates consumption in turn, are projected to embark on a more traditionally solid growth path. SC-MA estimates the probability of this scenario to be 65%. Under the alternate “Steady-State Scenario” which carries a roughly 35% probability, the economy, construction spending and aggregates demand continue to grow slowly but steadily at 2.0% per annum throughout the 5-year forecast horizon.
Millions Metric Tons
2015 2016 2017 2018 2019 2020 2016-2020 Total
Total Impact of FAST n/a 26 31 41 14 2 114
% Increase Above
Baseline n/a 1.1% 1.4% 1.9% 0.6% 0.1% 1.0%
2631
41
142
2014 2015 2016 2017 2018 2019 2020
Impact of FASTon Total Aggregates Demand

23052 Alicia Pkwy #609, Mission Viejo, CA 92692 NSSGA Aggregates Forecast 2016-20
4
A Note on the FAST Act
Key Takeaway: The President’s signing of the FAST Act on December 4, 2015 marked the first time in 10 years that a long term surface transportation funding program had been enacted. As such, it marked a major victory for the highway construction industry and its suppliers who had been operating under a prolonged period of uncertainty. The Act’s most meaningful, lasting effect on U.S. highway construction activity is the stability it provides to states and the private sector over its 5-year term.
The FAST Act authorizes $305 billion over fiscal years 2016 to 2020, including $225.2 billion for highways and $48.7 billion for transit. In FY 2016, the law provides an increase of 5.1 percent ($2.1 billion) for highway spending, which then continues to grow at 2.1 to 2.4 percent per year through FY 2020.
The FAST Act makes further significant strides in trying to streamline the approval process for major projects – especially in federal / state environmental review overlaps – and shorten project timelines. It also continues nearly all of the highway and transit formula programs of MAP-21, while focusing increased funding on two new freight programs, one formula-based and one discretionary. The nominal change in federal highway funding for the final three years covered by FAST is somewhat higher than the projected rate of inflation though less than the strong boost included for FY’s 2016 and 2017. However, the benefits to the highway construction market from the strong increase in the first two years extends over the full 5-year period due to:
a) The lagged effect of highway spending on projects that frequently extend over long time periods and,
b) The higher degree of certainty and confidence arising from having a 5-year program in place instead of the temporary patchwork since the expiry of MAP-21.
SC-MA’s analysis of the historical relationship between highway spending and aggregates consumption suggests a $1 billion increase in spending typically results in incremental aggregates demand of 12-15 million metric tons. It is important to note however that there can be fairly wide variation around this rule of thumb based on project location and other project parameters.

23052 Alicia Pkwy #609, Mission Viejo, CA 92692 NSSGA Aggregates Forecast 2016-20
5
Alternative Economic Scenarios 2016-2020 Key Takeaway: Two distinct economic scenarios are considered for the 2016-2020 period which more or less encompass the current consensus outlook for the period. Under SC-MA’s “Baseline” Scenario, a mild cyclical downturn occurs in 2017-18 followed by a return to higher trend GDP growth in the 2.5% / annum range. Under our “Steady-State” Scenario, the gradual 2.0% trend growth rate of the past 4 years continues through 2020. (a) Baseline U.S. Economic Scenario 2016 - 2020 Key Takeaway: The painfully sluggish recovery from the Great Recession officially comes to an end in late 2017 as higher interest rates and an election hangover cause a mild downturn before a more normal recovery takes hold early in 2019. Overall Economic Growth Context
1. Moderate economic grow continues throughout 2016. 2. Slowing begins in 2017 and continues through 2018.
a. Causes of the slowdown include: b. Rising interest rates. While increases will be moderate it will still be a big
adjustment for companies and homebuyers. c. Rising home prices and flat household wealth among first-time-buyers, keeps a
lid on home sales. d. Profits decline due to lower exports from a strong dollar and slowing in China &
Europe. Flat/declining corporate profits in 2017-2018 decrease capital spending. e. China and Europe both continue slowing as costs rise in China and Europe deals
with maintaining the Euro and absorbing new immigrants. f. Mall vacancies rise slowing retail investment as online shopping gains continue. g. Office investment slows then declines in 2017-19 as full time employment gains
slow and businesses continue to decrease sq.ft. per worker to save money. h. Innovation, while good in long run, disrupts labor demand more than it helps in
short run; i.e. more automation in fast food restaurants and health care. Minor impact 2015-2017, picks up steam 2018+.
i. Government spending slows by 2018 as interest rate increases re-awaken concern about $20Trillion of Federal debt and the rising debt service payments (from about $250B/yr to $400+B/yr and rising).
j. Continued uncertainty about corporate tax policies keep corporate capital investments below norm as a percent of profits.
3. Implications for construction spending and aggregates demand: a. Construction does well in 2016 as all segments increase. b. Residential does well in 2016 but experiences modest declines for 2017-18 due
to higher mortgage rates, higher home prices and flat 1st time buyer wealth.

23052 Alicia Pkwy #609, Mission Viejo, CA 92692 NSSGA Aggregates Forecast 2016-20
6
c. Nonresidential goes up for two years 2016-17 as the economy keeps growing and financing becomes more plentiful, even if at slightly higher rates. A decline hits in 2018 as employment growth approaches zero and corporate profits decline for a second year.
d. No building increases in nicely in 2016 due to FAST and higher state and local budget spending. A 3-year decline begins in 2017 as more money is shifted away from infrastructure work at the state and local level and towards pensions and health care spending.
(b) Steady-State U.S. Economic Scenario 2016 - 2020 Key Takeaway: The sluggish recovery from the Great Recession avoids the general overheating of a traditional cyclical economic recovery and, instead of a mild recession, the slow but steady growth of the past four years continues uninterrupted through 2020. Overall Economic Growth Context
1. The U.S. has been averaging close to 2% growth per year for the past four years. 2. This scenario extends this growth for another 5 years and keeps the ratio of
construction/GDP steady, thereby resulting in a 2%/year growth in aggregates consumption.
3. The variation in forecasted demand arising from the FAST Act is highly concentrated in the Non-Building segment in which highway spending is the major component.
4. The impact begins building in 2016 and the incremental impact reaches a maximum in 2018 exactly as it does under the Baseline Scenario.
5. In 2018 the FAST act adds about 41 million MTons to demand or 2%. 6. By 2020 in impact is very minor as expected inflationary price increases reduce the
purchasing power of the additional funds allocated to highway spending. 7. The out years of 2019-2020 are not fully funded in the FAST Act. Therefore, there is
some small uncertainty as to where the funds to sustain the new higher spending promise will be found.

23052 Alicia Pkwy #609, Mission Viejo, CA 92692 NSSGA Aggregates Forecast 2016-20
7
Baseline Aggregates Demand Forecast: National Picture Key Takeaway: New federal highway spending under the FAST Act brings predictability to project planning and a modest increase in aggregates demand during the 2016-2020 period compared to our previous Baseline forecast scenario prepared in October 2015.
The aggregates outlook in the FAST scenario is for solid gains in demand in 2016, followed by modest declines in 2017-2019 as the economy slows. The economic slowdown is caused by higher interest rates, a slowing China and Europe and low energy prices hurting a few states more than it helps the non-energy states. Non-building will be hurt not only by the economic slowdown and its impact on state and local budgets, but also by the increasing necessity to spend any extra money on pension fund replenishment. Almost all of the variation observed between SC-MA`s two forecast scenarios is directly due to higher FAST spending. There are other minor impacts as well; the total Federal budget for FY2016 looks to be modestly higher than we thought six months ago. In addition, the slightly higher spending and slightly faster 2016 economic growth add a proportionally small increase to interest rates (which we already had rising modestly). The impact of FAST on projected consumption reaches its maximum in 2018 when it lifts aggregates demand by 41 million MTons. (+2%) compared to our previous Baseline.
1,800
1,900
2,000
2,100
2,200
2,300
2,400
2,500
2,600
2014 2015 2016 2017 2018 2019 2020
Mill
ions
of
MTo
ns
AGGREGATES OUTLOOK - TOTALBASELINE vs FAST
BASELINE
FAST
Year 2014 2015 2016 2017 2018 2019 2020FAST Scenario Total 2,189 2,284 2,364 2,260 2,211 2,212 2,282
Yr/Yr %Change 4.3% 3.5% -4.4% -2.2% 0.0% 3.2%FAST Volume Impact - - 26 31 41 14 2
23052 Alicia Pkwy #609, Mission Viejo, CA 92692 NSSGA Aggregates Forecast 2016-20
8
These indirect effects add to aggregates used for residential building in 2016 before leading to a small negative impact beyond 2017.
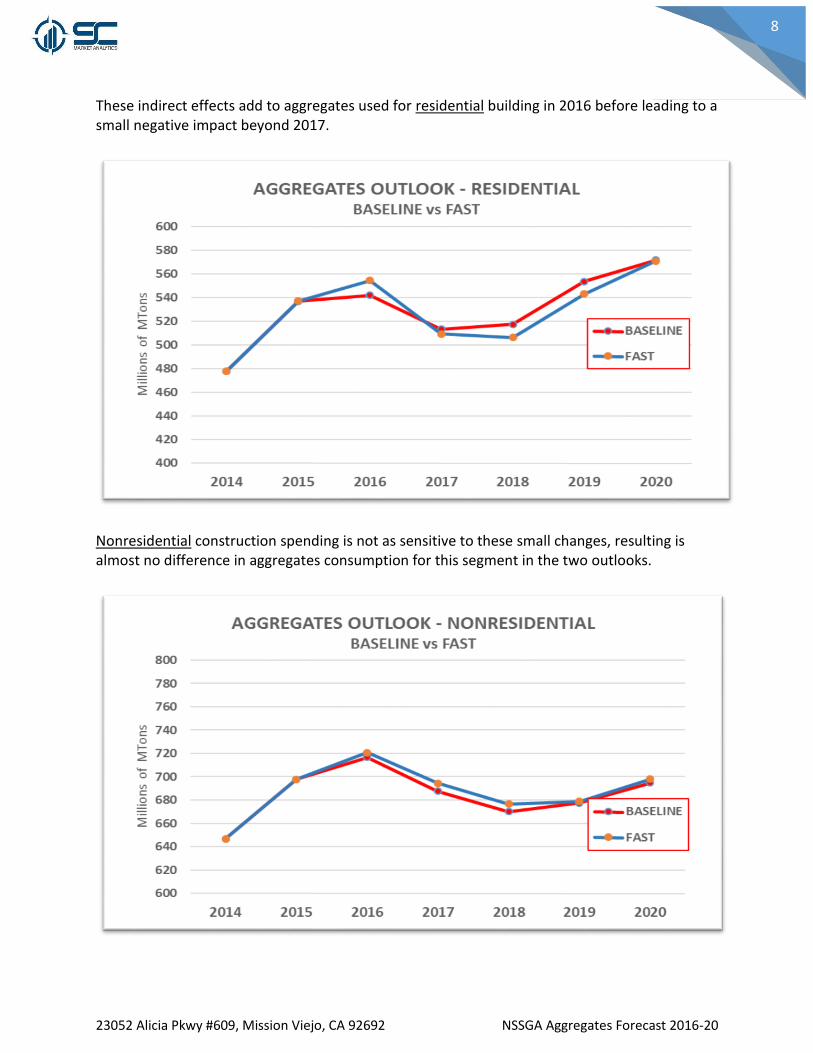
Nonresidential construction spending is not as sensitive to these small changes, resulting is almost no difference in aggregates consumption for this segment in the two outlooks.

23052 Alicia Pkwy #609, Mission Viejo, CA 92692 NSSGA Aggregates Forecast 2016-20
9
The FAST legislation adds about 45 million M Tons to non-building consumption in 2018, its maximum impact year.

23052 Alicia Pkwy #609, Mission Viejo, CA 92692 NSSGA Aggregates Forecast 2016-20
10
Baseline Aggregates Demand Forecast: State Level Demand Key Takeaway: As usual the picture at a state level can look much different and for 2016-2020, the Southeast, West, Mountain and parts of the Northeast regions fare the best while some of the fracking boom states experience a more pronounced correction.

23052 Alicia Pkwy #609, Mission Viejo, CA 92692 NSSGA Aggregates Forecast 2016-20
11

23052 Alicia Pkwy #609, Mission Viejo, CA 92692 NSSGA Aggregates Forecast 2016-20
12
Steady-State Aggregates Demand Forecast: National Picture Key Takeaway: New federal highway spending under the FAST Act brings predictability to project planning and a modest increase in aggregates demand during the 2016-2020 period compared to our earlier forecasts.
Millions Metric Tons
2015 2016 2017 2018 2019 2020 2016-2020 Total
Total Impact of FAST n/a 26 31 41 14 2 114
% Increase Above
Baseline n/a 1.1% 1.4% 1.9% 0.6% 0.1% 1.0% Almost all of the variation observed between SC-MA`s two Steady-State forecast scenarios is directly due to higher FAST spending. There are other minor impacts as well; the total Federal budget for FY2016 looks to be modestly higher than we thought six months ago. In addition, the slightly higher spending and slightly faster 2016 economic growth add a proportionally small increase to interest rates (which we already had rising modestly). The impact of FAST on projected consumption reaches its maximum in 2018 when it lifts aggregates demand by 41 million MTons. (+2%) compared to our earlier forecast.
2,000
2,100
2,200
2,300
2,400
2,500
2,600
2014 2015 2016 2017 2018 2019 2020
Mill
ions
of
MTo
ns
AGGREGATES OUTLOOK - TOTALSTEADY STATE vs FAST
STEADY STATE
FAST

23052 Alicia Pkwy #609, Mission Viejo, CA 92692 NSSGA Aggregates Forecast 2016-20
13
These indirect effects add to aggregates used for residential building in 2016 before leading to a small negative impact beyond 2017.
Nonresidential construction spending is not as sensitive to these small changes, resulting is almost no difference in aggregates consumption for this segment in the two outlooks.
400
450
500
550
600
650
2014 2015 2016 2017 2018 2019 2020
Mill
ions
of
MTo
ns
AGGREGATES OUTLOOK - RESIDENTIALSTEADY STATE vs FAST
STEADY STATE
FAST
600
620
640
660
680
700
720
740
760
780
800
2014 2015 2016 2017 2018 2019 2020
Mill
ions
of
MTo
ns
AGGREGATES OUTLOOK - NONRESIDENTIALSTEADY STATE vs FAST
STEADY STATE
FAST

23052 Alicia Pkwy #609, Mission Viejo, CA 92692 NSSGA Aggregates Forecast 2016-20
14
The FAST legislation adds about 45 million M Tons to non-building consumption in 2018, its maximum impact year.
Steady-State Aggregates Demand Forecast: State Level Demand Key Takeaway: As with the national picture for 2016-2020, State level demand also grows steadily under this scenario at the historic ratio of individual state growth rates to the national average.
-------------------------------------------------- The forecasts contained in this document are the property of SC Market Analytics. They are provided for information purposes only and are subject to risks, uncertainties, and assumptions. Many factors could cause actual results to be materially different from those expressed in this document, including, among others, changes in general economic, political, governmental conditions and changes in the economies other countries. Should one or more of these risks or uncertainties materialize, or underlying assumptions prove incorrect, actual results may vary materially from those described herein. SC-MA updates its forecasts for regular subscribers at least quarterly with the latest version always superseding all previous versions.