Embed Size (px)
Citation preview

Can the Good Times Keep Rolling?
Rent Growth Slows, But Tops Long-Term Average
Occupancies Remain Near All-Time Highs
Investors Bullish, Despite Capital Market Uncertainties
U.S. Multifamily OutlookU.S. Multifamily OutlookWinter 2017Winter 2017

2
Market AnalysisWinter 2017
Contacts
Jeff Adler
Vice President & General Manager of Yardi Matrix [email protected] (800) 866-1124 x2403
Jack Kern Director of Research and Publications [email protected] (800) 866-1124 x2444
Paul Fiorilla
Associate Director of Research [email protected] (800) 866-1124 x5764
Chris Nebenzahl Senior Analyst [email protected] (800) 866-1124 x2200
Multifamily Outpaces Economy
The multifamily market has seen phenomenal growth in rents and property values for several years. Can the good times continue to roll in 2017?
We think they can, though the rate of rent increases is going to slow down, transaction yields have likely bottomed and oversupply is going to negatively impact some locales. However, we expect that the multifamily market in most metros will continue to enjoy positive fundamentals. Demand for units will remain strong, even if the growing amount of supply pushes occupancy rates down slightly.
Economic Growth, with Caveats: The new administration and Congress are expected to inject some stimulus into the economy in the form of tax cuts, infrastructure spending and reduction of regulations on business. That brings with it prospects for an improvement upon the moderate growth the U.S. economy has produced for the last several years. However, potential headwinds include the possibility of tariffs or focus on unproductive policies such as deportation.
Rents Continue to Moderate: The slowdown in rent growth from frothy 2015 levels should persist. Deceleration will be pronounced in metros that had unsustainable double-digit increases and those where supply, affordability issues or weakening employment growth will put pressure on rent gains. Even so, we expect national rent increases to be just under 4%, which is above the historical trend of 2.3% and a signal that the market is healthy overall.
Heavy Supply in Some Metros: 2017 is expected to be another strong year for supply, with 320,000 units scheduled to come online, up 5.3% from 2016. The pipeline could begin to diminish slightly in future years, as construction financing becomes harder to find due to higher capital charges and regulator pressure on banks to be less aggressive. The impact of new supply will vary by metro.
Questions About Capital: The capital markets have been friendly to the sector for years, and that should continue in 2017, although cracks may start to appear. Multifamily is still generally viewed as a safe investment with good prospects, but some investors are beginning to hold back due to concerns about interest rate increases when acquisition yields are at historical lows. The debt markets remain stable, although GSE reform is looming in the background.
Cover image by wsfurlan/iStockphoto.com
National Outlook 2017

Matrix National | Winter 2017 3
The U.S. economy picked up in the second half of 2016, with ongoing gains in employment and strong GDP growth. Other key metrics—such as manufacturing, inflation and retail sales—also showed strength, which bodes well for economic growth and commercial real estate fundamentals in 2017.
Though the prospects for moderate growth have not changed much from our last outlook, 2017 promises to be anything but just another year. The surprise election of Donald Trump as president, working with a Republican Congress, promises to bring swift and extreme changes in economic policy and regulations. After the initial shock of Trump’s upset wore off, the financial markets grew optimistic about the prospects for growth, although details of many policies remain unclear.
As a result of the improved forecast for near-term growth, key equity indices—including the Dow Jones Industrial Average, NASDAQ and S&P 500—reached all-time highs in the few weeks following the election. Markets are optimistic about pro-growth policies centered around lower taxes, fewer regulations, more domestic production and increased infrastructure spending. Key officials have promised immediate reductions to government regulations, especially in the banking and energy sectors, which could jumpstart growth and put upward pressure on prices in the short term. Lending has been constrained in part by regulations, and a rollback of higher capital charges could spur more activity.
While tax cuts and less government regulation may be a near-term benefit, there are a number of potential pitfalls to the president-elect’s economic vision. Repeal of the Affordable Care Act could create uncertainty for employers and the health-care system, depending on how it is handled, while a hard stance on immigration and deportations may have a dampening effect on the labor force and economic output. Deportations limited to illegal immigrants with criminal activity would have
Economic Outlook
S&P 500 Index Levels and 10-Year Treasury Yields
Sources: S&P Dow Jones Indices LLC: S&P Daily Indices; U.S. Board of Governors of the Federal Reserve System (FRB): H.15 Selected Interest Rates [RIFLGFCY10_N.B]
0.0%
0.5%
1.0%
1.5%
2.0%
2.5%
3.0%
1,950
2,000
2,050
2,100
2,150
2,200
2,250
2,300
1-Se
p-16
11-S
ep-1
6
21-S
ep-1
6
1-O
ct-1
6
11-O
ct-1
6
21-O
ct-1
6
31-O
ct-1
6
10-N
ov-1
6
20-N
ov-1
6
30-N
ov-1
6
10-D
ec-1
6
S&P 500 Index and 10-Year Treasury Yields
S&P 500 (l) 10-Year Treasury (r)
Matrix National | Winter 2017 4
a negligible economic impact. A potentially larger problem is international trade, as president-elect Trump has voiced his interest in renegotiating trade deals and the outright removal of the United States from the Trans Pacific Partnership. If his positions on trade pacts are a strategy to negotiate more favorable terms, the impact will be muted. But there is potential downside in new tariffs, if they are enacted.
The economy may see the short-term benefits of tax reductions and infrastructure investment, but there are also some questions to be answered regarding the long-term economic viability of Trump’s policies. What’s more, some of the potential benefits from a pro-growth agenda, such as simplification of the tax code, must go through the legislative process, and changes will take time. Mainly, then, this is a question of which policies lead vs. lag and whether (and how) policies are staged into waves—regulatory action first, legislation second, and anti-growth policies third. The exact trajectory is at this point not known, but early indications are encouraging.
Despite the uncertain future, real estate fundamentals remain strong, keyed by healthy employment numbers. The economy averaged 180,000 new jobs per month in 2017. Unemployment sat at a cycle low of 4.6% as of November, underemployment is at cyclical lows while the number of job openings is at a cyclical high, and wage growth picked up in the second half of 2016. The health of the economy led the Federal Open Market Committee to raise its federal funds target interest rate by 25 basis points in December, and the committee is targeting three more increases in 2017, although it certainly is too soon to predict.
The stability of the job market and faster growth should provide steady demand for commercial real estate in 2017. Job gains and the growing number of renter-age households will boost demand for multifamily. Healthy consumer balance sheets should keep retail spending growing at a 3-4% rate, although the benefit to retail properties is concentrated in well-located and dominant centers due to the growth of e-commerce. Amazon and other major online retailers will continue to fuel a need for more warehouses close to population centers.

Matrix National | Winter 2017 5
Rents began decelerating nationally in the second half of 2016 and we expect that trend to continue into 2017. One reason is the mismatch between demand and supply, which is already producing a slowdown in high-rent markets such as San Francisco, Denver and Austin. Each of those metros has a strong economy and an attractive lifestyle that continue to drive in-migration. But all saw severe rent deceleration in the second half of 2016, as rent levels have surpassed what many tenants can afford.
New supply has largely been targeted at luxury units, while demand in most markets is stronger at the middle or lower end of the pricing scale. Although growth in many high-rent markets across the country—such as New York, Boston, Philadelphia and Los Angeles—is limited by affordability, the constraint posed on rent growth is a nationwide issue.
In a broader sense, increasing amounts of new supply are another factor that will weigh on rent growth. Metros with above-trend increases in supply as a percentage of stock include Dallas, Houston, Seattle, Denver, San Antonio, Orlando, Austin, Charlotte and Washington, D.C. Many of these metros have strong job engines that are attracting young workers, but even so, rent growth may slow down closer to historical norms until the new units are absorbed.
Rent Growth and Occupancy
Market2017 Rent Forecast,
% ChangeYOY Rent Growth December 2016
National 3.9 4.1
Sacramento 9.6 10.1
Seattle 8.6 8.0
Tacoma 8.0 11.4
Inland Empire 7.9 7.7
Portland 7.0 6.0
Atlanta 6.9 5.5
Austin 6.9 3.9
Nashville 6.9 5.5
Phoenix 6.5 6.3
San Francisco 6.5 2.3
Orlando 6.2 5.4
Colorado Springs 6.0 9.9
Dallas 5.8 5.6
Raleigh - Durham 5.8 4.5
Los Angeles 5.5 6.2
Miami 5.5 4.6
Tampa 5.5 5.5
Orange County 5.3 4.4
San Fernando Vall. 5.3 5.8
Denver 5.0 4.1
San Jose 5.0 0.0
San Diego 4.9 4.6
Las Vegas 4.7% 6.4
Market2017 Rent Forecast,
% ChangeYOY Rent Growth December 2016
Northern New Jersey 4.5 4.3
Memphis 4.4 4.0
Philadelphia 4.4 3.9
Indianapolis 4.1 4.2
Boston 3.8 2.4
White Plains 3.6 4.1
Jacksonville 3.5 4.1
Kansas City 3.5 3.4
Long Island 3.5 4.9
San Antonio 3.5 3.1
Chicago 3.4 3.4
Houston 3.2 1.3
Washington, D.C. 3.2 2.6
St. Louis 3.1 2.8
Twin Cities 3.1 4.4
Birmingham 3.0 3.0
Central New Jersey 3.0 3.7
Louisville 2.9 1.8
Richmond 2.8 3.2
Baltimore 2.5 2.8
New Haven 1.1 2.4
Oklahoma City 0.3 0.9
Source: Yardi Matrix

Matrix National | Winter 2017 6
One outlier on the high end of the spectrum is Sacramento, which has maintained double-digit rent gains due to its status as a low-cost alternative to the Bay Area, with very little new development. Houston is an outlier at the low end, as job growth has slowed while construction continues unabated.
When all is said and done, we expect rent growth to moderate to 3.9% in 2017, which is down from where it was through most of the last two years but still above the long-term average of 2.3%. Although growth will revert to more sustainable levels, multifamily remains a safe bet for most investors over the next few years.
The biggest factor is that demand for multifamily will likely be robust for years—even as long as a decade. The number of Millennials between the prime renter ages of 20 and 34 is projected to increase by two million before it peaks at almost 70 million in 2024. That coincides with a bump in the number of white, college-educated renters relocating to urban areas for the “18-hour” city lifestyle that includes entertainment and access to public transportation.
As the young worker pool grows, unemployment rates have dipped below 5% and wage growth has intensified, hitting 2.8% year-over-year as of October 2016. The result is a boom in household formations, which have steadily risen since slumping badly in the wake of the last recession.
A further reason for optimism is that new supply has not kept up with the surge in multifamily households. The number of renter households increased by 9.3 million in the 10 years between 2005 and 2015, according to the Census Bureau, while the number of owner-occupied households dropped by 2.1 million.
The result is that occupancies of stabilized properties are near all-time highs: 95.8% nationally as of October, according to Yardi Matrix. Even though supply has rebounded from the recessionary lows—Yardi Matrix forecasts about 320,000 units to come online in the U.S. in 2017—that is barely enough to match projected demand from renters.
U.S. Rent Growth, YoY Change
Source: Yardi Matrix
National Average Rents
Source: Yardi Matrix
Occupancy—All Asset Classes by Month
Overall Lifestyle Renter by Necessity

Matrix National | Winter 2017 7
2017 is shaping up to be the biggest year for new supply since the financial crisis, as 320,000 new units are expected to come online. That would mark a 5.3% increase from the 303,000 units that came online in 2016. We expect that this year could be a high-water mark in the cycle, as new permits have leveled off. Some of 2017’s growth represents a carryover from projects that were scheduled to be completed in 2016 but were delayed. Plus, lenders have become much more conservative about construction financing as a result of greater capital charges implemented on high-volatility commercial real estate loans.
Once again, new supply will be led by Dallas (25,000 units) and Houston (15,000), although the two metros have different outlooks. Dallas’ diversified economy continues to grow and absorption of apartments remains strong, but Houston’s more energy-centric economy remains weak, with vacancy rates likely to rise given the number of units coming online.
Supply
Market
2017 Forecast
Completions
2017 Completions
% Stock
National - all markets 319,458 2.5%
Dallas 25,093 3.7
Houston 15,450 2.6
Washington, D.C. 13,686 2.7
Seattle 12,351 5.5
Denver 12,080 4.9
Atlanta 11,113 2.7
Boston 8,727 4.3
Austin 6,883 3.3
Nashville 6,861 5.7
San Francisco 6,605 2.7
San Antonio 6,466 3.7
Miami 6,404 5.5
Chicago 6,244 2.0
Los Angeles 5,959 2.3
Phoenix 5,788 2.0
Twin Cities 5,553 2.9
Tampa 5,341 2.7
Raleigh - Durham 4,338 3.1
Orlando 4,211 2.2
Portland 4,211 3.0
Philadelphia 3,864 1.4
Market
2017 Forecast
Completions
2017 Completions
% Stock
San Diego 3,791 2.1%
Kansas City 3,632 2.6
Orange County 3,396 1.8
Richmond 3,249 1.6
New Haven 2,985 2.4
Indianapolis 2,892 1.8
Baltimore 2,586 1.2
Las Vegas 2,301 1.4
San Jose 2,224 1.8
Louisville 2,219 3.1
Jacksonville 1,882 2.1
St. Louis 1,827 1.6
Oklahoma City 1,614 1.7
Inland Empire 1,505 1.1
Memphis 1,119 1.2
Sacramento 1,060 0.9
San Fernando Valley 971 0.7
Birmingham 927 1.4
White Plains 863 1.3
Tacoma 848 1.4
Long Island 590 1.2
Colorado Springs 449 1.2
Source: Yardi Matrix

Matrix National | Winter 2017 8
Other metros with large amounts of supply in 2017 include Washington, D.C. (13,700 units), Seattle (12,300), Denver (12,000) and Atlanta (11,100). Construction in these metros generally has been a response to strong demand for 18-hour cities that have been attracting young workers. However, the amount of supply could impact rent growth and has the potential to increase vacancies if the local economies slow down.
As a percentage of total stock, leading the pack are two metros at the opposite end of the geographic spectrum, Seattle and Miami, both of which will add 5.5% to their apartment inventory in 2017. Denver and Nashville (both at 4.9%) and Boston (4.3%) also are adding a high percentage of new units.
While some cities have been able to absorb new supply better than others, decelerating rents have been a trend in all cities, especially San Francisco and Denver, two metros that saw significant supply increases in 2016. Seattle, one of the best-performing metros for rent growth in 2016, could mimic San Francisco and Denver, as the new supply will likely put downward pressure on rents. Miami may be on the brink of oversupply, as rents have slowed ahead of the construction boom.
Conversely, some of the best-performing metros in rent growth have limited supply increases in the pipeline. California markets such as the Inland Empire (1.1%), Sacramento (0.9%) and the San Fernando Valley (0.7%), are expected to have low completions as a percentage of total stock, which may support long-term growth in rents.
The composition of new supply continues to create affordability issues, as most construction is concentrated at the high end of the quality spectrum in primary or secondary markets. Developers have been so focused because high construction and land costs make it difficult to produce profitable Class B and C units. However, the oversupply of Class A inventory has caused a bifurcation in the market, and as a result, units at the lower and middle part of the spectrum have outperformed in rent growth and occupancy, while the demand for more affordable housing remains robust.

Matrix National | Winter 2017 9
As we’ve noted in past outlooks, the capital markets and supply/demand fundamentals have moved to different beats during this cycle. Investor demand for commercial real estate allowed property values and debt availability to recover quickly, as vacancy rates and rent growth generally inched forward. However, after a huge run-up since 2010, apartments now seem fully priced and the sector appears vulnerable to a more cautious outlook and/or the rise in interest rates. On the debt side, lenders of all types are good to keep providing financing to the sector, though the potential changes to the government-sponsored enterprises (GSEs) looms in the background as a potential trouble spot.
Investor interest in multifamily remains high. Multifamily property values are 50 percent above pre-crisis peaks, and acquisition yields were at 5.6% nationally as of third-quarter 2016—lower than they were at the height of the financial crisis—according to Real Capital Analytics Inc. Although the amount of capital flowing to the sector is slowing slightly due to concerns about whether the market has peaked, investors are set to stay in for the long haul as the conditions that drove them there in the first place largely continue. Investors believe the fundamental outlook for multifamily is still strong, with historically high occupancy rates and rent growth in metros across the country. Even if the rate of growth slows, property income seems a stable bet, given demographic and market trends. What’s more, barring unforeseen circumstances, the U.S. likely will continue to be seen as a safe haven relative to other markets around the world.
One issue that could weaken the forecast is interest rates. The market has benefited from low interest rates throughout this cycle, but they may be on an upward trend. The 10-year Treasury rate climbed more than 70 basis points in the two months following the election, and the Federal Reserve has signaled its intent to gradually normalize rates.
Our view is that if rates don’t climb much further, property yields should remain fairly constant because apartment cash flows are stable and the sector remains attractive relative to other investments. Even at 5.6%, apartment yields are roughly 300 basis points above the risk-free rate, which is acceptable given the alternatives and stable prospects. If 10-year Treasury rates increase much more, though, the likelihood is that cap rates will rise moderately in tandem. Over the next couple of years, investors should brace themselves for moderate returns that are limited mostly to increases in net cash flow, while appreciation gains slow down or pause.
The debt capital markets are one of the factors that have helped provide a shot to multifamily as an investment class. On the surface, 2017 looks to be another good year: Fannie Mae and Freddie Mac are—as of now—in good shape and originating at record levels, while other types of lenders remain eager to book loans. Fannie and Freddie’s regulator, the Federal Housing Finance Authority, has increased their allocation to $36.5 billion apiece, and they have authority to lend much more through new programs for properties with affordable components and sustainability efforts.
Capital Markets
Commercial Property Price Index (Jan. 2000=100)
Sources: Moody’s Analytics, Real Capital Analytics
80
100
120
140
160
180
200
220
240
260
280
Apr
-01
Oct
-01
Apr
-02
Oct
-02
Apr
-03
Oct
-03
Apr
-04
Oct
-04
Apr
-05
Oct
-05
Apr
-06
Oct
-06
Apr
-07
Oct
-07
Apr
-08
Oct
-08
Apr
-09
Oct
-09
Apr
-10
Oct
-10
Apr
-11
Oct
-11
Apr
-12
Oct
-12
Apr
-13
Oct
-13
Apr
-14
Oct
-14
Apr
-15
Oct
-15
Apr
-16
Oct
-16
All Property Apartment Core Commercial
Matrix National | Winter 2017 10
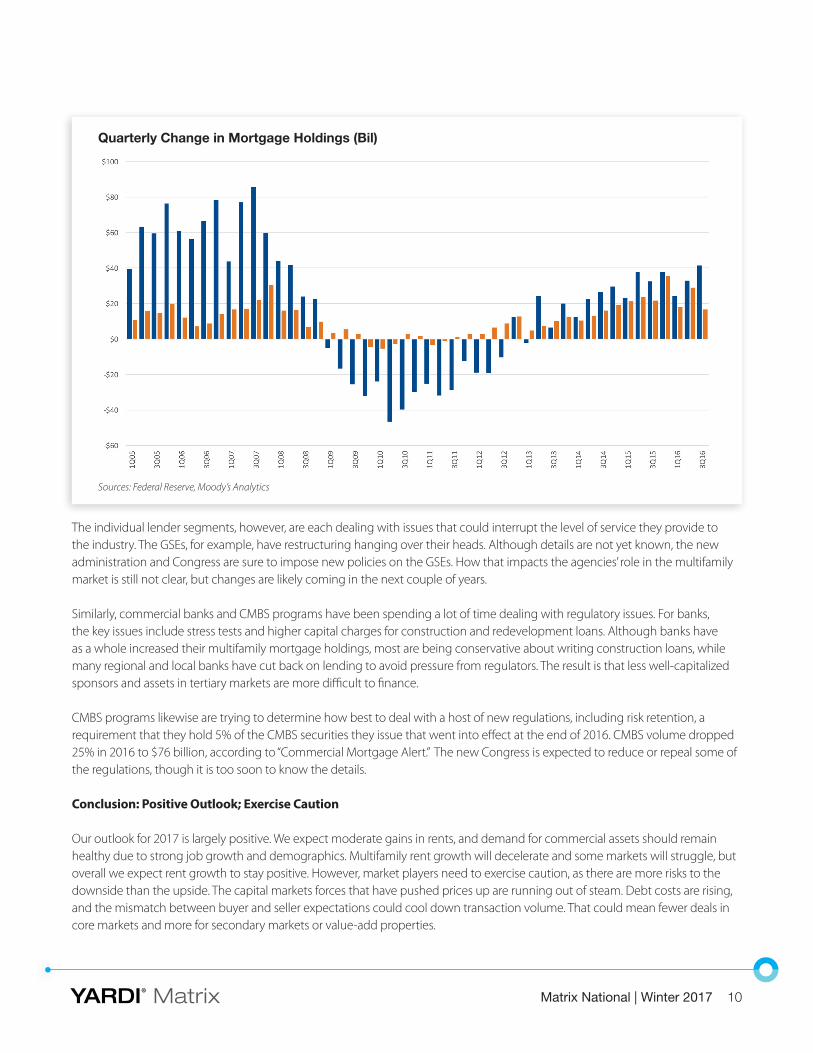
The individual lender segments, however, are each dealing with issues that could interrupt the level of service they provide to the industry. The GSEs, for example, have restructuring hanging over their heads. Although details are not yet known, the new administration and Congress are sure to impose new policies on the GSEs. How that impacts the agencies’ role in the multifamily market is still not clear, but changes are likely coming in the next couple of years.
Similarly, commercial banks and CMBS programs have been spending a lot of time dealing with regulatory issues. For banks, the key issues include stress tests and higher capital charges for construction and redevelopment loans. Although banks have as a whole increased their multifamily mortgage holdings, most are being conservative about writing construction loans, while many regional and local banks have cut back on lending to avoid pressure from regulators. The result is that less well-capitalized sponsors and assets in tertiary markets are more difficult to finance.
CMBS programs likewise are trying to determine how best to deal with a host of new regulations, including risk retention, a requirement that they hold 5% of the CMBS securities they issue that went into effect at the end of 2016. CMBS volume dropped 25% in 2016 to $76 billion, according to “Commercial Mortgage Alert.” The new Congress is expected to reduce or repeal some of the regulations, though it is too soon to know the details.
Conclusion: Positive Outlook; Exercise Caution
Our outlook for 2017 is largely positive. We expect moderate gains in rents, and demand for commercial assets should remain healthy due to strong job growth and demographics. Multifamily rent growth will decelerate and some markets will struggle, but overall we expect rent growth to stay positive. However, market players need to exercise caution, as there are more risks to the downside than the upside. The capital markets forces that have pushed prices up are running out of steam. Debt costs are rising, and the mismatch between buyer and seller expectations could cool down transaction volume. That could mean fewer deals in core markets and more for secondary markets or value-add properties.
Quarterly Change in Mortgage Holdings (Bil)
Sources: Federal Reserve, Moody’s Analytics

What’s the best choice for CRE news & views?
Visit our websites and sign up for our free emailed newsletters at cpexecutive.com/subscribe and multi-housingnews.com/subscribe.
With so much information out there, selecting the best source
can be daunting. Keep it simple. Commercial Property Executive
and Multi-Housing News will keep you up-to-date on real estate
news, data, trends and analysis—daily, weekly or monthly. Trust
the leading integrated industry information resource to help you
make informed decisions and achieve your business goals.
cpexecutive.com multi-housingnews.com

Matrix National | Winter 2017 12
Definitions Lifestyle households (renters by choice) have wealth sufficient to own but have cho-sen to rent. Discretionary households, most typically a retired couple or single profession-al, have chosen the flexibility associated with renting over the obligations of ownership.
Renter by Necessity households span a range. In descending order, household types can be:
■ A young-professional, double-income-no-kids household with substantial income but without wealth needed to acquire a home or condominium;
■ Students, who also may span a range of income capability, extending from affluent to barely getting by;
■ Lower-middle-income (“gray collar”) households, composed of office workers, policemen, firemen, technical workers, teachers, etc.;
■ Blue-collar households, which may barely meet rent demands each month and likely pay a disproportionate share of their income toward rent;
■ Subsidized households, which pay a percentage of household income in rent, with the balance of rent paid through a governmental agency subsidy. Subsidized households, while typically low income, may extend to middle-income households in some high-cost markets, such as New York City;
■ Military households, subject to frequency of relocation.
These differences can weigh heavily in determining a property’s ability to attract specific renter market segments. The five-star resort serves a very different market than the down-and-outer motel. Apartments are distinguished similarly, but distinctions are often not clearly definitive without investigation. The Yardi® Matrix Context rating eliminates that requirement, designating property market positions as:
The value in application of the Yardi® Matrix Context rating is that standardized data provides consistency; information is more meaningful because there is less uncertainty. The user can move faster and more efficiently, with more accurate end results.
The Yardi® Matrix Context rating is not intended as a final word concerning a property’s status—either improvements or location. Rather, the result provides reasonable consistency for comparing one property with another through reference to a consistently applied standard.
To learn more about Yardi® Matrix and subscribing, please visit www.yardimatrix.com or call Ron Brock, Jr., at 480-663-1149 x2404.
© Yardi Systems, Inc., 2017. All rights reserved. All other trademarks are the property of their respective owners.
Market Position Improvements Ratings
Discretionary A+ / A
High Mid-Range A- / B+
Low Mid-Range B / B-
Workforce C+ / C / C- / D
Contacts
Jeff Adler
Vice President & General Manager of Yardi Matrix [email protected] (800) 866-1124 x2403
Jack Kern Director of Research and Publications [email protected] (800) 866-1124 x2444
Paul Fiorilla
Associate Director of Research [email protected] (800) 866-1124 x5764
Chris Nebenzahl Senior Analyst [email protected] (800) 866-1124 x2200

YARDI® Matrix
Comprehensive Apartment Market IntelligenceDrive superior investment returns with Yardi® Matrix, the industry’s most powerful business
development tool that top brokers, sponsors, banks and equity capital sources rely on when
underwriting multifamily investment transactions. Stand apart from the competition with macro-
and micro-level market data including actual ownership, loan maturities, new construction
pipelines, rental forecast reports and detailed property information on more than 110 markets
totaling 65,000 multifamily properties with 12.5 million units covering 75% of the U.S. population.
9200 East Pima Center Parkway, Suite 150 | Scottsdale, AZ 85258phone: +1 480 663 1149 | email: [email protected] | www.yardimatrix.com

Matrix National | Winter 2017 14
DISCLAIMER
ALTHOUGH EVERY EFFORT IS MADE TO ENSURE THE ACCURACY, TIMELINESS AND COMPLETENESS OF THE INFORMATION PROVIDED IN THIS PUBLICATION,
THE INFORMATION IS PROVIDED “AS IS” AND YARDI MATRIX DOES NOT GUARANTEE, WARRANT, REPRESENT OR UNDERTAKE THAT THE INFORMATION
PROVIDED IS CORRECT, ACCURATE, CURRENT OR COMPLETE. YARDI MATRIX IS NOT LIABLE FOR ANY LOSS, CLAIM, OR DEMAND ARISING DIRECTLY OR
INDIRECTLY FROM ANY USE OR RELIANCE UPON THE INFORMATION CONTAINED HEREIN.
COPYRIGHT NOTICE
This document, publication and/or presentation (collectively, “document”) is protected by copyright, trademark and other intellectual property laws. Use
of this document is subject to the terms and conditions of Yardi Systems, Inc. dba Yardi Matrix’s Terms of Use (http://www.yardimatrix.com/Terms) or other
agreement including, but not limited to, restrictions on its use, copying, disclosure, distribution and decompilation. No part of this document may be disclosed
or reproduced in any form by any means without the prior written authorization of Yardi Systems, Inc. This document may contain proprietary information
about software and service processes, algorithms, and data models which is confidential and constitutes trade secrets. This document is intended for
utilization solely in connection with Yardi Matrix publications and for no other purpose.
Yardi®, Yardi Systems, Inc., the Yardi Logo, Yardi Matrix, and the names of Yardi products and services are trademarks or registered trademarks of Yardi Systems,
Inc. in the United States and may be protected as trademarks in other countries. All other product, service, or company names mentioned in this document
are claimed as trademarks and trade names by their respective companies.
© 2017 Yardi Systems, Inc. All Rights Reserved.