Embed Size (px)
Citation preview

Pandemic Ends Strong Run; Worst May Be Ahead
Rent Growth Stalls in 2Q
Pandemic Slows Demand
Dollars Still Flow to the Sector
U.S. Multifamily OutlookSummer 2020

2
Market AnalysisSummer 2020
CONTACTS
Jeff Adler Vice President & General Manager of Yardi Matrix [email protected] (800) 303-615-3676
Jack Kern Director of Research and Publications [email protected] (800) 866-1124 x2444
Chris Nebenzahl Editorial Director [email protected] (800) 866-1124 x2200
Paul Fiorilla Director of Research [email protected] (800) 866-1124 x5764
COVID-19 Weighs on Multifamily As Rents Fall—And More Pain Is Coming
■ After years of strong fundamental performance, the COVID-19 pandemic injected a huge amount of uncertainty and volatility into multifamily that the market will have to deal with for months or even years to come.
■ Expectations of calamity—such as widespread non-payment of rents and loan delinquencies—did not come to pass. Tenants were subsidized by emergency unemployment aid, which ends in July. At the same time, initial hopes for a “V-shaped” recovery were too optimistic, and the effects of the pandemic will linger until the population is confident about health measures.
■ The U.S. economy is in recession, although the pain is not evenly spread. More than 50 million Americans filed jobless claims between March and the end of June due to business closures, with low-wage service workers bearing the brunt. Companies began rehiring in May, but the unemployment rate remains elevated, at 11.1% in June.
■ Rents turned negative in the second quarter for the first time since the aftermath of the global financial crisis. Property owners concerned with maintaining occupancy renewed leases with no rent increases. New luxury units are taking longer to lease up, as demand is concentrated on less expensive product. Rents are likely to drop further in the second half of 2020 before rebounding in 2021.
■ Multifamily capital remains abundant, but deal flow has slowed as underwriting future growth has become more difficult. Fannie Mae and Freddie Mac remain active, though with more conservative terms and higher reserve requirements. Investment activity dropped sharply, but opportunistic capital is circling, waiting for signs of distressed assets.
■ The pandemic will weaken the supply pipeline and delay projects that have not yet started construction. We forecast 250,000 deliveries annually in 2020 and 2021.
U.S. Outlook 2020

U.S. Outlook | Summer 2020 3
The U.S. and global economies are in their first downturn in more than a decade. Most states starting in mid-March implemented wide-sweeping measures to close schools, businesses, and recreational and leisure establishments, in hopes of curtailing the spread of COVID-19. The economic implications have been significant, as more than 50 million Americans have filed for unemployment benefits. While some of those jobs have returned, continuing unemployment claims remain above 20 million, roughly three times the peak of the Great Recession.
Four months in, the initial economic shock has subsided, and many states have lifted their lockdowns, but the economic impact remains immense. Unprecedented monetary and fiscal stimulus has fortified many businesses and individuals, as most Americans received $1,200 in direct stimulus while small businesses benefited from nearly $1 trillion in paycheck protection loans. These funds would turn into grants if the owners met requirements to keep staff on payroll.
Somewhat surprisingly, asset values appear to be holding their own, although time will tell if there will be another major correction in the stock or real estate markets. Major stock indices fell more than 30% in the immediate aftermath of statewide lockdowns, but the combination of economic stimulus and increased demand for technology as a result of working from home has pushed the major indices back within striking distance of their February highs. Many technology companies including Amazon, Apple and Netflix continue to reach new all-time highs as demand for their products has increased during quarantines.
Commercial property values also seem to be faring well, despite the economic calamities. Transaction activity slowed dramatically in the second quarter, but the few deals that were pushed through as well as some of the deals traded early in the third quarter have not shown a major decline in pricing. Collections have remained strong, so anticipated distressed sales have not emerged. However, property values may be in jeopardy if the extended unemployment benefits expire before the economy recovers.
Signs are beginning to emerge that economic growth is returning. Both May (2.5 million) and June (4.8 million) job creation numbers were historically strong, albeit on the back of the worst recorded month in history. Retail sales numbers also seem to be improving, again compared to an historically poor April.
The economic focus now shifts to two key factors: how soon a vaccine is developed and how seriously the American people take the virus over the second half of 2020 and into 2021. While some experimental therapeutics are in trials, none have been agreed upon for widespread use.
Economic Outlook
Weekly Jobless Claims
Sources: Yardi Matrix; U.S. Employment & Training Administration (ETA): Unemployment Insurance Weekly Claims
0
1,000,000
2,000,000
3,000,000
4,000,000
5,000,000
6,000,000
7,000,000
8,000,000
1/12
/19
2/12
/19
3/12
/19
4/12
/19
5/12
/19
6/12
/19
7/12
/19
8/12
/19
9/12
/19
10/1
2/19
11/1
2/19
12/1
2/19
1/12
/20
2/12
/20
3/12
/20
4/12
/20
5/12
/20
6/12
/20
WWeeeekkllyy JJoobblleessss CCllaaiimmss
U.S. Outlook | Summer 2020 4
One bad sign for a quick recovery is that infections and hospitalizations have been rising rapidly in states where economies reopened early and social distancing has carried a loose definition. While the short-term impact of reopening economies
may be positive on a micro scale, the long-term economic effect—not to mention the social impacts of the death toll—is less certain. The social and economic burden has rested squarely on the shoulders of Americans, to mixed success.
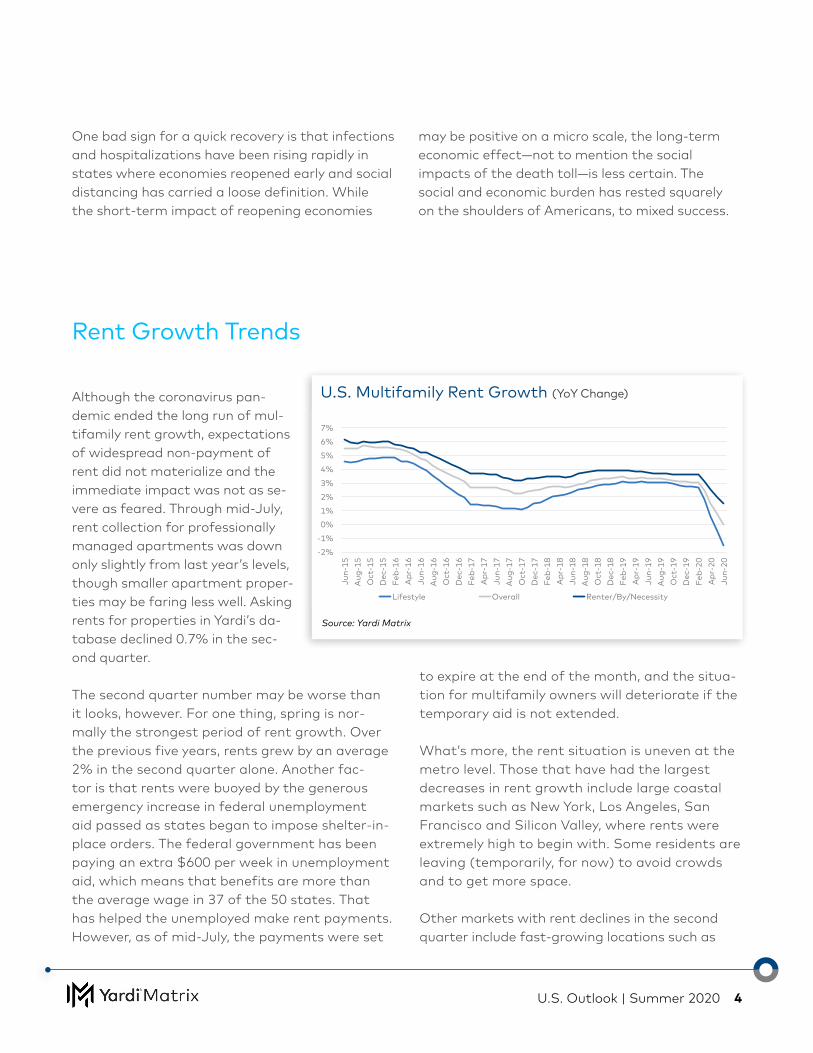
Although the coronavirus pan-demic ended the long run of mul-tifamily rent growth, expectations of widespread non-payment of rent did not materialize and the immediate impact was not as se-vere as feared. Through mid-July, rent collection for professionally managed apartments was down only slightly from last year’s levels, though smaller apartment proper-ties may be faring less well. Asking rents for properties in Yardi’s da-tabase declined 0.7% in the sec-ond quarter.
The second quarter number may be worse than it looks, however. For one thing, spring is nor-mally the strongest period of rent growth. Over the previous five years, rents grew by an average 2% in the second quarter alone. Another fac-tor is that rents were buoyed by the generous emergency increase in federal unemployment aid passed as states began to impose shelter-in-place orders. The federal government has been paying an extra $600 per week in unemployment aid, which means that benefits are more than the average wage in 37 of the 50 states. That has helped the unemployed make rent payments. However, as of mid-July, the payments were set
Rent Growth Trends
Source: Yardi Matrix
-2%
-1%
0%
1%
2%
3%
4%
5%
6%
7%
Jun-15
Aug
-15
Oct-15
Dec-15
Feb-16
Apr-16
Jun-16
Aug
-16
Oct-16
Dec-16
Feb-17
Apr-17
Jun-17
Aug
-17
Oct-17
Dec-17
Feb-18
Apr-18
Jun-18
Aug
-18
Oct-18
Dec-18
Feb-19
Apr-19
Jun-19
Aug
-19
Oct-19
Dec-19
Feb-20
Apr-20
Jun-20
Lifestyle Overall Renter/By/Necessity
to expire at the end of the month, and the situa-tion for multifamily owners will deteriorate if the temporary aid is not extended.
What’s more, the rent situation is uneven at the metro level. Those that have had the largest decreases in rent growth include large coastal markets such as New York, Los Angeles, San Francisco and Silicon Valley, where rents were extremely high to begin with. Some residents are leaving (temporarily, for now) to avoid crowds and to get more space.
Other markets with rent declines in the second quarter include fast-growing locations such as
U.S. Multifamily Rent Growth (YoY Change)

U.S. Outlook | Summer 2020 5
Metros
Top Markets 2020 Rent Forecast
% ChangeYoY Change June 2020
National—All Markets -0.9% 0.0%
Tucson 2.3% 3.7%
St. Louis 1.5% 2.9%
Indianapolis 1.4% 2.1%
Knoxville 1.3% 2.0%
Kansas City 1.1% 1.8%
Dallas 1.0% 0.6%
Long Island 0.9% 1.5%
Charleston 0.7% -1.2%
Tampa–St. Petersburg 0.7% 0.9%
Inland Empire 0.7% 2.9%
Columbus 0.6% 2.2%
Colorado Springs 0.5% 2.9%
New Jersey–Northern 0.4% 0.9%
Phoenix 0.4% 2.8%
Louisville 0.3% 1.9%
New York City 0.3% -2.7%
Nashville 0.1% 0.2%
Charlotte 0.0% 0.4%
Cleveland-Akron -0.3% 1.8%
New Orleans -0.4% 1.4%
Bridgeport -0.4% -0.3%
Detroit -0.5% 1.9%
Southwest Florida Coast -0.5% -0.5%
Chicago -0.5% -1.5%
Austin -0.8% -1.2%
Source: Yardi Matrix
Austin, Seattle, Miami and Denver. Those mar-kets have had large amounts of deliveries of luxury product in recent years, and thousands of new units are coming online just as demand was diminishing due to the pandemic. With millions furloughed and employment less certain, demand is being concentrated in lower-cost apartments, which is showing up clearly in the rent numbers. At the end of the first half, rents of luxury lifestyle units fell 1.8% year-over-year, while working-class Renter-by-Necessity units were up 1.4%.
Not every market has seen rents turn negative. In some Midwest markets—such as Kansas City, Indianapolis and Minnesota—rents have increased slightly both because they were slow to close their economies and because they were already gener-ally more affordable. Lower-price California mar-kets where tenants go to escape more expensive locales, including the Inland Empire and Sacra-mento, have also had asking rents flatten rather than decline.
Like so much of the current economic situation, it is difficult to handicap the next six to 12 months. The best-case scenario—a quick “V-shaped” recov-ery starting in the second half of 2020—already seems unlikely given that the infection rate is ris-ing rather than falling. States among the first to reopen for business—especially Texas, Arizona and Florida—are battling large increases in infections and hospitalizations. Also uncertain is the policy support that has allowed rents to remain fairly level to date. If the federal aid ends while unem-ployment is still elevated, that would be bad news for apartment rents.
Demand has weakened, but not as much as many operators feared. Occupancy rates dropped 30 basis points nationally to 94.4% through May, but there has been a slow and steady decline since they peaked a year ago at 95.1%. We expect that occupancy will continue to decline moderately, and rents will fall further in the second half.

U.S. Outlook | Summer 2020 6
All development activity was significantly impacted by the COVID-19 outbreak, and that includes multifamily. Although construction was deemed an essential service in parts of the country, data from the National Multifamily Housing Council suggested that nearly half of projects underway would experience delays.
Roughly 700,000 units were under construction in the first quarter, and under normal circumstances nearly half might have been completed by the end of the year. As a result of the project-level delays, we have reduced our initial forecast for 2020 deliveries to 250,000 units, down from the 320,000 units we projected at the beginning of the year. The 250,000 new units represent a 1.7% increase in stock, still a solid figure given the extensive shelter-in-place and lockdown measures taken earlier this year.
The pandemic is impacting both the timing of deliveries and the projects in the pipeline. Among the issues faced by projects already underway were the mandated shutdowns in some jurisdictions, delays in obtaining materials and labor issues. Most of the mandated shutdowns have been lifted, but that is subject to change if there is a second wave of infections. The construction industry has faced a shortage of workers in recent years, which has lengthened the time to complete projects, but the pandemic added another layer to labor issues. Some workers are staying away because they don’t want to risk infections, some might prefer to collect expanded unemployment benefits, and immigration is down.
Supply
Metros
Top Markets-2020Forecast
Completions
2020 Completions % Change
National—All Markets 282,554 2.0%
Dallas 19,318 2.5%
Houston 10,404 1.6%
Atlanta 10,208 2.3%
Denver 9,975 3.6%
Austin 9,342 3.9%
Washington DC 9,136 1.7%
Boston 8,398 3.7%
Los Angeles 8,071 1.9%
Chicago 7,704 2.2%
Orlando 7,672 3.5%
Seattle 6,984 2.8%
San Francisco 6,483 2.5%
New York City 6,201 1.1%
Miami 6,027 2.0%
San Jose 5,829 4.6%
Phoenix 5,665 1.8%
Charlotte 5,544 3.1%
Bridgeport 4,963 3.8%
Nashville 4,831 3.6%
Raleigh 4,757 3.0%
San Antonio 4,594 2.3%
Philadelphia 4,461 1.5%
Southwest Florida Coast 4,365 6.6%
Kansas City 3,950 2.5%
Salt Lake City 3,939 3.9%
Source: Yardi Matrix

U.S. Outlook | Summer 2020 7
Projects that have been started will be completed, but the planning pipeline could be even more affected. With developers waiting to assess demand and economic growth, and banks far more reluctant to dole out construction lending, it’s highly likely that some projects in the permitting stage will either be delayed or scrapped altogether.
The supply imbalance between quality segments remained significant through the first half of the year, as supply is concentrated in luxury Lifestyle assets. The costs of construction and land have kept developers from building Renter-by-Necessity units, especially in gateway markets, where demand has stayed high and prices elevated. However, with tens of millions of jobs lost and many worried about job security, demand is shifting toward less expensive rentals. That means properties coming online will take longer to lease up, and owners must offer concessions to attract renters to new, high-cost units. Dynamic rental markets in the Sunbelt are witnessing a
larger number of properties under construction that are below the 50% threshold for pre-leases.
Only four of the top 10 markets in the U.S. by construction starts saw a year-over-year increase in number of units breaking ground through the first five months of 2020. Austin led all markets with 5,058 apartments delivered through May, but was down 25% year-over-year. Meanwhile, other development-heavy markets such as Denver, West Houston and Orlando saw their construction starts nearly halved.
National Multifamily Occupancy Rate
Source: Yardi Matrix
92%
93%
94%
95%
96%
97%
Jun-15
Sep
-15
Dec-15
Mar-16
Jun-16
Sep
-16
Dec-16
Mar-17
Jun-17
Sep
-17
Dec-17
Mar-18
Jun-18
Sep-18
Dec-18
Mar-19
Jun-19
Sep-19
Dec-19
Mar-20
Jun-20
Lifestyle Overall Renter-by-Necessity

U.S. Outlook | Summer 2020 8
Multifamily Transaction Volume (Bil)
Source: Yardi Matrix
$-
$20
$40
$60
$80
$100
$120
$140
2013 2014 2015 2016 2017 2018 2019 1H20
Multifamily Transaction Volume (Bil)
$0
$20
$40
$60
$80
$100
$120
2010 2011 2012 2013 2014 2015 2016 2017 2018 2019 1H20
Securitization Volume
CMBS GSEs
Capital forces have not been immune to the COVID-19 pandemic, as transaction activity has plummeted. Yet multifamily is likely to face lesser impact over the long term than other property types or investment products. Equity and debt capital forces in the apartment sector remain relatively stable. Though property sales dropped precipitously in the second quarter, the amount of capital seeking to buy apartments remains greater than the amount looking to sell. Overall mortgage lending has declined, but multifamily benefits from the steady role of the government-sponsored enterprises (GSEs) Fannie Mae and Freddie Mac.
Multifamily property sales started the year robustly, but the pandemic slowed things down. First-quarter transaction volume of $23.1 billion put the market on track to approach 2019’s record $126.2 billion of sales. However, many deals got shelved or delayed, and second-quarter volume fell to $7.8 billion. The issue isn’t a lack of equity capital. Investors are drawn to multifamily’s favorable long-term demand fundamentals compared to hotels, shopping centers and offices. Many investors are raising funds, with most looking for distressed and undervalued multifamily properties. For now, most of the opportunistic powder remains dry, as deal flow has flattened out and is likely to remain weak in coming months.
The biggest sticking point to completing deals is that underwriting future cash flow during a pandemic is difficult. Acquisition yields coming into the year have been near historical lows and have not moved much for several years. Most buyers
are looking for a significant discount from those high prices, but sellers are not yet convinced there will be a long-term hit to property incomes and are thus willing to accept bids made by opportunistic funds. Owners may be thinking about the 2008-09 recession, in which those who sold quickly missed out on the strong rebound. If a property owner can hold on, then maybe they should.
On the debt side, most commercial lenders are being cautious, but Fannie Mae and Freddie Mac make multifamily the most liquid segment. The GSEs are requiring more reserves to protect against loss of income and have tightened some terms, but are closing loans with attractive coupons in the 3-4% range. The GSEs paused for a couple of weeks in March, during the initial wave of confusion over the pandemic, but since then have been lending at close to normal levels. Fannie and Freddie securitized $50.8 billion of loans in the first half, on pace to match last year’s $102.8 billion total, according to "Commercial Mortgage Alert."
Other types of lenders have cut back and generally are more conservative. Large commercial banks and
Capital Markets

U.S. Outlook | Summer 2020 9
life companies are focusing on low-leverage loans with longstanding customers. That has opened the door for some regional and local banks and some private lenders to increase originations, but overall non-agency volume is spotty.
CMBS was hard hit by the volatility in bond markets in March that led bond prices to plummet. Spreads came down somewhat after the Federal Reserve announced that CMBS was among the products that it would buy through its Term Asset-Backed Securities Loan Facility, or TALF, program. CMBS spreads and lending recovered somewhat, but volume remains weak. First half CMBS volume was $30 billion, but that dropped to only $7.1 billion in the second quarter, according to CMA. Securitization programs are limiting leverage and avoiding most retail and hotel loans, for which there is little investor demand. Plus, CMBS shops are reluctant to build up warehouses when demand and pricing are volatile.
Loan defaults remain an issue. Portfolio lenders can work with borrowers who need to forbear payments, but CMBS loans are subject to strict requirements of pre-sale agreements. As a result, the CMBS loan delinquency rate shot up as COVID settled in, to 10.4% in June from 2.3% in December 2019, according to Trepp. Multifamily delinquencies rose only slightly, to 3.4% in June from 2.0% in December 2019, Trepp said. The level of defaults—closely tied to government support for renters—will be carefully watched in coming months.
CMBS, Agency Bond Issuance
Source: Commercial Mortgage Alert
$-
$20
$40
$60
$80
$100
$120
$140
2013 2014 2015 2016 2017 2018 2019 1H20
Multifamily Transaction Volume (Bil)
$0
$20
$40
$60
$80
$100
$120
2010 2011 2012 2013 2014 2015 2016 2017 2018 2019 1H20
Securitization Volume
CMBS GSEs

U.S. Outlook | Summer 2020 10
Definitions
Lifestyle households (renters by choice) have wealth sufficient to own but have chosen to rent. Discretionary households, most typically a retired couple or single professional, have chosen the flexibility associated with renting over the obligations of ownership.
Renter-by-Necessity households span a range. In descending order, household types can be:
■ A young-professional, double-income-no-kids household with substantial income but without wealth needed to acquire a home or condominium;
■ Students, who also may span a range of income capability, extending from affluent to barely getting by;
■ Lower-middle-income (“gray-collar”) households composed of office workers, policemen, firemen, technical workers, teachers, etc.;
■ Blue-collar households, which may barely meet rent demands each month and likely pay a disproportionate share of their income toward rent;
■ Subsidized households, which pay a percentage of household income in rent, with the balance of rent paid through a governmental agency subsidy. Subsidized households, while typically low income, may extend to middle-income households in some high-cost markets, such as New York City;
■ Military households subject to frequency of relocation.
These differences can weigh heavily in determining a property’s ability to attract specific renter market segments. The five-star resort serves a very different market than the down-and-outer motel. Apartments are distinguished similarly, but distinctions are often not clearly definitive without investigation. The Yardi® Matrix Context rating eliminates that requirement, designating property market positions as:
The value in application of the Yardi® Matrix Context rating is that standardized data provides consistency; information is more meaningful because there is less uncertainty. The user can move faster and more efficiently, with more accurate end results.
The Yardi® Matrix Context rating is not intended as a final word concerning a property’s status—either improvements or location. Rather, the result provides reasonable consistency for comparing one property with another through reference to a consistently applied standard.
To learn more about Yardi® Matrix and subscribing, please visit www.yardimatrix.com or call Ron Brock, Jr., at 480-663-1149 x2404.
© Yardi Systems, Inc., 2019. All rights reserved. All other trademarks are the property of their respective owners.
Market Position Improvements RatingsDiscretionary A+ / AHigh Mid-Range A- / B+Low Mid-Range B / B-Workforce C+ / C / C- / D
CONTACTS
Jeff Adler Vice President & General Manager of Yardi Matrix [email protected] (800) 303-615-3676
Jack Kern Director of Research and Publications [email protected] (800) 866-1124 x2444
Paul Fiorilla Director of Research [email protected] (800) 866-1124 x5764
Chris Nebenzahl Editorial Director [email protected] (800) 866-1124 x2200

Power your business with the industry’s leading source for originating, pre-underwriting and managing assets for profitable loans and investments.
Key features• Pierce the LLC every time with true ownership
and contact info
• Leverage patented improvement and location ratings, unit mix, rental, occupancy and current manager information
• Gain complete new supply pipeline information at the asset, competitive set and market level
• Find acquisition prospects based on in-place loans, maturity dates, lenders and originators
• Access exclusive aggregated and anonymized residential revenue and expense comps
Get the latest market trends and forecasts at yardimatrix.com/publications
©2020 Yardi Systems, Inc. All Rights Reserved. Yardi, the Yardi logo, and all Yardi product names are trademarks of Yardi Systems, Inc.
Yardi Matrix Multifamily provides accurate data on 18+ million units, covering over 90% of the U.S. population.
(800) 866-1144 | yardimatrix.com/multifamily
Yardi®Matrix

U.S. Outlook | Summer 2020 12
DISCLAIMER
Although every effort is made to ensure the accuracy, timeliness and completeness of the information provided in this publication, the information is provided “AS IS” and Yardi Matrix does not guarantee, warrant, represent or undertake that the information provided is correct, accurate, current or complete. Yardi Matrix is not liable for any loss, claim, or demand arising directly or indirectly from any use or reliance upon the information contained herein.
COPYRIGHT NOTICE
This document, publication and/or presentation (collectively, “document”) is protected by copyright, trademark and other intellectual property laws. Use of this document is subject to the terms and conditions of Yardi Systems, Inc. dba Yardi Matrix’s Terms of Use (http://www.yardimatrix.com/Terms) or other agreement including, but not limited to, restrictions on its use, copying, disclosure, distribution and decompilation. No part of this document may be disclosed or reproduced in any form by any means without the prior written authorization of Yardi Systems, Inc. This document may contain proprietary information about software and service processes, algorithms, and data models which is confidential and constitutes trade secrets. This document is intended for utilization solely in connection with Yardi Matrix publications and for no other purpose.
Yardi®, Yardi Systems, Inc., the Yardi Logo, Yardi Matrix, and the names of Yardi products and services are trademarks or registered trademarks of Yardi Systems, Inc. in the United States and may be protected as trademarks in other countries. All other product, service, or company names mentioned in this document are claimed as trademarks and trade names by their respective companies.
© 2020 Yardi Systems, Inc. All Rights Reserved.
Cover image by Grand Warszawski/iStockphoto.com