Embed Size (px)
Citation preview


2
U.S. M&A Quarterly Insights
Executive Summary
This report, created by the BMO Capital Markets Mergers & Acquisitions team, provides an update on selected key trends that we are observing in the public M&A markets.
1. The premium in this document is defined as a five day premium. BMO analyzed one day as well as thirty day volume weighted average prices, both of which yielded similar trends.
2. YTD2018 and ‘18 YTD in this document is defined as through July 31, 2018.
Seth Prostic
Managing DirectorCo-Head of U.S. Mergers & Acquisitions
Are acquisition premiums, which are at a historically low level during this active M&A market, approaching a new normal?
When we visit with clients we frequently hear how surprised
they are at the high EBITDA multiples buyers have continued to
pay for businesses over the past 18 months. While the M&A
market remains robust in terms of transaction multiples, many
are surprised to hear about the dramatic compression of stock
price premiums buyers have been paying recently to acquire
public companies. While stocks of acquired companies, on
average, have consistently traded at roughly 80-85% of their
respective 52-week high prior to acquisition during the stock
market’s bull run over the past nine years, acquisition premiums
continue to decrease. The median five day acquisition premium1
for public companies this year2, at 21%, is the lowest we have
observed since 2004 – and median purchase premiums for
transactions larger than US$500 million are now in the 15% -
20% range. We expect acquisition premiums to remain near
historically low levels as long as the equity markets continue to
trade near all-time highs.
We look forward to your reactions to the BMO M&A team’s
thoughts and analysis of market trends in the enclosed report.
“We expect acquisition
premiums to remain
near historically low
levels as long as the
equity markets continue
to trade near all-time
highs.”

3
U.S. M&A Quarterly Insights
2018 Remains an Active Year
Median acquisition premium for larger than $500MM transactions
‘18 YTD
15-20%
21%Median acquisition premium in ’18 YTD
approaching a 15-year low
26%Median acquisition premium for sub
$500MM transactions
3%Median 3-year historical revenue growth rate of
publicly acquired companies in ‘18 YTD
18%Median NTM EBITDA growth rate of publicly acquired companies in
‘18 YTD
4.9xDifference between
median LTM EBITDA multiple of largest
quartile of transactions (~14x) and smallest
quartile of transactions (~9x)
~40%Median market
premiums during the Great Recession
~3,500 Days
Length of current bull market, longest
in U.S. history
7.3x‘18 YTD bottom
quartile LTM EBITDA multiple of publicly
acquired companies
3.5xIncrease in median LTM
EBITDA multiple paid by sponsors for publicly
acquired companies over the last 3 years
Current median LTM EBITDA transaction
multiple, slightly lower than the median statistic of 13.4x
in ‘17
12.8x
23.3x‘18 YTD top quartile
LTM EBITDA multiple of publicly acquired
companies
4
U.S. M&A Quarterly Insights
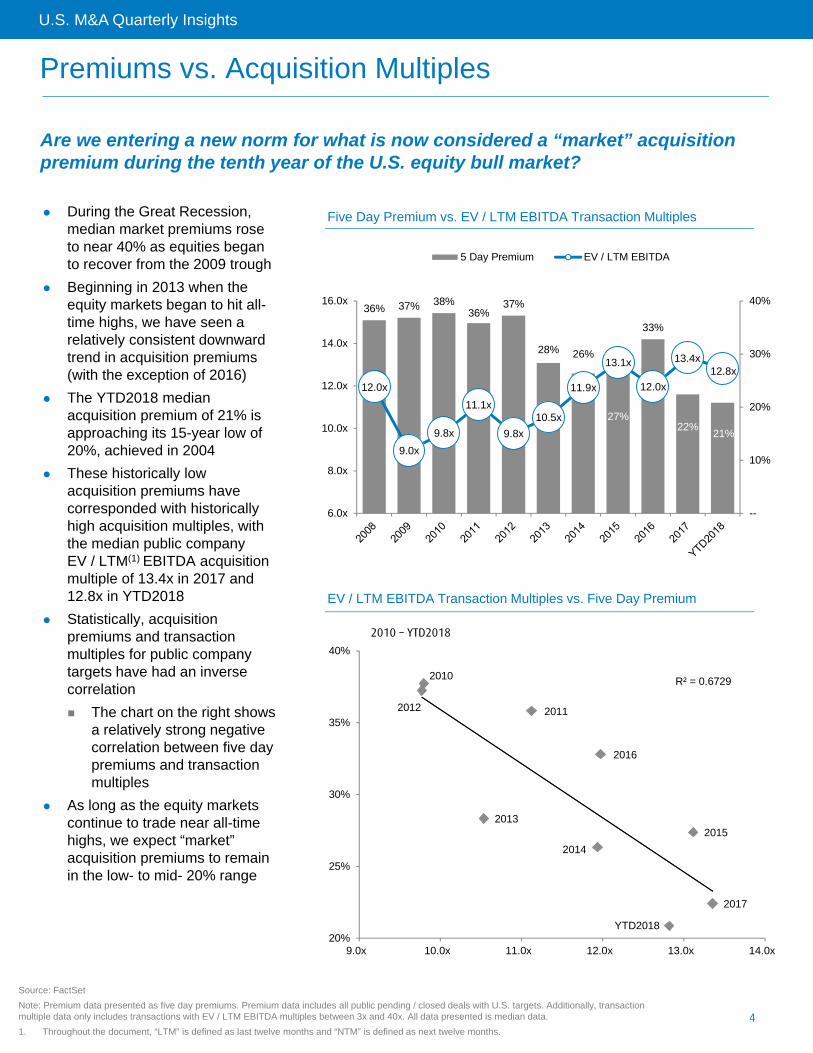
Premiums vs. Acquisition Multiples
During the Great Recession, median market premiums rose to near 40% as equities began to recover from the 2009 trough
Beginning in 2013 when the equity markets began to hit all-time highs, we have seen a relatively consistent downward trend in acquisition premiums (with the exception of 2016)
The YTD2018 median acquisition premium of 21% is approaching its 15-year low of 20%, achieved in 2004
These historically low acquisition premiums have corresponded with historically high acquisition multiples, with the median public company EV / LTM(1) EBITDA acquisition multiple of 13.4x in 2017 and 12.8x in YTD2018
Statistically, acquisition premiums and transaction multiples for public company targets have had an inverse correlation
The chart on the right shows a relatively strong negative correlation between five day premiums and transaction multiples
As long as the equity markets continue to trade near all-time highs, we expect “market” acquisition premiums to remain in the low- to mid- 20% range
2010
20112012
2013
2014
2015
2016
2017
YTD2018
R² = 0.6729
20%
25%
30%
35%
40%
9.0x 10.0x 11.0x 12.0x 13.0x 14.0x
36% 37% 38%36%
37%
28% 26%
27%
33%
22%21%
12.0x
9.0x
9.8x
11.1x
9.8x
10.5x
11.9x
13.1x
12.0x
13.4x 12.8x
--
10%
20%
30%
40%
6.0x
8.0x
10.0x
12.0x
14.0x
16.0x
5 Day Premium EV / LTM EBITDA
2010 – YTD2018
Five Day Premium vs. EV / LTM EBITDA Transaction Multiples
EV / LTM EBITDA Transaction Multiples vs. Five Day Premium
Source: FactSet
Note: Premium data presented as five day premiums. Premium data includes all public pending / closed deals with U.S. targets. Additionally, transaction multiple data only includes transactions with EV / LTM EBITDA multiples between 3x and 40x. All data presented is median data.
1. Throughout the document, “LTM” is defined as last twelve months and “NTM” is defined as next twelve months.
Are we entering a new norm for what is now considered a “market” acquisition premium during the tenth year of the U.S. equity bull market?

5
U.S. M&A Quarterly Insights
Premiums by Size of Acquisition
10%
15%
20%
25%
30%
35%
40%
45%
50%
<$500mm $500mm-$1,000mm
$1,001mm-$5,000mm >$5,000mm
Larger companies ($500mm+ transaction values) have received 15-20% premiums in 2017 – YTD2018
Smaller company (<$500mm transaction values) premiums continue to be meaningfully higher than those of larger deals
At 26%, the smaller company premium is at its lowest level since 2006
Over the past two years, there has been a noticeable convergence of premium percentages for transactions larger than $500mm
Median Premium by Transaction Value
Source: FactSetNote: Premium data presented as five day premiums. Premium data includes all public pending / closed deals with U.S. targets.

6
U.S. M&A Quarterly Insights
Percentage of 52-Week High Analysis
Source: FactSetNote: Premium data presented as five day premiums. Premium data includes all public pending / closed deals with U.S. targets.
83%
88%
62% 64%
83% 81% 79%
88% 87% 83% 80%
87% 85%
24% 24%
36% 37% 38% 36% 37%
28% 26% 27%
33%
22% 21%
--
20%
40%
60%
80%
100%% of 52 Week High 5 Day Premium
Since the onset of the bull market in late 2009, equities of publicly traded acquired companies have consistently been trading around 80-85% of 52-week highs just prior to announcement of acquisition
Although the equity markets have traded near 52-week highs for much of this decade, premiums have continued to compress, as buyers have been less willing to pay fulsome premiums on top of high underlying trading multiples
Target boards and selling shareholders have become more comfortable with accepting lower premiums given the following:
Uncertainty about the duration of the current bull market and economic expansion, which influences confidence in organic growth visibility
Focus on historically strong acquisition EBITDA multiples
Deprioritizing a high acquisition premium given the above as well as the target’s historically strong stock prices
Five Day Premium vs. % of 52-Week High

7
U.S. M&A Quarterly Insights
Historical Transaction Trending Analysis
Source: FactSetNote: Premium data includes all public pending / closed deals with U.S. targets. Additionally, transaction multiple data only includes transactions with EV / LTM EBITDA multiples between 3x and 40x. All data presented is median data.
15% 15% 15%
13%
17%
16%
16%
17%
22%
2%
1%
8%
4% 4% 3% 2% 3% 3%
9% 10%
7%
5%
9%
5% 6%
5% 5%
18%
26%
18%
14%
20%
16%
23%
17%
18%
--
5%
10%
15%
20%
25%
30%
2010 2011 2012 2013 2014 2015 2016 2017 YTD2018
LTM EBITDA Margin 3-Year Historical Revenue Growth
NTM Revenue Growth NTM EBITDA Growth
Although there has been significant multiple expansion in the broader M&A market since the Great Recession, the underlying fundamentals of these public M&A targets have not dramatically improved
As a result, acquirers on average are paying higher transaction multiples in the current M&A market for similar quality businesses as have been available in the past
Clearly, buyers are pricing risk differently in the current M&A market
Median Statistics of Publicly Acquired Companies

8
U.S. M&A Quarterly Insights
Strategic vs. Sponsor Transaction Multiples and Premiums
Source: FactSetNote: Premium data includes all public pending / closed deals with U.S. targets. Additionally, transaction multiple data only includes transactions with EV / LTM EBITDA multiples between 3x and 40x. All data presented is median data.
37
%
40
%
39
%
38
%
40
%
31
%
29
%
28%
33
%
23
%
21
% 2
8%
32
%
33%
29
%
22
%
21
%
13
% 18%
25
%
17
%
21
%
Strategic Sponsor
12.4
x
10
.7x
10
.5x
11.
4x
10
.3x
11.
3x
12
.2x
13
.3x
12
.9x
13
.8x
13.0
x
11
.1x
7.4
x
7.7
x
9.6
x
8.9
x
8.9
x
10.8
x
12
.2x
8.4
x
9.9
x 11
.9x
Strategic Sponsor
Strategic vs. Sponsor LTM Transaction Multiples
Over the past 15 years, the median acquisition multiple and acquisition premium of strategic buyers have exceeded that of sponsor buyers by ~2.5x and ~700bps, respectively
Several interesting underlying trends are apparent when comparing strategic to sponsor buyers over the past several years
YTD2018 median purchase premium is 21% for each of strategic and sponsor buyers – the last time the median sponsor premium exceeded that of the median strategic premium was in 2003
While strategic buyers have historically paid higher multiples than sponsors, they have been acquiring businesses with higher margins and growth profiles (refer to pages 9-10)
While median sponsor acquisition multiples have been increasing, median strategic multiples have remained relatively flat
Strategic vs. Sponsor Five Day Premiums

9
U.S. M&A Quarterly Insights
Financial Sponsor Acquisitions
Over the last three years, there has been a steady increase in the median transaction multiples that sponsors have paid for public company acquisitions
Based on historical analysis since 2010, there appears to be a strong correlation between the EBITDA margin of public companies acquired by financial buyers and the median EV / LTM EBITDA transaction multiple paid
Given the growth profile of the companies acquired by financial sponsors over the last few years has not dramatically changed, improving target EBITDA margins are the largest driver of the observed multiple expansion
With the decrease in sponsor underwritten returns in today’s M&A market, sponsors could be gravitating toward higher margin and more stable businesses as they seek to reduce operating risk
While growth is traditionally thought of as the largest driver of value, sponsor risk profile is changing as buyers are willing to pay premiums for higher EBITDA margin companies
In light of more modest topline growth expectations, the ability to execute on an acquisition strategy is also increasingly important to sponsors as a strategy to drive future growth
--
4%
8%
12%
16%
20%
--
2.0x
4.0x
6.0x
8.0x
10.0x
12.0x
14.0x
EV / LTM EBITDA Multiple LTM EBITDA Margin
15% 16%
11%
12% 14%
18%
11%
14%
17%
2% 1%
5% 3% 3%
4% 4%
3%
4%
7% 6% 6%
3% 4%
7%
10%
5%
2%
--
5%
10%
15%
20%
2010 2011 2012 2013 2014 2015 2016 2017 YTD2018
LTM EBITDA Margin 3-Year Historical Revenue Growth
NTM Revenue Growth
Operating Metrics for Financial Sponsor Acquisitions
Multiples and Margins for Financial Sponsor Acquisitions
Source: FactSet
Note: Premium data includes all public pending / closed deals with U.S. targets. Additionally, transaction multiple data only includes transactions with EV / LTM EBITDA multiples between 3x and 40x. All data presented is median data.

10
U.S. M&A Quarterly Insights
Strategic Buyer Acquisitions
Source: FactSet
Note: Premium data includes all public pending / closed deals with U.S. targets. Additionally, transaction multiple data only includes transactions with EV / LTM EBITDA multiples between 3x and 40x. All data presented is median data.
14% 15% 16%
14%
17%
15%
17% 17%
22%
2% 0%
8%
4% 4%
3% 2% 3% 3%
11% 11%
7%
5%
11%
5% 5% 5% 5%
10.5x
11.4x
10.3x
11.3x12.2x
13.3x12.9x
13.8x13.0x
0.0x
3.0x
6.0x
9.0x
12.0x
15.0x
--
5%
10%
15%
20%
25%
30%
LTM EBITDA Margin 3-Year Historical Revenue Growth
NTM Revenue Growth EV / LTM EBITDA Multiple
Given the relatively consistent target operating profile over the last few years, we are not surprised that the median strategic buyer acquisition multiple has remained relatively constant
The most pronounced change is the rapidly increasing EBITDA margin profile in YTD2018
Interestingly, strategics are buying businesses with higher median LTM EBITDA margin and revenue growth than sponsors
Operating Metrics for Strategic Acquisitions
Operating Metric Premiums for Strategic vs. Sponsor Acquisitions
(0%) (1%)
4%
2%
4%
(3%)
7%
3%
5% 5%
4%
2%
2%
6%
(2%)
(4%)
(0%)
3%
(5%)
--
5%
10%
2010 2011 2012 2013 2014 2015 2016 2017 YTD2018
LTM EBITDA Margin NTM Revenue Growth

11
U.S. M&A Quarterly Insights
Quartile Analysis
Source: FactSet
Note: Premium data includes all public pending / closed deals with U.S. targets. Additionally, transaction multiple data only includes transactions with EV / LTM EBITDA multiples between 3x and 40x. All data presented is median data.
Bottom Quartile represents the 25% of transactions in a given year with the smallest EV / LTM EBITDA transaction multiple.
Top Quartile represents the 25% of transactions in a given year with the largest EV / LTM EBITDA transaction multiple.
12.9x 12.3x
16.4x
13.9x
15.5x 16.1x 15.7x
17.7x
16.0x
8.0x
10.0x
12.0x
14.0x
16.0x
18.0x
20.0x
2010 2011 2012 2013 2014 2015 2016 2017 YTD2018
(5%)
--
5%
10%
15%
20%
25%
2010 2011 2012 2013 2014 2015 2016 2017 YTD2018
--
5%
10%
15%
20%
25%
2010 2011 2012 2013 2014 2015 2016 2017 YTD2018
LTM EBITDA Margin 3-Year Historical Revenue Growth NTM Revenue Growth
6.3x 7.2x 5.5x 6.2x 6.6x 7.3x 6.1x 7.5x 7.3x
19.2x 19.5x 21.9x
20.1x 22.1x 23.3x
21.8x 25.2x
23.3x
--
5.0x
10.0x
15.0x
20.0x
25.0x
30.0x
2010 2011 2012 2013 2014 2015 2016 2017 YTD2018
Bottom Quartile Top Quartile Since the Great Recession, while buyers have been increasingly willing to pay greater EBITDA multiples for higher quality businesses, we’ve observed little multiple expansion in the bottom quartile of transaction multiples
The relative multiple expansion can most easily be observed by comparing the medians of the top and bottom quartiles of EV / LTM EBITDA transaction multiples
The increasing delta between these two metrics shows the divergence that is becoming quite apparent in the market
The current frothy M&A market does not apply to more challenging business profiles, where the market is not seeing an appreciable increase in valuation
While top quartile transaction multiple businesses continue to display higher quality fundamentals, there appears to be little in the historical trends to explain the divergence in transaction multiples that we are observing in the market
EV / LTM EBITDA Transaction Multiple Quartile Medians
Delta Between Top and Bottom Quartiles
Top Quartile Median
Bottom Quartile Median

12
U.S. M&A Quarterly Insights
Quartile Analysis (cont’d)
Source: FactSet
Note: Premium data includes all public pending / closed deals with U.S. targets. Additionally, transaction multiple data only includes transactions with EV / LTM EBITDA multiples between 3x and 40x. All data presented is median data.
Bottom Quartile represents the 25% of transactions in a given year with the smallest EV / LTM EBITDA transaction multiple.
Top Quartile represents the 25% of transactions in a given year with the largest EV / LTM EBITDA transaction multiple.
7%
17%
26%
16% 16% 17%
7%
14%11%
9%
4%
--
5%
10%
15%
20%
25%
30%
--
10%
20%
30%
40%
50%
60%
Bottom Quartile Top Quartile
6.0x
8.0x
10.0x
12.0x
14.0x
16.0x
Bottom Quartile Top Quartile
Buyers are placing a greater value on scaled businesses
Since the Great Recession, buyers have been willing to ascribe increasingly greater multiples to the largest quartile of companies
LTM EBITDA Multiples Based on Target Transaction Value
LTM EBITDA Delta Between Top and Bottom Quartiles
5 Day Premiums Delta Between Bottom and Top Quartiles
5 Day Premiums Based on Target Transaction Value
1.6x
2.9x
0.4x
1.6x
2.4x
1.4x
3.7x
5.2x
3.9x
1.1x
4.9x
--
1.0x
2.0x
3.0x
4.0x
5.0x
6.0x
The EBITDA multiple differential between the largest and smallest quartiles has increased to 3.8x EV / LTM EBITDA over the last five years vs. only 1.7x EV / LTM EBITDA over the preceding five year period
The expanding EBITDA multiple premium paid for top vs. bottom quartile sized targets does not translate into stock price purchase premium differential
While historically the smallest quartile businesses were acquired at significantly higher purchase premiums than largest quartile businesses, this spread has compressed to its lowest levels since the onset of the Great Recession

13
U.S. M&A Quarterly Insights
About Us: BMO Capital Markets
• As a member of BMO Financial Group (NYSE, TSX: BMO), we leverage the financial strength and capabilities of one of North America’s leading financial services organizations.
• BMO Capital Markets is a single-stop provider. Depending on your needs, you may use a combination of our capabilities, or only one. Our experience and deep sector knowledge enable us to develop the solution that fits you best.
Access to capital Initial public offerings
Debt financing
Equity financing
Private equity financing
Corporate lending
Structured & project financing
Securitization
Distribution Institutional
Equity sales & trading Fixed income sales & trading
Retail Direct brokerage Private banking
Strategy & growth Strategic advisory
Mergers & acquisitions, including cross-border opportunities
Valuations & fairness opinions
Acquisition & divestitures
Leverage buyouts
Restructurings & recapitalizations
Take-over & activism defense
Share buybacks
Joint ventures and otherpartnership models
Treasury & risk management Commodity products
Money markets
Trade finance
Cash management
Foreign exchange
Research Economics
Commodities
Debt
Corporate
Americas Europe & Middle East
AtlantaBostonCalgaryChicagoDenverHoustonMexico CityMilwaukeeMinneapolisMontrealNew YorkRio de JaneiroSan FranciscoSeattleTorontoVancouverWashington, D.C.
Abu DhabiDublinLondonParisZurich
Asia & Australia
BeijingGuangzhouHong KongMelbourneMumbaiShanghaiSingaporeTaipei
2,500+professionals
30locations
5continents
We offer a complete suite of products and services:
Note: As of July 31, 2018.

14
U.S. M&A Quarterly Insights
BMO M&A Overview and Recent Highlights
Experienced Team
Global M&A practice with ~100 M&A professionals in nine offices around the world, with ~70 M&A professionals in the U.S.
Including over 40 Managing Directors and Directors
Proven Results
US$337 billion of transaction value in 480+ deals since 2011(1)
Approach
Deep sector expertise in close alignment with BMO’s industry groups
M&A professionals partner with industry experts to drive enhanced insights and execution
Full Product Capabilities
Sell-side, buy-side and cross-border advisory
Recapitalizations and restructurings
Fairness opinions
Takeover defense
Activism defense
Leveraged and management buyouts
Strategic alternatives review
Financial Advisor
Sale of Medical Office Building portfolio to
January 2018
US$400 million
US$370 millionSale of the rights to USL261 to
Financial Advisor
June 2018
Financial Advisor
Acquisition of
December 2017
US$500 million
Financial Advisor
Acquisition ofBrocade Communications Systems,
Inc.
November 2017
US$5.9 billion
Financial Advisor
Acquisition of
Americas
May 2018
US$1.3 billion
Financial Advisor
Sale to
May 2018
US$245 million
Special Advisorto Board of Columbus
Sale to
November 2017
US$850 million
Financial Advisor
Sale to
April 2018
US$825 million
Financial Advisor
to
Pending
Financial Advisor
Acquisition of
Merchants’ Choice Payment Solutions
August 2017
US$470 million
Financial Advisor
Sale to
Subsidiary of
October 2017
On its sale of a controllinginterest in
January 2018
Financial Advisor
To a Lovell Minnick Partners – led buyer group
Financial Advisor
Sale of D+H Collateral
Management Services business to
August 2018
Portfolio Company of
Portfolio Company of
Financial Advisor
Sale to
October 2017
C$2.6 billionSale of
1. Bloomberg, completed deals where an acquirer or target is located in North America. Market data as of August 01, 2018.

15
U.S. M&A Quarterly Insights
Contacts
Rob StewartManaging DirectorCo-Head of U.S. Mergers & AcquisitionsNew York, NYTel.: (212) [email protected]
Eric NicholsonManaging DirectorHead of Middle MarketMergers & AcquisitionsMinneapolis, MNTel.: (612) [email protected]
Geoff BarskyManaging DirectorHead of Canadian & International M&AToronto, ONTel.: (416) [email protected]
Seth ProsticManaging DirectorCo-Head of U.S.Mergers & AcquisitionsChicago, IL Tel.: (312) [email protected]
Lyle WilponManaging DirectorHead of Global Advisory New York, NYTel.: (212) [email protected]
These materials are confidential and proprietary to, and may not be reproduced, disseminated or referred to, in whole or in part without the prior consent of BMO Capital Markets (“BMO”). These materials have been prepared exclusively for the BMO client or potential client to which such materials are delivered and may not be used for any purpose other than as authorized in writing by BMO. BMO assumes no responsibility for verification of the information in these materials, and no representation or warranty is made as to the accuracy or completeness of such information. BMO assumes no obligation to correct or update these materials. These materials do not contain all information that may be required to evaluate, and do not constitute a recommendation with respect to, any transaction or matter. Any recipient of these materials should conduct its own independent analysis of the matters referred to herein.
BMO Capital Markets is a trade name used by BMO Financial Group for the wholesale banking businesses of Bank of Montreal, BMO Harris Bank N.A. (member FDIC), Bank of Montreal Ireland p.l.c, and Bank of Montreal (China) Co. Ltd and the institutional broker dealer businesses of BMO Capital Markets Corp. (Member FINRA and SIPC) in the U.S., BMO Nesbitt Burns Inc. (Member Investment Industry Regulatory Organization of Canada and Member Canadian Investor Protection Fund) in Canada and Asia and BMO Capital Markets Limited (authorised and regulated by the Financial Conduct Authority) in Europe and Australia. “BMO Capital Markets” is a trademark of Bank of Montreal, used under license.
® Registered trademark of Bank of Montreal in the United States, Canada and elsewhere.
™ Trademark of Bank of Montreal in the United States and Canada.
BMO does not provide tax or legal advice. Any discussion of tax matters in these materials (i) is not intended to be used, and cannot be used or relied upon, for the purposes of avoiding any tax penalties and (ii) may have been written in connection with the “promotion or marketing” of the transaction or matter described herein. Accordingly, the recipient should seek advice based on its particular circumstances from an independent tax advisor.
18-1696MM