Embed Size (px)
Citation preview


U.S. International Trade Commission
Robert A. RogowskyDirector of Operations
COMMISSIONERS
Address all communications toSecretary to the Commission
United States International Trade CommissionWashington, DC 20436
Deanna Tanner Okun, Vice ChairmanStephen Koplan, Chairman
Marcia E. MillerJennifer A. HillmanCharlotte R. LaneDaniel R. Pearson
Karen Laney-CummingsDirector of Industries

U.S. International Trade Commission
Washington, DC 20436
April 2005
www.usitc.gov
Publication 3761
Air and Noise PollutionAbatement Services:
An Examination of U.S. and Foreign Markets
Investigation No. 332-461

This report was principally prepared by the Office of Industries
Project Team
Jennifer Baumert, Project [email protected]
Eric Forden, Deputy Project [email protected]
Judith Dean, Economist
Staff assigned:William Chadwick, Lisa Ferens, David Ingersoll, Dennis Luther, Christopher Mapes,
Erick Oh, Robert Randall, and Ben Randol
Office of OperationsPeg MacKnight
With special assistance from:Lynette Gabourel and Cynthia Payne
Primary ReviewersAlan Fox and Mark Paulson
under the direction ofRichard Brown, Chief
Services and Investment Division

i
ABSTRACT
As requested by the United States Trade Representative (USTR), this report examinesglobal markets for air and noise pollution abatement services and trade in these servicesmarkets for the purpose of providing information that would be useful in conductingtrade negotiations and environmental reviews. The report indicates that demand for airand noise pollution abatement services is driven largely by government regulation andenforcement efforts, and to a lesser extent, by international treaty obligations, publicsentiment, and private-sector financial resources. The majority of air pollution abatementservices are reportedly delivered in conjunction with air pollution control equipment,with European, Japanese, and U.S. firms being the dominant suppliers of such servicesand equipment. Emissions trading, a financial service associated with air pollutionabatement, is a newly emerging market that is gaining acceptance in developedcountries. The market for noise pollution abatement services is small, as such pollutionis often addressed through product standards, environmental and labor regulation,scheduling, and zoning restrictions.


iii
Table of ContentsPage
Abstract . . . . . . . . . . . . . . . . . . . . . . . . . . . . . . . . . . . . . . . . . . . . . . . . . . . . . . . . . . . . . . . . . . i
Executive summary . . . . . . . . . . . . . . . . . . . . . . . . . . . . . . . . . . . . . . . . . . . . . . . . . . vii
Acronyms and chemicals symbols . . . . . . . . . . . . . . . . . . . . . . . . . . . . . . . ix
Chapter 1. Introduction . . . . . . . . . . . . . . . . . . . . . . . . . . . . . . . . . . . . . . . . . . . . . 1-1
Purpose . . . . . . . . . . . . . . . . . . . . . . . . . . . . . . . . . . . . . . . . . . . . . . . . . . . . . . . . . . . . . . . . . . . 1-1Air pollution abatement . . . . . . . . . . . . . . . . . . . . . . . . . . . . . . . . . . . . . . . . . . . . . . . . . . . . . . 1-2Noise pollution abatement . . . . . . . . . . . . . . . . . . . . . . . . . . . . . . . . . . . . . . . . . . . . . . . . . . . . 1-3Air and noise pollution abatement services in the World Trade Organization . . . . . . . . . . . . 1-4Scope . . . . . . . . . . . . . . . . . . . . . . . . . . . . . . . . . . . . . . . . . . . . . . . . . . . . . . . . . . . . . . . . . . . . 1-4Methodological approach . . . . . . . . . . . . . . . . . . . . . . . . . . . . . . . . . . . . . . . . . . . . . . . . . . . . . 1-5Organization . . . . . . . . . . . . . . . . . . . . . . . . . . . . . . . . . . . . . . . . . . . . . . . . . . . . . . . . . . . . . . . 1-9
Chapter 2. Literature review . . . . . . . . . . . . . . . . . . . . . . . . . . . . . . . . . . . . . . 2-1
Monitoring and testing . . . . . . . . . . . . . . . . . . . . . . . . . . . . . . . . . . . . . . . . . . . . . . . . . . . . . . . 2-1Impact of monitoring and enforcement on environmental performance . . . . . . . . . . . . . 2-1Impact of public disclosure programs . . . . . . . . . . . . . . . . . . . . . . . . . . . . . . . . . . . . . . . 2-3
Permit trading . . . . . . . . . . . . . . . . . . . . . . . . . . . . . . . . . . . . . . . . . . . . . . . . . . . . . . . . . . . . . 2-4Efficiency in design . . . . . . . . . . . . . . . . . . . . . . . . . . . . . . . . . . . . . . . . . . . . . . . . . . . . . 2-5Effectiveness in practice . . . . . . . . . . . . . . . . . . . . . . . . . . . . . . . . . . . . . . . . . . . . . . . . . 2-6
Abatement technology . . . . . . . . . . . . . . . . . . . . . . . . . . . . . . . . . . . . . . . . . . . . . . . . . . . . . . . 2-8Impact of environmental regulations on technological innovation and diffusion . . . . . . 2-8Type of environmental regulation and technological innovation and diffusion . . . . . . . 2-10
References . . . . . . . . . . . . . . . . . . . . . . . . . . . . . . . . . . . . . . . . . . . . . . . . . . . . . . . . . . . . . . 2-11
Chapter 3. Factors affecting supply and demand . . . . . . . . . . . 3-1
Factors affecting supply . . . . . . . . . . . . . . . . . . . . . . . . . . . . . . . . . . . . . . . . . . . . . . . . . . . . . . 3-1Factors affecting demand . . . . . . . . . . . . . . . . . . . . . . . . . . . . . . . . . . . . . . . . . . . . . . . . . . . . . 3-2

iv
Table of Contents–Continued Page
Chapter 4. Air pollution abatement servicesand equipment . . . . . . . . . . . . . . . . . . . . . . . . . . . . . . . . . . . . . . . . . . . . . . . . . . . 4-1
Technologies and methods . . . . . . . . . . . . . . . . . . . . . . . . . . . . . . . . . . . . . . . . . . . . . . . . . . . . . 4-3Market size and characteristics . . . . . . . . . . . . . . . . . . . . . . . . . . . . . . . . . . . . . . . . . . . . . . . . . . 4-5Key suppliers and consumers . . . . . . . . . . . . . . . . . . . . . . . . . . . . . . . . . . . . . . . . . . . . . . . . . . . 4-8Related equipment . . . . . . . . . . . . . . . . . . . . . . . . . . . . . . . . . . . . . . . . . . . . . . . . . . . . . . . . . . . . 4-9Trade and investment . . . . . . . . . . . . . . . . . . . . . . . . . . . . . . . . . . . . . . . . . . . . . . . . . . . . . . . . . 4-10
Chapter 5. Emissions trading . . . . . . . . . . . . . . . . . . . . . . . . . . . . . . . . . . . . 5-1
Introduction . . . . . . . . . . . . . . . . . . . . . . . . . . . . . . . . . . . . . . . . . . . . . . . . . . . . . . . . . . . . . . . 5-1Market segments . . . . . . . . . . . . . . . . . . . . . . . . . . . . . . . . . . . . . . . . . . . . . . . . . . . . . . . . . . . 5-3The U.S. Acid Rain Program (U.S. SO2 Program ) . . . . . . . . . . . . . . . . . . . . . . . . . . . . . . . . . 5-4The European Union Emissions Trading Scheme (EU ETS) . . . . . . . . . . . . . . . . . . . . . . . . . . 5-9
Overview . . . . . . . . . . . . . . . . . . . . . . . . . . . . . . . . . . . . . . . . . . . . . . . . . . . . . . . . . . . . . 5-9Market characteristics . . . . . . . . . . . . . . . . . . . . . . . . . . . . . . . . . . . . . . . . . . . . . . . . . . . 5-11Market participants . . . . . . . . . . . . . . . . . . . . . . . . . . . . . . . . . . . . . . . . . . . . . . . . . . . . . 5-12Market activity . . . . . . . . . . . . . . . . . . . . . . . . . . . . . . . . . . . . . . . . . . . . . . . . . . . . . . . . . 5-14
The United Kingdom Emissions Trading Scheme (UK-ETS) . . . . . . . . . . . . . . . . . . . . . . . . . 5-16Chicago Climate Exchange (CCX) . . . . . . . . . . . . . . . . . . . . . . . . . . . . . . . . . . . . . . . . . . . . . 5-17Trade and investment . . . . . . . . . . . . . . . . . . . . . . . . . . . . . . . . . . . . . . . . . . . . . . . . . . . . . . . . 5-18Market outlook . . . . . . . . . . . . . . . . . . . . . . . . . . . . . . . . . . . . . . . . . . . . . . . . . . . . . . . . . . . . . 5-21
Chapter 6. Noise pollution abatement servicesand equipment . . . . . . . . . . . . . . . . . . . . . . . . . . . . . . . . . . . . . . . . . . . . . . . . 6-1
Introduction . . . . . . . . . . . . . . . . . . . . . . . . . . . . . . . . . . . . . . . . . . . . . . . . . . . . . . . . . . . . . . . 6-1Technologies and methods . . . . . . . . . . . . . . . . . . . . . . . . . . . . . . . . . . . . . . . . . . . . . . . . . . . . 6-2Market size and characteristics . . . . . . . . . . . . . . . . . . . . . . . . . . . . . . . . . . . . . . . . . . . . . . . . . 6-5Key suppliers and consumers . . . . . . . . . . . . . . . . . . . . . . . . . . . . . . . . . . . . . . . . . . . . . . . . . . 6-6Related equipment . . . . . . . . . . . . . . . . . . . . . . . . . . . . . . . . . . . . . . . . . . . . . . . . . . . . . . . . . . 6-6Trade and investment . . . . . . . . . . . . . . . . . . . . . . . . . . . . . . . . . . . . . . . . . . . . . . . . . . . . . . . . 6-7
Chapter 7. Summary of findings . . . . . . . . . . . . . . . . . . . . . . . . . . . . . . . . . 7-1
v
Table of Contents–ContinuedPage
AppendicesA. Request letter . . . . . . . . . . . . . . . . . . . . . . . . . . . . . . . . . . . . . . . . . . . . . . . . . . . . . . . . . . . . . . . A-1B. Federal Register notice . . . . . . . . . . . . . . . . . . . . . . . . . . . . . . . . . . . . . . . . . . . . . . . . . . . . . . . B-1C. Cleaning services of exhaust gases and noise abatement services in the General
Agreement on Trade in Services . . . . . . . . . . . . . . . . . . . . . . . . . . . . . . . . . . . . . . . . . . . . . C-1D. Country summaries . . . . . . . . . . . . . . . . . . . . . . . . . . . . . . . . . . . . . . . . . . . . . . . . . . . . . . . . . . D-1E. Position of interested party . . . . . . . . . . . . . . . . . . . . . . . . . . . . . . . . . . . . . . . . . . . . . . . . . . . . E-1F. Glossary . . . . . . . . . . . . . . . . . . . . . . . . . . . . . . . . . . . . . . . . . . . . . . . . . . . . . . . . . . . . . . . . . . . F-1
Boxes4-1. U.S. EPA-listed industrial emitters equipment, sorted by OECD classification . . . . . . . . . 4-115-1. Emissions trading vs. command-and-control: Examples of potential cost savings . . . . . . 5-35-2. Regional emissions trading schemes . . . . . . . . . . . . . . . . . . . . . . . . . . . . . . . . . . . . . . . . . . 5-75-3. Anatomy of an EUA brokered trade . . . . . . . . . . . . . . . . . . . . . . . . . . . . . . . . . . . . . . . . . . 5-13
Figures1-1. Air and noise pollution abatement services: Core and cluster services . . . . . . . . . . . . . . . . . . 1-63-1. GDP per capita and industry perceptions of air pollution regulations, by country, 2003 . . . . 3-73-2. Per capita GDP and CO2 emissions, by country, 2002 . . . . . . . . . . . . . . . . . . . . . . . . . . . . . . . 3-85-1. U.S. SO2 Program, allowances prices and volumes arranged through brokers,
January 2002-January 2005 . . . . . . . . . . . . . . . . . . . . . . . . . . . . . . . . . . . . . . . . . . . . . . . . 5-105-2. EU emissions trading scheme, EU allowance prices and volumes arranged through
brokers, July 2003-January 2005 . . . . . . . . . . . . . . . . . . . . . . . . . . . . . . . . . . . . . . . . . . . . 5-155-3. Chicago Climate Exchange, volumes by month and vintage, 2004 . . . . . . . . . . . . . . . . . . . . . 5-195-4. Chicago Climate Exchanges prices and volumes traded during January 2004-
December 2004 . . . . . . . . . . . . . . . . . . . . . . . . . . . . . . . . . . . . . . . . . . . . . . . . . . . . . . . . . 5-20
Tables1-1. Data sources: Air and noise pollution abatement . . . . . . . . . . . . . . . . . . . . . . . . . . . . . . . . . . . 1-83-1. Factors affecting supply and demand in the air and noise pollution abatement services and
goods industries . . . . . . . . . . . . . . . . . . . . . . . . . . . . . . . . . . . . . . . . . . . . . . . . . . . . . . . . . 3-124-1. Characteristic of selected country markets for air pollution abatement services
and goods . . . . . . . . . . . . . . . . . . . . . . . . . . . . . . . . . . . . . . . . . . . . . . . . . . . . . . . . . . . . . . 4-145-1. Comparison of emissions trading schemes . . . . . . . . . . . . . . . . . . . . . . . . . . . . . . . . . . . . . . . . 5-5


OMB No.: 3117--0188
04/05
ITC READER SATISFACTION SURVEYAir and Noise Pollution Abatement Services:An Examination of U.S. and Foreign Markets
The U.S. International Trade Commission (USITC) is interested in your voluntary com-ments (burden less than 10 minutes) to help assess the value and quality of our reports, and to assistin improving future products. Please return survey by facsimile (202-205-2359) or by mail to theUSITC, or visit the USITC Internet home page(http://reportweb.usitc.gov/reader_survey/readersurvey.html) to electronically submit a Web version ofthe survey.
(Please print; responses below not for attribution):
Your name and title:
Organization (if applicable):
Which format is most useful to you? - CD-ROM - Hardcopy - USITC Internet site
Circle your assessment of each factor below: SA = strongly agree, A = agree, N = no opinion,D = disagree, or SD = strongly disagree.
Value of this report:" Statistical data are useful SA A N D SD. . . . . . . . . . . . . . . . . . . . . . . . . . . . . ." Other non-numerical facts are useful SA A N D SD. . . . . . . . . . . . . . . . . . ." Analysis augments statistical data/other facts SA A N D SD. . . . . . . . . . . ." Relevant topic(s)/subject matter SA A N D SD. . . . . . . . . . . . . . . . . . . . . . . ." Primary or leading source of information on this subject SA A N D SD. .
Quality of this report:" Clearly written SA A N D SD. . . . . . . . . . . . . . . . . . . . . . . . . . . . . . . . . . . . . . ." Key issues are addressed SA A N D SD. . . . . . . . . . . . . . . . . . . . . . . . . . . . . . ." Charts and graphs aid understanding SA A N D SD. . . . . . . . . . . . . . . . . . ." References cite pertinent sources SA A N D SD. . . . . . . . . . . . . . . . . . . . . . .
Other preferred source of information on this subject:
Specify chapters, sections, or topics in report that are most useful:
Identify any type of additional information that should have been included in report:
Suggestions for improving report:
Please update your mailing and electronic addresses below (voluntary)-
Mailing address:
City, state, and zip code:
E-mail address:

UNITED STATESINTERNATIONAL TRADE COMMISSION
WASHINGTON, DC 20436
OFFICIAL BUSINESSPENALTY FOR PRIVATE, USE $300
FOLD
NO POSTAGENECESSARYIF MAILEDIN THE
UNITED STATES
BUSINESS REPLY MAILFIRST CLASS PERMIT NO. 12840 WASHINGTON, DC
POSTAGE WILL BE PAID BY ADDRESSEE
U.S INTERNATIONAL TRADE COMMISSION500 E STREET, SW.WASHINGTON, DC 20277--2840
ATTN:OFFICE OF INDUSTRIESAir and Noise Pollution Abatement Services:An Examination of U.S. and Foreign Markets

vii
EXECUTIVE SUMMARY Demand for air pollution abatement services and equipment is driven largely bygovernment regulation and enforcement activities and, to a lesser extent, internationalobligations, financial resources, and public sentiment. In most countries, air pollutionregulations limit emissions on a range of air pollutants. Regulatory regimes andenforcement measures in developed countries are typically more stringent, compared todeveloping countries. Evidence indicates that as incomes grow, regulatory stringencyincreases, driving demand for air pollution goods and services. In developed countries,while air pollution regulations have generally been passed at the national level,implementation and enforcement action is being devolved to subnational governments.By contrast, developing countries tend to enact, implement, and enforce air pollutioncontrol regulations at the national level. This distinction may impact the provision ofgoods and services, as providers may be forced to comply with several different sets ofstandards among states, rather than just one set of regulations at the national level.
Noise pollution abatement also is driven by government regulations. In most countries,noise pollution is typically a low priority issue, although laws and regulations in thissector tend to be more advanced in developed countries. Noise pollution is oftenaddressed by product standards and/or environmental and labor laws.
Air pollution abatement goods and services are frequently supplied to customers as partof a single transaction, with goods accounting for the majority of the sale. In addition,a significant share of the services provided to abate air pollution are classified inindustries other than the core air pollution abatement services sector, such as engineeringand construction. Markets for air pollution abatement goods and services in developedcountries tend to be highly competitive and are supplied by several hundred small,private-sector firms. By contrast, developing countries are reliant upon imports of suchgoods and services, often resulting in a limited selection in terms of technology, cost,and suitability for pollution control requirements. Nonetheless, many developing-country markets, including China, India, Poland, and Turkey, are considered to offergood prospects for growth.
The United States, the European Union, China, and Japan are the largest consumers ofair pollution abatement services and equipment accounting for approximately 28 percent,18 percent, 15 percent, and 6 percent of this combined market, respectively. U.S. firmsare estimated to be the dominant suppliers of air pollution abatement services in theworld market, while firms from the European Union are likely the dominant suppliersof core air pollution abatement equipment. Overall, there are few trade barriers in eitherdeveloped-or developing-country markets directly related to air pollution abatementservices. Tariff rates on air pollution abatement equipment in developed countries tendto be lower than such tariffs in developing countries. There are no discrete data oninvestment in the air pollution abatement services and goods sectors.
Emissions permit trading is a market-based alternative to the traditional command-and-control approach to air pollution abatement, under which regulatory authorities compelpolluters to install cleaner technologies or attain source-specific emissions reductions.Although command-and-control regulations remain the principal means of addressingair pollution, emissions permit trading is gaining acceptance as a method for reducingair pollution, primarily in the United States and Europe. The primary approach to

viii
emissions trading is the “cap and trade” approach. Under such an approach, a regulatoryauthority establishes a desired “cap” on the overall amount of a specific air pollutantemitted by a group of installations during a compliance period. Emissions allowancesare allocated among affected installations, with the total number of issued allowancesequaling the desired cap. At the end of the compliance period, each installation mustpossess allowances sufficient to cover its emissions during the period. Installationswhose emissions fall below the initial allowance allocation may sell excess allowanceson an emissions market. Similarly, installations whose emissions exceed the initialallowance allocation must purchase additional allowances in the emissions market. Withthe exception of the U.S. Acid Rain Program, emissions trading markets are in the earlystages of development, and thus, it is unclear what effect these programs will have onthe overall market for air pollution abatement goods and services. The European UnionEmissions Trading Scheme, which was launched in January 2005, is the most prominentscheme focused on reducing greenhouse gases. Other schemes include the UnitedKingdom Emissions Trading Scheme, the New South Wales Greenhouse Gas AbatementScheme, the NOx Budget Trading Program, and the Chicago Climate Exchange.
The global market for noise pollution abatement services, which is largely confined totesting, measurement, and modeling activities, is extremely small. Providers of suchservices are almost entirely composed of small, specialized engineering and/orconsulting firms. Equipment related to the provision of such services includes measuringand testing equipment, associated computer equipment, and computer software. Thereare no discrete data on trade and investment in the noise pollution abatement servicesmarket. However, the reportedly unprofitable nature of the noise pollution abatementservices and equipment markets, combined with the tendency for such services to beprovided by local suppliers, suggest that there is likely very little, if any, internationaltrade in noise pollution abatement services.

ix
ACRONYMS AND CHEMICALSYMBOLS
AAU Assigned amount unit
APC Air pollution control
ATDS Automotive Testing and Development Systems
BACT Best available control technology
BNA Bureau of National Affairs
BP British Petroleum
CAA Clean Air Act (United States)
CAIR Clean Air Intersate Rule
CBOT Chicago Board of Trade
CCAD Comisión Centroamericana de Ambiente y Desarrollo
CCAP Climate change agreement participants
CCX Chicago Climate Exchange
CDC Centers for Disease Control and Prevention
CDM Clean Development Machanism
CEPA Canadian Environmental Protection Act, The
CER Certified emission reductions
CFC Chlorofluorocarbons
CFI Carbon Financial Instruments
CH4 Methane
CICA Centro de Investigacion Contaminacion Ambiental
CO Carbon monoxide
CO2 Carbon dioxide
CO2 e Carbon dioxide equivalent
CONAMA Conselho Ncaional de Meio Ambiente (Brazil)
CPC Central Product Classification
DEAT Department of Environmental Affairs and Tourism (SouthAfrica)
DOE Department of Energy
DP Direct participants

x
EAS EnriroSafe Australia
EBI Environmental Business International
EC European Communities
ECX Eurpean Climate Exchange
EEA Energy and Environment Analysis, Inc.
EEX European Energy Exchange
EFET European Federation of Energy Traders
EGAT Electricity Generating Authority of Thailand, The (Thailand)
EIA Energy Information Administration
EPA Environmental Protection Agency
ERU Emissions reduction units
ESP Electrostatic precipitator
EU European Union
EU-12 Belgium, Denmark, France, Germany, Greece, Ireland, Italy,Luxembourg, Netherlands, Portugal, Spain, and the UnitedKingdom
EU-15 EU-12 and Austria, Finland, and Sweden
EU-25 EU-15 and Cyprus, Czech Republic, Estonia, Hungary, Latvia,Lithuania, Malta, Poland, Slovakia, and Slovenia
EU-ETS EU Emission Tradeing Scheme
EUA European Union allowance
EXAA Austrian Energy Exchange
FGD Flue gas desulfurization
FIC Foreign Investment Committee, The (Chile)
FIRB Foreign Investment Board
FTA Free Trade Agreement
GAO General Accounting Office
GATS General Agreement on Trade in Services
GCR Global Competitiveness Report, The
GDP Gross domestic product
GHG Greenhouse gases
GWP Global Warming Potential
H2O Water

xi
H2SO4 Sulfuric acid
HAPS Hazardous air pollutants
HFCs Hydroflurocarbons
HS Harmonized System of Product Classification, The
HTK Hotaka Engineering
IAP Indoor air pollution
IBAMA Brazilian Institute of the Environment and Renewable NaturalResources (Brazil)
ICE Centro Nacional de Planificacioin Electrica
IETA International Emissions Trading Association
INPI National Institute for Industrial Property (Brazil)
IPE International Petroleum Exchange
ISDA Internal Swaps and Derivatives Association, Inc.
ISO International Organization for Standardization
JI Joint Implementation
LINCOS Little Intelligent Communities
MARPOL Protocol of 1978 Relating to the International Convention forthe Prevention of Pollution From Ships, 1973 (Korea)
MERCOSUL Mercado Comum do Su, The
MFN Most-favored-nation
MMA Misisterio do Meio Ambiante, The (Brazil)
MVR Montly Violations Reports
N2O Nitrous oxide
NAAQS National Ambient Air Quality Standard
NAP National Allocatoin Plan
NBP NOx Budget Trading Program
NEMA National Environmental Management Act (South Africa)
NGO Non-Government Organization
NO Nitric oxide
NO2 Nitrogen dioxide
NOM Normas Officialas (Mexico)
NOx Nitrogen oxides
NSW Scheme New South Wales GReenhouse Gas Abatement Scheme

xii
O3 Ozone
OECD Organization for Economic Cooperation and Development
OSHA Occupational Safety and Health Act of 1970, The (UnitedStates)
PCV Positive crankcase ventilation
PEMEX Petroleos Mexicanos (Mexico)
PERS Porous elastic road surface
PERT Pilot Emission Reduction Trading (Canada)
PFCs Perfluorocarbons
PM Particulate matter
PM10 Particles with a diameter of 10 microns or less
PM2.5 Particles with a diameter of 2.5 microns or less
PPDA Atmosphere Prevention and Decontamination Plan for theMetropolitan Region
PROPER Program for Pollution Control, Evaluation and Rating
PRTR Law Pollution Release and Transfer Registry Law (Japan)
R&D Research and development
RECLAIM Regional Clean AIr Incentives Market
RECOPE Refinadora Costarricense de Petróleo
RFG Reformulated gasolines
RGGI Regional Greenhouse Gas Initiative
RWDI Rowan Williams Davies & Irwin, Inc.
SAIC Science Application International Corporation (Mexico)
SCR Selective catalytic reduction (United States)
SEMARNAT Ministry of the Enviroment and Natural Resources (Mexico)
SESMA Servicio de Salud Metropolitan del Ambiente (Chile)
SF6 Sulphur hexaflouride
SO2 Sulfur dioxide
SO3 Sulfur trioxide
SOx Sulfur oxides
STPS Ministry of Labor and Social Security, The (Mexico)
TRI U.S. Toxic Release Inventory
UK United Kingdom

xiii
UK-ETS United Kingdom Emission Trading Scheme
UKA United Kingdom allowances
UKA United Kingdom allowance
UNCTAD United Nations Conference on Trade and Development
UNFCCC United Nations Framework Convention on Climate Change
USDOC United States Department of Commerce
USFCS U.S. Foreign Commercial Service
USITC United States International Trade Commission
USTR United States Trade Representative
VOC Volatile organic compounds
WHO World Health Organization
WITS World Integrated Trade Solution
WRI World Resources Institute
WTO World Trade Organization

1 As identified under section 332(g) of the Tariff Act of 1930. 2 See appendix A. 3 The Federal Register Notice pertaining to this investigation can be found in appendix B. 4 Such regulatory practices may include national and subnational environmentalregulations, as well as multinational conventions or agreements on environmental issues thatmay have an effect on the air and noise pollution abatement services markets. 5 For the purposes of this report, “developed” countries include those considered by theWorld Bank to be high-income economies. World Bank, 2003 World Development Indicators(World Bank: Washington D.C., 2003). 6 For the purposes of this report, ‘developing’ countries include those considered by theWorld Bank to be low- and middle-income economies. World Bank, 2003 WorldDevelopment Indicators (World Bank: Washington D.C., 2003).
1-1
CHAPTER 1INTRODUCTION
Purpose
On July 12, 2004, the U.S. International Trade Commission (Commission or USITC)received a request from the United States Trade Representative (USTR) to conduct twoinvestigations1 and provide two reports that would examine discrete segments of theenvironmental and energy services industries. The first investigation is to focus on airand noise pollution abatement services, and the second is to focus on renewable energy.2The findings of this investigation, Air and Noise Pollution Abatement Services: AnExamination of U.S. and Foreign Markets (Inv. No. 332-461),3 are presented in thisreport. As requested by the USTR, this report provides an overview of U.S. and foreignmarkets for air and noise pollution abatement services; examines trade and investmentin these markets, including barriers affecting such trade and investment, if any; andwhere possible, discusses existing regulatory practices that generate demand for thesubject services.4 The report provides information on both developed-5 anddeveloping-country6 markets for air and noise pollution abatement services, and includesexamples—as appropriate—from those economies with which the United States hasestablished, or is in the process of negotiating, a free trade agreement.
As requested, the report also includes, to the extent possible, information on trade andmarket conditions for those goods related to the subject environmental services. Air andnoise pollution abatement services are frequently economic complements to air andnoise pollution abatement goods. For example, many air pollution abatement projectsare unique applications that involve services such as engineering consulting to designunique equipment, which then may be fabricated and installed by the same or anotherfirm. Within these industry sectors, goods include a wide variety of equipment andmechanical devices that reduce, prevent, capture, or destroy pollutants before they arereleased into the atmosphere. Examples of such equipment applicable to air pollutioninclude scrubbers, which remove harmful gases and particulates from exhaust gases;incinerators (or thermal oxidizers), which use intense heat to destroy organiccontaminants; filter collectors, which trap and remove particulates from an exhauststream; and catalysts, which cause chemical reactions that break the pollutants down into

7 Generally, data provided by the McIlvaine Company are based on industry estimates. TheMcIlvaine Company, e-mail received by Commission staff, Dec. 29, 2004. A fuller discussionof all the data presented in this report is found under the heading Methodological Approach,which concludes this chapter. 8 The McIlvaine Company, e-mail received by Commission staff, Dec. 29, 2004. 9 Includes goods and services in pollution control sectors in addition to air and noise.Sandeep Singh, “Trade and Environment Set to Lock Horns at WTO,” The Financial Express,Feb. 3, 2003, found at http://www.teriin.org/features/art183.htm, retrieved Jan. 27, 2005. 10 The McIlvaine Company, World Air Pollution Control Revenue Forecasts, p. 9,document sent to USITC staff via e-mail, received Jan. 4, 2005. 11 Environmental Business International, Inc. (EBI), 1996, found at http://www.ebiusa.com,retrieved Jan. 6, 2005. 12 SOx, oxides of sulfur, includes primarily sulfur dioxide (SO2) and sulfur trioxide (SO3).SO2 forms when sulfur (all fossil fuels contain sulfur) is burned. The resulting fine particulatematter pollution can inhibit visibility, lead to acid rain, and adversely affect human health. 13 NOx, oxides of nitrogen, includes primarily nitrogen dioxide (NO2) and nitric oxide(NO). NO2 is a respiratory irritant, and also a precursor to ozone (smog) formation. The mainsource of NOx emissions are combustion sources, such as cars, power plants, and industrialengines. U.S. Environmental Protection Agency (EPA), found athttp://www.epa.gov/region09/air/permit/defn.htm, retrieved Dec. 28, 2004.
1-2
less harmful by-products. Goods applicable to noise pollution include engine mufflers,highway noise barriers, and ear plugs and other hearing protectors.
Air Pollution AbatementThe worldwide market for air pollution abatement services has increased steadily inrecent years, registering, according to one industry source, an average annual growth rateof approximately 6 percent during the period 1994-2004, and reaching an estimated $2.4billion in 2004.7 The worldwide market for air pollution abatement goods is estimatedto have experienced similar growth (7 percent) during the same period, although theoverall market size for goods is considerably larger, reaching an estimated $49.4 billionin 2004.8 The United States is the world’s largest producer and exporter of air pollutioncontrol equipment and services, followed by Japan and Germany. Together, the UnitedStates, Japan, and the EU account for an estimated 85 percent of world trade in theoverall pollution control industry.9 Looking specifically at air pollution abatement goodsand services, industry sources indicate that Germany, Japan, and the United States aremajor exporters.10 In general, developing countries are most frequently importers of airpollution abatement goods and services, while large developed countries are typicallyexporters. Consumers of air pollution control equipment vary by market, but generally,electric utilities, by far, purchase the largest share in many markets. Other significantclients include the chemical, pharmaceutical, and plastics industries; petroleum refining;pulp and paper manufacturing firms; incinerators; and large-scale foundries.11
Air pollution abatement services focus on the reduction and control of a variety ofpollutants such as sulfur oxides (SOx),12 nitrogen oxides (NOx),13 lead, carbon monoxide(CO), ozone (O3), particulate matter (PM), hazardous air pollutants, greenhouse gases
14 Greenhouse Gases (GHGs) allow sunlight to reach the earth’s surface, but restrictinfrared energy (heat) from escaping into space. The six greenhouse gases addressed by theKyoto Protocol are: carbon dioxide (CO2), methane (CH4), nitrous oxide (N2O),hydrofluorocarbons (HFCs), perfluorocarbons (PFCs), and sulphur hexafluoride (SF6). Eachgas has a different global warming potential and longevity in the atmosphere. 15 Industry representatives, interviews by USITC staff, Bangkok, Seoul, and Tokyo, Nov.2004. 16 Generally, emissions trading allows an entity that wishes to release emissions in excessof their allotted level to buy unused polluter entitlements from other enterprises emittingbelow their allotted levels. Emissions trading may lead to increased demand for air pollutionabatement goods and services. For example, industry representatives expect the EU EmissionsTrading Scheme (EU-ETS) to create demand of air pollution abatement services andequipment, as the newly restricted firms move to avoid fines and other penalties. Technicallyspeaking, the regulatory measures requiring emissions reduction are the industry driver, whileprograms such as the EU-ETS are more-or-less byproducts of the laws. 17 Industry representatives, interviews by USITC staff, Tokyo and Seoul, Nov. 2004. 18 One established benchmark comes from the Deafness Research Foundation, whichreports that prolonged exposure to noise above 85 decibels can cause hearing loss. The WorldHealth Organization (WHO) reports that noise pollution negatively affects health andwell-being and is considered a serious health problem worldwide. In addition to hearing loss,other health effects of noise include stress, anxiety, poor concentration, and loss ofproductivity.
1-3
(GHGs), and myriad indoor air pollutants.14 Demand for such services is expected toincrease in regions experiencing increased instances of air pollution, and where thepublic has expressed concern regarding environmental conditions as they relate to healthand quality of life.15 Such factors combine to spur legislation and other actions that serveto ameliorate air pollution, which, in turn, often spur demand for air pollution abatementgoods and services. Air pollution policies may be established at the national orsubnational levels, and may take the form of emission limits on individual industrialpolluters, processes, or vehicles; air quality threshold goals and objectives; or economicinstruments such as energy and pollution taxes, or emissions trading schemes.16
Noise Pollution AbatementThe global market for services related to noise pollution abatement is believed to besmall, as it is essentially confined to various testing, measuring, and modeling activitiesthat might be done by outside contractors or consultants. Anecdotal information suggeststhat the worldwide market for noise pollution abatement goods and services has grownin recent years. However, quantitative information covering these industry segments isgenerally limited and incomplete, precluding precise statistical analysis.17
The Centers for Disease Control and Prevention (CDC) reports that noise has becomeone of the most pervasive environmental pollutants in today’s society, requiringincreased attention. However, noise restrictions are difficult to manage and enforcebecause noise pollution is much more subjective than many other environmentalpollutants. For most, a loud fireworks display is usually considered an enjoyable event,but the same audience would probably consider the same noise a nuisance if trying tosleep. Criteria that are not subject to personal opinion18 are generally the most usefulwhen crafting laws, ordinances, and standards relating to noise control. Thus, whenpossible, noise control policies usually are based on objective performance standards,

19 Solutions may involve protecting the recipient, increasing path length, blocking the path,or reducing the noise at the source. 20 World Trade Organization (WTO), Ministerial Declaration: Adopted on 14 November2001, WT/MIN(01)/DEC/1, Nov. 20, 2001. 21 Industry representative, interview by USITC staff, California, May 11, 2004. 22 WTO, MTN.GNS/W/120, July 10, 1991.
1-4
which may specify maximum noise emission levels for certain types of equipment, suchas motorcycles, and for the performance of specific activities, such as buildingconstruction. Other controls include measures such as local ordinances that restrictcertain noises to certain times of day. Regulations relating to noise pollution exist at thenational, state, and local levels, and may be directed toward the source of the offendingnoise, the path of noise transmission, and the targeted observer.19
Air and Noise Pollution Abatement Services in theWorld Trade Organization (WTO)
The air and noise pollution abatement services industries, as discrete segments of theoverall environmental services sector, have received special emphasis in the WTO, asthe reduction or elimination of barriers affecting trade in environmental services hasbeen identified in the Doha Ministerial Declaration20 as one of the principal goals of thepresent negotiating round. Industry representatives believe that as trade in theenvironmental service sector expands globally, exporters, importers, and theenvironment itself may benefit from increased competition that generally reduces costs,increases service quality, improves efficiency, and/or introduces environmental servicesthat were previously unavailable.21 Environmental issues also have become increasinglytied to international trade and investment activities, such that the potential environmentalimpact of a trade agreement is increasingly likely to be evaluated by the participatingnational governments and considered as a critical element of the agreement underconsideration.
ScopeFor the purpose of this study, air and noise pollution abatement services are defined toinclude control services of indoor or outdoor air pollution originating from stationaryor mobile sources; services related to the trade of air pollution emission rights; servicesrelated to the monitoring, assessment, or control of acid rain; services related to thestudy of the relationship between air pollution and climate; noise pollution abatementand control services; testing and monitoring of air or noise pollution; and other servicesincidental to air and noise pollution abatement. The USTR specified this definition ofthe air and noise pollution abatement services industries in its request letter. Otherresearchers may arrive at different, but equally valid, definitions of air and noisepollution abatement services.
One of the characteristics of the definition utilized in this investigation is that it is largelybased on the World Trade Organization’s (WTO) Services Sectoral Classification List22
(also known as the W/120), which is used by most signatories to the General Agreement

23 The terms and conditions under which WTO signatories accord market access andnational treatment to foreign firms are provided within national schedules of specificcommitments. 24 For more information regarding GATS commitments on cleaning services of exhaustgases (CPC 9404) and noise abatement services (CPC 9405) as well as a discussion of recentdevelopments in the WTO as they relate to these service segments, see appendix C. 25 While industry segments can be differentiated for classification purposes, most data usedin this report includes both core and periphery services, as data collection capabilitiescurrently do not allow a more narrow examination. 26 Organization for Economic Cooperation and Development (OECD), EnvironmentalGoods and Services: The Benefits of Further Global Trade Liberalization, 2001, p. 24.
1-5
on Trade in Services (GATS) as a basis for their schedules of specific commitments.23
The W/120 divides environmental services into four subgroups, most of which areidentified by corresponding Central Product Classification (CPC) codes: sewageservices, CPC 9401; refuse disposal services, CPC 9402; sanitation and similar services,CPC 9403; and other environmental services, which is often presumed to include, interalia, cleaning services of exhaust gases (CPC 9404) and noise abatement services (CPC9405).24 Many of the activities included in the USTR definition are classified in CPC9404 and 9405. However, some of the services listed by the USTR are classified as otherenvironmental protection services not elsewhere classified (CPC 9409), or are outsidethe environmental services division of the CPC.
Air and noise pollution abatement services can be broadly segmented into core andcluster services (figure 1-1).25 Generally, core services are unique to pollution abatement,while cluster services may be supplied in numerous services subsectors, in addition tothe subject core service sector. For example, engineering services, which are peripheralto abatement services, may also be integral to numerous other environmental services,as well as to fields completely outside the scope of environmental activities, such asroller chain production. Based on the information gathered for this study, it seems thata significant proportion of the services provided to abate air and noise pollution areclassified in the “cluster” rather than the core. The Organization for EconomicCooperation and Development (OECD) suggests that the benefit of developing acore/periphery approach to environmental services is that future GATS negotiations inthis area could be undertaken using the core classifications, while still giving attentionto the related, but separately classified, services that are key to their delivery; i.e., theperiphery.26
Methodological ApproachTo gather information for this report, the Commission conducted in-person andtelephone interviews with industry representatives, government officials, and academics,and consulted a wide range of secondary sources in a search for both quantitative andqualitative information. In recognition of the pronounced variation among air and noisepollution abatement service providers, an attempt was made to collect information fromdiverse parties. During the course of this investigation, Commission staff conductedinterviews with representatives of air and noise pollution abatement service providers

27 Specific travel destinations were chosen based on a number of criteria, including marketsize and development, export potential, and the USTR’s request for information on bothdeveloped- and developing-country markets, as well as on countries with which the UnitedStates has established, or is in the process of establishing, a free trade agreement (FTA). 28 Commission staff conducted interviews in Chicago and over the telephone. A publichearing on this investigation, which was scheduled for October 20, 2004, was canceled, as noparty had requested to testify. See appendix B for more details regarding this hearing.
1-6
and goods suppliers, government officials, industry and trade associations, andeducational facilities, in numerous locations including Bangkok, Brasilia, Brussels,London, Rio de Janeiro, San Jose, Santiago, Sao Paulo, Seoul, Tokyo, and Warsaw,27
as well as the United States.28 The Commission endeavored to interview representativesof large, multinational firms as well as those of small firms. In total, 78 interviews wereconducted, in addition to formal and informal discussions with U.S. Foreign CommercialService and State Department personnel at the U.S. embassies and consulates visitedduring the course of staff fieldwork. Representatives of 26 government agencies, 14larger firms, and 38 small firms and associations were interviewed. Secondary sourcesconsulted by Commission staff included industry journals and websites, U.S. and foreign
* Environmental R&D services
* Projectmanagement services
* Education,training, and
technicalassistance
* Environmentalconsulting servicesand environmental
legal services * Monitoring andtesting
* Subsurface andsurface surveying
services
* Construction
* Insulation services
* Design and engineering
* Integratedengineering
services
* Urban planningservices
* Financial services(emissions trading)
Cluster2
Core1
* Noise abatementservices
* Cleaning servicesof exhaust gases* Modeling
1 The core includes services that are specifically classified as enviromental services in classif ication schemes. 2 The periphery includes services that are not specifically defined as environmental services in classification schemes,but which are integral to the cleanup or protection of the environment.
Source: WTO, “Communication from the European Communities and their Member States, GATS 2000: EnvironmentalServices,“ S/CSS/W/38, Dec. 22, 2000, found at http ://www.wto.org/, retrieved June 20, 2003; and USITC staffestimates.
* Installationservices
* Compositionand purity testing
and analysisservices
Figure 1-1Air and noise pollution abatement services: Core and cluster services

29 The data used in this report supplied by the McIlvaine Company was contracted for bythe Commission specifically for Commission purposes. 30 Service industries that provide testing of “environmental samples” (soil, water, air, andsome biological tissues). 31 Encompasses services including engineering, consulting, design, assessment, permitting,project management, and monitoring. 32 Firms that produce equipment and technology to control air pollution, including vehiclecontrols. 33 Environmental Business International, Inc. (EBI), found athttp://www.ebiusa.com/Segments.html, retrieved Jan. 6, 2005. 34 EBI, e-mail response to questions posed by USITC staff, received Jan. 6, 2005. 35 From EBI, EBI Market and Industry Research Methods, p. 25, found athttp://www.ebiusa.com/, retrieved Aug. 4, 2004. 36 McIlvaine data is comprised solely of the consulting, engineering, and monitoringsectors within the overall air pollution abatement industry. 37 The McIlvaine Company, World Air Pollution Control Revenue Forecasts, p. 9,document sent to USITC staff via e-mail, received Jan. 4, 2005.
1-7
government publications, and other publications and websites such as those availablefrom the World Bank, the WTO, and the OECD.
For this report, the Commission reviewed and incorporated quantitative data from twoprincipal industry sources, Environmental Business International, Inc. (EBI) and theMcIlvaine Company,29 as well as data from the United Nations (table 1-1). EBI is astrategic market research, publishing, and consulting firm that focuses on theenvironmental products and services industry. EBI publishes little discrete data on airpollution abatement services, although some market data are available for the UnitedStates. Specifically, EBI indicates what portion of two industry segments--“Environmental Testing & Analytical Services”30 and “Environmental Consulting &Engineering”31-- is accounted for by air pollution control activities. EBI publishes bothmarket data (worldwide) and trade data (U.S.) for air pollution abatement goods andequipment, which are included within EBI’s “Air Pollution Control Equipment”32
industry segment.33 EBI does not track market or trade data on noise pollution abatementservices, goods, or equipment.
EBI data are largely based on industry surveys and reports from publicly tradedcompanies. The firm surveys air pollution control (APC) equipment manufacturersannually, collecting data on revenues and growth by type of product, type of customer,geography, and pollutant. Efforts are made to obtain data on the top 50 companies, whilethe remainder of companies are analyzed by selective surveying and economic modeling.All results are reconciled with secondary sources, and discussed and confirmed throughinterviews with APC company executives.34 Data on foreign market revenues aregenerated using data from secondary sources, which are adjusted so as to conform to thedefinitions and methods used to generate U.S. data.35
McIlvaine data reflect consumption and trade in various air pollution abatement servicesand goods markets.36 McIlvaine consumption (market) data include the aggregation ofsupplier sales, cross-referenced against aggregations of individual country data, end userdata, and industry data.37 McIlvaine bases its estimates on information regarding thelikely air pollution abatement projects of industry consumers. These estimates are then

38 The McIlvaine Company, telephone interview with USITC staff, Jan. 7, 2005 39 Government generated data is not used due to the lack of specificity. The McIlvaineCompany, World Air Pollution Control Revenue Forecasts, p. 9. 40 The McIlvaine Company, telephone interview with USITC staff, Jan. 7, 2005
1-8
Table 1-1Data sources: Air and noise pollution abatement
Data Source
Goods Services
Industrycoverage
Geographiccoverage Type of data1
Industrycoverage
Geographiccoverage Type of data1
McIlvaine McIlvainedefined
Worldwide Market & tradedata for airpollutionabatement
McIlvainedefined
Worldwide Market & tradedata for airpollutionabatement
EBI EBI defined U.S./worldwide
Market(worldwide)and trade(U.S.) data forair pollutionabatement
EBI defined U.S. Market data forair pollutionabatement
UnitedNations’COMTRADEdata system
OECDEnvironmentalGoods List
Worldwide Trade data forair and noisepollutionabatement
(2) (2) (2)
1 Market data are comprised of consumption and production values of goods/services in a particular country; tradedata are comprised of import and export statistics. 2 Not available.Source: Complied by the Commission.
adjusted based on knowledge of industry, and, in the case of historical data, are verifiedusing information on projects that were completed. McIlvaine data on services are basedon a fixed percentage of the goods values, and reflect air pollution abatement consulting,engineering, and monitoring activities.38
McIlvaine data on imports and exports of air pollution abatement goods and services areestimates, based on the individual product’s trade characteristics.39 Trade data are basedon known sales of large multinational companies and typical distribution of those salesin a particular consuming country. McIlvaine’s methodology is to examine the value ofthe foreign projects of major firms, and subtract the value of those goods or serviceswhich will likely be provided locally.40
A third source of data utilized within this report is the United Nations’ COMTRADEdata system. COMTRADE provides an additional outlook on trade in equipment. Underthe COMTRADE system, goods are classified according to 6-digit HS numbers. Inanalyzing these data for the purposes of this study, HS numbers relating to air and noisepollution abatement equipment were selected based on the OECD environmental goods

41 OECD, Joint Working Party on Trade and Environment(COM/TD/ENV(2000)86/FINAL), found athttp://www.oecd.org/searchResult/0,2665,en_2649_201185_1_1_1_1_1,00.html. 42 Overviews of these national and regional markets for air and noise pollution abatementservices are included in appendix D. 43 This conclusion is followed by several appendices, including a submission filed inconnection with this study which can be found in appendix E, and a glossary of key termswhich can be found in appendix F.
1-9
list, as included in Environmental Goods and Services: An Assessment of theEnvironmental, Economic and Development Benefits of Further Global TradeLiberalisation.41
OrganizationThis report presents an overview of the global market for air and noise pollutionabatement services. Chapter 2 provides a review of extant literature pertaining to air andnoise pollution abatement. Chapter 3 examines factors that affect supply and demand forair and noise pollution abatement services in the global marketplace. Chapters 4, 5, and6 present discussions on air pollution abatement, emissions trading, and noise pollutionabatement, respectively. These chapters largely follow a similar format, beginning witha market overview, followed by an examination of the trade and investmentenvironment, and concluding with a discussion of future prospects. Chapters 3 and 4include tables that present information on selected countries. As noted above, countrymarkets examined in these chapters were selected in light of the USTR’s request forinformation on both developed- and developing-country markets, as well as informationon countries with which the United States has established, or is in the process ofnegotiating, a free trade agreement. These markets include Brazil, Chile, and CostaRica.42 The report concludes with a summary of current trends within the global marketfor air and noise pollution abatement services, including a discussion of trade andinvestment trends.43


1 No recent empirical assessments of noise pollution abatement services are available.
2-1
CHAPTER 2LITERATURE REVIEW
The demand for, and supply of, air and noise pollution abatement services ultimatelyderives from a society’s desire to limit pollution and maintain a healthy environment.Two primary motivations lead a pollution generator to purchase pollution abatementservices and equipment: compliance and performance. Compliance addresses effectivelymeeting regulations, while performance involves the efficiency with which regulationsare met.
As noted in chapter 1 (figure 1-1) there are numerous services that are not specificallydefined as environmental services in differing classification schemes, but are nonethelessintegral to the abatement of air or noise pollution. Most of the recent empirical literaturerelating to such services has focused on the design, efficiency and effectiveness of theseservices in reducing air pollution.1 Researchers have studied monitoring and testing,permit trading (a type of financial service), and design and engineering of abatementtechnologies (an environmental research and development service) due to the prominentrole they play in abating air pollution. These studies examine a wide range of industries,countries and air pollutants. This chapter reviews some of this extensive literature inorder to provide a context for why and how markets for such services have developed,and why the ability of such services to flow freely across political boundaries isimportant.
Monitoring and TestingAir pollution monitoring and testing yield critical information for the design andenforcement of environmental regulation. Industrial emissions testing, for example,helps determine a firm’s compliance with environmental regulations. Continuousmonitoring yields information regarding compliance on the part of specific industriesover time. Ambient testing helps determine the extent to exposure and risk due to bothoutdoor and indoor air pollution. The role of monitoring and testing in air pollutionabatement, and its significance in the global market for air pollution abatement services,are discussed in more detail in chapters 3 and 4. This section reviews empirical analysesof the effectiveness of monitoring, testing and enforcement activities. According toFoulon, et al. (2002), these analyses tend to be recent and limited in number and scope.However, two issues have been examined: the impact of monitoring and enforcementactivities on environmental performance, and the impact of public disclosure programson compliance.

2 IAP from burning dung and other biofuels is a major cause of acute respiratory infectionsin developing countries. Dasgupta, et al. (2004) note that acute lower respiratory infectionsare responsible for perhaps 20 percent of the 12 million deaths of children under 5 in thesecountries annually. Ezzati, et al. (2002) state that conservative estimates of global mortalityin 2000 due to IAP from solid fuels are between 1.5 and 2 million deaths–most of whom arewomen and children.
2-2
Impact of Monitoring and Enforcement on EnvironmentalPerformance
Foulon, et al., cite three studies that specifically examine the impact of monitoring andenforcement on industrial air pollution abatement. Gray and Deily (1996) study theeffect of inspections and enforcement (both Federal and state) on compliance, using datafrom U.S. integrated steel plants between 1980 and 1988. They find that increasedenforcement significantly increases compliance with air pollution regulations at the plantlevel. At the same time, firm compliance reduces the extent of monitoring andenforcement services directed towards that plant. Fewer inspection or enforcementefforts were directed towards plants that were expected to be compliant, were inattainment areas, or were expected to close. The authors also found that a firm’scompliance decision was largely unaffected by firm characteristics such as size ordiversification, but was affected by the future viability of the plant and the cost ofbecoming compliant.
Focusing on the U.S. paper and pulp industry, Nadeau (1997) tests whetherEnvironmental Protection Agency (EPA) monitoring and enforcement reduce theduration of plant-level noncompliance with air pollution regulations. In his analysis,enforcement includes any administrative, civil, judicial or penalty actions in responseto non-compliance, while monitoring includes both inspections and testing. Nadeauexamines 277 instances of noncompliance involving 175 plants. He finds that a 10-percent increase in monitoring activity reduces the duration of noncompliance for paperand pulp plants by 4.2 percent, while a 10-percent increase in enforcement led to a 4-to 4.7-percent reduction in the duration of noncompliance. Nadeau concludes that EPAmonitoring and enforcement are effective in improving environmental performance.
Dasgupta, et al. (2001) examine the impact of inspections and enforcement oncompliance with air pollution regulations in China’s Zhenjiang province. Based on theZhejiang field inspection procedures, the authors note that the expected penalty anoncompliant firm faces depends upon the probability of inspection and the effectivelevy imposed. Using plant-level data from many industries over the period 1993-1997,they find that cumulative inspections have a significant impact on emissions of totalsuspended particles, but the effective levy does not. Variation in environmentalperformance across plants is statistically better explained by variation in cumulativeinspections, rather than variation in the environmental levies plants face. They also findthat citizen complaints have a positive impact on the number of inspections.
Advances in the design of monitoring and testing equipment and methodologies canincrease the impact of these services on environmental performance. Both Dasgupta, etal. (2004) and Ezzati, et al. (2002) argue that the design of effective indoor air pollution(IAP) reduction strategies in developing countries has been hindered by lack ofinformation on IAP exposure in households.2 Because monitoring in villages is costly,exposure analyses have had to rely on indirect indicators, such as biofuel consumption,

3 PM10 and PM2.5 refer to particles with a diameter of 10 microns or less, and 2.5 micronsor less, respectively. These air samplers measure 24-hour average PM10 concentrations. Real-time monitors record PM10 and PM2.5 at 2-minute intervals for 24 hours.
2-3
time spent cooking, or housing type. However, these indirect indicators have beenshown to be poor proxies, since actual exposure is influenced by the interaction of allthese factors, as well as by location of cooking, ventilation, and air flow. Recentadvances in technology have made it possible to measure actual pollutant concentrationsin village households with air samplers and real-time monitors.3 Using data onparticulate concentrations from villages in Bangladesh, Dasgupta, et al. find that IAPexposure does not vary much with type of biofuel, but varies significantly with theamount of ventilation and the type of walls in a house (mud vs. other types). Ezzati, etal. find that studies which account for temporal and spatial characteristics of pollutionconcentration, as well as individuals’ time and activity, yield much larger estimates ofwomen’s exposure to IAP than those which omit these characteristics.
Impact of Public Disclosure Programs
Monitoring and testing services also may be used to disseminate information onenvironmental risk and compliance to the general public. Despite the benefits of a shifttoward market-based approaches to pollution abatement, Tietenberg (1998) notes thatindustrial countries’ systems are still burdened by the large number of pollutants to becontrolled. Many developing countries face additional problems due to the costlinessof monitoring and enforcing even market-based regulations (Blackman and Harrington,2000). Disclosure of information assists the general public in becoming a catalyst forcompliance with environmental regulations.
Tietenberg (1998) outlines four steps for making such public disclosure an effective toolin pollution abatement. Specifically, methods must be established to detectenvironmental risks, assure reliable information, disseminate the information, andprovide avenues to act on the information. Environmental testing is a key input in thefirst step, as the means to ascertain the extent of air pollutant emissions, the degree ofexposure to various risks from these pollutants, and the consequences of such exposure.Monitoring of pollution sources is critical for disseminating up-to-date information tothe public and for measuring response to public pressure.
The U.S. Toxic Release Inventory (TRI), enacted by Congress in 1986, is a well-knownexample of public disclosure of environmental information. The TRI provides annualinformation on firms’ emissions or use of listed chemicals (above certain thresholds),including the name of the firm, the amount and frequency of toxic release, and themedium into which it is released. Tietenberg (1998) notes that the TRI seems to havereduced toxic emissions into the environment. He cites EPA data indicating that totalemissions fell by about 44 percent and air emissions fell by about 40 percent in the 8years following implementation of TRI. Hamilton (1995) and Khanna, et al. (1997) findevidence that company stock prices respond negatively to disclosure of TRI information.Both Konar and Cohen (1997) and Khanna, et al. find evidence that such stock marketeffects result in reductions in emissions.

4 Another long-standing disclosure program is South Korea’s Monthly Violations Reports(MVR). These reports list firms which are in violation of national environmental regulations,and have been published monthly since 1989. According to Hong, et al. (2003), the MVRpublicized 7,000 violations spanning 3,400 companies between 1993 and 2001. The impact ofsuch disclosure, however, has yet to be analyzed.
2-4
Launched in the mid-1990s, Indonesia’s Program for Pollution Control, Evaluation andRating (PROPER) rates the environmental performance of Indonesian factories withrespect to air pollution and other pollutants, and assigns a single rating by color. Ratingsfor 187 facilities (spanning 14 industries) were made public in June 1995, and firmswere then given a 6-month grace period in which to improve their performance. Afshahand Vincent (1997) reported that by December 1995 the number of blue (compliant)ratings rose by nearly one-fifth. In a more recent assessment, Afsah, et al. (2000) findevidence that PROPER has led to significant reductions in emissions by firms that wereinitially noncompliant. They argue that the effectiveness of PROPER in stimulatingabatement is largely due to the transmission of better information to plant managersabout their own emissions and abatement opportunities. However, they also argue thatthis information would not necessarily translate into significant environmentalimprovements without the public pressure that results from disclosure.4
Foulon, et al. (2002) test statistically the relative importance of public disclosure andtraditional enforcement in improving environmental performance. They examine theresponse of the Canadian paper and pulp industry to declining stock prices, resultingfrom the disclosure of environmental information by the Canadian Ministry ofEnvironment. They compare this to the response of the industry to environmentalpenalties and fines. Foulon, et al. find that public disclosure has a stronger impact onboth emissions level and compliance than does the traditional enforcement imposed bythe government. However, more stringent standards and penalties also lead tosignificant reductions in emissions. The authors conclude that making use of publicdisclosure of environmental information may help reduce the costs of achievingcompliance, since public dissemination of information already collected by regulatorsis relatively inexpensive. However, because their results show that both publicdisclosure and penalties and fines significantly affect emissions level and compliance,the authors argue for the use of both approaches as complementary methods to achieveenvironmental objectives.
Permit TradingTradable permit systems are rapidly gaining acceptance as a method of air pollutionabatement. These systems specify an aggregate amount of emissions allowed, allocatepermits for specific amounts of emissions to polluters, and allow trade of permits amongpolluters. Polluters that exceed the limits imposed by their permits face penalties. Firmsthat find abatement relatively inexpensive will have an incentive to reduce emissionsbelow their allowance level, and will sell excess permits to those firms which findabatement relatively costly. In theory, such permit trading will achieve the targetamount of abatement in the least costly way.

5 As a general rule, permits from one permit trading program are not tradable on othertrading programs. For more information or permit trading, please see Chapter 5 (EmissionsTrading). 6 This section draws heavily on a number of recent surveys: Teitenberg, 1999, 2001, 2003;Stavins 2003a, 2003b; UNCTAD 2001; Davies et al., 2001.
2-5
The most widely studied successful tradable permit systems are the U.S. Acid RainProgram (or “SO2 allowance program”), the Los Angeles Regional Clean Air IncentivesMarket (RECLAIM), and the U.S. Lead Phasedown. The EU Emissions TradingScheme to control greenhouse gases began in January 2005. There are also systems indeveloping countries, such as the new trial system in Tiayuan, Shanxi province, China(Morgenstern, et al. 2004). Chapter 5 presents a detailed discussion of permit tradingin practice, in the U.S. SO2 Program, the European Union Emissions Trading Scheme,the United Kingdom Emissions Trading Scheme, and the Chicago Climate Exchange.5This section reviews some of the conclusions from the large body of research on theseand other permit trading systems6 regarding efficiency in design, effectiveness inpractice, and extension to greenhouse gas abatement.
Efficiency in Design
This chapter discusses two types of permit trading systems—“cap and trade” programsand credit programs. All of the surveys noted above argue that cap and trade programsappear to be more effective in reducing air pollution than credit programs. A cap andtrade program has an aggregate absolute emissions baseline, whereas a credit programestablishes individual baselines for each polluter. This implies several advantages forthe cap and trade program relative to the credit program. Specifically, previouslyestablished technology-based standards for each polluter are not required, aggregateemissions will not increase as the number of polluting firms increases, and reductionsin emissions are more certain, since they are measured against an absolute baseline,rather than against the hypothetical level the firm would have emitted without regulation(Tietenberg 2001, Stavins, 2003a).
There is a broad consensus that the initial allocation of permits needs to be based onhistoric use (grandfathering), and that the initial permits need to be distributed free ofcharge, in order to ease implementation of the permit trading system, and to gain firms’cooperation. These practices may encourage compliance, but they have severaldownsides. One problem is that existing firms have an incentive to inflate historic useto enlarge their initial allocation of permits. There is some evidence that grandfatheringhas led to overallocation (Tietenberg, 2003). Goulder, et al. (1999), argues that SO2costs in the Acid Rain program would have been 25 percent lower if licences had beenauctioned instead. Another problem is that new firms, where new is defined as thosefirms established after the initial distribution of permits, must pay for all permits theyreceive. This might retard development of plants that use the latest technologies.
Another key finding is that flexibility in permit trading– both geographically and overtime– and flexibility in technology choice, are critical for a successful program. TheEPA Emissions Credit Trading (begun in 1977) performed poorly in part because allindividual trades required prior government approval. This led to increased uncertaintyon the part of firms, and decreased use of the trading mechanism. In essence, the fewerimpediments to efficient trading, the more the permit market will facilitate lowest-costachievement of the abatement objectives. Geographic concentration of permits could

7 Other recent detailed studies of the Lead Phasedown include Kerr and Maré (1997) andNichols (1997).
2-6
occur, possibly leading to unacceptably high concentrations of pollution in a particularlocation (“hot spots”). Although some programs (e.g., RECLAIM) place restrictionson permit trading to avoid such concentration, Teitenberg (2001) argues that a betterresponse is to address the individual circumstances which give rise to the most severehot spots. The approach taken in the U.S. Acid Rain program is to allow unrestrictedpermit trade, but to require firms to assure that trades do not lead to violation of NationalAmbient Air Quality Standards (Teitenberg 2003).
Banking allows firms to save unused emissions allowances and use them in the future,while borrowing allows firms to access future allowances for use in the present.Banking/borrowing is useful if firms must make major investments to achievecompliance. It is also useful if the environmental damage generated by pollutantsincreases when emissions are concentrated in time. Rubin (1996) finds that under suchcircumstances (and if firms’ future emissions allowances are shrinking), banking willactually help reduce firm abatement costs and environmental damage by giving firmsmore flexibility in the timing of emissions. All of the surveys cite evidence thatextensive use of banking in the U.S. Acid Rain program and in the Lead Phasedownprogram led to earlier reductions in emissions and lower compliance costs.
Technological choice also contributes to lower abatement costs and increasedeffectiveness of permit programs. Stavins (1998) notes the importance of the lack ofscrubbing requirements in the SO2 allowance program. Firms were free to reduce SO2emissions by switching to more low-sulfur coal. For many firms, this was a lower-costalternative to scrubbers. Fuel-switching also may have spurred technologicalimprovements in scrubber performance and rail transport.
Effectiveness in Practice
The objective of the U.S. Lead Phasedown program (begun in 1982) was to reduce thelead content in gasoline to 10 percent of its previous level. In 1985, banking of creditswas introduced. Stavins (2003a) notes that this was done in part to give small refineriesmore flexibility, since their compliance costs were thought to be high. Firms did makeextensive use of trading and banking, where banking itself generated an estimated costsaving of $250 million (EPA, 1985). Kerr and Newell (2003) test the impact of the LeadPhasedown program on firms’ technology choice. Examining a sample of 378 refineriesfrom 1971-1995, they find evidence that increased regulatory stringency regarding leaddid result in greater use of lead-reducing technology. Firms with lower compliance costswere more likely to adopt efficient technology relative to firms with higher compliancecosts, and this ratio was higher under a tradable permit system than under an alternativeperformance standard.7
The U.S. Acid Rain program is considered the largest and most successful cap and tradeprogram in the world (UNCTAD, 2001). It was initiated under the Clean Air ActAmendments of 1990, with the objective of reducing emissions from large electricpower units by 10 million tons below 1980 levels. There has been extensive trading inSO2 allowances, with trading increasing over time, and extensive use of banking(Stavins, 2003a). Much research has been devoted to analyze the impact of this program(e.g., Burtraw et al., 1998; Burtraw and Mansour, 1999; Ellerman et al., 1997, 2000;
8 See footnote 1, table 5-1. 9 For more information on the Kyoto Protocol see p. 3-11.
2-7
Ellerman, 2003; Joskow and Schmalensee, 1998; Montero, 1999; Schmalensee et al.,1998; Stavins, 2003b). The broad consensus of this research is that permit trading notonly generated large cost-savings over alternative performance requirements, but alsogenerated large improvements in human health, due to reductions in local SO2 andparticulate concentrations. According to Kruger et al. (1999), advances in informationtechnology, which allowed continuous emissions monitoring via the web, contributedto the success of the program.
In a recent major study of permit trading in the United States, Davies, et al. (2001)argued that further reforms were needed in four key areas: efficiency, flexibility,decentralization, and integration. The authors note that some states have improvedefficiency recently, with one-stop shopping, guidance for permit applicants, and internetusage. Less progress has been seen on flexibility. Some permits may prevent the useof the most efficient abatement techniques because the permit specifies the technologyto be used rather than a standard to be met. Some states do offer more flexibility(greater choice in abatement method or expedited permiting) to facilities that agree toachieve a superior environmental performance. However, in some cases the facilitymust already have a management system in place in order to participate. Davies, et al.call for better EPA oversight of an already decentralized permit system, and for reformswhich would integrate pollution control for air, water, and land.
In 2005, the EU launched the EU Emissions Trading Scheme for greenhouse gasabatement. The proposed system has been strongly influenced by the U.S. SO2 program(Teitenberg, 2003). Kruger and Pizer (2004) note that initially, the scope of the systemwill be limited to CO2 emissions from production and processing of iron and steel,minerals, energy, and pulp and paper. They currently estimate that more than 12,000installations will be included in the program, covering nearly half of EU CO2 emissions.This system will allocate initial allowances largely free of charge, and will includebanking and borrowing provisions. Teitenberg (2003) notes that individual countries,such as the United Kingdom and Denmark, created their own national trading programsand that even some individual companies such as British Petroleum set up tradingsystems to help units within the company achieve their goals.8 In the United States,some companies, states, and municipalities have adopted voluntary caps on CO2 andmethane, with the Chicago Climate Exchange facilitating trading to achieve thoseobjectives.
Teitenberg (2003) discusses some specific problems which arise when designing aninternational permit trading system to control greenhouse gases. Most existing permittrading systems address only one or two pollutants. Thus, lessons from existingprograms may have limited application to the integrated system controlling sixgreenhouse gases envisioned in the Kyoto Protocol.9 Efficient monitoring andenforcement– critical to a successful permit trading system– will be more difficult dueto differences in monitoring capacity across countries, as well as inherent difficulties inmonitoring certain sources of greenhouse gases. Setting the caps will require agreementamong countries, which is made more difficult by the lack of consensus among scientistsregarding assessments of risk and degradation from climate change. Developingcountries may not have adequate knowledge of abatement technologies, or access tothose technologies, to take advantage of the cost-minimizing incentives generated by

10 The four technologies examined are computerized climate controls, computerizedprocess controls, waste-heat recycling, and adjustable speed motors.
2-8
permit trading systems. The Clean Development Mechanism (CDM), which extendsemissions credits to industrialized countries that finance emissions reductions indeveloping countries, may help meet this concern.
Toman (2004) notes that most of the research modelling greenhouse gas abatement hasfocused on three key issues: revenue recycling, time flexibility, and geographicflexibility. The net cost of an auctioned permits system differs depending upon how theincome generated by the system is spent (e.g., rebated to consumers (lump sum), usedto cut other tax rates, used to finance other public spending, etc.). Toman argues thatthere is now a consensus that cost-efficiency is improved if the revenue is used to reduceexisting distortions from other taxes. Timing of reductions in CO2 emissions also affectscosts. Toman notes that there is some agreement that gradual reductions are more cost-effective, but little agreement on the merits of including borrowing in the system.Geographic flexibility provisions (such as the Kyoto Clean Development Mechanism)have been modelled by many researchers. According to Toman, there is now muchevidence that such flexibility could provide substantial cost-savings in meetinggreenhouse gas emissions reductions.
Abatement TechnologyIn theory, environmental regulations on air pollution raise the cost of emissions to firms,increasing firms’ incentive to abate this pollution. Increased demand for abatementequipment and techniques may stimulate the development of better abatementtechnologies. Alternatively, it may stimulate innovation in production technology sothat firms’ production processes become less polluting. Environmental regulations mayalso raise the rate at which these technologies spread throughout an industry. However,the extent to which environmental regulation affects technology choice, innovation, ordiffusion may depend upon the form which such regulation takes. Chapter 4 discussesin more detail the specific technologies and methods used to achieve compliance withregulations on specific air pollutants. This section reviews recent evidence on the impactof air pollution regulation on technological innovation and diffusion, and the extent towhich the form of regulation affects the technological response.
Impact of Environmental Regulations on TechnologicalInnovation and Diffusion
In their recent survey, Jaffe, Newell and Stavins (2003) find mixed evidence regardingwhether increased environmental stringency stimulates technological innovation ordiffusion. Part of the difficulty is that, ideally, the researcher wants to measure therelationship between innovation or diffusion and changes in the implicit price of airpollution resulting from environmental regulation. However, because this implicit priceis not observed, researchers must use indirect indicators such as energy prices, pollutionabatement costs, and indices of the stringency of environmental regulations. Pizer et al.(2002), for example, examine the impact of higher energy prices on the rate of diffusionof four new energy-efficient technologies10 in the steel, paper and pulp, plastics, andpetroleum refining industries, from 1991-1994. They also examine the role of plant and

11 Boyd and Karlson (1993) also find a positive response between energy prices and newtechnology adoption in the U.S. steel industry. 12 These areas of pollution abatement or environmental protection included: industrial andvehicular air pollution control, water pollution control, hazardous and solid waste disposal,incineration and recycling of waste, oil spill cleanup, and the use of alternative (non-fossilfuel) energy sources.
2-9
firm characteristics on the adoption rate. They find that energy prices, plant size, andfinancial health of the firm all have a significant positive effect on the rate of adoptionof these new technologies. However, increases in energy prices that significantly reducethe financial health of the firm could reduce the rate of adoption of new technology.11
Lanjouw and Mody (1996) examine the correlation between pollution abatementexpenditures and the growth in environmental patents during the 1970s and 1980s in theUnited States, Germany, and Japan, as well as a number of developing countries. Theenvironmental innovations they examine include improvements in abatementtechnologies and changes in production processes which lower emissions. Theseinnovations span nine different areas of pollution abatement or environmentalprotection.12 The authors find strong correlations between rising pollution abatementexpenditures and growth in environmental patents as a percent of total patents in allthree industrial countries, especially with respect to water pollution, air pollution, andalternative energy. There is also some evidence of correlation between environmentalstringency and patents in developing countries, though these were typically foreignpatents registered in developing countries.
More recently, Popp (2004) uses patent data from the United States, Germany, and Japanto examine the relationship between increased stringency in SO2 and NOx standards andinnovation in, and diffusion of, air pollution control equipment. Rather than use a proxyfor the implicit price of air pollution, Popp examines specific technological innovationsto reduce SO2 and NOx emissions from coal-fired power plants, and patenting trendsacross these three countries. He finds that in each of the three countries, tighter standardsled to more domestic patenting, but that domestic inventors did not generally respondto increased environmental stringency in foreign countries. Popp also finds evidencethat transfer of technology is indirect. Technologies which had undergone significantadvances abroad were nonetheless further adapted prior to adoption in the domesticcountry.
Other studies have been less positive about the link between environmental regulationand technological innovation. Gray and Shadbegian (1998) examine the impact of waterand air pollution control on 227 U.S. paper and pulp plants between 1972 and 1990.They use an index of regulatory stringency to proxy the price of air pollution across U.S.states. The authors find that new plants in states with more stringent regulations are morelikely to choose cleaner technologies. However, using a smaller subset of 68 plants, theauthors find that plants with high abatement costs (over the entire period) tend to investless in capital equipment used in the production process itself. Firms also appear to shiftproduction investment toward plants which face less stringent regulations.
Jaffe and Palmer (1997) test whether changes in environmental regulatory compliancecosts (capital costs or operating costs) are associated with higher levels of innovativeactivity in U.S. regulated industries, using the 1973-1991 Pollution Abatement ControlExpenditures data. Innovative activity is proxied by private spending on research and

2-10
development (R&D) and by the number of successful patent applications by domesticfirms in an industry. They find that, controlling for industry-specific characteristics,lagged environmental compliance expenditures are positively associated with R&Dexpenditures, but not with successful patent applications.
Type of Environmental Regulation and TechnologicalInnovation and Diffusion
Jaffe, Newell, and Stavins (2003) point out that different types of environmental policyinstruments can affect the rate and direction of technological change differently. Forexample, technological standards tend to inhibit the development of new technologiesthat may embody greater control over emissions. This is because, in contrast toemissions standards, no incentives exist under technological standards to exceed controltargets or to adopt new technologies. The empirical evidence to date suggests thatmarket-based instruments for environmental protection– such as environmental taxesand permit trading systems– are likely to have significantly greater positive effects oninnovation and diffusion of cleaner technologies than traditional command and controlregulations. As was discussed above, Kerr and Newell (2003) found evidence that newtechnology adoption by low-compliance cost firms relative to high-compliance costfirms under the U.S. Lead Phasedown program was much higher under the tradablepermit system than under alternative performance standards.
In his recent survey, Burtraw (2000) argues that much of the significant cost saving inthe U.S. SO2 tradable permits program can be attributed to innovation in the electricitysector. This innovation has taken place at the firm, market, and regulatory levels as wellas in process innovation by fuel producers and electricity generators. Burtraw arguesthat the tradable permits system allowed firms the necessary flexibility to speed upexisting technological advances and facilitate their adoption. The system led tocompetition among abatement technologies, thereby contributing to a decrease incompliance costs. For example, the system allowed the adoption of low sulfur coal ratherthan mandating the adoption of specific scrubber technologies. It also led to thedevelopment of fuel-blending, which has lower costs than scrubbing. Burtraw also notesthat there is some evidence that the permit trading system encouraged innovation inscrubber technology as well (Keohane 2000).
Popp (2001) provides additional evidence on the effectiveness of tradable permits inpromoting improvements in scrubber technology. He examines data on steam-electricpower plants and data on patents to test the impact of the 1990 Clean Air ActAmendments on SO2 pollution control technologies. Popp points out that regulationprior to 1990 did encourage innovations in scrubber technology, but that there is noevidence that these innovations improved scrubber efficiency in controlling pollution.After the permit system was implemented, the number of patents related to SO2 controldecreased. However, the evidence suggests that the post-1990 innovations actuallyimproved abatement efficiency.

2-11
ReferencesAfsah, Shakeb and J. R. Vincent(1997) "Putting Pressure on Polluters: Indonesia's PROPER
Program," Case Study for the HIID 1997 Asia Environmental Economics PolicySeminar, Washington, DC: International Resources Group. (Available atwww.worldbank.org/nipr)
Afsah, Shakeb, A. Blackman, and D. Ratunanda (2000). "How Do Public Disclosure PollutionControl Programs Work? Evidence from Indonesia," RFF Discussion Paper 00-44.
Blackman, Allen and W. Harrington (2000). "The Use of Economic Incentives in DevelopingCountries: Lessons from International Experience with Industrial Air Pollution," Journal of Environment and Development, 9(1): 5-44.
Boyd, G. and S. Karlson (1993). “The Impact of Energy Prices on Technology Choice in the UnitedStates Steel Industry,” Energy Journal, 14(2): 47-56.
Burtraw, D. (2000). “Innovation Under the Tradable Sulfur Dioxide Emission Permits Program inthe U.S. Electricity Sector,” RFF Discussion Paper: 00/38.
Burtraw, D., A.J. Krupnick, E. Mansur, D. Austin and D. Farrell (1998), “The Costs and Benefits ofReducing Air Pollution Related to Acid Rain,” Contemporary Economic Policy16:379-400.
Burtraw, D. and E. Mansur (1999), “The Environmental Effects of SO2 Trading and Banking,”Environmental Science and Technology 33(20):3489-3494.
Dasgupta, S., H. Wang, B. Laplante, and N. Mamingi (2001). “Inspections, Pollution Prices, andEnvironmental Performance: Evidence from China,” Ecological Economics, 36(3): 487-98.
Dasgupta, S., M. Huq, M. Khaliquzzaman, K. Pandey, D. Wheeler (2004). "Indoor Air Quality forPoor Families: New Evidence from Bangladesh," World Bank Policy Research WorkingPaper 3393.
Davies, T. , R. Hersh, A. Alicea, and R.Greenspan Bell (2001). Reforming Permitting. Washington, DC.
Ellerman, D., R. Schmalensee, P. Joskow, J. Montero and E. Bailey (1997), Emissions TradingUnder the U.S. Acid Rain Program: Evaluation of Compliance Costs and AllowanceMarket Performance Cambridge, MA: MIT Center for Energy and EnvironmentalPolicy Research.
Ellerman, D., P. Joskow, R. Schmalensee, J. Montero and E. Bailey (2000), Markets for Clean Air:The U.S. Acid Rain Program (Cambridge University Press, New York).
Ellerman, A. D. (2003), ‘The U.S. SO2 Cap-and-Trade Program,” Proceedings of the OECDWorkshop ‘Ex Post Evaluation of Tradable Permits: Methodological and Policy Issues.Paris: Organization for Economic Cooperation and Development.

2-12
Ezzati, M. and D. M. Kammen (2002). "The Health Impacts of Exposure to Indoor Air Pollutionfrom Solid Fuels in Developing Countries: Knowledge, Gaps, and Data Needs," RFFDiscussion Paper 02-24.
Foulon, J., P. Lanoie, and B. Laplante (2002). “Incentives for Pollution Control: Regulation orInformation?” Journal of Environmental Economics and Management 44, 169-187.
Goulder, L. H., et al.. (1999). “The Cost-Effectiveness of Alternative Instruments for EnvironmentalProtection in a Second-Best Setting ,” Journal of Public Economics 72(3):329-360.
Gray, W. And M. Deily (1996). “Compliance and Enforcement: Air Pollution Regulation in the U.S.Steel Industry,” Journal of Environmental Economics and Management 31, 96-111.
Gray, W. and R. Shadbegian (1998). “Environmental Regulation, Investment Timing, AndTechnology Choice,” Journal of Industrial Economics, 46(2).
Hamilton, J. T. (1997). “Taxes, Torts, and the Toxics Release Inventory: Congressional Voting on Instruments to Control Pollution” Economic Inquiry 35(4):745-762.
Hong, Jong Ho; Laplante, Benoit; Meisner, Craig (2003). "Public Disclosure of EnvironmentalViolations in the Republic of Korea," World Bank Policy Research Working Paper 3126.
Jaffe, A. and K. Palmer (1998). "Environmental Regulation and Innovation: A Panel Data Study"Review of Economics and Statistics, 79(4).
Jaffe, A., R. Newell, and R. Stavins (2003). “Technological Change and the Environment,” in K.Maler and J. Vincent, eds., Handbook of Environmental Economics, Vol. 1. Boston:Elsevier Science.
Joskow, P.L., R. Schmalensee and E.M. Bailey (1998), “Auction Design and the Market for SulfurDioxide Emissions,” American Economic Review.
Keohane, N. (2000). “Environmental Policy Instruments and Technical Change: Sulfur Dioxide,”Unpublished manuscript. Cambridge, MA:Harvard University Department ofEconomics.
Kerr, S. and R. Newell (2003). “Policy-Induced Technology Adoption: Evidence from the U.S. LeadPhasedown,” Journal of Industrial Economics. 51(3).
Kerr, S. and Maré, D., 1999, ‘Transaction Costs and Tradable Permit Markets: The United StatesLead Phasedown’ (Manuscript, Motu Economic and Public Policy Research, NewZealand).
Khanna, M., W. R. H. Quimio, et al. (1997). Toxics Release Information: A Policy Tool forEnvironmental Protection. Urbana-Champaign, Department of Agricultural and Consumer Economics, University of Illinois.
Konar, S. and M. A. Cohen (1997). “Information as Regulation: The Effect of Community Rightto Know Laws on Toxic Emissions.” Journal of Environmental Economics and Management 32(1): 109-124.

2-13
Kruger, J. and W. Pizer (2004). “The EU Emissions Trading Directive:Opportunities andPotential Pitfalls,” RFF Discussion Paper 04–24.
Kruger, J. and B. McLean (1999). A Tale of Two Revolutions: Administration of the SO2 TradingProgram. Draft Report. Washington., DC: U.S. Environmental Protection Agency.
Lanjouw, Jean O. and Ashoka Mody (1996), “Innovation and the International Diffusion ofEnvironmentally Responsive Technology,” Research Policy, 25, 549-71.
Montero, J. P. (1999). "Voluntary Compliance with Market-Based Environmental Policy: Evidencefrom the U.S. Acid Rain Program" Journal of Political Economy, 107( 5): 998-1033.
Morgenstern, R.D., P. Abeygunawardena, R. Anderson, R.Greenspan Bell, A. Krupnick, J. Schreifels, C.Dong, Wang Jinan, Wang Jitian, and S. Larsen (2004). “EmissionsTrading to Improve Air Quality in an Industrial City in the People’s Republic of China,”RFF Discussion Paper 04-16.
Nadeau, L. (1997). “EPA Effectiveness at Reducing the Duration of Plant-Level Noncompliance,”Journal of Environmental Economics and Management 34: 54-78.
Nichols, A. L., 1997, ‘Lead in Gasoline’, in Richard, Morgenstern ed., Economic Analysisat EPA. Washington, DC: Resources for the Future.
Pizer, W., W. Harrington, R. J. Kopp, R. D. Morgenstern and J. Shih (2002). "TechnologyAdoption and Aggregate Energy Efficiency," RFF Discussion Paper 02-52.
Popp, David (2004). "International Innovation and Diffusion of Air Pollution Control Technologies:The Effects of NOX and SO2 Regulation in the US, Japan, and Germany," NBERWorking Papers 10643.
_____ (2001). “Pollution Control Innovations and the Clean Air Act of 1990,” National Bureau ofEconomic Research Working Paper: 8593.
Rubin, J. D. (1996), “A Model Of Intertemporal Emission Trading, Banking, and Borrowing,”Journal of Environmental Economics and Management 31(3): 269-286.
Schmalensee, R., P.L. Joskow, A.D. Ellerman, J.P. Montero and E.M. Bailey (1998), “An InterimEvaluation of Sulfur Dioxide Emissions Trading”, Journal of Economic Perspectives12(3):53-68.
Stavins, R. N. (1998). "What Can We Learn from the Grand Policy Experiment? Lessons from SO2Allowance Trading." The Journal of Economic Perspectives 12(3): 69-88.
_____. (2003a). “Market-Based Environmental Policies: What Can We Learn from U.S.Experience(and Related Research)?” RFF Discussion Paper 03–43.
_____. (2003b). “Experience with Market-Based Environmental Policy Instruments.” Handbook ofEnvironmental Economics, Volume I, eds. Karl-Göran Mäler and Jeffrey Vincent, pp.355-435. Amsterdam: Elsevier Science.

2-14
Tietenberg, T. (1998). “Disclosure Strategies for Pollution Control,”Environmental and ResourceEconomics 11:587-602.
_____. (1999). “The Tradable Permits Approach to Protecting the Commons: What Have We Learned?” Manuscript available at http://www.colby.edu/personal/t/thtieten/ .
_____. (2001) (editor). Emissions Trading Programs. Volume 1. Implementation and Evolution.Volume 2. Theory and Design. International Library of Environmental Economics andPolicy. Aldershot, U.K.; Burlington, Vt. and Sydney: Ashgate.
_____. (2003) "The Tradable-Permits Approach to Protecting the Commons: Lessons for ClimateChange," Oxford Review of Economic Policy, 19(3), pp. 400-19.
Toman, M. (2003). “Understanding the Design and Performance of Emissions Trading Systemsfor Greenhouse Gas Emissions: Proceedings of an Experts’ Workshop to IdentifyResearch Needs and Priorities,” RFF Discussion Paper 03–33
UNCTAD (1998). Greenouse Gas Emissions Trading: Defining the Principles, Modalities,Rules and Guidlelines for Verification, Reporting & Accountability. Geneva:UNCTAD.
U.S. Environmental Protection Agency (1985). Costs and Benefits of Reducing Lead inGasoline, Final Regulatory Impact Analysis. Washington, D.C.: EPA.

1 See chapter 4, “Market Size and Characteristics.” 2 See chapter 4, “Trade and Investment.” 3 OECD, Environmental Goods and Services, An Assessment of the Environmental,Economic, and Development Benefits of Further Global Trade Liberalization,COM/TD/ENV(2000)86/FINAL, Oct. 3, 2000.
3-1
CHAPTER 3FACTORS AFFECTING SUPPLY ANDDEMAND
This chapter identifies and analyzes the principal factors which affect service providers’willingness or ability to supply air or noise pollution abatement services and equipment,as well as those factors which may motivate consumers to purchase such services andequipment, as observed in the countries selected for special emphasis. This chapter alsoaddresses the link between the demand for air and noise pollution abatement equipmentand demand for related air and noise pollution abatement services.
Factors Affecting SupplyThis section examines the macro-level factors affecting supply of air and noise pollutionabatement equipment and services across countries. Air pollution abatement goods andservices are frequently supplied to customers as part of a single transaction, with goodsaccounting for the majority of the value of the sale.1 Although there are few tradeprovisions directly affecting the supply of such goods and services, a limited number offoreign markets have been cited as posing some difficulty for U.S. and other foreignsuppliers.2 The supply of goods and services related to noise abatement in a particularmarket is influenced by the cost of these products in slightly different ways. In thosecases that require sound dampening materials or structures, the cost of the materials andany related design, engineering, and construction services required for their installationdirectly effects the noise abatement choices available in a market. In those cases, suchas construction equipment, where noise abatement has been addressed by productredesign or higher product standards, the likely higher cost incorporated may effect theselection of construction equipment available in the market and indirectly effect noiselevels. For more detailed discussion regarding how equipment and services areproliferated in the air and noise pollution abatement sectors, see chapters 4 and 6,respectively.
In many industries, including air and noise pollution abatement, a ready supply ofproduct must be available in order to sustain the market.3 However, in developingcountries, access to appropriate environmental goods and services is often hindered dueto cost issues and trade barriers. In the developed markets, virtually all types of air andnoise pollution control equipment are available across the technological and costspectrum (see table 3-1 at the end of the chapter). Consequently, equipment selection is

4 Industry representative, telephone interview by USITC staff, Dec. 23, 2004. Accordingto this U.S. industry representative, while technologically advanced equipment is readilyavailable in the U.S. market, only a fraction of power plants have scrubbers because the lawdoes not require it. Conversely, all power plants in Japan are fitted with scrubbers as dictatedby law. 5 OECD, Environmental Goods and Services, An Assessment of the Environmental,Economic, and Development Benefits of Further Global Trade Liberalization, Oct. 3, 2000. 6 Industry representative, interview by USITC staff, Seoul, Korea, Nov. 15, 2004. 7 Ibid. 8 United Nations Conference on Trade and Development (UNCTAD), StrengtheningCapacities in Developing Countries to Develop Their Environmental Services Sector,TD/B/COM.1/EM.7/2, May 12, 1998. 9 OECD, Environmental Goods and Services, An Assessment of the Environmental,Economic, and Development Benefits of Further Global Trade Liberalization, Oct. 3, 2000. 10 UNCTAD, Strengthening Capacities in Developing Countries to Develop TheirEnvironmental Services Sector, May 12, 1998. 11 OECD, Environmental Goods and Services, An Assessment of the Environmental,Economic, and Development Benefits of Further Global Trade Liberalization, Oct. 3, 2000.
3-2
more likely to be dictated by regulation than by cost or supply.4 In the developingworld, however, many countries are heavily reliant upon imports of such goods, andtherefore may have limited selection in terms of technology, cost, and suitability forpollution control requirements.5 In certain countries, such as Korea, technologicallyadvanced equipment is generally available for import from the United States, Japan, orEurope, but smaller companies are often unwilling or unable to bear the cost of high-endimported equipment, and purchase less advanced equipment that is domesticallyproduced.6 The supply of goods and services can be further hindered when foreignmanufacturers and services providers are reluctant to enter or expand into certaindeveloping markets for fear of intellectual property violations. For example, jointventures are generally considered to be an effective method of market penetration, butin Korea’s air pollution abatement sector, some equipment manufacturers shy away fromsuch arrangements for fear that local partners will copy their technology.7 The supplyof air and noise pollution abatement services in developing countries also may behindered by nontariff measures such as visa, employment, and licensing requirements,which can prevent qualified foreign providers of services from participating in suchmarkets.8
Factors Affecting DemandIt is important to note the close relationship9 between the demand for environmentalequipment and related services. Customers typically purchase air pollution controlequipment in response to specific regulatory requirements. In most cases, they alsorequire consulting, engineering, construction, installation, and/or monitoring services inorder to tailor the equipment to their specific needs and realize full compliance –purchases of the services are a function of purchases of the goods. In effect, theequipment and services are typically supplied as an “integrated package”10 and are notusually provided independent of one another. As such, manufacturers of environmentalequipment are becoming more vertically integrated, increasing their combined offeringsof systems and services.11 Consequently, as regulatory environments become more

12 Ibid. 13 For example, the United Kingdom enacted legislation in 1965 (Clean Air Act); Japanenacted legislation in 1968 (Air Pollution Control Law); and the United States enactedlegislation in 1963 (Clean Air Act) and in 1967 (Air Quality Act). 14 42 U.S.C. s/s 7401 et seq. (1970), “The Plain English Guide to the Clean Air Act,” EPA-400-K-93-001, Apr. 1993, found at http://www.epa.gov retrieved Jan. 7, 2005. 15 “Air Pollution Control Law,” Law No. 97 of 1968, found athttp://www.env.go.jp/en/lar/nlaw/index.html, retrieved Dec. 7, 2004. 16 Industry representative, interview by USITC staff, Tokyo, Japan, Nov. 4, 2004. 17 Ibid. 18 Information on the Canadian Environmental Protection Act, 1999 can be found athttp://www.laws.justic.gc.ca.
3-3
stringent and demand for air and noise pollution equipment rises, demand for air andnoise pollution control services will also likely increase.
Demand for air and noise pollution abatement services is largely driven by regulationand enforcement, financial resources, international obligations, and public sentiment.In most cases, regulation is the principal driver12 of demand for environmentalequipment and services, including air and noise pollution abatement services; monitoringand enforcement tend to improve compliance with such regulation (chapter 2). Theevolution of environmental laws in general, and air and noise pollution laws inparticular, varies significantly in the focus countries, with developed countries havinga relatively longer regulatory history than their developing country counterparts. Forexample, several European countries, Japan, and the United States, enacted basic airpollution control laws as early as the 1950s and 1960s.13 However, such lawsmaterialized more recently in Korea, Mexico, and Thailand in response to increasedeconomic development and industrialization.
Countries typically maintain some national-level legislation pertaining to air pollution,with responsibility for enforcement often falling to states or territories. This may impactthe provision of goods and services as providers may be forced to comply with severaldifferent sets of standards among states, rather than just one set of regulations at thenational level. In the United States, the principal law pertaining to air pollution is theClean Air Act,14 which gives both the Environmental Protection Agency (EPA) and stategovernments the authority to enforce standards and implement controls. Japan maintainsa similar structure, with the Air Pollution Control Law15 serving as the overarchinglegislation. While Japan’s Ministry of Environment has some enforcement authorityunder this law, provincial and local governments hold the principal enforcementresponsibility.16 Moreover, it is not uncommon for local governments in Japan to enactmore stringent air pollution control measures than those set at the national level.17
Canada and Australia also maintain air pollution laws under which both national andsub-national governments hold enforcement authority, but the evolution of thislegislation differs from that of similar legislation in the United States and Japan. InCanada, the provinces traditionally accounted for most of the country’s air pollutionregulations with little federal involvement. However, in 2000, the CanadianEnvironmental Protection Act18 entered into force. The legislation established nationalpollution control standards and gave the office of the federal environment minister theauthority to enforce air pollution abatement measures. It is reported that a lack ofharmonization among provincial standards presents challenges for industry, but theestablishment of the Canadian Council of Environment Ministers in 1989 aimed to
19 Industry representative, telephone interview by USITC staff, Sept. 22, 2004. 20 Information on Australia’s National Environment Protection Measure for Ambient AirQuality can be obtained from the Environment Protection and Heritage Council, athttp://www.ephc.gov.au. 21 European Union website, found at http://www.europa.eu.int, retrieved Nov. 10, 2004. 22 Industry representatives, interviews by USITC staff, Brussels, Belgium and Warsaw,Poland, Oct. 29 and Nov. 2, 2004. 23 World Economic Forum, “Enforcement of Environmental Regulations,” WorldCompetitiveness Indicators 2005. 24 BNA, “Mexico Overview,” found at http://esweb.bna.com retrieved Sept. 22, 2004. 25 Information on Korea’s Air Quality Preservation Act can be obtained from the Ministryof Environment, at http://eng.me.go.kr. 26 Because it is believed that current standards are not effectively bringing pollution undercontrol in the heavily populated Seoul area, the more stringent Special Law on Air Quality forSeoul Metropolitan Area will come into effect in 2005. Industry representative, interview byUSITC staff, Seoul, Korea, Nov. 16, 2004. 27 Government representative, interview by USITC staff, Seoul, Korea, Nov. 16, 2004.
3-4
clarify priorities and eliminate duplication.19 In Australia, air pollution regulationsevolved in a similar manner. In the 1980s and 1990s, each of the territories enactedenvironmental legislation that included some provisions regarding air pollution control.In 1998, the Government of Australia established national standards for key airpollutants under the National Environment Protection Measure for Ambient AirQuality.20 Although enforcement principally remains in the hands of local governments,greater harmonization and cooperation with national authorities is required under thenew legislation. In the European Union, air pollution is regulated by national laws thatmust conform to EU-wide standards. While there is no single “key” piece of legislationin this regard, the European Union has issued a series of directives pertaining to, interalia, ambient air quality assessment and management; limits for sulphur dioxide (SO2),nitrogen oxides (NOx), particulates, and lead; emissions from motor vehicles; andemissions ceilings for atmospheric pollutants.21 These directives work in tandem toprovide a framework for air pollution control and abatement. Environmental laws ineach of the EU-15 member states reportedly conform to these EU directives, and the 10newly acceded member states are currently working to harmonize their environmentallaws with these directives.22 However, it is reported that the degree of enforcement variesthroughout the European Union.23
In most cases, air pollution legislation in the developing countries covered in this reportis evolving. Almost all of these countries have enacted laws pertaining to specificpollutants, and enforcement is typically the responsibility of the national government.In Mexico, the Ministry of the Environment and Natural Resources (SEMARNAT)issues official standards for air pollution and acts as the principal regulator. To date,standards have been established for carbon monoxide (CO), lead, nitrogen dioxide(NO2), ozone (O3), sulfur dioxide (SO2), and particulate matter.24 Korea’s key lawpertaining to air pollution is the Air Quality Preservation Act of 1990.25 This lawestablishes air quality standards for certain pollutants, and assigns responsibility forenforcement to the Ministry of Environment.26 However, both the Mexican and Koreangovernments plan to relinquish authority for the regulation and enforcement of airpollution control standards to local governments.27

28 Information on Thailand’s National Environmental Quality Act can be obtained from theMinistry of Natural Resources and Environment, Department of Environmental QualityPromotion, at http://www.deqp.go.th/english. 29 Government representative, interview by USITC staff, Bangkok, Thailand, Nov. 11,2004. 30 Information on South Africa’s National Environmental Management Act can be obtainedfrom the Department of Environmental Affairs and Tourism athttp://www.environment.gov.za/. 31 Industry representative, interview by USITC staff, Chicago, Dec. 3, 2004, and “GlobalSurge in Use of Coal Alters Energy Equation,” Wall Street Journal, Nov. 16, 2004, p. A1. 32 DOE, EIA, International Energy Outlook 2004, p. 5. 33 Nathanson, Basic Environmental Technology, pp. 450-452. Of the major vehicle-producing countries or regions besides the United States, only in the European Union arevehicles produced that are designed not primarily for export. Unlike the United States, theEuropean Union has no specific vehicle fleet miles per gallon standards. Others, includingBrazil, China, and Japan, have discussed but not enacted so-called “café standards” on vehiclefleet mileage per gallon.. 34 Examples include higher octane, unleaded, and reformulated gasolines (RFG) withoxygenated fuel additives in jurisdictions with seasonal ozone concerns. 35 The U.S. EPA implemented diesel standards in 2001 that require the use of de-sulfurizeddiesel fuel. The EPA took this action so that pollution control devices, such as catalyticconverters, can be installed on diesel fuel engines. The changes will be phased in through2010. Nathanson, Basic Environmental Technology, p. 452.
3-5
Air pollution regulations in Thailand and South Africa are evolving more slowly thanin Mexico and Korea. In Thailand, the National Environmental Quality Act28 governsair pollution issues, but it is reported that weak enforcement mechanisms and a lack ofimplementation have limited the efficacy of the law.29 The regulatory environment inSouth Africa is likely the least developed of the subject countries. At present, theDepartment of Environmental Affairs and Tourism is working towards theimplementation of its National Environmental Management Act,30 the purpose of whichis to direct the development of environmental regulations.
Emission standards for hazardous air pollutants are being developed in several countries,and could lead to an increase in demand for air and noise pollution abatement goods andservices. For example, standards for emissions of mercury from power plants are underconsideration in the United States, Canada, and the European Union. Mercury emissionscontrols are likely to be instituted broadly in economically dynamic developingcountries such as China and India, which are heavily dependent on coal for powergeneration.31 Nevertheless, continued reliance on coal for fuel in many developingcountries will likely result in increased total global emissions of greenhouse gases–particularly CO2– through 2025.32
Mobile-source pollution is largely controlled through governmental product standardsregarding vehicle design, such as catalytic conversion and positive crankcase ventilation(PCV) systems for internal combustion engines. In the United States, fuel efficiencystandards, requiring manufacturers to increase average miles per gallon across the entirefleet, are also regulated.33 Additionally, fuel choices such as alternative blends34 and de-sulfurized diesel standards35 are employed by regulators to control emissions. Zeroemission (electric and hydrogen) and hybrid (partial fossil fuel-fired) vehicles are also
36 According to some industry sources, as much as $20 billion over the past ten years hasbeen spent by the U.S. Government in research support for fuel alternatives. See Patrick J.Michaels and others, “Meltdown: The Predictable Distortion of Global Warming byScientists, Politicians, and the Media,” Cato Institute, 2004. 37 Some states require annual testing, although others do so only at the time of purchase orthe first instance of state licensing. 38 The correlation coefficient is based on comparison of per capita GDP and air pollutionregulation stringency ratings of 100 developed and developing countries, as identified in theWorld Economic Forum’s The Global Competitiveness Report 2003-2004. Note that figure 3-1 is based on a subset of 40 of these countries and therefore, this coefficient is not directlycomparable to the results presented in figure 3-1. 39 U.S. Department of Energy, Energy Information Administration, “World CarbonDioxide Emissions from the Consumption and Flaring of Fossil Fuels, 1980-2002,” found athttp://www.eia.doe.gov/pub/international/iealf/tableh1co2.xls, retrieved Dec. 27, 2004. 40 The correlation coefficient is based on comparison of GDP and CO2 emissions for 172countries. Note that figure 3-2 is based on a subset of 43 of these countries, showing therelationship between GDP per capita and CO2 emissions per capita. Therefore, this coefficientis not directly comparable to the results presented in figure 3-2.
3-6
being developed and marketed, with significant governmental research support.36
Mobile sources are also commonly required to undergo regular emission standardstesting to ensure proper engine performance and minimize vehicular pollution. In theUnited States, such testing is prescribed by the states and may involve regular visits totesting facilities for compliance testing.37
Though air pollution regulations exist in most of the subject economies, the stringencyof such regulations and the ability of governments to monitor and enforce these lawsdiffers widely. A comparison of per capita income levels and industry perceptionsregarding the stringency of national air pollution regulations demonstrates the positiverelationship between the two factors (figure 3-1). In other words, air pollutionregulations are generally considered to be more stringent in high-income countries andless stringent in countries with lower per capita income levels. The correlation betweenper capita gross domestic product and stringency of air pollution laws is measured at0.83,38 indicating a strong positive relationship between economic welfare andregulatory enforcement. Evidence indicates that as incomes grow, regulatory stringencyincreases, driving demand for air and noise pollution goods and services. In developingcountries such as Thailand, Poland, and Chile, air pollution regulations exist but may beperceived to be weak or erratically enforced, and therefore noncompliance may be morecommon than in high-income countries. However, high-income countries are likely tohave greater cause for stringent enforcement of air pollution regulations, as they tend toemit more airborne pollutants than their developing-country counterparts.39 In acomparison of gross domestic product and carbon dioxide (CO2) emissions (figure 3-2),a distinct positive relationship is observed between national income and emissions,which registered a correlation coefficient of 0.84.40 There are certain exceptions, as

3-7
1 Data on air pollution regulations were derived from the World Economic Forum’s The GlobalCompetitiveness Report 2003-2004 in which executives of international firms were polled on the stringencyof air pollution regulations in selected countries. On a scale of 1-7, a rating of 1 denotes lax regulationscompared with most other countries, while a rating of 7 indicates that regulations are among the world’smost stringent.
2 Countries displayed in the figure include the 35 selected for special emphasis in this study (EUmember states are represented individually), as well as any additional nations among the 20 largestemitters of carbon dioxide in 2002, as identified in the U.S. Department of Energy, Energy InformationAdministration, “World Carbon Dioxide Emissions from the Consumption and Flaring of Fossil Fuels,1980-2002,” found at http://www.eia.doe.gov/pub/international/iealf/tableh1co2.xls, retrieved Dec. 27,2004. These countries include Australia (AUS), Austria (AUT), Belgium (BEL), Brazil (BRZ), Canada(CAN), Chile (CHL), China (CHN), Costa Rica (CRI), Czech Republic (CZE), Denmark (DNK), Estonia(EST), Finland (FIN), France (FRA), Germany (GER), Greece (GRC), Hungary (HUN), India (IND),Indonesia (IDN), Ireland (IRL), Italy (ITA), Japan (JPN), Korea (KOR), Latvia (LVA), Lithuania (LTU),Luxembourg (LUX), Malta (MLT), Mexico (MEX), Netherlands (NLD), Poland (POL), Portugal (PRT),Russian Federation (RUS), Slovakia (SVK), Slovenia (SVN), South Africa (ZAF), Spain (ESP), Sweden(SWE), Thailand (THA), Ukraine (UKR), United Kingdom (GBR), and United States (USA). Stringencyratings were not available for Cyprus, an EU member state, or for Iran and Saudi Arabia, the 16th and 19th
largest emitters of carbon dioxide, respectively.
The regression line in Figure 3-1 is the result of estimating the following equation using ordinary leastsquares (OLS) on the 40 observations in the table:
The regression yields an adjusted R2 of 0.6197. It should also be noted that the estimated coefficient $1 is0.0568 and that the 95 percent confidence interval is 0.0425 to 0.0711. This is consistent with ourhypothesis that stringency rises with GDP per capita.
Coefficient Estimate Standard error t statistic P > š t š 95 percent confidence interval$0 3.8750 0.1591 24.36 0.000 3.5530 4.1971$1 0.0568 0.0071 8.04 0.00 0.0425 0.0711
Source: GDP data obtained from the World Bank. GDP figure for Malta is from 2002.
GC
R ra
nkin
g of
stri
ngen
cy re
gula
tions
GDP per capita (thousand 1995 $US)0 5 10 15 20 25 30 35 40 45 50 55 60
0
1
2
3
4
5
6
7
AUSAUT
BEL
BRZ
CAN
CHL
CRI
CZE
DNK
EST
FIN
FRA
GER
GRC
HUN
IRL
ITA
JPN
KORLVALTU
LUX
MLT
MEX
NLD
POL
PRT
SVKSVN
ZAF
ESP
SWE
THA
GBR
USA
CHN
RUSUKR
Mor
e la
x
M
ore
strin
gent
IDNIND
Figure 3-1GDP per capita and industry perceptions of air pollution regulations,1 by country,22003
Stringency GDP / popi i i= + +0 1β β ε( )

3-8
1 Countries displayed in the figure include the 35 selected for special emphasis in this study(EU member states are represented individually), as well as any additional nations among the20 largest emitters of carbon dioxide in 2002, as identified in the U.S. Department of Energy,Energy Information Administration, “World Carbon Dioxide Emissions from the Consumptionand Flaring of Fossil Fuels, 1980-2002,” found athttp://www.eia.doe.gov/pub/international/iealf/tableh1co2.xls, retrieved Dec. 27, 2004. Thesecountries include Australia (AUS), Austria (AUT), Belgium (BEL), Brazil (BRZ), Canada (CAN),Chile (CHL), China (CHN), Costa Rica (CRI), Cyprus (CYP), Czech Republic (CZE), Denmark(DNK), Estonia (EST), Finland (FIN), France (FRA), Germany (GER), Greece (GRC), Hungary(HUN), India (IND), Indonesia (IDN), Iran (IRN), Ireland (IRL), Italy (ITA), Japan (JPN), Korea(KOR), Latvia (LVA), Lithuania (LTU), Luxembourg (LUX), Malta (MLT), Mexico (MEX),Netherlands (NLD), Poland (POL), Portugal (PRT), Russian Federation (RUS), Saudi Arabia(SAU), Slovakia (SVK), Slovenia (SVN), South Africa (ZAF), Spain (ESP), Sweden (SWE),Thailand (THA), Ukraine (UKR), United Kingdom (GBR), and United States (USA).
Note.--The regression line is the result of estimating the following equation using ordinary leastsquares (OLS) on the 43 observations in the table, weighted by population:
Theregression yields an adjusted R2 of 0.6754. It should also be noted that the constant $0 isestimated to be 0.101 (101 kg/capita) and the 95% confidence interval is -1.328 to 1.531, sowe cannot reject the hypothesis that the intercept is equal to zero, consistent with theassumption that pollution is related to economic activity.
Coefficient Estimate Standard error t statistic P > š t š95 percent confidence
interval$0 0.1015 0.7078 0.14 0.887 -1.3278 1.5309$1 2.4182 0.2572 9.40 0.000 1.8987 2.9377
Source: GDP data obtained from the World Bank. Emissions data were obtained from the U.S.Department of Energy, Energy Information Administration.
Tons
CO
2 pe
r cap
ita
2002 GDP per capita (thousand 1995 $US)0 10 20 30 40 50 60
0
4
8
12
16
20
24
CHN
IRN
IND
UKR
LVA
LTU
IDNTHA
RUS
CRI
ZAF
POL
MEX
CZEEST
HUN
BRZ
SVK
CHL
SAU
MLT
SVN
GRC
PRT
CYP
KOR
ESPITA
GBR
CAN
AUS
BEL
IRL
FRA
NLD
USA
GER
FIN
SWE
AUT
DNKJPN
LUX
Figure 3-2Per capita GDP and CO2 emissions, by country,1 2002
(CO / pop) pop pop (GDP / pop) pop pop2 i i i i i i i= + +0 1β β ε

41 A further comparison of CO2 emissions and thermal electricity generation reinforced theinterdependence between the two factors, yielding a correlation coefficient of 0.99. 42 Korean industry representative, interview by USITC staff, Seoul, Korea, Nov. 15, 2004. 43 42 U.S.C. 4901-4918. Information on the Noise Control Act can be found athttp://www.nonoise.org/epa/act.htm. 44 29 U.S.C. 651 et seq. (1770). Information on the Occupational Safety and Health Actcan be found at http://www.epa.gov. 45 Sher & Blackwell, European and US Developments in Noise Regulations, found athttp://www.sherblackwell.com/resources_noise.htm/, retrieved Mar. 16, 2005, p. 2.
3-9
some of the subject developed countries, such as France, are heavily reliant on nuclear,hydroelectric, or renewable energy and subsequently have lower CO2 emissions.41
Some developing markets reportedly place relatively little emphasis on noise pollution,generally focusing first on higher-priority environmental issues such as water and airpollution.42 In many cases, noise pollution (such as that caused by air traffic, motorvehicles, factories, etc.) is addressed in general environmental or labor laws.Additionally, noise pollution is often regulated by governmental bodies that focus onissues other than the environment. For example, Thailand does not have a lawspecifically addressing noise pollution, but the Public Health Act of 1992 and theFactory Act of 1992 address the control of certain types of noise pollution. Similarly,in Mexico, noise pollution and abatement regulations are found within comprehensivelabor standards established by the Ministry of Labor and Social Security, though nonational law directly addressing noise pollution is believed to exist.
Noise pollution legislation tends to be more specific in the developed countriesexamined in this report, but such legislation can also include myriad components. In theUnited States, the Noise Control Act of 197243 serves as the principal piece of legislationon ambient noise, while the Occupational Safety and Health Act of 197044 regulatesnoise from industrial activity. However, standards for noise pollution from transportationsources are established by the Department of Transportation, and those for residentialareas are established by the Department of Housing and Urban Development. Stateagencies also play a role in the enforcement of noise regulations in the United States.
As one example of a regulation that addresses a specific noise issue, efforts in the UnitedStates, under the Aircraft Noise and Capacity Act of 1990, to abate aircraft noise focusedon a 1999 deadline to remove certain noisy, and generally older, aircraft fromcommercial and corporate fleets.45 Some engineering and manufacturing firms developedso-called hush kits that enabled the older Chapter 2 aircraft to be certified as compliantwith the newer more stringent Chapter 3 regulations. Thus, airlines could extend theeconomic life of some older aircraft by installing noise abatement equipment or makingother modifications. However, as the airlines, and other operators added newer quieterChapter 3 aircraft to their fleets the demand for these noise abatement goods and servicesdiminished.
Much like national air pollution regulations, participation in regional and multinationalenvironmental agreements also spurs demand for air pollution abatement equipment andservices. Perhaps the most ambitious multinational agreement addressing air pollutionis the United Nations Framework Convention on Climate Change (UNFCCC) and the

46 Information on the United Nations Framework Convention on Climate Change and theKyoto Protocol to the Convention can be obtained at http://unfccc.int. 47 European Commission, “The Kyoto Protocol and Climate Change – BackgroundInformation,” Memo/02/120, May 31, 2002, found at http://europa.eu.int, retrieved Dec. 16,2004. 48 Reductions in carbon dioxide (CO2), methane (CH4), and nitrous oxide (N2O) will berelative to 1990 levels, while reductions in hydrofluorocarbons (HFCs), perfluorocarbons(PFCs), and sulphur hexafluoride (SF6) will be measured against either 1990 or 1995 levels. European Commission, “The Kyoto Protocol – A Brief Summary,” Aug. 19, 2004, found athttp://europa.eu.int, retrieved Dec. 16, 2004. 49 The treaty entered into force 90 days after ratification by the requisite number ofcountries. 50 While all of the subject countries except for Australia, Costa Rica, and the United Statesare parties to the Kyoto Protocol, parties that are not considered to be industrialized do nothave specific reduction targets at this time. 51 The United States was the largest emitter of CO2 from fossil fuels in 2002 among bothindustrialized and developing countries, followed by the EU, China, Russia, Japan, India, andCanada. U.S. Department of Energy, Energy Information Administration, “World CarbonDioxide Emissions from the Consumption and Flaring of Fossil Fuels, 1980-2002,” found athttp://www.eia.doe.gov/pub/international/iealf/tableh1co2.xls, retrieved Dec. 27, 2004. 52 The alternative approach proffered by the U.S. Government is directed to reducinggreenhouse gas emissions in proportion to economic growth, termed greenhouse gas intensity,by 18 percent from 2002 levels by 2012. DOE, EIA, International Energy Outlook 2004,p. 15.
3-10
subsequent Kyoto Protocol to the Convention.46 The UNFCCC was established in 1992as a forum through which to address problems associated with worldwide greenhousegas emissions. Under the Convention – to which 197 nations are signatories, includingall of the countries examined in this report – developed countries agreed to stabilizegreenhouse gas emissions at 1990 levels by the year 2000.47 However, the commitmentswere nonbinding and as 2000 approached, the anticipated progress had not materialized.In 1997, the Conference of the Parties established the Kyoto Protocol, a legally bindingagreement that requires, inter alia, industrialized countries to reduce emissions of 6major greenhouse gases48 to pre-1990 levels during the 2008-2012 period. In order forthe Kyoto Protocol to enter into force, it required ratification by industrialized countrieswhose collective CO2 emissions account for at least 55 percent of world totals in 1990.In November 2004, Russia ratified the agreement and thus elevated the group of 128ratifying countries above the 55 percent threshold. As such, the Kyoto Protocol enteredinto force on February 16, 2005,49 at which time member countries became legallyobligated to meet the emissions control targets to which they have committed. In orderto achieve these targets, countries will have to pursue strategies that are likely tocombine more stringent air pollution control mechanisms, cleaner fuels, and energyefficiency programs. As a result, the most dramatic increase in demand for air pollutionabatement equipment and services among the subject countries will likely occur in theEuropean Union, Japan, and Canada,50 the second-, fourth-, and fifth- largest emitters ofCO2 from fossil fuels among industrialized countries in 2002, and the top three emittersof CO2 among those countries that have undertaken mandatory emission control targetsunder the Kyoto Protocol.51 The United States, the world’s top emitter of CO2 from fossilfuels, has signed but not ratified the Kyoto Protocol, and therefore has no legalobligation to reduce greenhouse gas emissions.52

53 United Nations Development Programme, “The Vienna Convention and the MontrealProtocol,” found at http://www.undp.org/seed/eap/montreal/montreal.htm, retrieved Dec. 16,2004. 54 Industry representative, interview by USITC staff, Tokyo, Japan, Nov. 4, 2004. 55 Industry representative, interview by USITC staff, Bangkok, Nov. 11, 2004. 56 Industry representative, interview by USITC staff, Bangkok, Nov. 11, 2004. 57 Ibid. 58 Industry representative, interview by USITC staff, Tokyo, Japan, Nov. 4, 2004. 59 Ibid.
3-11
Prior to the Kyoto Protocol, the Vienna Convention for the Protection of the OzoneLayer (1985) and its subsequent Montreal Protocol on Substances that Deplete theOzone Layer (1987)53 emerged as the most prominent international agreementsaddressing ozone depletion. These agreements required ratifying countries to curbproduction and use of chlorofluorocarbons (CFCs) and other ozone depleting chemicalssuch as halons and methyl bromide. Although the agreements did not necessarilystimulate demand for air pollution abatement equipment and services per se, as theyeffectively served as bans on particular products, they established certain standards forthe formation and implementation of future international environmental agreements suchas the UNFCCC and Kyoto Protocol.
Lastly, although public sentiment lacks the legal weight of the aforementionedregulations and agreements, it is reportedly a driver of demand in air and noise pollutionabatement markets.54 Air quality is consistently ranked as a high environmental priority55
by many people throughout the world, regardless of economic development. As such,those who experience or fear the effects of diminishing air quality are often mobilizedto hold governments and/or companies accountable56 until change is enacted. Similarly,citizens who feel the direct effects of noise pollution are likely to pressure state and localgovernments into action.57 As noted in the literature review of this report (chapter 2),disclosure of information on pollution levels has been found to motivate the generalpublic to demand environmental compliance by polluters. In Japan, for example,companies that violate air pollution laws do not typically receive heavy financialpenalties; rather, violations are made public and the company is subjected to widespreadscrutiny.58 The importance of public sentiment in Japan is reportedly strong enough toserve as an enforcement mechanism for environmental regulations, resulting in a rise indemand for environmental goods and services as polluters take responsibility forabatement activities.59

3-12
Table 3-1Factors affecting supply and demand in the air and noise pollution abatement services and goods industries
Country Regulatory environmentMajor Internationalobligations
Availability of keytechnologies
Other factors affecting supply anddemand
Australia In 1998, the national government, along withstate and local territories, establishednational standards for key air pollutantsunder the National Environment ProtectionMeasure for Ambient Air Quality.1
Australia’s key legislation regarding noisepollution is the Noise Control Act 1975,2
which advocates prevention, abatement,and minimization of noise and vibration andplaces regulatory authority with the nationalEPA, Waterways Authority, and localgovernments. The Noise ControlRegulation 1995 addresses noise levels formotor vehicles; and the EnvironmentalPlanning and Assessment Act 1979encourages preemptive noise abatementthrough effective planning.
UN Framework Conventionon Climate Change (1992)and its subsequent KyotoProtocol (1997)3 (signedbut not ratified)
Vienna Convention for theProtection of the OzoneLayer (1985) and itssubsequent MontrealProtocol on Substancesthat Deplete the OzoneLayer (1987)4
Virtually all key air andnoise pollutionabatement technologiesare believed to beavailable across the costspectrum, either fromdomestic or foreignsuppliers.
Owing in large part to the prevalenceof ground contamination and watersalinity issues, air pollution control isnot presently considered to beamong Australia’s top environmentalmanagement issues.5
See footnotes at end of table.

3-13
Table 3-1—ContinuedFactors affecting supply and demand in the air and noise pollution abatement services and goods industries
Country Regulatory environmentMajor Internationalobligations
Availability of keytechnologies
Other factors affecting supply anddemand
Brazil In 1981, Brazil enacted a nationalenvironmental policy under Law 6,938,which established liability for pollutingactivities and authorized prosecution byfederal and state district attorneys. TheMinisterio do Meio Ambiante (MMA),created in 1992, oversees this nationalpolicy, and its Conselho Nacional do MeioAmbiente (CONAMA) establishes air qualitystandards and determines fines forviolations. Under CONAMA’s national airquality monitoring program, which isadministered by the Brazilian Institute of theEnvironment and Renewable NaturalResources (IBAMA), limits on emissionswere established, along with a monitoringnetwork to analyze air quality on acontinuous basis.6 Vehicular air pollution issevere in the urban areas of Sao Paolo andRio de Janeiro, areas which tend to be thefocus of CONAMA’s regulatory activities. However, enforcement outside of theseurban areas is typically weak.7
UN Framework Conventionon Climate Change (1992)and its subsequent KyotoProtocol (1997)
Vienna Convention for theProtection of the OzoneLayer (1985) and itssubsequent MontrealProtocol on Substancesthat Deplete the OzoneLayer (1987)
Brazil participates inseveral commissions of theMERCOSUL.
Most key air and noisepollution abatementtechnologies areavailable from eitherdomestic or foreignsources.
Air pollution in Brazil isoverwhelmingly due to vehicularemissions in the urban areas of SaoPaolo and Rio de Janeiro, since 90percent of Brazil’s electricity needsare met by hydropower.8 Potentialmarket drivers include, inter alia,stricter legislation, communitypressure, and migration toward betteroverall environmental practices.9
See footnotes at end of table.

Table 3-1—ContinuedFactors affecting supply and demand in the air and noise pollution abatement services and goods industries
3-14
Country Regulatory environmentMajor Internationalobligations
Availability of keytechnologies
Other factors affecting supply anddemand
Canada The Provinces in Canada account for mostof the legislation and regulation regardingair and noise pollution control. The federalgovernment provides broad measures andsome specific regulation in certain areas.There has been some debate anddisagreement about the efficiency, e.g.,industry must meet two sets of standards,and Canada has established CanadianCouncil of Environment Ministers to attemptto set priorities and to minimize overlap andduplication.10
The Canadian Environmental Protection Act(CEPA), in force since 2000, is the keyframework legislation covering air pollution.CEPA provides the federal environmentminister with the authority to orderelimination of toxic substances from theenvironment.11
The Clean Air Agenda (2000), is a federal10-year plan focused on reducingtransboundary emissions, as well asemissions from major industrial sectors andtransportation.12
Noise pollution is addressed in federalhealth and labor legislation. The Ministry ofHealth and the Ministry of HumanResources Development both address noisepollution in the work place. Noise pollutionfrom transportation sources is sometimesaddressed in individual regulations.13
Convention on Long-rangeTransboundary AirPollution (1979)14
Vienna Convention for theProtection of the OzoneLayer (1985) and itssubsequent MontrealProtocol on Substancesthat Deplete the OzoneLayer (1987)
1991 Agreement BetweenCanada and the UnitedStates on Air Quality andits 2000 Protocol on Ozone
UN Framework Conventionon Climate Change (1992)and its subsequent KyotoProtocol (1997)
1993 North AmericanAgreement onEnvironmental Cooperation
1998 Canada-ChileAgreement onEnvironmental Cooperation
2001 StockholmConvention on PersistentOrganic Pollutants
Virtually all key air andnoise pollutionabatement technologiesare believed to beavailable across the costspectrum, either fromdomestic or foreignsuppliers.
While Canada has an economy thatincludes a broad range of industrialactivities, the largest sources ofemissions of many of the airpollutants are primary energyproduction, electricity production, andselected areas of mining andmanufacturing. These areas includechemicals, fertilizers, pulp and paper,mining, smelting and refining ofaluminum and steel, cement, limeand glass. This concentration affectsthe demand for processes andequipment to treat the air pollutionproduced by these sectors andindustries.
See footnotes at end of table.

Table 3-1—ContinuedFactors affecting supply and demand in the air and noise pollution abatement services and goods industries
3-15
Country Regulatory environmentMajor Internationalobligations
Availability of keytechnologies
Other factors affecting supply anddemand
Chile The Servicio de Salud Metropolitano delAmbiente (SESMA), an arm of the cabinet-level Ministry of Health, develops emissionsstandards, monitors air quality, andimplements pollution reduction programsthroughout Chile.15
In 1996, a Supreme Degree signed by theChilean President identified Santiago and itssurrounding areas as an “air pollutionsaturated zone.” Subsequently, thegovernment began providing incentives forprivate industry to clean up its activities andcreated the Atmosphere Prevention andDecontamination Plan for the MetropolitanRegion (PPDA), which establishes legally-enforceable limits on industry pollution.16
UN Framework Conventionon Climate Change (1992)and its subsequent KyotoProtocol (1997)
Vienna Convention for theProtection of the OzoneLayer (1985) and itssubsequent MontrealProtocol on Substancesthat Deplete the OzoneLayer (1987)
The recently-implementedU.S.-Chile FTA requeststhat the Chileangovernment enforce Chile’sdomestic environmentalregulations.17
Key air and noisepollution abatementtechnologies areavailable from eitherdomestic or foreignsources.
Air pollution in Chile is predominantlya product of vehicular emissions andcopper mining, as over half of thecountry’s electricity needs are beingmet by hydropower.18 Chile is thelargest producer of copper in theworld, and its copper mining andsmelting operations in the Santiagoarea have contributed to high levelsof sulphur dioxide and particulatematter.19 Vehicular air pollution inSantiago has become severe, withthe number of vehicles in the cityhaving reached 1 million.20
See footnotes at end of table.

Table 3-1—ContinuedFactors affecting supply and demand in the air and noise pollution abatement services and goods industries
3-16
Country Regulatory environmentMajor Internationalobligations
Availability of keytechnologies
Other factors affecting supply anddemand
Costa Rica The key piece of air pollution legislation isLey Organica del Ambiente (1994).
Other major air laws include Nos. 731,5395, 7223, 7554, and 8219 - whichestablish metropolitan air quality standards,establish material transport, storage, anduse laws, and tangentially affect theoperation of cement plants and boilers.21
There are now 120 regulations on theenvironment. Major decrees for air includeDecreto 26789 (which established vehicularand fuel requirements) and Decreto 31849,Reglamento general sobre losProcedimientos de Evaluación de ImpactoAmbiental, of 2004, which defines aprocedure for monitoring ambient airquality.22
The biggest source of noise is automotive. There are no noise regulations beyondvehicular.23
UN Framework Conventionon Climate Change (1992)and its subsequent KyotoProtocol (1997)
Vienna Convention for theProtection of the OzoneLayer (1985) and itssubsequent MontrealProtocol on Substancesthat Deplete the OzoneLayer (1987)
All key air and noisepollution abatementtechnologies arebelieved to be available,either from domestic orforeign suppliers.
Significant internationalpresence, in the form ofcorporate24 and NGOinvolvement,25 ensures ahigh international marketpresence.
To date, there is no legal mechanismto require companies to do their ownair quality measurements.26 Alltesting is being developed andperformed at the behest ofgovernmental forces, by private anduniversity labs.27 Only one lab,Lambda, is certified, but three othersare going through the process.28
Thus, market consumption is small,but the opportunity is large.
To date, the vast majority focus onambient air quality - few point sourcestandards have been developed, asmanufacturing activity is small (over60 percent of Cost Rican GDP isservices-oriented), most energy isrenewable (very little fossil fuelenergy), and water, wastewater, andsolid waste issues are of higherpriority.29
See footnotes at end of table.

Table 3-1—ContinuedFactors affecting supply and demand in the air and noise pollution abatement services and goods industries
3-17
Country Regulatory environmentMajor Internationalobligations
Availability of keytechnologies
Other factors affecting supply anddemand
EU Community Legislation in the area of airpollution abatement is principally aimed atcutting emissions from industrial activitiesand road vehicles.
In 1996, the Council Directive 96/62/EC(Ambient Air Quality Assessment & Mgmt)was passed. Requires establishment oflimit values, alert thresholds,monitoring/reporting processes, andcorrective action for the multiple pollutants.
Other significant directives include:
• Directive 2001/81/EC, National EmissionCeilings for Certain AtmosphericPollutants.
• Directive 2001/80/EC, Limitation ofPollutants from Large Combustion Plants
• Dir 70/220/EEC set limit values on carbonmonoxide, hydrocarbons, nitrogen oxides,and particulates for motor vehicles withdiesel and petrol engines.30
Enforcement of environmental regulations inEU member states is perceived to berelatively consistent and fair as compared toother countries.31
Air pollution regulations are considered tobe relatively stringent as compared to othercountries.32
UN Framework Conventionon Climate Change (1992)and its subsequent KyotoProtocol (1997)
Vienna Convention for theProtection of the OzoneLayer (1985) and itssubsequent MontrealProtocol on Substancesthat Deplete the OzoneLayer (1987)
Convention on Long-rangeTransboundary AirPollution (1979)
The market for airpollution abatementservices and equipmentin the EU is highlycompetitive. Moreover,most air pollutionabatement services andequipment are sourced/manufactured to EUspecifications. As aresult, key technologiesand equipment arewidely available at acompetitive cost.
There is strong public support formeasures that reduce air pollutionand/or improve air quality.
The adoption/implementation ofrequired EU air pollution standardswill drive the market in the Accessioncountries.33
See footnotes at end of table.

Table 3-1—ContinuedFactors affecting supply and demand in the air and noise pollution abatement services and goods industries
3-18
Country Regulatory environmentMajor Internationalobligations
Availability of keytechnologies
Other factors affecting supply anddemand
Japan To meet future commitments (e.g., KyotoProtocol), laws and standards have beenrevised and strengthened.34
Recently revised diesel engine emissionrestrictions and by 2005 will have theworld’s strictest diesel emission standardsunder the Law Concerning SpecialMeasures for Total Emission Reduction ofNitrogen Oxides and Particulate Matter fromAutomobiles (diesels) in Specified Areas.35
Other key air legislation includes:
Air Pollution Control Law (1968); BasicEnvironmental Law (1993); PollutionRelease and Transfer Registry Law (PRTRLaw) (1999); Special Implementation Lawon the Dioxin Family of Chemicals (2000)36
Regulatory standards and ordinances existfor noise generated by various sources. Key legislation is Noise Regulation Law.
Although there is limited use of criminalprosecutions or economic instruments(fines) to ensure compliance, a firm’s publicimage serves as the main incentive tooperate in an environmentally responsiblemanner.37
UN Framework Conventionon Climate Change (1992)and its subsequent KyotoProtocol (1997)
Vienna Convention for theProtection of the OzoneLayer (1985) and itssubsequent MontrealProtocol on Substancesthat Deplete the OzoneLayer (1987)
1988: GoJ enacted theOzone Layer ProtectionLaw.
June 2001: GoJ enactedthe Law for Ensuring theImplementation ofRecovery and Destructionof Fluorocarbonsconcerning SpecifiedProducts (FluorocarbonsRecovery and DestructionLaw).
May 2002: Japan revisedthe Law Concerning thePromotion of the Measuresto Cope with GlobalWarming.
Virtually all key air andnoise pollutionabatement technologiesare available across thecost spectrum, eitherfrom domestic or foreignsuppliers.38
Japanese supplied airand noise pollutionabatement goods andservices are generallymore expensive thanthose of U.S. orEuropean competitors.39
In 2000, production of air pollutioncontrol equipment in Japan trailedproduction of both waste treatmentequipment and water pollution controlequipment by wide margins.40
During 1990s emphasis shifted frompollution clean-up, to prevention andreduction.
Complaints about noise declined overthe last ten years, but began toincrease in FY 2000, and have sinceincreased steadily.41
See footnotes at end of table.
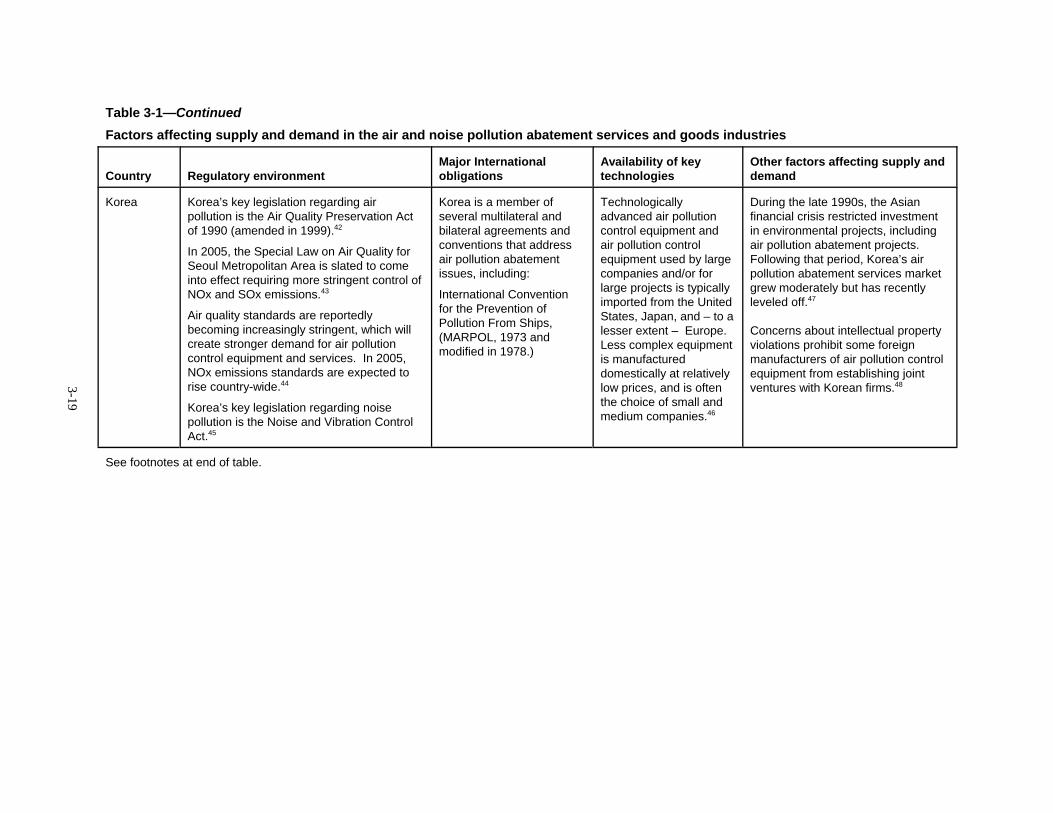
Table 3-1—ContinuedFactors affecting supply and demand in the air and noise pollution abatement services and goods industries
3-19
Country Regulatory environmentMajor Internationalobligations
Availability of keytechnologies
Other factors affecting supply anddemand
Korea Korea’s key legislation regarding airpollution is the Air Quality Preservation Actof 1990 (amended in 1999).42
In 2005, the Special Law on Air Quality forSeoul Metropolitan Area is slated to comeinto effect requiring more stringent control ofNOx and SOx emissions.43
Air quality standards are reportedlybecoming increasingly stringent, which willcreate stronger demand for air pollutioncontrol equipment and services. In 2005,NOx emissions standards are expected torise country-wide.44
Korea’s key legislation regarding noisepollution is the Noise and Vibration ControlAct.45
Korea is a member ofseveral multilateral andbilateral agreements andconventions that addressair pollution abatementissues, including:
International Conventionfor the Prevention ofPollution From Ships, (MARPOL, 1973 andmodified in 1978.)
Technologicallyadvanced air pollutioncontrol equipment andair pollution controlequipment used by largecompanies and/or forlarge projects is typicallyimported from the UnitedStates, Japan, and – to alesser extent – Europe. Less complex equipmentis manufactureddomestically at relativelylow prices, and is oftenthe choice of small andmedium companies.46
During the late 1990s, the Asianfinancial crisis restricted investmentin environmental projects, includingair pollution abatement projects. Following that period, Korea’s airpollution abatement services marketgrew moderately but has recentlyleveled off.47
Concerns about intellectual propertyviolations prohibit some foreignmanufacturers of air pollution controlequipment from establishing jointventures with Korean firms.48
See footnotes at end of table.

Table 3-1—ContinuedFactors affecting supply and demand in the air and noise pollution abatement services and goods industries
3-20
Country Regulatory environmentMajor Internationalobligations
Availability of keytechnologies
Other factors affecting supply anddemand
Mexico The Ministry of the Environment and NaturalResources (SEMARNAT) is the principalregulator of air pollution, issuing NormasOfficialas (NOM) official standards.49 Airemissions are governed by the Regulationson the Prevention and Control of AirPollution (D.O.F. 11/25/88).
There are NOMs on carbon monoxide, lead,nitrogen dioxide, ozone, sulfur dioxide, andtotal suspended particulates. Pollution frommobile sources is regulated by OfficialMexican Standards, based on the type ofvehicle (new or used), the classification andweight of the vehicle, and the type of fuelused.
SEMARNAT is responsible for establishingand enforcing federal laws, regulations, andstandards on air pollution until thisresponsibility is transferred to the Mexicanstates and Federal district. The timeline forsuch a transfer is unknown.
SEMARNAT has a “Single EnvironmentalLicense” system to streamline application,reporting, and enforcement of all air, water,etc. pollution control abatement measuresfor industrial operations. (D.O.F. 4/11/97,revised 4/9/98).
The Ministry of Labor and Social Security(STPS) is responsible for noise pollutionand abatement regulations which are primarily directed toward industrial workers’exposure to noise.
UN Framework Conventionon Climate Change (1992)and its subsequent KyotoProtocol (1997) (signed butnot ratified)
Vienna Convention for theProtection of the OzoneLayer (1985) and itssubsequent MontrealProtocol on Substancesthat Deplete the OzoneLayer (1987)
North American Agreementon EnvironmentalCooperation
It is believed all key airand noise pollutionabatement technologiesare available across thecost spectrum, eitherfrom domestic or foreignsuppliers.
While Mexico’s iron, steel, andfoundry industries – which tend to beheavily polluting – are relativelysmall, there are a substantial numberof mining smelters in operation.
A new air quality monitoring programwas recently introduced.
Industry is struggling to keep up withincreased costs of compliance;particularly in the mining industry.50
See footnotes at end of table.

Table 3-1—ContinuedFactors affecting supply and demand in the air and noise pollution abatement services and goods industries
3-21
Country Regulatory environmentMajor Internationalobligations
Availability of keytechnologies
Other factors affecting supply anddemand
South Africa Department of Environmental Affairs andTourism (DEAT) is the central policyformulating and coordinating body. DEATLaw Reform Program issued NationalEnvironmental Management Act (NEMA,Act 107 of 1998), targeting development ofregulations 1999-2002; still ongoing.
Fragmented legislation;51 ineffectiveenforcement;52 insufficient involvement /empowerment of people.53
Environmental Conservation Act 73 of 1989defines disturbing noise as that whichexceeds the ambient sound level by 7 dBAor more.54
According to DEAT, noise pollution (definedas coming from traffic, construction, mining,commercial recreation, and industrial) is“escalating with little practical regulatorystructure to control.”55
UN Framework Conventionon Climate Change (1992)and its subsequent KyotoProtocol (1997) (signed butnot ratified)
Vienna Convention for theProtection of the OzoneLayer (1985) and itssubsequent MontrealProtocol on Substancesthat Deplete the OzoneLayer (1987)
Availability oftechnologies isincreasing due to newregulatory andenvironmental educationplans.56
Less advanced technologies are oftenchosen due to costconsiderations.
Industry is facing challenges keepingpace with increased costs ofcompliance, particularly in the miningindustry.
See footnotes at end of table.

Table 3-1—ContinuedFactors affecting supply and demand in the air and noise pollution abatement services and goods industries
3-22
Country Regulatory environmentMajor Internationalobligations
Availability of keytechnologies
Other factors affecting supply anddemand
Thailand Environmental regulations are largely inplace and recent regulatory policies haveattempted to provide time-boundenforcement mechanisms, yet the lack ofeffective implementation, compounded bywidespread corruption limits effectiveness.Instances of warnings, fines, and plantclosures demonstrate a will to enforce,although overall enforcement remainsuneven.57
Key legislation on air pollution is theNational Environmental Quality Act (1992).
Environmental regulations are oftenincluded in laws not directly related to theenvironment including, for example, thePublic Health Act of 1992, the Factory Act of1992, and the National Economic and SocialDevelopment Plan.58
Existing standards include: air quality (CO,NO2, SO2, total suspended solids,particulate matter, ozone, lead); emissionstandards for mobile and point sources(including new and existing power plants,incinerators, steel industry); noise andvibration standards (including ambientnoise, mining and quarry, motor vehicle, andmotorcycle).59
UN Framework Conventionon Climate Change (1992)and its subsequent KyotoProtocol (1997)
Vienna Convention for theProtection of the OzoneLayer (1985) and itssubsequent MontrealProtocol on Substancesthat Deplete the OzoneLayer (1987)
Virtually all key air andnoise pollutionabatement technologiesare available, most ofwhich are purchasedfrom foreign suppliers(Japanese, U.S.European).60
The private sector isexpected to becomeincreasingly involved infunding environmentalinfrastructure projects ona “privatized” basis, asthe national governmentis no longer able to fundprojects at past levels,due to the continuingeconomic slowdown.61
The Royal Thai Government (RTG)has supported the pollution controlequipment market by lowering tariffsto 5% or less on assembled imports,providing tax incentives to newoverseas industrial investors, andproviding low-cost, affordable loansto local manufacturers to purchaseequipment. The RTG also supportsan ISO 14000 series of internationalstandards and has initiated the"Polluter Pays Principle."62
Thailand is a developing country andoften places more emphasis oneconomic development than onenvironmental issues. There isinsufficient financing forenvironmental projects and lawsinclude few penalties for violators.63
The market for systems that improveindoor air quality has grown inseveral industries includingelectronics, pharmaceuticals, andhealth care.64
See footnotes at end of table.

Table 3-1—ContinuedFactors affecting supply and demand in the air and noise pollution abatement services and goods industries
3-23
Country Regulatory environmentMajor Internationalobligations
Availability of keytechnologies
Other factors affecting supply anddemand
UnitedStates
The key legislation on air pollution is theClean Air Act (CAA), as amended,particularly those amendments passed in1990 which vastly expanded the number ofhazardous pollutants regulated; refined orestablished standards, controls, and permitprocesses; and strengthened EPA andState enforcement authority. Under theCAA, most States have submitted detailedregulatory implementation plans to EPA,which are enforceable at federal and statelevels.65
The principal legislation on ambient noise isthe Noise Control Act of 1972, as amended,which required EPA to establish maximumnoise levels to protect public health andwelfare, and to conduct research on theeffects and control of noise. TheDepartment of Transportation setsregulations to control noise coming frominter alia aircraft, vehicles, and highways.66
The Occupational Safety and Health Act of1970 (OSHA) set noise emission standardsfor businesses.
The Department of Housing and UrbanDevelopment established residentialguidelines for noise.67
UN Framework Conventionon Climate Change (1992)and its subsequent KyotoProtocol (1997) (signed butnot ratified)
Vienna Convention for theProtection of the OzoneLayer (1985) and itssubsequent MontrealProtocol on Substancesthat Deplete the OzoneLayer (1987)
North American Agreementon EnvironmentalCooperation
Agreement BetweenCanada and the UnitedStates on Air Quality
Convention on Long-rangeTransboundary AirPollution (1979) and itsprotocols
Stockholm Convention onPersistent OrganicPollutants (2001)(signed but not ratified)
Technologies developeddomestically and abroadto abate air and noisepollution are readilyavailable in the U.S.market.
Beginning in 1995, a national market-based cap and trade program toenable power plants to reduceemissions of sulfur dioxide, a majorcontributor to acid deposition,resulted in a 32-percent reduction by2003 in sulfur dioxide emissions asreported for such plants in 1990.68
1 Information on Australia’s National Environment Protection Measure for Ambient Air Quality can be found at http://www.deh.gov.au. 2 Information on Australia’s Noise Control Act of 1975 can be found at http://www.epa.nsw.gov.au. 3 Information on the United Nations Framework Convention on Climate Change and the Kyoto Protocol to the Convention can be obtained athttp://unfccc.int.

Table 3-1—ContinuedFactors affecting supply and demand in the air and noise pollution abatement services and goods industries
3-24
4 United Nations Development Programme, “The Vienna Convention and the Montreal Protocol,” found athttp://www.undp.org/seed/eap/montreal/montreal.htm, retrieved Dec. 16, 2004. 5 U.S. Commercial Service, “Environmental Technologies Australian Market Brief,” Mar. 2004, found at http://www.buyusa.gov/australia/en/pol.html,retrieved Jan. 7, 2005. 6 BNA, “Brazil Overview,” found at http://www.esweb.bna.com/, retrieved Sept. 2004. 7 Government representative, interviews with USITC staff, Sao Paolo, Dec. 16, 2004. 8 Ibid. 9 U.S. Foreign Commercial Service (USFCS), “Brazil: Pollution Control,” July 2004, found at http://www.focusbrazil.org.br/ccg/reports/pollution.pdf, retrievedSept. 2004. 10 Industry official, telephone interview with USITC staff, Sept. 22, 2004. 11 Bureau of National Affairs, “Country Profile: Canada,” found at http://esweb.bna.com/, retrieved Sept. 22, 2004, p. 4. 12 Ibid. 13 Canadian Centre for Occupational Health & Safety, Noise–Occupational Exposure Limits in Canada, found at http://www.ccohs.ca, retrieved Sept. 14,2004. 14 Information on the Convention on Long-range Transboundary Air Pollution can be found at http://www.unece.org. 15 BNA, “Chile Overview,” found at http://www.esweb.bna.com, retrieved Sept. 2004. 16 USFCS, “Chile Air pollution Control Equipment Report,” found at http://www.stat-usa.gov/, retrieved Sept. 2004. 17 USFCS, “Chile Country Commerical Guide GY 2004,” found at http:www.stat-usa.gov/, retrieved Sept. 2004. 18 U.S. Department of Energy, Energy Information Administration (EIA), “Chile,” Country Analysis Brief, July 2002, found athttp://www.eia.doe.gov/emeu/cabs/chile.html, retrieved Jan. 2005. 19 U.S. Department of Energy, EIA, “Chile: Environmental Issues,” Country Analysis Brief, July 2002, found athttp://www.eia.doe.gov/emeu/cabs/chilenv.html, retrieved Jan. 2005. 20 Ibid. 21 ENLACE, available at http://www.enlace-cri.org. 22 Ibid. 23 Government sources, interviews by USITC staff, Costa Rica, Dec. 6-10, 2004. 24 For example, SwissContact, which was been contracted by the government to help develop emissions control strategies, through 2004, and alternativeenergy sources, ongoing. USITC staff interview, San Jose, Dec. 6, 2004. 25 For example, ENTEBBE, which is a Central American regional environmental issues NGO, strives to develop public awareness of emerging environmentalissues through its Proyecto CENTAIRE. USITC Staff interview, San Jose, Costa Rica, Dec. 10, 2004. 26 Government sources, interviews by USITC staff, Costa Rica, Dec. 6, 2004. 27 Industry sources, interviews by USITC staff, Costa Rica, Dec. 6 and 9, 2004. 28 Ibid. 29 Government sources, interviews by USITC staff, Costa Rica, Dec. 6, 2004. 30 European Union website, found at http://www.europa.eu.int/, retrieved Nov. 10, 2004. 31 World Economic Forum, “Enforcement of Environmental Regulations,” World Competitiveness Indicators 2005. 32 Ibid. 33 Industry representatives, interview by USITC staff, Warsaw, Nov. 2, 2004. 34 Government officials, interview by USITC staff, Tokyo, Nov. 4, 2004.

Table 3-1—ContinuedFactors affecting supply and demand in the air and noise pollution abatement services and goods industries
3-25
35 Industry representative, interview by USITC staff, Tokyo, Nov. 5, 2004. 36 Industry representative, interview by USITC staff, Tokyo, Nov. 4, 2004. 37 Industry representatives and government officials, interviews by USITC staff, Tokyo, Nov. 4-8, 2004. 38 Government officials, interviews by USITC staff, Tokyo, Nov. 4-8, 2004. 39 Industry representatives, interviews by USITC staff, Tokyo, Nov. 4-8, 2004. 40 Industry representatives and government officials, interviews by USITC staff, Tokyo, Nov. 4-8, 2004. 41 Government official, interview by USITC staff, Tokyo, Nov. 4, 2004. 42 Information on Korea’s Air Quality Preservation Act can be obtained from the Ministry of Environment, found at http://eng.me.go.kr. 43 Ibid. 44 Government representative, interview by USITC staff, Seoul, Nov. 16, 2004. 45 Information on Korea’s Noise and Vibration Control Act can be obtained from the Ministry of Environment, found at http://eng.me.go.kr. 46 Industry representative, interview by USITC staff, Seoul, Nov. 15, 2004. 47 Ibid. 48 Ibid. 49 BNA, “Mexico Overview,” found at http://esweb.bna.com retrieved Sept. 22, 2004. 50 According to the Chief Inspector of Mines, as reported in "Most Small Miners Unable to Comply with Health and Safety Act," Mining e-News, Feb. 2004. 51 Department of Environmental Affairs and Tourism (DEAT) Business Plan 01 April 2004 - 31 March 2005, p. 4, available athttp://www.environment.gov.za/AboutUs/Business%20Plan/DEAT%20Business%20Plan2004-2005draft28am.pdf. 52 National Environmental Management: Air Quality Bill, Republic of South Africa, p. 29, available at http://www.environment.gov.za/. 53 South Africa's Economic Transformation: A Strategy for Broad-Based Black Economic Empowerment, available at http://www.dti.gov.za/bee/bee.htm. 54 DEAT 55 Ibid. 56 Ibid. 57 Government officials and Industry representatives, interviews by USITC staff, Bangkok, Nov. 10-12, 2004. 58 Industry representative, interview by USITC staff, Bangkok, Nov. 12, 2004. 59 Ministry of Natural Resources and Environment, found at http://pcdv1.pcd.go.th/Information/Regulations/air_noise/EmssionStandards.cfm. 60 Government officials and Industry representatives, interviews by USITC staff, Bangkok, Nov. 10-12, 2004. 61 Government officials, interviews by USITC staff, Bangkok, Nov. 10-11, 2004. 62 Ibid. 63 Government officials and Industry representatives, interviews by USITC staff, Bangkok, Nov. 10-12, 2004. 64 Industry representative, interview by USITC staff, Bangkok, Nov. 12, 2004. 65 Bureau of National Affairs, Country Profiles: United States, found at http://esweb,bna.com/, retrieved Sept. 23, 2004. 66 U.S. Environmental Protection Agency (EPA) and U.S. Department of Transportation, various websites. 67 Acoustical Society of America and Nathanson, “Noise Pollution and Control,” ch. 14, p. 468. 68 EPA, Acid Rain Program 2003 Progress Report, EPA 430-R-04-009, Sept. 2004, found at http://www.epa.gov/airmarkets/cmprpt/arp03/summary.html,retrieved Nov. 15, 2004, p. 3.


1 Jerry A. Nathanson, “Air Pollution and Control,” Basic Environmental Technology, 4th
ed. (Upper Saddle River, New Jersey and Columbus, Ohio: Prentice Hall, 2003), p. 443; andindustry representative, interview by USITC staff, Chicago, Dec. 2, 2004. 2 Nathanson, Basic Environmental Technology, p. 443. 3 Motor vehicle exhaust accounted for approximately 60 percent of U.S. CO emissions in2002. Coupling motor vehicles with off-road and nonroad sources, land transportation sourcesaccounted for 82 percent of CO emissions that year. In U.S. cities, motor vehicle exhaust hasaccounted for almost 95 percent of CO emissions since 1990. See Nathanson, BasicEnvironmental Technology, p. 450; and the U.S. EPA, “National Air Quality and EmissionsTrends Report, 2003 Special Studies Edition,” chapter 2, pp. 9-12, found athttp://www.epa.gov/air/airtrends/aqtrnd03/, retrieved Feb. 4, 2004. 4 Nathanson, Basic Environmental Technology, p. 415; and government and industryrepresentatives, interviews by USITC staff, Warsaw, Poland, Nov. 2-3, 2004. 5 World Resources Institute (WRI), “Climate and Atmosphere–United States,” EarthTrendscountry profiles, found at http://earthtrends.wri.org/, retrieved Dec. 22, 2004.
4-1
CHAPTER 4AIR POLLUTION ABATEMENTSERVICES AND EQUIPMENT
Air pollution is generally defined as an attribute of general air quality, in large partrooted in industrial activity and fossil fuel consumption. Stationary sources of outdoorair pollution– primarily fossil-fuel burning power plants, industrial plants, mining andrefining activities,1 and refuse incinerators2– emit particulate matter (PM), sulfur oxides(SOX), and nitrous oxides (NOX), and, in the case of coal-burning power plants, mercury,arsenic, lead, and other trace elements. Mobile sources of outdoor air pollution– mainlyhighway vehicles but also aircraft, trains, vessels, and farm and recreational vehicles–are responsible for the majority of carbon monoxide (CO) pollution in mostindustrialized countries3 and lead pollution in less-developed countries. Amongstationary sources of air pollution, residential and municipal heating systems, powerplants, and refuse incinerators generate significant CO and carbon dioxide (CO2)emissions through the burning of coal, petroleum, and natural gas, or their derivativessuch as coke, heating oil, or propane.4 Energy production also generates a large volumeof PM from the burning of solid fossil fuels. Solid and liquid fuels generally containsulfur, which becomes gaseous compounds (SOX) when burned. The evolving gases andthe ash also contain trace elements that originate in the source fuel and are emitted intothe atmosphere upon consumption of the fuel.
Certain manufacturing industries– such as mining, refining, metal working, and chemicalproduction– often employ on-site power generation facilities or consume fuels as partof their processes. Thus, manufacturing industries use emissions safeguards similar tothose employed by the energy industry. However, manufacturing industries’ bulkgeneration of carbon gases is significantly lower than for the energy industry.5Moreover, like the energy industry, manufacturing industries generate particulate matterand sulfur, particularly in metal refining and melting operations, because of the use of

6 Nathanson, Basic Environmental Technology, p. 443. 7 These events resulted in many deaths and injuries from inhaling polluted air in the MeuseValley, Belgium, in 1930, in Donora in western Pennsylvania in 1948, and in London, UK, in1952. For a historical background, see Nathanson, Basic Environmental Technology, p. 408,and The Fluoride Action Network, found at http://www.fluoridealert.org/meuse.htm/,retrieved Mar. 22, 2005. 8 As related to medicine, acute is defined as “reaching a crisis rapidly.” Merriam-WebsterInc., Webster’s II New Riverside University Dictionary (Boston, MA: Houghton Mifflin Co.,1984). 9 In the United States, 188 pollutants are specified as HAPs in the 1990 Clean Air ActAmendments, which updated and expanded the scope of the original 1963 Act and subsequentversions. 10 As related to medicine, chronic is defined as “subject to a habit or disease for a lengthyperiod.” Webster’s. 11 Methane is the principal component of natural gas, which is a mixture of approximately75 percent methane (CH4) with other hydrocarbons, such as ethane, propane, and butane.Methane is also naturally generated in coal mines and from anaerobic decomposition of plantand animal matter. From “Chemical of the Week,” found at the University of Wisconsin’sScience is Fun website, at http://scifun.chem.wisc.edu/chemweek/methane/methane.html,retrieved Jan. 7, 2005. 12 PM10 refers to particles with a diameter of 10 microns or less. Larger particles are notconsidered respirable and are much less likely to emit from industrial processes, due to theirgreater settling and capture potential. A standard proposed for PM-2.5 awaits successfuldevelopment of control mechanisms. Little historical data exist on which to determineappropriate emission levels. 13 The United States has established a National Ambient Air Quality Standard (NAAQS)for pollutants– namely, CO, SO2, PM, lead, NO2, and O3. Ozone is not emitted, but resultsfrom a chemical reaction that occurs between other emissions– notably volatile organiccompounds (VOCs), such as freon, and nitrogen oxides– which are subject to air pollutioncontrol. U.S. Environmental Protection Agency (EPA), Office of Air and Radiation, found athttp://www.epa.gov/air/criteria.html.
4-2
metal smelters and high-temperature furnaces. The chemicals and the mining andrefining industries produce a wide array of additional possible effluents depending onsource materials, products, and processes.6
During the past century, three major “smog” events near industrial centers,7 combinedwith increasing knowledge regarding the health effects of air pollution, have led mostmajor industrialized nations to develop legal and regulatory protocols for the control ofambient air quality, largely targeting the sources of air pollution emissions. Historically,the control of emissions related to acute8 respiratory events was addressed, notablyemissions resulting from incomplete fossil-fuel combustion products such as PM, CO,and SOX. The list of emissions subject to control has expanded over time to includehazardous air pollutants (HAPs)9– elements such as lead, arsenic, and mercury, andchemicals such as dioxins– all of which were found to have potential chronic10 healtheffects. More recently, greenhouse gases such as CO2, nitrogen dioxide (NO2), andmethane11 as well as ozone (O3) depleting substances (such as many aerosols and othersynthetic hydrocarbons) are being monitored and, in some cases, controlled. Emissionsof six pollutants (volatile organic compounds (VOCs), NOX, CO, lead, sulfur dioxide(SO2), and PM10
12)13 are generally recognized worldwide as appropriate to measure

14 Energy and Environmental Analysis, Inc. (EEA), "Breathing Easier About Energy - AHealthy Economy and Healthier Air," Introduction and Methodology, Jan. 2002, found athttp://www.cleanairprogress.org/research/energy_report_2.asp, retrieved Dec. 27, 2004. 15 Information on technologies and methods is derived from a variety of sources, as noted,especially Nathanson, Basic Environmental Technology. 16 Most services pertaining to mobile source air pollution abatement involve monitoringand assessment services, and are not contractually tied to and associated with the purchase ofgoods such as vehicle exhaust systems. 17 Nathanson, Basic Environmental Technology, p. 443. 18 Notable exceptions are the pulp and paper industry, which utilizes wood to generateenergy, and the primary production of steel, which uses coal to provide the carbon componentof steel, and much of the heating energy. Downstream ferrous manufacturing, however, isconverting to alternative energies where possible. 19 Gustavo E. Lagos and others, Ed., Plenary Lectures, Economics and Applications ofCopper, Vol. I-VI, Proceedings of the 5th International Conference, Copper/Cobre 2003(Santiago, Chile), Canadian Institute of Mining, Metallurgy and Petroleum, Quebec, Canada,2003; and W. Trinks and others, Ed., Industrial Furnaces, 6th Edition, J. Wiley & Sons, 2003. 20 Nathanson, Basic Environmental Technology, p. 443. 21 Nathanson, Basic Environmental Technology, p. 443.
4-3
and control with respect to air quality.14 Indoor air pollution focuses on mold, radon,asbestos, and other contaminants in buildings. The list of pollutants under review andultimately subject to control is constantly increasing, albeit often without uniformityacross countries, as knowledge and scientific advancements increase pollution detection,evaluation, and control.
Technologies and Methods15
Air pollution abatement services principally entail the detection, measurement, andmanagement of air pollution emitted from sources or formed in the atmosphere. Servicesinclude monitoring, assessment, and control of indoor or outdoor air pollutionoriginating from stationary or mobile sources;16 services related to the trading of airpollution emission rights; services relating to the monitoring, assessment, or control ofacid rain; services related to the study of the relationship between air pollution andclimate; and services incidental to air pollution abatement.
In general, the minimization of pollution at the source, through fuel substitution and/orchanging the production process, reduces emissions faster and more cost-effectively inthe long term than purchasing and maintaining costly air cleaning and disposalequipment.17 For example, most coal-fired power plants now use low-sulfur coalexclusively, and most new facilities use natural gas. During the last 50 years, thenonferrous mining and refining industries have converted almost all smelters into “flash”smelters, which require little to no fossil fuel. Similarly, many nonferrous manufacturingfurnaces18 have been converted from coal-, wood-, or coke-fired operations to naturalgas-fired operations, and in some cases, older furnaces have been replaced with electric-arc or the latest electric induction furnaces.19
If alternative fuel selection or process changes are not feasible or sufficient, air cleaningequipment often can be installed to meet emission reduction requirements.20 Thediversity of possible effluents gives rise to a variety of pollution control devices.21
Particulate control devices are incorporated with smokestacks, which allow particulates

22 Nathanson, Basic Environmental Technology, pp. 443-444. 23 Nathanson, Basic Environmental Technology, pp. 444-447. 24 Nathanson, Basic Environmental Technology, p. 447. 25 Nathanson, Basic Environmental Technology, pp. 447-448. 26 Nathanson, Basic Environmental Technology, p. 448. 27 Nathanson, Basic Environmental Technology, p. 447. 28 Recent modifications involve variations on cross- or co-current flows and packed mediachambers. The media are generally thermoplastics or other inert materials, although ceramicsand some metals are used. Nathanson, Basic Environmental Technology, p. 448. 29 Flash smelters, first developed by Outokumpu (Finland) in the 1930s, are noted for theirhigh concentration of expelled gases, which aids in economic gas cleanup. The firstinstallation in the United States was the Phelps Dodge Hidalgo facility in Playas, NewMexico, which began operation in 1974. Since then, most operating nonferrous smelters havebeen installed with or upgraded to varied flash smelting technologies in order to sufficientlycapture sulfur, as required.
4-4
to fall back down and be consumed or captured. Advances on this concept led to thecreation of gravity settling chambers of many sizes and orientations.22 Technologicalimprovements and the limitations and cost of space led to the development of aircyclones that speed up air movement and essentially centrifuge the particles to theexterior of the chamber for capture; the development of cloth filters for use at the pointat which particulates exit from these chambers; and electrostatic precipitators, whichinduce an electrical field to preferentially attract charged particles. In parallel, wetscrubbers, which treat the gaseous/particulate stream with water or other liquids in sprayor atomized form, were developed for use in industries where slurries are common, suchas the mining industry, where the scrubber slurry can be recycled back to the process formetal recovery.23
Gaseous and vapor control devices utilize either absorption or adsorption in techniquesanalogous to particulate scrubbers, although on a much larger scale.24 Vapors– such asmost VOCs– are more readily condensed into liquids or adsorbed onto solid surfaces.25
Typical technologies include cold chamber condensation such as cooling towers andrefrigerated “chill” units, and contact with multiple types of adsorption media (seeappendix F), such as activated charcoal.26 Gases do not readily condense and thus mustbe incinerated, treated chemically, or placed in contact with liquids.27 One notabletechnique is absorption, which involves passing gas through a liquid, such as water, tocapture the gases produced through combustion. An example is the ammonia producedthrough fertilizer manufacturing.28 Another technique is the common installation of acid-production plants at many smelting and manufacturing facilities since the Clean Air Act.The introduction of new smelting and metal melting technologies, which can producehigh grade SO2
29 gases, has enabled the development of acid plant technologies. Sulfuricacid plants bring the gases into contact with an acidic water to create a

30 Sulfuric acid (H2SO4) is essentially SO3 plus water (H2O). Sulfuric acid plants clean andde-water a high concentration SO2 flue gas effluent, catalytically convert it to SO3, contact itwith a high grade sulfuric acid-water mix in an absorption tower, and dilute it with lower-grade process streams to create a salable product for transport. See "The Acid Process," athttp://www.enviro-chem.com/plant-tech/3rdtier/acidprocess.html, for a detailed summary ofacid plant technology. 31 Nathanson, Basic Environmental Technology, pp. 448-449. Flue gas desulfurization(FGD) is a process that became available in the 1970s, and has two types: wet and dry. Anexplanation of wet FGD can be found athttp://www.worldbank.org/html/fpd/em/power/EA/mitigatn/aqsowet.stm, retrieved Feb. 4,2005. A dry FGD plant explanation can be found athttp://www.mhi.co.jp/mcec/product/fgd.htm, retrieved Feb. 4, 2005. 32 Nathanson, Basic Environmental Technology, pp. 449-450. 33 Industry representatives, interview by USITC staff, Chicago, Dec. 3, 2004; andtelephone interviews by USITC staff, Jan. 2005. 34 Equipment such as wet scrubbers and associated pumps and metal work is wellestablished and, accordingly, services in connection with this equipment center on marketing,sales, delivery, installation, and maintenance. The employment of other more advanced orproprietary technologies and equipment, such as flash smelters and converters, acid plants andother contact media technologies, electrostatic precipitators, and FGDs, entails additionalservices such as engineering and construction management. 35 McIlvaine Co., estimates provided to USITC staff via e-mails, Dec. 23 and 28, 2004. 36 Estimates for air pollution abatement services include engineering, consulting, andmonitoring exclusively, as estimates are not available for other services in connection with airpollution abatement. An indeterminate portion of these estimates constitute part of the core airpollution abatement services discussed in chapter 1, while the remainder constitute part of theperipheral services.
4-5
salable sulfuric acid product.30 In facilities where the gases are not concentrated, suchas power plants, flue gas desulfurization (FGD), which adsorbs the sulfur content of thegas with either regenerable chemical media or lime, has become the dominanttechnology.31 Finally, incineration is used primarily for VOCs and gaseoushydrocarbons, whereby the gas is fed into a combustion chamber and re-ignited.32 Forinformation on companies providing various air pollution technologies and goods, see“Key Suppliers and Consumers” later in this chapter.
Market Size and CharacteristicsIndustry representatives indicate that services such as technical research anddevelopment, installation, and maintenance, are often included as an integral part of thepurchase price of air pollution control equipment.33 The integration of the price of suchservices may account for 10 percent to 30 percent of the price of air pollutionequipment.34 Based on this information, together with existing data on air pollutioncontrol goods, reasonable estimates of services values can be ascertained in the absenceof data published by government entities.
One industry source estimates35 that world-wide consumption of engineering, consulting,and monitoring services36 in connection with air pollution abatement totaled $2.4 billion,while consumption of air pollution abatement goods totaled $49.4 billion, in 2004.During 1994-2004, the market for such services and goods was estimated to grow at anaverage annual rate of 7 percent. In 2004, consumption of outdoor air pollution goods

37 McIlvaine Co. did not estimate consumption of services with regard to indoor airpollution abatement. 38 Industry estimates of consumption are available for 18 Member States of the EuropeanUnion – Austria, Belgium, Czech Republic, Denmark, Finland, France, Germany, Greece,Hungary, Ireland, Italy, the Netherlands, Poland, Portugal, Slovakia, Spain, Sweden, and theUnited Kingdom. As these 18 countries accounted for an estimated 84 percent of air pollutionabatement services and goods consumed in Europe in 2004, USITC staff observes that thecombined estimates for the 18 countries provide a considerable, although slightlyunderestimated, representation of consumption in the entire European Union. Foremostconsumers of air pollution abatement goods and services in the EU include Germany (4percent of world consumption), the United Kingdom (3 percent), and France, Italy, and Spain(2 percent each). 39 Environmental Business International Inc. (EBI). See ch. 1, page 1-6. 40 EBI, Environmental Business Journal, vol. 17, No. 9/10, 2004, p. 3. Estimates are notseparately reported for goods and services, and may include estimates for revenues generatedother than in connection with air pollution abatement. 41 EBI, Environmental Business Journal, vol. 17, No. 11/12, 2004, p. 2. Estimates includerevenues generated solely in connection with the provision of air pollution abatement services. 42 Industry representative, interview by USITC staff, Chicago, Dec. 3, 2004; and McIlvaineCo., U.S. Industry Market Leadership in Asia’s Air Pollution Control Sector, report preparedfor the United States-Asia Environmental Partnership, Jan. 2001, p. 17, found at Internetaddress http://www.usaep.org/, retrieved Dec. 3, 2004.
4-6
and services accounted for $44.2 billion (85 percent), while goods37 to abate indoor airpollution accounted for $7.6 billion (15 percent). Gaseous control systems, components,chemicals, and services accounted for approximately three-fifths of the value of outdoorair pollution abatement goods and services consumed in 2004, while particulate controlaccounted for the remainder.
The same industry source estimated that the United States consumed 28 percent of thetotal value of air pollution abatement goods and services consumed in world markets in2004 (see table 4-1 at the end of this chapter). The 18 principal consuming MemberStates of the European Union38 together consumed approximately 18 percent of suchgoods and services. Other major country markets included China (15 percent); Japan (6percent); Canada and the Republic of Korea (3 percent each); and Brazil, India, andTaiwan (2 percent each). During 1994-2004, growth in average annual consumption ofair pollution abatement services and equipment surpassed the world average of 7 percentin China (14 percent) and Canada (9 percent), equaled 7 percent in the United States andKorea, and lagged at 5 percent or less in Germany, Japan, and the United Kingdom.
Another industry source39 estimates that in the United States, firms principally engagedin producing air pollution control equipment generated revenues totaling $19.1 billionin 2003,40 and firms mainly engaged in engineering and consulting services on airquality generated $1.2 billion.41 Revenues earned by U.S. air pollution equipment firmsgrew very rapidly in the 1970s (over 1100 percent for the decade) owing largely to theClean Air Act’s extension in 1970. Rapid market growth continued during the 1980s(144 percent) and the 1990s (72 percent), followed by virtually no growth during 2000-2003. Revenue growth during the 1970s coincided with the period in which the UnitedStates was perceived as the world’s most stringent regulator of air pollution.42

43 Industry representative, interview by USITC staff, Chicago, Dec. 3, 2004; and McIlvaineCo., U.S. Industry Market Leadership in Asia’s Air Pollution Control Sector, pp. 20 and 25. 44 China’s and India’s economy grew by 9 percent and 8 percent, respectively, in 2003,while Taiwan’s increased by 6 percent in 2004, and Korea’s grew by 6 percent in 2002. U.S.Department of State, Background Notes, found at http://www.state.gov/r/pa/ei/bgn/, retrievedFeb. 26, 2005. 45 Industry representative, interview by USITC staff, Chicago, Dec. 3, 2004; and McIlvaineCo., U.S. Industry Market Leadership in Asia’s Air Pollution Control Sector, pp. 20 and 25. 46 Industry representatives, interviews by USITC staff, Chicago, Dec. 3, 2004, andBrussels, Belgium, Oct. 28, 2004. 47 McIlvaine Co., “Refinery Air Pollution Control Market to Double by 2009,” pressrelease, Aug. 2003, found at http://www.mcilvainecompany.com/, retrieved Sept. 22, 2004. 48 Industry representatives, interviews by USITC staff, Chicago, Dec. 3, 2004; andtelephone interviews by USITC staff, Jan. 7, 2005. The EPA lists FGD as a best availablecontrol technology (BACT) and currently is studying wet FGD for mercury control. 49 Industry representative, interview by USITC staff, Chicago, Dec. 3, 2004. 50 McIlvaine Co., estimates provided to USITC staff via e-mails, Dec. 23 and 28, 2004.
4-7
Asian countries, led by China, India, Korea, and Taiwan, are currently considered themost rapidly growing markets for air pollution abatement goods and services.43 Industrysources cite these economies’ rapid economic growth44 and accompanying constructionof infrastructure that significantly increase air pollution levels and, hence, the need forair pollution abatement technologies, equipment, and services.45
Numerous countries have implemented regulations limiting emissions of certain gases.Domestic regulations are making more of these countries competitive in world markets.One of the key technologies worldwide so as to limit gas emissions is flue gasdesulfurization (FGD). Germany and Japan require FGD by all domestic fossil fuelpower plants.46 In response, German and Japanese air pollution abatement firms havedeveloped this technology at home and are top suppliers in foreign markets, includingin the U.S. market. By contrast, the United States requires not a particular technologybut an emissions result. As industry can meet U.S. requirements by switching to alternatefuel sources, only about one-fourth of U.S. power plants currently employ FGDtechnology, although other large U.S. industrial consumers such as refineries continueto implement FGD systems among other air pollution abatement technologies.47
Moreover, implementation of FGD has not occurred in any new U.S. power plantswithin the past 15 years.48 As a result, U.S. firms do not have as extensive experiencein developing FGD technologies and are less competitive in many world FGD marketsthan their German and Japanese counterparts.49
The market for indoor air pollution abatement goods and services is a small fraction(about 15 percent) of the total estimated air pollution abatement market, and littleinformation about the indoor air pollution abatement market is available for mostcountries analyzed in this report. An industry source estimated that the United Statesaccounted for one-fourth (about $2 billion) of the total world market for indoor airpollution abatement goods in 2004.50 During 1994-2004, estimated world growth for theindoor air pollution abatement goods market averaged 10 percent per year, slightly fasterthan the rate for goods associated with outdoor air pollution abatement (6 percent).Industry sources cited Korea as an example of having a growing market for
51 Industry representative, interview by USITC staff, Seoul, Korea, Nov. 15, 2004. 52 Estimates on total world market shares for individual companies that provide airpollution abatement services and goods are not available. 53 For example, industry sources consider that small environmental consulting andengineering firms and small air pollution control equipment producers may generate revenuestotaling less than $20 million per year, while large firms generate revenues exceeding $100million. EBI, Environmental Business Journal, vol. 17, No. 11/12, 2004, p. 4; and EBI, TheEconomic Contribution of the California Air Pollution Control Industry, report, Oct. 2004, e-mailed to USITC staff, Dec. 14, 2004. 54 EBI, Environmental Business Journal, vol. 14, No. 3/4, 2002, p. 3. 55 The compilation of leading companies is based on information provided by McIlvaineCo., e-mail to USITC staff, Jan. 4, 2005; EBI, The Economic Contribution of the CaliforniaAir Pollution Control Industry, report, Oct. 2004, e-mailed to USITC staff, Dec. 14, 2004; andvarious company web sites. 56 Horiba is a global leader in vehicle and other engine emissions testing equipment andmaintains a technical center in Michigan for testing. 57 Industry representative, interview by USITC staff, Chicago, Dec. 3, 2004. 58 McIlvaine Co., “U.S. Air and Water Consulting Industry is Concentrated in a FewStates,” press release, Apr. 2003, found at http://www.mcilvainecompany.com/, retrieved Sept.22, 2004.
4-8
indoor air pollution equipment and services owing to rising concerns pertaining to levelsof indoor air pollutants, primarily VOCs, in high-technology industrial operations.51
Key Suppliers and ConsumersMany hundreds of private-sector firms supply air pollution abatement services,equipment, and technologies in competitive world markets.52 Most firms are small interms of revenue53 and supply a narrow range of abatement services or goods. Therelatively few large suppliers of air pollution abatement goods tend to provide multipletypes of equipment, technologies, and services in numerous markets world wide.54
Europe, Japan, and the United States are home to most of the large air pollutionabatement equipment firms, which also provide services in conjunction with the sale ofgoods. Major European-owned providers include ABB Environmental (Switzerland),Alstom (France), Durr Environmental (Germany), Enviro Technology Services (UnitedKingdom), Haldor Topsoe (the Netherlands), Hamon (Belgium), Johnson Matthey(United Kingdom), KWH (Germany), and Siemens (Germany).55 Major Japanese-ownedfirms include Ebara, Hitachi Zosen, Horiba,56 Hotaka Engineering (HTK), andMitsubishi Heavy Industries. Key providers of air pollution abatement goods andservices in North America include U.S.-owned firms Babcock & Wilcox, BabcockPower, Donaldson, GE (including recently acquired BHA Group), Thermo Electron, andWheelabrator, and Canadian-owned firm Marsulex.57
As noted in chapter 1, services provided in conjunction with air pollution abatementgoods and services include design, engineering, and consulting services. Like firms thatprovide “core” abatement goods and services, these firms vary markedly by size andbreadth of operations. U.S. firms include Bechtel, Black & Veatch, Burns & McDowell,CH2M Hill, Parsons, Sargent & Lundy, Shaw, TRC, URS, and Washington Group.58
Several of these U.S. firms also provide construction, design, engineering, and

59 Industry representative, interview by USITC staff, Chicago, Dec. 2, 2004. 60 McIlvaine Co., U.S. Industry Market Leadership in Asia’s Air Pollution Control Sector,p. 29. 61 Industry representative, interview by USITC staff, Chicago, Dec. 3, 2004. 62 Company information from various sources including corporate web sites anddescriptions of member firms provided by industry associations, including the Institute ofClean Air Companies. 63 Industry representatives, interviews by USITC staff, Chicago, Dec. 2, 2004, andWarsaw, Poland, Nov. 2-3, 2004; and U.S. Departments of State and Commerce, “AirPollution Control Equipment,” industry sector analyses, various country markets, found athttp://www.stat-usa.gov/. 64 EBI, The Economic Contribution of the California Air Pollution Control Industry, report,Oct. 2004, p. 50, e-mailed to USITC staff, Dec. 14, 2004. 65 Government and industry representatives, interviews with USITC staff, Warsaw, Poland,Nov. 2-3, 2004. 66 OECD, Com/TD/ENV(2000)86/Final, Annex 2: Environmental Goods, p. 65. 67 McIlvaine Co., "Industrial Emitters Equipment Sample, EPA Equipment Type Search,"found at http://www.mcilvainecompany.com/webtofc.html, Nov. 19, 2004.
4-9
procurement services in connection with air pollution abatement systems.59 Industrysources perceive that U.S. firms have a competitive advantage over European andJapanese firms based on experience in the provision of environmental consultingservices.60 Monitoring and testing services and equipment, such as that used incontinuous emissions monitoring of stationary source pollutants, are also provided byforeign firms such as Environnement (France),61 and U.S. firms such as PerkinElmer,Spectrum Systems Inc., and Thermo Electron.62
Principal consumers of air pollution abatement services and goods are fossil fuel-burningelectric power plants; industrial consumers in the chemical, metals, pharmaceutical, pulpand paper, cement, glass, and refining industries; construction and transportationequipment manufacturers; waste incinerators; and the mining and agriculturalindustries.63 Electric power plants reportedly accounted for about two-fifths, by far thelargest share, of stationary air pollution control equipment consumption in 2001.64
Additional consumers include public-sector owners of air pollution monitoring andtesting equipment and facilities; public-sector property owners responsible for assessing,obtaining, and managing outdoor and indoor pollution abatement services, systems, andequipment; and private-sector building owners and managers concerned with indoor airpollution abatement and control.65
Related EquipmentThe Organization for Economic Cooperation and Development (OECD) classifies airpollution devices for control of industrial emissions into seven categories:66 air-handlingequipment, catalytic converters, chemical recovery systems, dust collectors, separatorsand precipitators, incinerators and scrubbers, and odor control equipment. The McIlvaineCompany lists 97 separate devices currently approved to abate air pollution at U.S.industrial sites.67 Many devices can be grouped into functional classifications

68 Import and export data for selected countries as reported by the United Nations for thefollowing headings at the 6-digit level of product detail, which is the most specific productdetail available but not conducive for identification of trade in air pollution control goods;specifically. HS 252100, 252220, 281610, 701990, 841410, 841430, 841440, 841480, 841490,841780, 841960, 841989, 842139, 842199, 842490, 851410, 851420, 851430, and 851490.Air pollution control equipment HS numbers were identified by the OECD in “EnvironmentalGoods and Services: An Assessment of the Environmental, Economic and DevelopmentBenefits of Further Global Trade Liberalisation,” Joint Working Party on Trade andEnvironment (COM/TD/ENV(2000)86/FINAL), Oct. 5, 2000, found athttp://www.oecd.org/searchResult/0,2665,en_2649_201185_1_1_1_1_1,00.html. Data wasretrieved from the WITS database on Dec. 17, 2004. 69 USITC staff did not attempt to reconcile the data on world exports and imports of theseproducts, as retrieved from the WITS database. 70 Estimates for services trade include outdoor air pollution abatement services and excludeindoor air pollution abatement services. 71 McIlvaine Co., estimates provided to USITC staff via e-mail, Feb. 3, 2005. 72 McIlvaine Co. provided trade estimates for 18 of the 25 individual EU Member States.See footnote 38 in this chapter, p. 4-6.
4-10
such as the OECD categories (box 4-1). However, many devices have multiple functionsor address multiple pollutants. For example, a water blanket, such as that found in acooling tower, not only serves to provide odor control, but also captures and trapsprocess energy, gases, vapors, and particulates and returns them for processing.Likewise, process piping changes, such as bottom filling, serve to reduce exposure to airbut can also improve process efficiency by increasing the time for emission-reducingreactions to occur.
Trade and InvestmentOfficial trade and investment data on air pollution abatement services are not separatelyreported by industrialized countries. Additionally, official trade data provide little insightregarding exports and imports of air pollution abatement goods, or investment in thisindustry segment. The Harmonized System of Product Classification (HS) does notcharacterize or differentiate between goods on the basis of whether or not they are usedfor air pollution control. Moreover, individual countries’ official trade data reported toand published by the United Nations are not detailed enough to specifically identify suchtrade in air pollution control goods. In the absence of an established international list ofenvironmental goods equipment, the OECD identified 19 HS classification headings thatinclude air pollution control goods, although only a small portion of the goods classifiedin such headings pertain to traded air pollution control goods.68 In 2003, world exportsand imports of all products within the 19 HS categories, not simply those related to airpollution control, totaled $42.8 billion and $44.4 billion, respectively,69 with U.S.exports and imports accounting for $6.5 billion (15 percent) and $6.2 billion (14percent), respectively.
One industry source estimated that total world exports of air pollution abatementservices70 amounted to $430 million in 2004.71 The principal countries exporting airpollution abatement services in 2004 included the United States (49 percent), Japan (31percent), and Member States of the European Union72 (17 percent). Leading importmarkets for such services in 2004 included China (22 percent), the United States (19percent), and the EU (18 percent).
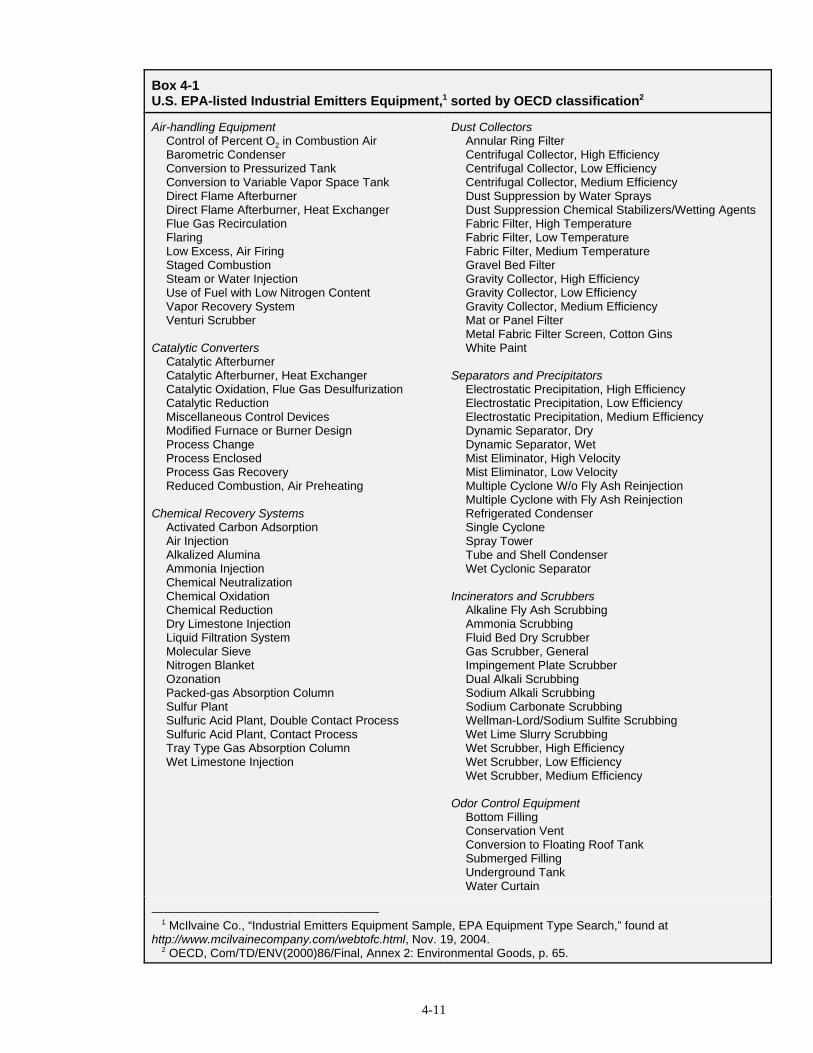
4-11
Box 4-1U.S. EPA-listed Industrial Emitters Equipment,1 sorted by OECD classification2
Air-handling EquipmentControl of Percent O2 in Combustion AirBarometric CondenserConversion to Pressurized TankConversion to Variable Vapor Space TankDirect Flame AfterburnerDirect Flame Afterburner, Heat ExchangerFlue Gas RecirculationFlaringLow Excess, Air FiringStaged CombustionSteam or Water InjectionUse of Fuel with Low Nitrogen ContentVapor Recovery SystemVenturi Scrubber
Catalytic ConvertersCatalytic AfterburnerCatalytic Afterburner, Heat ExchangerCatalytic Oxidation, Flue Gas DesulfurizationCatalytic ReductionMiscellaneous Control DevicesModified Furnace or Burner DesignProcess ChangeProcess EnclosedProcess Gas RecoveryReduced Combustion, Air Preheating
Chemical Recovery SystemsActivated Carbon AdsorptionAir InjectionAlkalized AluminaAmmonia InjectionChemical NeutralizationChemical OxidationChemical ReductionDry Limestone InjectionLiquid Filtration SystemMolecular SieveNitrogen BlanketOzonationPacked-gas Absorption ColumnSulfur PlantSulfuric Acid Plant, Double Contact ProcessSulfuric Acid Plant, Contact ProcessTray Type Gas Absorption ColumnWet Limestone Injection
Dust CollectorsAnnular Ring FilterCentrifugal Collector, High EfficiencyCentrifugal Collector, Low EfficiencyCentrifugal Collector, Medium EfficiencyDust Suppression by Water SpraysDust Suppression Chemical Stabilizers/Wetting Agents Fabric Filter, High TemperatureFabric Filter, Low TemperatureFabric Filter, Medium TemperatureGravel Bed FilterGravity Collector, High EfficiencyGravity Collector, Low EfficiencyGravity Collector, Medium EfficiencyMat or Panel FilterMetal Fabric Filter Screen, Cotton GinsWhite Paint
Separators and PrecipitatorsElectrostatic Precipitation, High EfficiencyElectrostatic Precipitation, Low EfficiencyElectrostatic Precipitation, Medium EfficiencyDynamic Separator, DryDynamic Separator, WetMist Eliminator, High VelocityMist Eliminator, Low VelocityMultiple Cyclone W/o Fly Ash ReinjectionMultiple Cyclone with Fly Ash ReinjectionRefrigerated Condenser Single CycloneSpray TowerTube and Shell CondenserWet Cyclonic Separator
Incinerators and ScrubbersAlkaline Fly Ash ScrubbingAmmonia ScrubbingFluid Bed Dry ScrubberGas Scrubber, GeneralImpingement Plate ScrubberDual Alkali ScrubbingSodium Alkali ScrubbingSodium Carbonate ScrubbingWellman-Lord/Sodium Sulfite ScrubbingWet Lime Slurry ScrubbingWet Scrubber, High EfficiencyWet Scrubber, Low EfficiencyWet Scrubber, Medium Efficiency
Odor Control EquipmentBottom FillingConservation VentConversion to Floating Roof TankSubmerged FillingUnderground TankWater Curtain
——————————————————— 1 McIlvaine Co., “Industrial Emitters Equipment Sample, EPA Equipment Type Search,” found athttp://www.mcilvainecompany.com/webtofc.html, Nov. 19, 2004. 2 OECD, Com/TD/ENV(2000)86/Final, Annex 2: Environmental Goods, p. 65.

73 McIlvaine Co., estimates provided to USITC staff via e-mails, Dec. 28, 2004, and Jan. 7and 11, 2005. 74 McIlvaine Co., estimates provided to USITC staff via e-mail, Feb. 3, 2005. 75 McIlvaine Co., estimates provided to USITC staff via e-mails, Dec. 28, 2004, and Jan. 7and 11, 2005. 76 McIlvaine Co., “Huge Power Plant Scrubber Markets in U.S. and China,” news release,Oct. 2003, found at http://www.mcilvainecompany.com/, retrieved Sept. 22, 2004; andindustry representatives, interviews by USITC staff, Tokyo, Japan, Nov. 4-8, 2004. 77 McIlvaine Co., “Thermal Air Pollution Equipment Market Growth Concentrated inCertain Industries and Markets,” news release, Nov. 2003, found athttp://www.mcilvainecompany.com/, retrieved Sept. 22, 2004; and industry representative,interview by USITC staff, Chicago, Dec. 3, 2004. 78 McIlvaine Co., estimates provided to USITC staff via e-mail, Feb. 3, 2005.
4-12
According to estimates by the same industry source, global exports of air pollutionabatement goods totaled $16.8 billion in 2004.73 The principal exporters of air pollutionabatement goods included EU Member States (30 percent, especially Germany at 16percent), the United States (27 percent), Japan (25 percent), and China (8 percent).Principal import markets for such goods in 2004 included China (21 percent), the EU (19percent), and the United States (15 percent).
In 2004, U.S. exports and imports of air pollution abatement services were estimated at$213 million and $83 million, respectively, resulting in a $130-million trade surplus.74
U.S. exports and imports of goods pertaining to air pollution control were estimated at$4.6 billion and $2.5 billion, respectively, yielding a $2.1-billion trade surplus.75 During1994-2004, the estimated average annual growth rate in U.S. exports of air pollutionabatement services (9 percent) outpaced the rate of increase in U.S. exports of such goods(6 percent).
Industry sources in the United States and Japan indicate that China is the most promisingmarket for air pollution abatement equipment and services, because of anticipated growthin the construction of power plants,76 and semiconductor, chemical, and motor vehicleproduction.77 Estimates of China’s growth potential are consistent with industry estimatesof the substantial growth in trade during 1994-2004 in China’s imports of air pollutionabatement services and goods as well as its exports of such goods. During 1994-2004,China’s imports of both air pollution abatement services and goods increased at the mostrapid rate of any country (13 percent annually, on average), about twice the estimatedgrowth rates of U.S. imports of such services and goods. According to one U.S. industrysource, China has not developed the capability to export air pollution abatementservices.78 Additional markets considered likely for future export growth include Taiwan,Korea, India, Poland, Turkey, and the United Kingdom.
The U.S. market is open to imports as well as foreign investors. Numerous European,Canadian, and Japanese firms have acquired U.S. firms or established affiliates in theUnited States, and some maintain manufacturing and engineering operations in the U.S.market. Examples include ABB Environmental Systems (Switzerland), Alstom (France),Hamon Research-Cottrell (Belgium), Hitz America (Japan), KWH (Germany), MarsulexEnvironmental Services (Canada), and Mitsubishi Power Systems (Japan). In addition,affiliates of two leading vehicle emissions testing firms from Canada and Spain operateunder contract to government transportation authorities in several U.S. states.

79 The schedules indicate a country’s commitment as to the extent to which national orsubnational laws provide for according market access and national treatment to foreign firmsin regards to specific services, or which apply to all services, in the four modes of supply:cross-border supply (mode 1), consumption abroad (mode 2), commercial presence (mode 3),and presence of natural persons (mode 4). Limitations scheduled under the GATS mayconstitute nontariff barriers to foreign air pollution abatement equipment and services firms.Highlights of these limitations are also included in table 4-1 at the end of this chapter. 80 Industry representatives, interviews by USITC staff, Chicago, Dec. 2, 2004, and Seoul,Korea, Nov. 2004. 81 Industry representative, interview by USITC staff, Chicago, Dec. 3, 2004. 82 Industry representatives, interview by USITC staff, Brussels, Belgium, Oct. 28, 2004. 83 See appendix E.
4-13
Appendix C includes a summary of selected countries’ commitments with respect toaccording foreign service providers full or partial market access and national treatmentfor cleaning services of exhaust gases under the WTO General Agreement on Trade inServices (GATS).79 Industry sources provided additional information concerning possiblebarriers to trade in air pollution abatement goods and services. A limited number offoreign markets have been cited as posing some difficulty for U.S. and other countryexporters for various reasons. In Asia, intense competition in Japan among domesticsuppliers and a perceived preference in several countries for Asian-manufactured goodsreportedly may inhibit growth in exports of air pollution control equipment to certainAsian economies by non-Asian sources.80 In Germany, monitoring equipment reportedlymust be approved by a single German testing organization, which is a costly process,81
and, like Japan, the home market is characterized by intense competition amongindigenous firms.82 A U.S. supplier of high-value air pollution abatement goods with amajority of sales in foreign markets stated that tariffs and use fees up to 42 percent on itsgoods in India have led the firm to transfer partial manufacturing from its U.S. plant tolower-cost operations in China in order to serve the Indian market.83 The firm stated thatsimilarly high tariffs in Brazil led the firm to manufacture there under license rather thanexport, but that repatriation of royalties is impeded by Brazilian currency exportrequirements.
In the principal developed markets– the United States, the European Union, and Japan–which produce and consume the largest world shares of air pollution abatement goods andservices, tariff rates applied on an MFN basis or bound in the Uruguay Round averageless than 2 percent for the products classified in the 19 HS headings identified by theOECD as containing air pollution abatement-related goods. Tariffs imposed bydeveloping markets are higher on average. The tariff rates levied in developing countriesrange from zero to 14.8 percent with regard to applied MFN tariff rates and zero tounbound for Uruguay Round bound rates.

4-14
Table 4-1Characteristics of selected country markets for air pollution abatement services and goods
Country Size and nature of marketSuppliers of services andequipment
Consumers of servicesand equipment Trade and investment
Measures affecting trade andinvestment
Australia In 2004, estimatedconsumption of air pollutioncontrol engineering,consulting, and monitoringservices was valued at $28million. The market for airpollution control equipmentwas estimated at $515million in the same year.1
Estimated consumption ofair pollution goods andservices in Australia during1994-2004 increased at a 4-percent average annualrate, which is slower thanthe world average of 7percent.1
Air pollution control is notpresently considered to beamong Australia’s topenvironmental managementissues.2
Private companies are theprimary providers of airpollution abatement services. Key suppliers include:3
Air Pollutions Systems (Australia)Baltec Systems Pty Ltd (U.S.)Clean TeQ (Australia) Ecotech (Australia)Entech Group (Australia)ERM (Multinational)EnviroSafe Australia (EAS)Pty Ltd (Australia)PPK Environment & Infrastructure Pty Ltd (U.S.)Stack-Air (Australia)Solutions@Enviro Pty Ltd (Australia)Synergetics Environmental Engineering (Australia) United Air Specialists Inc.(U.S.)
The principal consumersare within private industry,especially in themanufacturing, refining,mining, and electricitygeneration industries. State-owned utilities arealso consumers of airpollution control equipmentand services.4
Australia is a netimporter of air pollutioncontrol services, withimports and exportsestimated at $5 millionand $3 million,respectively, in 2004.5
Australia is a netexporter of air pollutioncontrol equipment, withexports and importsestimated at $357million and $192 million,respectively, in 2004.6
Australia maintains no tradebarriers that specifically applyto air pollution abatementservices.7
Prospective foreign investorsmust obtain investmentapproval from the ForeignInvestment Review Board,which may deny specific foreigninvestments on the basis ofnational interest.8
The U.S.-Australia Free TradeAgreement eliminates the 5percent tariff on air pollutioncontrol equipment.2
See footnotes at end of table.

4-15
Table 4-1—ContinuedCharacteristics of selected country markets for air pollution abatement services and goods
Country Size and nature of marketSuppliers of services andequipment
Consumers of servicesand equipment Trade and investment
Measures affecting trade andinvestment
Brazil In 2004, the estimatedconsumption of air pollutionabatement engineering,consulting, and monitoringservices in Brazil totaled$56 million. The market forair pollution abatementgoods in Brazil totaled anestimated $1 billion.1
Estimated consumption ofair pollution goods andservices in Brazil during1994-2004 increased at anaverage yearly rate of 5percent, which is slowerthan the world average of 7percent.1
There is a relatively lowconcentration of firms, mostof which are Brazilian-owned.In 2002, Brazilian-ownedfirms represented $764million (or about 75 percent)of the $1 billion overallmarket for pollution controlequipment and services inBrazil.9 However, there is noinformation regarding thepercentage of Brazilian-owned firms that supply airpollution abatement andrelated services specifically.
Leading industrialconsumers of air pollutionabatement services andgoods in Brazil includesteel and iron, chemicals/petrochemicals,pulp and paper, cement,and glass producers.10
In 2004, air pollutionabatement servicestrade for Brazil wasestimated at $11 millionin imports andnegligible, if any,exports.5
Brazil exported anestimated $2 millionand imported $493million in air pollutionabatement goods in2004.6
Concerns have been reportedregarding Brazil’s intellectualproperty environment. Brazil’sindustrial property law, whichtook effect in 1997, provides forwithholding patent protection ontechnologies incorporated ingoods imported into Brazil.11
Additionally, Brazil’s patentoffice, the National Institute forIndustrial Property (INPI), isfaced with a backlog of patentapplications that may preventfirms from gaining protection ina timely manner.8
See footnotes at end of table.

4-16
Table 4-1—ContinuedCharacteristics of selected country markets for air pollution abatement services and goods
Country Size and nature of marketSuppliers of services andequipment
Consumers of servicesand equipment Trade and investment
Measures affecting trade andinvestment
Canada In 2004, estimatedconsumption of air pollutionabatement engineering,consulting, and monitoringservices and air pollutioncontrol goods in Canadatotaled $92 million and $2billion, respectively.1
Estimated consumption ofair pollution abatementservices and goods inCanada during 1994-2004increased at an averageannual rate of 9 percent,which is faster than theworld average rate of 7percent.1
It is believed that the marketis not highly concentrated.
Private-sector firms are theprincipal providers of servicesand equipment related to theabatement of air pollution.
The domestic market inCanada includes thefollowing firms that primarilyprovide equipment:Rowan Williams Davies &Irwin Inc. (RWDI); AlbarrieCanada Limited; EngineControl Systems; KvaernerChemetics International;Yugo-Tech Conversion GasSystems
Leading industries thatconsume air pollutionservices and goods inCanada include electricitygeneration,chemicals/petrochemicals,fertilizer, pulp and paper,aluminum and iron miningand smelting, cement, andlime and glass.12
The full range oftechnologies andequipment for air pollutionabatement are availableand utilized in Canada.
Canada imported anestimated $24 million inair pollution abatementservices, as comparedto negligible, if any,exports in 2004.5
Canada exported anestimated $131 millionand imported $849million in air pollutionabatement goods in2004.6
Canada has scheduled fullGATS commitments forconstruction services,engineering services, technicaltesting and analysis, andrelated scientific and technicalconsulting services providedthrough modes 1, 2, and 3,except for professionalaccreditation issues such thosenoted below for engineers.
With regard to the provision ofengineering services throughmodes 1, 2, and 4, mostprovinces limit accreditation topermanent residents, whileQuebec limits accreditation tocitizens. With regard to theprovision of engineeringservices through modes 1 and4, Saskatchewan limitsaccreditation to residents.
With regard to the provision ofservices through modes 1 and2, Manitoba requires acommercial presence for theaccreditation of consultingengineers.
See footnotes at end of table.
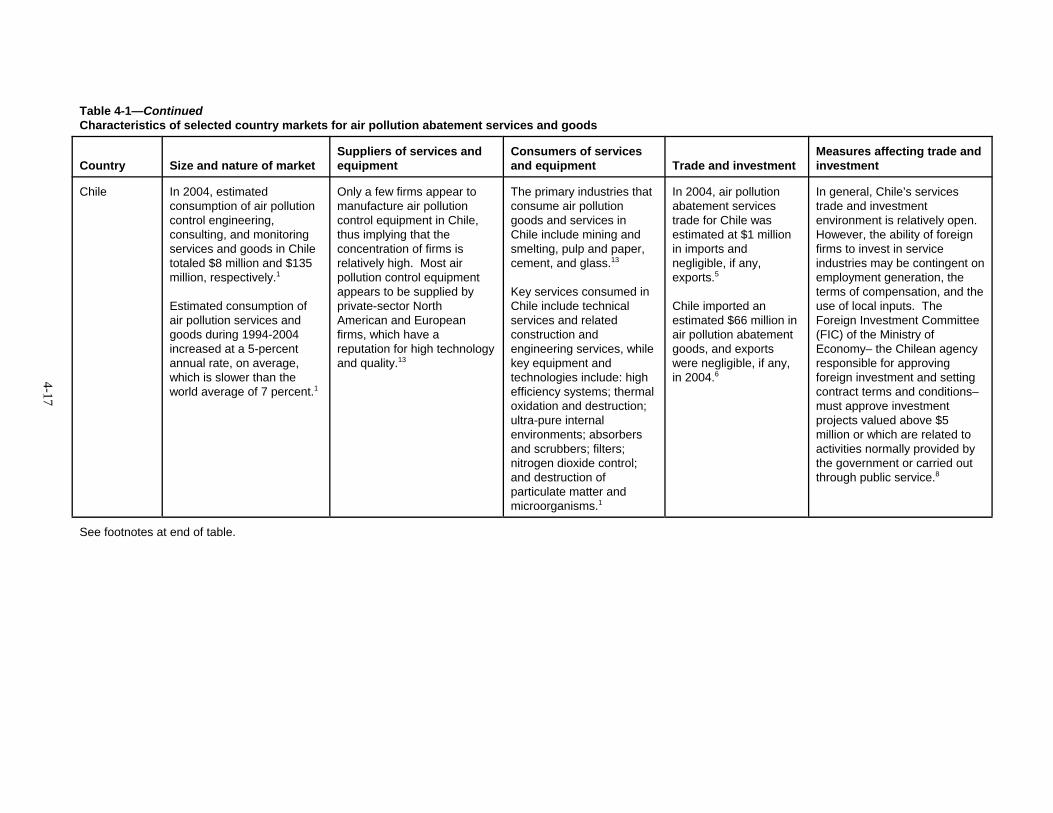
4-17
Table 4-1—ContinuedCharacteristics of selected country markets for air pollution abatement services and goods
Country Size and nature of marketSuppliers of services andequipment
Consumers of servicesand equipment Trade and investment
Measures affecting trade andinvestment
Chile In 2004, estimatedconsumption of air pollutioncontrol engineering,consulting, and monitoringservices and goods in Chiletotaled $8 million and $135million, respectively.1
Estimated consumption ofair pollution services andgoods during 1994-2004increased at a 5-percentannual rate, on average,which is slower than theworld average of 7 percent.1
Only a few firms appear tomanufacture air pollutioncontrol equipment in Chile,thus implying that theconcentration of firms isrelatively high. Most airpollution control equipmentappears to be supplied byprivate-sector NorthAmerican and Europeanfirms, which have areputation for high technologyand quality.13
The primary industries thatconsume air pollutiongoods and services inChile include mining andsmelting, pulp and paper,cement, and glass.13
Key services consumed inChile include technicalservices and relatedconstruction andengineering services, whilekey equipment andtechnologies include: highefficiency systems; thermaloxidation and destruction;ultra-pure internalenvironments; absorbersand scrubbers; filters;nitrogen dioxide control;and destruction ofparticulate matter andmicroorganisms.1
In 2004, air pollutionabatement servicestrade for Chile wasestimated at $1 millionin imports andnegligible, if any,exports.5
Chile imported anestimated $66 million inair pollution abatementgoods, and exportswere negligible, if any,in 2004.6
In general, Chile’s servicestrade and investmentenvironment is relatively open. However, the ability of foreignfirms to invest in serviceindustries may be contingent onemployment generation, theterms of compensation, and theuse of local inputs. TheForeign Investment Committee(FIC) of the Ministry ofEconomy– the Chilean agencyresponsible for approvingforeign investment and settingcontract terms and conditions–must approve investmentprojects valued above $5million or which are related toactivities normally provided bythe government or carried outthrough public service.8
See footnotes at end of table.

4-18
Table 4-1—ContinuedCharacteristics of selected country markets for air pollution abatement services and goods
Country Size and nature of marketSuppliers of services andequipment
Consumers of servicesand equipment Trade and investment
Measures affecting trade andinvestment
Costa Rica Industry estimates on thesize of Costa Rica’s airpollution abatement marketare not available. Themarket is small, owing to thecountry’s small industrialbase,14 very low fossil fueluse in electricitygeneration,15 and therelatively lower priorityallocated to air pollutionabatement amongenvironmental managementissues.14
Domestic and foreign-ownedsuppliers of air pollutionequipment and servicesinclude:16
ABB, Anderson, APEX,Electromatico, ENERAC,General Electric, Horiba,Siemens.
Laboratories that testambient air quality include:Laboratorios Lambda andCentro de InvestigaciónContaminación Ambiental(CICA) of the Universidad deCosta Rica,15 usingequipment provided by U.S.or European equipment firms.
Other entities that supplyconsulting and certain otherrelated air pollutionabatement services in CostaRica include:SwissContact, CentralAmerican Alliance forSustainable Development,ENTEBBE.
Principal consumersinclude RECOPE, thegovernment-ownedrefinery; ICE, thegovernment-ownedelectricity company; andcement plants.16
Costa Rica is likely anet importer of airpollution abatementgoods and services,and a net recipient offoreign directinvestment with regardto such goods andservices.16 Industryestimates of such tradeand investments are notavailable.
Costa Rica maintains no knowntrade barriers that specificallyapply to air pollution abatementservices.17
Nevertheless, Costa Rica’sSchedule of Commitmentsunder the General Agreementon Trade in Services (GATS)does not make commitmentswith regard to professionalservices such as engineeringservices. Thus, Costa Rica canmaintain or impose measuresthat may affect market accessor national treatment in anymode of delivery of suchprofessional services related toair pollution abatement.
See footnotes at end of table.

4-19
Table 4-1—ContinuedCharacteristics of selected country markets for air pollution abatement services and goods
Country Size and nature of marketSuppliers of services andequipment
Consumers of servicesand equipment Trade and investment
Measures affecting trade andinvestment
EU In 2004, estimatedconsumption of air pollutionabatement engineering,consulting, and monitoringservices in the EU totaled$445 million.1 The marketfor air pollution abatementgoods was estimated at $9billion.
Estimated consumption ofair pollution abatementservices and goods during1994-2004 increased at anaverage annual rate of 5percent, which is slowerthan the world average of 7percent.18
Leading equipment providersinclude:19
Alstom (France), Mitsubishi(Japan), Durr Environmental(Germany), Hamon & Cie(Belgium), GE Energy (U.S.),Fisia Babcock (Italy), MegTec(U.S.).
Leading services providersinclude:Cambridge EnvironmentalResearch Consultants (UK)environmental modelingsoftware, testing, andmonitoring; ENSRInternational (U.S.) fullservice consulting firm;Haden Drysys Environmental(UK) design and projectmanagement; Linhoff March(UK) engineering and design;Reeco-Stroem (Denmark)engineering and design.18
Leading consumers of airpollution abatementservices and goods includepower generation plants,oil refineries, iron and steelplants, and manufacturersof a wide variety ofconsumer and industrialgoods, as well as entities inthe public sector.
Key consumers of airpollution abatementequipment and serviceswill be the 5,000-6,000companies, in five sectors,that are required to reduceCO2 emissions inconjunction with the EUemissions trading schemeand/or Kyoto Protocol.
Equipment and servicesrelated to the abatement ofCO2 emissions andservices related to themonitoring, analysis, andverification of CO2emissions will be importantas large-scale emitters ofCO2 make preparations tocomply with obligationsassociated with the EUemissions trading schemeand/or the KyotoProtocol.20
In 2004, estimatedimports of suchservices totaled $77million, while exportstotaled $74 million.21
Estimated exports of airpollution abatementgoods totaling $5 billionexceeded importstotaling $3 billion.6
Numerous large non-EU-owned firmsmaintain commercialoperations in the EU tosupply air pollutioncontrol services andgoods, which includesfacilities thatmanufacture suchequipment forconsumption in EUMember States and forexport.
There are few, if any, measuresaffecting trade and investmentin the EU air pollutionabatement services market inparticular.
Products entering the EU mustcomply with basicproduct/industry standards (i.e.,safety standards, electricalstandards, technical/ISOstandards).
Tariffs on goods, which affectair pollution equipment, are low(1.7 -5.0 percent).
See footnotes at end of table.

4-20
Table 4-1—ContinuedCharacteristics of selected country markets for air pollution abatement services and goods
Country Size and nature of marketSuppliers of services andequipment
Consumers of servicesand equipment Trade and investment
Measures affecting trade andinvestment
Japan In 2004, estimatedconsumption of air pollutionabatement engineering,consulting, and monitoringservices and air pollutioncontrol goods in Japantotaled $134 million and $3billion, respectively.1
Estimated consumption ofair pollution goods andservices in Japan during1994-2004 increased at a 3-percent average annualrate, which is slower thanthe world average of 7percent.1
Large Japanese suppliers arebelieved to account for about80 percent of the air pollutionabatement market in Japan. Such firms typically providean integrated package ofequipment and services. Foreign firms tend to supplythe Japanese market chieflyby negotiating cross-licensingagreements in order totransfer technologies, withfinished productsmanufacturing and servicesprovided by Japanese firms.22
Key suppliers include:Mitsubishi Heavy Industries;Ebara Corp; Hitachi; HotakaEngineering Co. Ltd (HTK),Itochu Ltd., and MatsushitaEcology Systems Co.23 Manyof the large Japaneseindustrial conglomerateshave an environmentalcomponent.
Principal consumers of airpollution abatement goodsand services in Japan arebelieved to be energycompanies, industrialentities (such aspetrochemical plants), andvehicle manufactures.24
Examples of principal airpollution abatementtechnologies used in Japaninclude:-flue gas treatmentsystems (includes SO2,NOx, VOC, and dioxinremoval);- dust collection systems(includes electrostaticprecipitators and fabricfilters); and- ash handling systems.
Japan exported anestimated $132 millionand imported $14million in air pollutionabatement services in2004.5 Japan exportedan estimated $4 billionand imported about$709 million in airpollution abatementgoods in 2004.6
National and prefecturegovernments provideenvironmentalinvestment incentivesthrough tax supports,low interest loans,subsidies, and grants.Such support is unlikelyto be granted to foreignfirms. For example, theGovernment of Japanprovides incentives tofirms to develop dioxincontrols.
Japan is a mainsupplier of air pollutioncontrol equipment andservices to many Asiancountries, such asVietnam and Korea,which reportedly oftenprefer to purchase fromAsian firms.24
A Ministry of the Environmentsurvey, published in July 2001,reports 28 percent of localgovernment administeredincinerators and 86 percent ofprivately operated incineratorswill be non-compliant with theLaw Concerning SpecialMeasures Against Dioxins, Jan.2000. Existing incinerators willeither have to ceaseoperations, be replaced, or berebuilt to bring them intocompliance.
See footnotes at end of table.
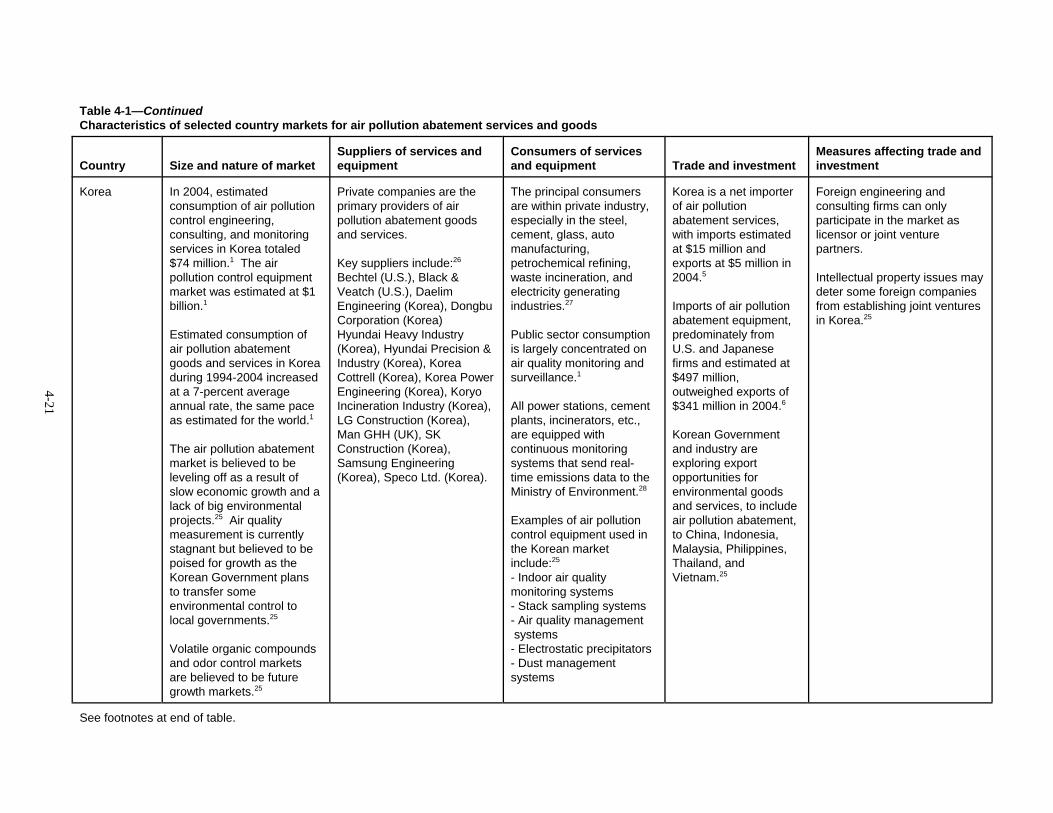
4-21
Table 4-1—ContinuedCharacteristics of selected country markets for air pollution abatement services and goods
Country Size and nature of marketSuppliers of services andequipment
Consumers of servicesand equipment Trade and investment
Measures affecting trade andinvestment
Korea In 2004, estimatedconsumption of air pollutioncontrol engineering,consulting, and monitoringservices in Korea totaled$74 million.1 The airpollution control equipmentmarket was estimated at $1billion.1
Estimated consumption ofair pollution abatementgoods and services in Koreaduring 1994-2004 increasedat a 7-percent averageannual rate, the same paceas estimated for the world.1
The air pollution abatementmarket is believed to beleveling off as a result ofslow economic growth and alack of big environmentalprojects.25 Air qualitymeasurement is currentlystagnant but believed to bepoised for growth as theKorean Government plansto transfer someenvironmental control tolocal governments.25
Volatile organic compoundsand odor control marketsare believed to be futuregrowth markets.25
Private companies are theprimary providers of airpollution abatement goodsand services.
Key suppliers include:26
Bechtel (U.S.), Black &Veatch (U.S.), DaelimEngineering (Korea), DongbuCorporation (Korea)Hyundai Heavy Industry(Korea), Hyundai Precision &Industry (Korea), KoreaCottrell (Korea), Korea PowerEngineering (Korea), KoryoIncineration Industry (Korea),LG Construction (Korea),Man GHH (UK), SKConstruction (Korea),Samsung Engineering(Korea), Speco Ltd. (Korea).
The principal consumersare within private industry,especially in the steel,cement, glass, automanufacturing,petrochemical refining,waste incineration, andelectricity generatingindustries.27
Public sector consumptionis largely concentrated onair quality monitoring andsurveillance.1
All power stations, cementplants, incinerators, etc.,are equipped withcontinuous monitoringsystems that send real-time emissions data to theMinistry of Environment.28
Examples of air pollutioncontrol equipment used inthe Korean marketinclude:25
- Indoor air qualitymonitoring systems- Stack sampling systems- Air quality management systems- Electrostatic precipitators- Dust managementsystems
Korea is a net importerof air pollutionabatement services,with imports estimatedat $15 million andexports at $5 million in2004.5
Imports of air pollutionabatement equipment,predominately fromU.S. and Japanesefirms and estimated at$497 million,outweighed exports of$341 million in 2004.6
Korean Governmentand industry areexploring exportopportunities forenvironmental goodsand services, to includeair pollution abatement,to China, Indonesia,Malaysia, Philippines,Thailand, andVietnam.25
Foreign engineering andconsulting firms can onlyparticipate in the market aslicensor or joint venturepartners.
Intellectual property issues maydeter some foreign companiesfrom establishing joint venturesin Korea.25
See footnotes at end of table.
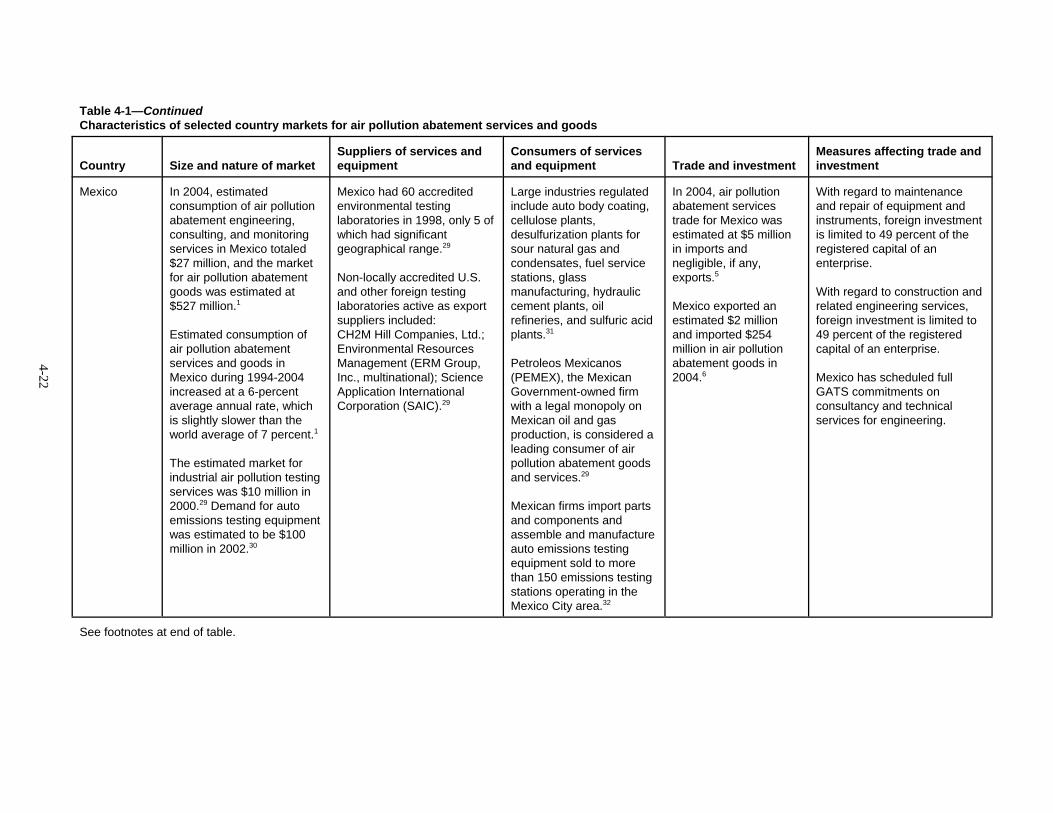
4-22
Table 4-1—ContinuedCharacteristics of selected country markets for air pollution abatement services and goods
Country Size and nature of marketSuppliers of services andequipment
Consumers of servicesand equipment Trade and investment
Measures affecting trade andinvestment
Mexico In 2004, estimatedconsumption of air pollutionabatement engineering,consulting, and monitoringservices in Mexico totaled $27 million, and the marketfor air pollution abatementgoods was estimated at$527 million.1
Estimated consumption ofair pollution abatementservices and goods inMexico during 1994-2004increased at a 6-percentaverage annual rate, whichis slightly slower than theworld average of 7 percent.1
The estimated market forindustrial air pollution testingservices was $10 million in2000.29 Demand for autoemissions testing equipmentwas estimated to be $100million in 2002.30
Mexico had 60 accreditedenvironmental testinglaboratories in 1998, only 5 ofwhich had significantgeographical range.29
Non-locally accredited U.S.and other foreign testinglaboratories active as exportsuppliers included:CH2M Hill Companies, Ltd.;Environmental ResourcesManagement (ERM Group,Inc., multinational); ScienceApplication InternationalCorporation (SAIC).29
Large industries regulatedinclude auto body coating,cellulose plants,desulfurization plants forsour natural gas andcondensates, fuel servicestations, glassmanufacturing, hydrauliccement plants, oilrefineries, and sulfuric acidplants.31
Petroleos Mexicanos(PEMEX), the MexicanGovernment-owned firmwith a legal monopoly onMexican oil and gasproduction, is considered aleading consumer of airpollution abatement goodsand services.29
Mexican firms import partsand components andassemble and manufactureauto emissions testingequipment sold to morethan 150 emissions testingstations operating in theMexico City area.32
In 2004, air pollutionabatement servicestrade for Mexico wasestimated at $5 millionin imports andnegligible, if any,exports.5
Mexico exported anestimated $2 millionand imported $254million in air pollutionabatement goods in2004.6
With regard to maintenanceand repair of equipment andinstruments, foreign investmentis limited to 49 percent of theregistered capital of anenterprise.
With regard to construction andrelated engineering services,foreign investment is limited to49 percent of the registeredcapital of an enterprise.
Mexico has scheduled fullGATS commitments onconsultancy and technicalservices for engineering.
See footnotes at end of table.

4-23
Table 4-1—ContinuedCharacteristics of selected country markets for air pollution abatement services and goods
Country Size and nature of marketSuppliers of services andequipment
Consumers of servicesand equipment Trade and investment
Measures affecting trade andinvestment
South Africa In 2004, estimatedconsumption of air pollutionabatement services in SouthAfrica totaled $22 million. The market for air pollutionabatement goods in SouthAfrica totaled an estimated$381 million.1
Four key sources of airpollution emissions in SouthAfrica include: transportation— the sector accounts for45 percent of national NOxand VOC emissions;33
energy — accounts forabout 88 percent of energyused, especially in housingareas, such as Soweto,where 80 percent ofpollution is coal exhaust;mining — mine dust andemissions account for asubstantial amount of SO2and 35 percent of CO2emissions; and chemicalprocessing.
Significant domestically-owned technology andservices providers include:34
BESC, CSIR, EcoServ,Greenland Science,Lenntech, Minnovex, Mintek,MVTI, Tecnica.
Significant foreign-ownedfirms include:35
AMIRA (Australasiamultinational), CSIRO(Australia).
Examples of air pollutionabatement technologiesspecifically developed for usein South Africa center on off-gas control for furnaces(Enviroplas) and chemicalsystems to collect and controldust (Regen 2000).33
Approximately 81environmental consultingfirms have been identified bySouth African Governmentsources. It is not knownwhich of these firms provideservices specific to airpollution abatement.33
Major consumers includevery large mining, refining,chemical and steelmanufacturing, andelectricity generatingindustries.36
In 2004, air pollutionabatement servicestrade for South Africawas estimated at $5million in imports andnegligible, if any,exports.5
South Africa exportedan estimated $24million and imported anestimated $174 millionin air pollutionabatement goods in2004.6
Principal foreignsources of imports andinvestment in SouthAfrica’s air pollutionabatement market arebelieved to beAustralian andAustralasian firms.35
South Africa’s Schedule ofCommitments under theGeneral Agreement on Trade inServices (GATS) accorded fullmarket access and nationaltreatment with respect to theprovision of exhaust gascleaning services provided indelivery modes 1, 2, and 3.37
A limitation on market accessfor modes of supply 1 and 2states that for architecturalservices on projects in whichthe building plan covers at least500 sq. meters, a locallyregistered architect must beused.37
South Africa’s Schedule ofCommitments under GATS alsoindicates a national treatmentlimitation in mode 3 forimposing limits on localborrowing by South African-registered companies havingnon-resident shareholders of atleast 25 percent.37
See footnotes at end of table.

4-24
Table 4-1—ContinuedCharacteristics of selected country markets for air pollution abatement services and goods
Country Size and nature of marketSuppliers of services andequipment
Consumers of servicesand equipment Trade and investment
Measures affecting trade andinvestment
Thailand In 2004, estimatedconsumption of air pollutionabatement engineering,consulting, and monitoringservices in Thailand totaled$13 million. The market forair pollution abatementgoods was estimated at$273 million.1
Consumption of air pollutionabatement services andgoods in Thailand during1994-2004 increased at anaverage annual rate of 6percent, which is slightlyslower than the worldaverage of 7 percent.1
The United Nations reportsthat Bangkok’s air is someof the most polluted in theworld, mostly due to vehicleemissions.38
Industry sectors identified asgrowth markets include airpollution abatementconsulting services andmonitoring equipment.39
The environmental consultingand engineering market iscomprised of domestic firmsand foreign-based companieswith local offices orrepresentatives. Foreignfirms are generally selectedfor large-scale projects, whiledomestic firms tend to supplythe remainder of projects. Numerous small and mid-sizedomestic firms (mostlyequipment suppliers)compete in the market.40
The Electricity GeneratingAuthority of Thailand(EGAT) is a majorconsumer of SO2scrubbers. Industrial firmsand construction industriesare also leadingconsumers of air pollutioncontrol services andgoods.41
In 2004, air pollutionabatement servicesimports for Thailandwere estimated at $2million, and servicesexports were negligible,if any.5
Thailand imported anestimated $146 millionand had negligible, ifany, exports in airpollution abatementgoods in 2004.6
The predominantforeign suppliers of airpollution services andequipment in Thailandare U.S. and Japanesefirms. In 1999, theUnited States suppliedan estimated 90percent of Thailand’simports of air pollutionmonitoring services andmonitoring equipment,which accounted for anestimated 46 percent ofconsumption.42
Local and national governmentagencies reportedly exerciseconcurrent jurisdiction, formallyand informally, overenvironmental concerns,including air pollutionabatement, which introducesuncertainty to marketdevelopment.41
See footnotes at end of table.

4-25
Table 4-1—ContinuedCharacteristics of selected country markets for air pollution abatement services and goods
Country Size and nature of marketSuppliers of services andequipment
Consumers of servicesand equipment Trade and investment
Measures affecting trade andinvestment
United States In 2004, estimatedconsumption of air pollutionabatement engineering,consulting, and monitoringservices in the United Statestotaled $658 million. Themarket for air pollutionabatement goods wasestimated at $13.9 billion inthe same year.1
Nevertheless, revenuesearned by U.S. air pollutionequipment firms werevirtually unchanged during2000-2003.43
Estimated consumption ofair pollution goods andservices in the United Statesduring 1994-2004 increasedat a 7-percent average rateper year, equal to the rateestimated for the world inthe same period.1
The U.S. air pollutionabatement market principallyconsists of firms that supplyservices and goods to abatestationary sources of airpollution.
Major U.S. providers of airpollution abatement goodsand services include Babcock& Wilcox, Babcock Power,Donaldson, General Electric(includes recent acquisitionBHA), Thermo Electron, andWheelabrator. The airpollution abatement designand consulting industry,largely concerning powerplants, is led by Bechtel,Black & Veatch, Burns &McDowell, CH2M Hill,Parsons, Sargent & Lundy,Shaw, TRC, URS, andWashington Group.44
Air pollution abatementservices and goods areprincipally provided to thefollowing industries: electricutilities; chemical,pharmaceutical, andplastics; pulp and paper;and petroleum refining.45
Key air pollution abatementtechnologies andequipment utilized in theU.S. market include:46
fabric filters (baghouses);electrostatic precipitators;scrubbers;selective catalytic reduction(SCR); electro-catalyticoxidation; sorbent injection;flue gas desulfurization;catalytic converters; andinfra-red sensors.
The United Statesexported an estimated$213 million andimported an estimated$83 million in airpollution abatementservices in 2004.5
The United Statesexported an estimated$4.6 billion andimported an estimated$2.5 billion in airpollution abatementgoods in 2004.6
In its Schedule of Commitmentsunder the GATS, the UnitedStates included the followinglimitations to full market accessand/or national treatment:with regard to the supply ofcertain services through mode4: in construction and relatedengineering services, Michiganrequires contractors to maintainan in-state office; inengineering and integratedengineering services,citizenship is required for alicense in the District ofColumbia and in-stateresidency is required for alicense in various states. Withregard to the supply ofarchitectural services throughmode 3, two-thirds of theofficers, partners, and/ordirectors of an architectural firmin Michigan must be licensed inthe state as architects,engineers, and/or landsurveyors.47
1 McIlvaine Co., estimates provided to USITC staff via e-mails, Dec. 23 and 28, 2004. 2 U.S. Department of Commerce (USDOC), U.S. and Foreign Commercial Service, “Environmental Technologies Australian Market Brief,” Mar. 2004, found athttp://www.buyusa.gov/australia/en/pol.html, retrieved Jan. 7, 2005. 3 Australian Environment Directory, found at http://www.environmentdirectory.com.au. 4 USDOC, U.S. and Foreign Commercial Service, “Air Pollution Control Equipment,” Dec. 7, 2000. 5 McIlvaine Co., estimates provided to USITC staff via e-mail, Feb. 3, 2005. 6 McIlvaine Co., estimates provided to USITC staff via e-mails, Dec. 28, 2004, and Jan. 7 and 11, 2005. 7 World Trade Organization (WTO), General Agreement on Trade in Services (GATS), Australia: Schedule of Specific Commitments, GATS/SC/6, Apr. 15, 1994. 8 U.S. Trade Representative (USTR), 2003 National Trade Estimate Report on Foreign Trade Barriers, found at http://www.ustr.gov/, retrieved Sept. 2004. 9 USDOC, U.S. and Foreign Commerical Service, “Brazil: Pollution Control,” July 2004, found at http://www.focusbrazil.org.br/ccg/reports/pollution.pdf, retrieved Sept.2004.

4-26
Table 4-1—ContinuedCharacteristics of selected country markets for air pollution abatement services and goods
10 Government representative, interview by USITC staff, Rio de Janeiro, Dec. 20, 2004. 11 U.S. Government representative, telephone interview with USITC staff, Feb. 8, 2005. 12 Government of Canada, Natural Resources Canada, “Large Final Emitters,” found at http://www.nrcan-rncan.gc.ca/lfeg-ggef/english/industry_en.htm, retrieved Feb.4, 2005. 13 USDOC, U.S. and Foreign Commercial Service, “Chile Air Pollution Control Equipment Report,” found at http://www.stat-usa.gov/, retrieved Sept. 2004. 14 Government representative, interview by USITC staff, Costa Rica, Dec. 2004. 15 Industry representative, interview by USITC staff, Costa Rica, Dec. 2004. 16 Industry representatives, interviews by USITC staff, Costa Rica, Dec. 6-10, 2004. 17 WTO, GATS, Costa Rica: Schedule of Specific Commitments, GATS/SC/22, Apr. 15, 1994. 18 Information on services suppliers was primarily from Environmental Expert, found at http://www.environmentalexpert.com/, retrieved Nov. 2004. 19 Information on equipment suppliers was primarily from McIlvaine Co., e-mail to USITC staff, Jan. 4, 2005; EBI, Environmental Business Journal, vol. 15, No. 11/12,2003, p. 3; and Environmental Expert, found at http://www.environmentalexpert.com/, retrieved Nov. 2004. 20 European Union, “EU Emissions Trading,” Nov. 18, 2004, found at http://www.europa.eu.int/, retrieved Jan. 6, 2005. 21 McIlvaine Co., estimates provided to USITC staff via e-mail, Feb. 3, 2005. Estimates for EU trade as compiled from estimates provided by McIlvaine Co. includeintra-EU trade as well as trade with non-EU countries. 22 Industry representative, interview by USITC staff, Tokyo, Nov. 4, 2004. 23 Information on suppliers provided by McIlvaine Co., e-mail to USITC staff, Jan. 4, 2005; Environmental Business International, Inc. (EBI), Environmental BusinessJournal, vol. 15, No. 11/12, 2003, p. 3; and industry representatives, interview by USITC staff, Tokyo, Nov. 4, 2004. 24 Industry and government representatives, interviews by USITC staff, Tokyo, Nov. 4-8, 2004. 25 Industry representative, interview by USITC staff, Seoul, Nov. 15, 2004. 26 U.S. Commercial Service, “Air Pollution Control Market for U.S. Exporters,” May 7, 2001, found at http://www.statusa.gov/, retrieved Oct. 6, 2004. 27 U.S. Commerical Service, “Air Pollution Control Equipment,” Aug. 28, 2002, found at http://www.statusa.gov/, retrieved Oct. 6, 2004 28 Government representative, interview by USITC staff, Seoul, Nov. 16, 2004. 29 U.S. and Foreign Commercial Service, Mexico: Pollution Control Equipment, market research report, Feb. 1, 1999. 30 U.S. and Foreign Commercial Service, Mexico: Automotive Parts/Service Equipment, market research report, Oct. 7, 2003. 31 Bureau of National Affairs (BNA), Mexican Environment & Safety Laws and Regulations, Mexico Overview, found at http://esweb.bna.com/, retrieved Sept. 22, 2004. 32 The three main Mexican firms importing such air pollution abatement goods include Comercial Auto Industrial, S.A. de C.V., Herramientas Quintana, S.A. de C.V.,and Automotive Testing and Development Systems (ATDS). U.S. and Foreign Commercial Service, Mexico: Automotive Parts/Service Equipment, market research report,Oct. 7, 2003. 33 Government of South Africa, Department of Environmental Affairs and Tourism, found at http://www.environment.gov.za/, retrieved Sept. 27, 2004. 34 USITC staff experience and Government of South Africa, Department of Environmental Affairs and Tourism, found at http://www.environment.gov.za/, retrieved Sept.27, 2004. 35 USITC staff experience. 36 Infomine-Africa, found at http://www.infomine-africa.com/, and South African Sources, found at http://www.southafrica.globalsources.com/, retrieved Jan. 28, 2005. 37 GATS, South Africa: Schedule of Specific Commitments, GATS/SC/78, Apr. 15, 1994. 38 United Nations Commission on Sustainable Development, Thailand: Country Profile; Implementation of Agenda 21: Review of Progress Made since the UnitedNations Conference on Environment and Development, 1992, Apr. 7-25, 1997, found at http://www.un.org/esa/earthsummit/thai-cp.htm. 39 Industry representative, interview by USITC staff, Bangkok, Nov. 10, 2004. 40 Government representatives, interviews by USITC staff, Bangkok, Nov. 11, 2004. 41 Industry representative, interview by USITC staff, Bangkok, Nov. 12, 2004. 42 USDOC, U.S. and Foreign Commerical Service, market research reports, Mar. 1, 1998. 43 EBI, Environmental Business Journal, vol. 17, No. 9/10, p. 2. 44 McIlvaine Co., “U.S. Air and Water Consulting Industry is Concentrated in a Few States,” press release, Apr. 2003. 45 EBI, Environmental Business Journal, vol. 17, No. 9/10, 2004, p. 5. 46 Institute of Clean Air Companies, found at http://www.icac.com/. 47 GATS, United States: Schedule of Specific Commitments, GATS/SC/90, Apr. 1994.

1 The purpose of this chapter is to provide a survey of emissions allowance trading.However, emissions transactions also occur through so-called “project-based” activities.Under such arrangements, entities participate in the financing of a project which reducesgreenhouse gas emissions, as compared to estimated emissions in the absence of suchabatement measures. In return for their investment, these entities receive emissions reduction“credits” of varying quality; such credits may or may not qualify for recognition under aformal emissions reduction scheme. Frank LeCocq, World Bank, “State and Trends of theCarbon Market 2004,” June 2004, p. 9. 2 United States General Accounting Office (GAO), “Air Pollution: Overview and Issues onEmissions Allowance Trading Programs,” GAO/T-RCED-97-183, July 1997. 3 Such a limit could be legislated by a country’s central government or agreed to as part ofa climate treaty between signatory countries. In either case, the goal is to achieve a specificenvironmental effect. 4 EPA, “Cap and Trade Essentials,” found at http://www.epa.gov/airmarkets/, retrievedOct. 2004. 5 Emissions allowances are government-authorized rights to discharge a specific quantityof pollutant, usually allocated on the basis of historical pollution activity. Allowances aregenerally denominated in unit (i.e., ton) increments, with the overall cap measured in totalunits. EPA, “Types of Trading,” found at http://www.epa.gov/airmarkets/, retrieved Oct.2004. 6 EPA, “Cap and Trade Essentials,” found at http://www.epa.gov/airmarkets/, retrievedOct. 2004. 7 Sources are required to measure and document emissions of the specified type. EPA,“Types of Trading,” found at http://www.epa.gov/airmarkets/, retrieved Oct. 2004.
5-1
CHAPTER 5EMISSIONS TRADING
Introduction
Emissions trading1 is a market-based alternative to the traditional “command andcontrol” approach to air pollution abatement, under which regulatory authorities compelpolluters to install cleaner technologies or attain source-specific emissions reductions.2
The primary approach to emissions trading is the “cap and trade” or “allowance”approach. Under the cap and trade approach, a regulatory authority establishes a desired“cap” or limit3 on the overall amount of a specific air pollutant emitted by a group ofinstallations per compliance period.4 Emissions allowances5 are allocated among affectedinstallations, with the total number of issued allowances equaling the desired cap.6 Atthe end of the compliance period, each installation must own a quantity of allowancessufficient to cover the amount of a pollutant that it emitted during the complianceperiod.7 Allowances may be bought and sold by installations, so that if an installationgenerates fewer pollutants than its allowance covers, it may sell the

8 An alternative emissions trading approach is the credit approach, under which fixed limitsare usually imposed by a regulatory authority on certain sources of a particular pollutant,typically based on historical activity. A source is required to meet its imposed limit, though itmay reduce its pollution levels below this limit and sell the corresponding pollution “credits”to other sources. Sources not subject to imposed limits may voluntarily limit emissions levelsand, like regulated sources, sell corresponding credits to other sources seeking to meetimposed limits. Under this approach, there is no guarantee that emissions will be reduced,since there are a larger number of excluded sources and no overall emissions “cap” isestablished. Although the decision to generate credits is voluntary, certification of thesecredits requires an administrative process. Canada’s Pilot Emission Reduction Trading(PERT) is an example of a credit approach. See the Tradeable Permits section of the literaturereview for more information. LECG, “Emissions Trading Market Study,” Report to theOntario Ministry of Environment, found at http://www.ene.gov.on.ca/programs/4707e.pdf,retrieved Oct. 2004; and United States Environmental Protection Agency (EPA), “Types ofTrading,” found at http://www.epa.gov/airmarkets/, retrieved Oct. 2004. 9 Although firms with high marginal abatement costs are allowed to exceed individualemissions targets by purchasing surplus allowances on the market, these surplus allowancesare created by reducing emissions elsewhere in the system, thereby maintaining the integrityof the overall cap. Typically, firms that do not possess allowances sufficient to cover pollutantemissions during a given compliance period are subject to fines or other penalties. 10 GAO, “Air Pollution: Overview and Issues on Emissions Allowance Trading Programs,”GAO/T-RCED-97-183, July 1997. 11 For example, the European Union estimates that the European Union Emissions TradingScheme will allow Kyoto compliance at an annual cost of i2.9-3.7 billion, compared toannual compliance costs up to i6.8 billion without the scheme. European Union, “EUEmissions Trading,” Nov. 18, 2004, found at http://www.europa.eu.int, retrieved on Jan. 6,2005.
5-2
remaining allowances at the prevailing market price. Similarly, if an installationgenerates more pollutants than its allowance covers, it must purchase additionalallowances.8
Theoretically, the overall system is economically efficient because affected sources maychoose whether to sell or purchase allowances depending on their respective marginalabatement costs, as discussed in Chapter 2. Firms with marginal abatement costs that arelower than the prevailing market price of an allowance have an incentive to reduceemissions below mandated levels, freeing up allowances that can be sold to a firm whosemarginal abatement costs exceed the prevailing market price of these allowances.9 In theend, emissions trading reportedly allows firms to collectively achieve compliance withemissions standards at the lowest possible overall cost, because abatement measures areundertaken by firms with the lowest abatement costs (box 5-1). By contrast, “commandand control” abatement methods compel all firms, irrespective of their relative abatementcosts, to meet similar reduction standards,10 reportedly resulting in higher overall costs.11
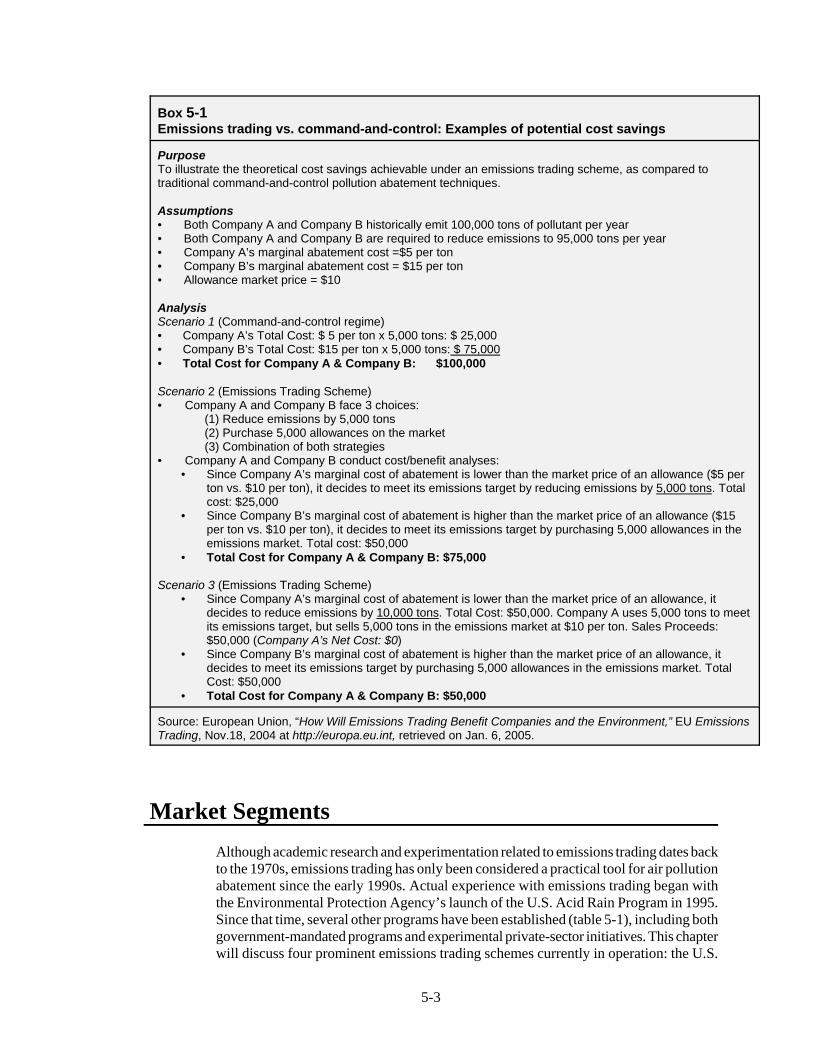
5-3
Box 5-1Emissions trading vs. command-and-control: Examples of potential cost savings
PurposeTo illustrate the theoretical cost savings achievable under an emissions trading scheme, as compared totraditional command-and-control pollution abatement techniques.
Assumptions• Both Company A and Company B historically emit 100,000 tons of pollutant per year• Both Company A and Company B are required to reduce emissions to 95,000 tons per year• Company A’s marginal abatement cost =$5 per ton• Company B’s marginal abatement cost = $15 per ton• Allowance market price = $10
AnalysisScenario 1 (Command-and-control regime)• Company A’s Total Cost: $ 5 per ton x 5,000 tons: $ 25,000• Company B’s Total Cost: $15 per ton x 5,000 tons: $ 75,000• Total Cost for Company A & Company B: $100,000
Scenario 2 (Emissions Trading Scheme)• Company A and Company B face 3 choices: (1) Reduce emissions by 5,000 tons (2) Purchase 5,000 allowances on the market (3) Combination of both strategies• Company A and Company B conduct cost/benefit analyses: • Since Company A’s marginal cost of abatement is lower than the market price of an allowance ($5 per
ton vs. $10 per ton), it decides to meet its emissions target by reducing emissions by 5,000 tons. Totalcost: $25,000
• Since Company B’s marginal cost of abatement is higher than the market price of an allowance ($15per ton vs. $10 per ton), it decides to meet its emissions target by purchasing 5,000 allowances in theemissions market. Total cost: $50,000
• Total Cost for Company A & Company B: $75,000
Scenario 3 (Emissions Trading Scheme) • Since Company A’s marginal cost of abatement is lower than the market price of an allowance, it
decides to reduce emissions by 10,000 tons. Total Cost: $50,000. Company A uses 5,000 tons to meetits emissions target, but sells 5,000 tons in the emissions market at $10 per ton. Sales Proceeds:$50,000 (Company A’s Net Cost: $0)
• Since Company B’s marginal cost of abatement is higher than the market price of an allowance, itdecides to meet its emissions target by purchasing 5,000 allowances in the emissions market. TotalCost: $50,000
• Total Cost for Company A & Company B: $50,000
Source: European Union, “How Will Emissions Trading Benefit Companies and the Environment,” EU EmissionsTrading, Nov.18, 2004 at http://europa.eu.int, retrieved on Jan. 6, 2005.
Market SegmentsAlthough academic research and experimentation related to emissions trading dates backto the 1970s, emissions trading has only been considered a practical tool for air pollutionabatement since the early 1990s. Actual experience with emissions trading began withthe Environmental Protection Agency’s launch of the U.S. Acid Rain Program in 1995.Since that time, several other programs have been established (table 5-1), including bothgovernment-mandated programs and experimental private-sector initiatives. This chapterwill discuss four prominent emissions trading schemes currently in operation: the U.S.

12 These include the New South Wales Greenhouse Gas Abatement Scheme (Australia) andthe NOX Budget Trading Program (U.S.). 13 Clean Air Act, 42 U.S.C. 7401, 7651b. 14 EPA, “Cap and Trade: Acid Rain Program Basics,” found athttp://www.epa.gov/airmarkets/, retrieved Oct. 2004. 15 Under the U.S. Acid Rain Program, one allowance is an authorization to emit one ton ofSO2. Allowances are determined by prior emissions rates and historical fuel consumption.EPA, “Cleaning the Air: The Facts About Capping and Trading Emissions,” found athttp://www.epa.gov/airmarkets/, retrieved Oct. 2004. 16 EPA, “Cap and Trade: Acid Rain Program Basics,” found athttp://www.epa.gov/airmarkets/, retrieved Oct. 2004. 17 In 1980, U.S. sources emitted 17.3 million tons of SO2. EPA, “Cap and Trade: Acid RainProgram Basics,” found at http://www.epa.gov/airmarkets/, retrieved Oct. 2004. 18 EPA, “Cleaning the Air: The Facts About Capping and Trading Emissions,” found athttp://www.epa.gov/airmarkets/, retrieved Oct. 2004.
5-4
Acid Rain Program (U.S. SO2 Program), the European Union Emissions TradingScheme (EU-ETS), the United Kingdom Emissions Trading Scheme (UK-ETS), and theChicago Climate Exchange (CCX). Discussion will principally focus on the two mostactive trading schemes, the U.S. Acid Rain Program and the EU-ETS. Information ontwo smaller, regional trading schemes is presented in box 5-2.12
The U.S. Acid Rain Program (U.S. SO2 Program)The U.S. Acid Rain Program was established pursuant to authority in Title IV of the1990 Clean Air Act Amendments and is administered by the EPA.13 Congress providedauthority for the program as part of legislation to address concerns about the adverseeffects of sulphur and nitrogen oxide pollution. The goal of this program– a cap andtrade approach to emissions trading– is to reduce the environmental hazards posed byacid rain by limiting the amount of SO2 emitted, while simultaneously allowing eachaffected source to develop its own emissions control strategy. Participation in theprogram is mandatory. The program took effect in 1995 and initially covered 263 largeelectric power plants in Eastern and Midwestern States.14 In 2000, the overall numberof SO2 emissions allowances15 for these large plants was reduced, and smaller, cleaneroil-, coal-, and gas-fired plants were included in the program.16 Under the program, totalSO2 emissions by new sources and existing sources that generate more than 25megawatts are capped at 9.5 million tons, with the cap decreasing to 8.95 million tonsin 2010.17 Sources that emit SO2 in excess of their allowance are fined approximately$2,500 for each surfeit ton of SO2. According to the EPA, the Acid Rain Program is inpart responsible for annual SO2 emissions reductions of 50 percent since 1980. The EPAalso attributes a 40-percent reduction in scrubber costs during the 1990s to the Acid RainProgram.18 As discussed in Chapter 2, the broad empirical consensus is that the programhas been less costly than alternative emissions limitations and has brought aboutsignificant improvements in human health.

5-5
Table 5-1Comparison of emissions trading schemes1
U.S. SO2 Program2 EU emissions trading scheme UK emissions tradingscheme
Chicago climateexchange
Country/Region United States European Union United Kingdom United States
Type Cap-and-Trade Cap-and-Trade Cap-and-Trade Cap-and-Trade
Pollutant Coverage SO2 CO2 CO2 only or All greenhousegases (GHGs)
All GHGs
Participation Mandatory Mandatory Voluntary Voluntary
Sector Coverage Power plants Power generation plants, oilrefineries, iron and steel plants,& manufacturers of pulp/paper,cement, glass, lime, bricks, &ceramics.
Determined by firmparticipation; the UK-ETSexcludes power plants.
Determined by firm participation
Start Date 1995 (1st Phase)2000 (2nd Phase)
2005 2002 2003
Compliance Period Ongoing 2005-07 (1st Phase)2008-12 (2nd Phase)
Direct Participants (DPs):2002-06Climate Change AgreementParticipants (CCAPs): 2002-10
2003-06
Emission ReductionTarget
The cap is currently set at 9,500,000tons, as compared to 17,300,000tons in 1980. This amount isscheduled to decrease to 8,950,000tons by 2010.
8 percent of 1990 level by 2012(EU Kyoto Protocolcommitment); individual EUMember States’ targets vary,based upon commitments underthe Burden Sharing Agreement.
4,028.176 tons CO2e3 from1998-2000 baseline by2006; overall reductiontarget of 12,084,528 tonsCO2e over 5-year period.
Each Member must reduceemissions 1percent below1998-2001 baseline in2003, 2 percent in 2004, 3percent in 2005, and 4percent in 2006.
ComplianceMechanisms
~$2,500/ton for excess emissions 2005-07: i 40/ton2008-2012: i 100/ton
DPs: forfeit financialincentive CCAPs: forgo tax discount
Contractual obligation
Financial Incentive None None DPs: portion of £215Mincentive CCAPs: Energy tax rebates
None
Unit Traded SO2 Allowance = 1 ton of SO2 EU Allowance (EUA) = 1 ton ofCO2
UK Allowance (UKA) = 1 tonof CO2e
Carbon Finance Instrument(CFI) = 100 metric tons ofCO2e
See footnotes at end of table.

5-6
Table 5-1—ContinuedComparison of emissions trading schemes
U.S. SO2 Program2 EU emissions trading schemeUK emissions tradingscheme
Chicago climateexchange
Links to ExternalSchemes
No No No No
Allowance AllocationMethod
Allowances allocated at a rate of 1.2pounds of SO2 per million Britishthermal units of heat input, multipliedby the installation’s average fossilfuel consumed during 1985-1987;the total number of allowances iscapped at 9.5 million. Installationsestablished since 1995 mustpurchase allowances on the marketor via an annual auction.
Each country specifies itsallowance allocation in anindividual National AllocationsPlan (NAP); allocation will befree of charge; a small portion ofallowances will be available forauction to new entrant firms.
DPs committed to emissionsreductions, via auction, inexchange for a portion of a£215 million incentive fund. No allocation for CCAPs;CCAPs can use the UK-ETSto meet individual targetsand/or sell voluntaryemissions reductions.
Emissions allowances willbe issued based upon thetargets detailed above.
Banking & Borrowingof Allowances
-Banking allowed-Borrowing not allowed
No year-to-year limits onbanking or borrowing duringInitial Phase; 24 of 25 EU Stateswill not allow Initial Periodallowances to be banked orborrowed to/from the MandatoryPhase.
No year-to-year limits onbanking or borrowing during2002-2006; possible limitsinto 1st Kyoto complianceperiod (2008)
-Banking allowed-Borrowing not allowed
Monitoring/Registry Required Required Required Required
1 This table covers four prominent emissions trading schemes currently in operation; Denmark’s cap and trade emissions trading scheme, covering theelectricity sector, was phased out in 2003. Internal pilot schemes at British Petroleum (BP) and Royal Dutch Shell have also been phased out. 2 Several local-level emissions trading initiatives are at the discussion/planning or initial implementation stage in the United States, including Massachusettsand New Hampshire programs as well as the newly announced 9-state Regional Greenhouse Gas Initiative (RGGI). In 2003, Senators Joe Lieberman and JohnMcCain proposed a greenhouse gas cap-and-trade system for the United States. The bill, which was introduced on October 30, 2003, was defeated by a 55-43vote in the U.S. Senate. 3 Carbon dioxide (CO2) equivalents (CO2e or CO2 eq.) provide a universal standard of measurement against which the impacts of releasing (or avoiding therelease of) different greenhouse gases can be evaluated. Every greenhouse gas has a Global Warming Potential (GWP), a measurement of the impact thatparticular gas has on ‘radiative forcing’; that is, the additional heat/energy which is retained in the Earth’s ecosystem through the addition of this gas to theatmosphere. The GWP of a given gas describes its effect on the climate relative to a similar amount of carbon dioxide. In practice, most transactions involveCO2 or methane, since these gases are reportedly large contributors to climate change. Carbon dioxide and methane are also relatively easy to monitor. International Emissions Trading Association (IETA), “What are carbon dioxide equivalents (CO2 eq)?” found at www.ieta.org, retrieved on Dec. 8, 2004 andRichard Rosenzweig, Matthew Varilek, Ben Feldman, Radha Kuppalli, and Josef Janssen, The Pew Center on Global Climate Change, “The EmergingInternational Greenhouse Gas Market,” Mar. 2002, pp. iv, v, and 17.
Source: Compiled by the Commission from several sources including, inter alia Point Carbon, the European Union website, the Chicago Climate Exchange, andthe United Kingdom’s Department for Environment, Food, and Rural Affairs.
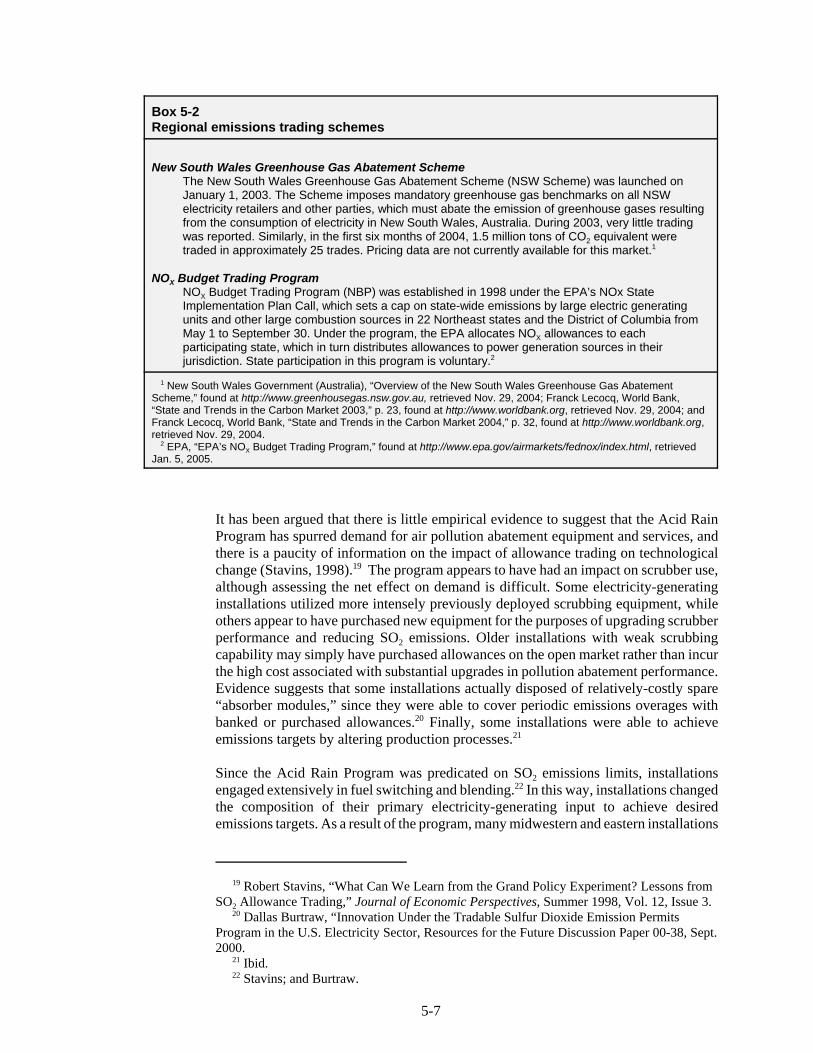
19 Robert Stavins, “What Can We Learn from the Grand Policy Experiment? Lessons fromSO2 Allowance Trading,” Journal of Economic Perspectives, Summer 1998, Vol. 12, Issue 3. 20 Dallas Burtraw, “Innovation Under the Tradable Sulfur Dioxide Emission PermitsProgram in the U.S. Electricity Sector, Resources for the Future Discussion Paper 00-38, Sept.2000. 21 Ibid. 22 Stavins; and Burtraw.
5-7
Box 5-2Regional emissions trading schemes
New South Wales Greenhouse Gas Abatement SchemeThe New South Wales Greenhouse Gas Abatement Scheme (NSW Scheme) was launched onJanuary 1, 2003. The Scheme imposes mandatory greenhouse gas benchmarks on all NSWelectricity retailers and other parties, which must abate the emission of greenhouse gases resultingfrom the consumption of electricity in New South Wales, Australia. During 2003, very little tradingwas reported. Similarly, in the first six months of 2004, 1.5 million tons of CO2 equivalent weretraded in approximately 25 trades. Pricing data are not currently available for this market.1
NOX Budget Trading ProgramNOX Budget Trading Program (NBP) was established in 1998 under the EPA’s NOx StateImplementation Plan Call, which sets a cap on state-wide emissions by large electric generatingunits and other large combustion sources in 22 Northeast states and the District of Columbia fromMay 1 to September 30. Under the program, the EPA allocates NOX allowances to eachparticipating state, which in turn distributes allowances to power generation sources in theirjurisdiction. State participation in this program is voluntary.2
1 New South Wales Government (Australia), “Overview of the New South Wales Greenhouse Gas AbatementScheme,” found at http://www.greenhousegas.nsw.gov.au, retrieved Nov. 29, 2004; Franck Lecocq, World Bank,“State and Trends in the Carbon Market 2003,” p. 23, found at http://www.worldbank.org, retrieved Nov. 29, 2004; andFranck Lecocq, World Bank, “State and Trends in the Carbon Market 2004,” p. 32, found at http://www.worldbank.org,retrieved Nov. 29, 2004. 2 EPA, “EPA’s NOX Budget Trading Program,” found at http://www.epa.gov/airmarkets/fednox/index.html, retrievedJan. 5, 2005.
It has been argued that there is little empirical evidence to suggest that the Acid RainProgram has spurred demand for air pollution abatement equipment and services, andthere is a paucity of information on the impact of allowance trading on technologicalchange (Stavins, 1998).19 The program appears to have had an impact on scrubber use,although assessing the net effect on demand is difficult. Some electricity-generatinginstallations utilized more intensely previously deployed scrubbing equipment, whileothers appear to have purchased new equipment for the purposes of upgrading scrubberperformance and reducing SO2 emissions. Older installations with weak scrubbingcapability may simply have purchased allowances on the open market rather than incurthe high cost associated with substantial upgrades in pollution abatement performance.Evidence suggests that some installations actually disposed of relatively-costly spare“absorber modules,” since they were able to cover periodic emissions overages withbanked or purchased allowances.20 Finally, some installations were able to achieveemissions targets by altering production processes.21
Since the Acid Rain Program was predicated on SO2 emissions limits, installationsengaged extensively in fuel switching and blending.22 In this way, installations changedthe composition of their primary electricity-generating input to achieve desiredemissions targets. As a result of the program, many midwestern and eastern installations
23 Burtraw. 24 Ibid. 25 EPA, “Clean Air Markets–Allowance Trading,” found athttp://www.epa.gov/airmarkets/trading/buying.html, retrieved Oct. 2004. 26 Ibid. 27 Refers to sources that have not been provided allowances. 28 EPA, “Acid Rain Program Allowance Auctions Fact Sheet,” found athttp://www.epa.gov/airmarkets/auctions/factsheet.html, retrieved Oct. 2004. 29 The EPA has identified eight types of allowance transactions that may take place: Inter-utility; intra-utility; reallocation; broker/trader-to-utility; utility-to-broker/trader; fuelcompany-to-utility; utility-to-fuel company; and other. EPA, “EPA’s ClassificationMethodology for Reported Private Allowance Transfers,” found athttp://www.epa.gov/airmarkets/trading/basics/defs.html, retrieved Oct. 2004 30 EPA, “Clean Air Markets–Allowance Trading,” found athttp://www.epa.gov/airmarkets/trading/buying.html, retrieved Oct. 2004. 31 EPA, “Trading Activity Breakdown,” found athttp://www.epa.gov/airmarkets/trading/so2market/transtable.html, retrieved Oct. 2004. 32 Ibid. 33 EPA, “Allowance Prices (1995-2004),” found athttp://www.epa.gov/airmarkets/trading/so2market/alprices.html, retrieved Oct. 2004.
5-8
simply switched to low-sulfur coal obtained via rail from Wyoming and Montana– anoption that was made cost effective by newly- established scale economies in mining andthe reasonable cost of rail transport.23 Overall, the market for low-sulfur coal grew as aresult of the program (Burtraw, 2000).24
Each March, the EPA makes available for purchase approximately 2.8 percent of totalissued SO2 allowances at its annual allowance auction, which is administered by theChicago Board of Trade (CBOT).25 Affected sources, brokers, environmental groups,and individuals are eligible to purchase allowances at these auctions, provided that theyhave opened a general allowance account with the EPA.26 The purpose of the auctionsis to ensure that new facilities27 have a public source from which to purchase allowancesnot previously allocated to existing units, and to establish allowance pricing data.28
However, interested parties may also purchase allowances from a variety of otherentities over the course of the compliance period.29 Allowances may be purchased fromindividuals, affected sources, broker/dealers, or environmental groups, the latter ofwhich may purchase allowances to prevent their use by industry.30
Available data suggest that trading activity– as measured in both the number of tradedSO2 allowances and the number of completed SO2 allowance trades– has increasedsubstantially since inception of the program. According to the EPA, the number oftraded SO2 allowances increased by 79 percent from 9.2 million in 1994 to 16.5 millionin 2003, having peaked at 25 million in 2000.31 Moreover, the number of completed SO2allowance trades increased from 215 in 1994 to 4,198 in 2003, having peaked at 5,755in 2002.32 Data on the pricing of SO2 allowances show substantial volatility, yet exhibitan overall upward trend since the program’s inception. SO2 allowance prices increasedsubstantially in 1998, doubling from about $100 per ton to over $200 per ton, but fellto under $130 per ton in 1999. By the summer of 2001, prices again reached over $200per ton, but subsequently decreased to approximately $130 per ton by the end of 2002,before climbing to over $200 per ton in 2004.33
34 Evolution Markets, SO2 Monthly Market Updates, Jan. 2003 through Nov. 2004, found athttp://www.evomarkets.com, retrieved Dec. 3, 2004. 35 Evolution Markets, “Spot Trades Data for SO2 From 01/01/02,” spreadsheet deliveredvia e-mail, Nov. 24, 2004. 36 Ibid. 37 Evolution Markets, SO2 Monthly Market Updates, Jan. 2003 through Nov. 2004, found athttp://www.evomarkets.com, retrieved Dec. 3, 2004. 38 Council Decision 2002/358/EC. The 10 new Accessions States are not covered by theEU target. In most cases, however, Accession States have Kyoto targets in the range of 6-8percent. European Union, “EU Emissions Trading,” Nov. 18, 2004, found athttp://europa.eu.int, retrieved on Jan. 6, 2005.
5-9
Since early 2003, a detailed analysis of the SO2 allowance market reveals a substantialincrease in price levels and price volatility, combined with erratic volume (figure 5-1).A sharp increase in trading volume– fueled by the approach of the 2003 complianceperiod deadline, combined with price speculation in anticipation of the EPA’s Marchauction– occurred in February 2003. However, SO2 allowance prices did not risesignificantly until the third quarter of 2003, when speculative buying occurred inresponse to heavy trading for compliance and short-coverage purposes. Prices continuedto increase rapidly through January 2004 due to colder than anticipated winter weatherand speculation that the proposed Interstate Air Quality Rule would usher in a period ofmore stringent SO2 regulations.34 Overall, average monthly allowance prices increasedfrom $142 per ton of SO2 in January 2003 to $245 per ton of SO2 in January 2004.35
During 2004, there was a steep rise in SO2 allowance price levels and price volatility,combined with an overall decline in trading volume. Average monthly SO2 allowanceprices rose from $245 per ton in January to $643 per ton by November.36 Factorscontributing to this substantial rise include, inter alia: (1) expectations of higher futurescrubber costs; (2) high oil and natural gas prices, which led to speculative tradingactivity over concerns of a possible shift toward coal generation which generallyrequires more allowances (or controls) than other fossil fuels, and is considered less“environmentally friendly,” (3) the proposed Clean Air Interstate Rule (CAIR), whichwould cut the SO2 emissions cap in 2010 and 2015 and treat banked emissionsfavorably, thus motivating the early purchase of allowances for future compliancepurposes; (4) positive U.S. macroeconomic data, which have indicated a continued U.S.economic recovery; and (5) overall market uncertainty.37
The European Union Emissions Trading Scheme(EU-ETS)
Overview
In 1997, the European Union (EU) ratified the Kyoto Protocol to the United NationsFramework Convention on Climate Change (UNFCCC), committing itself to reducegreenhouse gas emissions by 8 percent, relative to 1990 levels, during 2008-2012.38 As

39 EU Directive 2003/87/EC. 40 Additional greenhouse gases may be added during the Mandatory Phase.
5-10
Note.—The tick on the high/low bar represents the average SO2 allowance price for traded contracts during the month. The top of the high/low bar represents the highest price during the month while the bottom of the high/low bar representsthe lowest price during the month.
Source: Evolution Markets, “Spot Trade Data for SO2 From 01/01/02,” spreadsheet delivered via e-mail, Nov. 24, 2004.
part of its policy response to these commitments, the EU passed mandatory legislation39
creating the European Union Emissions Trading Scheme (EU-ETS). This cap-and-tradescheme, which began in January 2005, includes two phases: the Initial Phase (2005-2007) and the Mandatory Phase (2008-2012). The Initial Phase, designed as a trialperiod, will allow for gradual implementation by all EU-25 Member States prior to fullimplementation of the scheme during the Mandatory Phase, which is scheduled tocoincide with the first Kyoto Commitment Period. Subsequent 5-year phases areexpected to follow.
During the Initial Phase, more than 5,000 firms, representing approximately 12,000installations, will be required to meet CO2 emissions reduction targets.40 The affectedindustrial sectors, which produce nearly 46 percent of the EU’s CO2 emissions, include
0
100,000
200,000
300,000
400,000
500,000
600,000
Jan-0
2
Mar-02
May-02
Jul-0
2
Sep-02
Nov-02
Jan-0
3
Mar-03
May-03
Jul-0
3
Sep-03
Nov-03
Jan-0
4
Mar-04
May-04
Jul-0
4
Sep-04
Nov-04
SO2
allo
wan
ce v
olum
e
0
100
200
300
400
500
600
700
800
$US
per
SO2
allo
wan
ce
Volume Price
Figure 5-1U.S. SO2 Program, allowance prices and volumes arranged through brokers, January 2002 -January 2005

41 Additional sectors, including aluminum and transport, may be added during theMandatory Phase. 42 Starting in 2006, firms with emissions in excess of allowance holdings at the end of anannual April compliance deadline will be subject to fines of i40 per ton of CO2 during theInitial Phase and i100 per ton of CO2 during the Mandatory Phase, Vanessa Houlder andAndrew Taylor, “FT Briefing: Cutting Greenhouse Gases,” Financial Times, Apr. 4, 2004,found at http://www.ft.com/, retrieved Sep. 30, 2004. 43 European Commission, “Questions And Answers On Emissions Trading And NationalAllocations Plans,” updated Jan. 6, 2004, found at http://europa.eu.int, retrieved Jan. 10,2004; and Commission Communication COM(2003)830 of 7 January 2004 on guidance toassist Member States in the implementation of the criteria listed in Annex III to Directive2003/87/EC. 44 The UK NAP must also be re-approved following the submission of a revised NAPincreasing the number of allowances to be allocated by 19.8 million tons. 45 “Welcome to Kyoto Land, The Economist, found at http://www.economist.com, retrievedNov. 8, 2004; Natsource European Environmental Division, “European GHG EmissionsTrading Scheme,” found at http://www.natsource.com/markets/, retrieved Nov. 19, 2004;Saffina Rana, “EU Regulations: Emissions Trading Risks Collapse, Markets Warn,”Economist Intelligence Unit ViewsWire, Nov. 2, 2004, found at http://www.viewswire.com/,retrieved Nov. 19, 2004; and Point Carbon, “Carbon Politics This Week,” Carbon MarketEurope, Dec. 17, 2004, found at http://www.pointcarbon.com, retrieved Dec. 17, 2004. 46 A European Union Allowance (EUA) represents one ton of carbon dioxide equivalent. Carbon dioxide (CO2) equivalents (CO2e or CO2 eq.) provide a universal standard ofmeasurement against which the impacts of releasing (or avoiding the release of) differentgreenhouse gases can be evaluated. Every greenhouse gas has a Global Warming Potential(GWP), a measurement of the impact that particular gas has on ‘radiative forcing’; that is, theadditional heat/energy which is retained in the Earth’s ecosystem through the addition of thisgas to the atmosphere. The GWP of a given gas describes its effect on the climate relative to asimilar amount of carbon dioxide. In practice, most transactions involve CO2 or methane,since these gases are reportedly large contributors to climate change. Carbon dioxide andmethane are also relatively easy to monitor. International Emissions Trading Association(IETA), “What are carbon dioxide equivalents (CO2 eq)?” found at www.ieta.org, retrievedon Dec. 8, 2004 and Richard Rosenzweig, Matthew Varilek, Ben Feldman, Radha Kuppalli,and Josef Janssen, The Pew Center on Global Climate Change, “The Emerging InternationalGreenhouse Gas Market,” March 2002, pp. iv, v, and 17. 47 Forward contracts are agreements between two parties, buyer and seller, in which theformer agrees to purchase an asset from the latter at a specific future date. The price is agreedin advance, although payment is not made until the transaction date. Forward contracts areused in over-the-counter markets.
5-11
power generation plants, oil refineries, iron and steel plants, and factories producing pulpand paper, cement, glass, lime, bricks, and ceramics.41 Each EU Member State isrequired to develop and submit a National Allocation Plan (NAP) to the EuropeanCommission (EC). Each country’s NAP must list all covered installations as well as thequantity of allowances to be granted to each installation.42 As of January 2005, the EChad evaluated and approved 21 of 25 NAPs against 11 common criteria established inAnnex III of the Emissions Trading Directive.43 The remaining four NAPs are currentlyunder review.44 Many analysts believe that current NAP allocation levels do not requiresignificant emissions cuts on the part of affected installations.45
Market Characteristics
Although the EU-ETS officially began in January 2005, transactions in EU Allowances(EUAs)46 occurred through forward contracts47 as early as February 2003. Suchcontracts are typically negotiated with the assistance of an over-the-counter broker (box

48 Industry representative, e-mail message to USITC staff, Nov. 29, 2004; and EvolutionMarkets, Monthly Market Update: Greenhouse Gas Markets, Aug. 2004, found athttp://www.evomarkets.com/, retrieved Nov. 23, 2004. 49 Evolution Markets, Monthly Market Update: Greenhouse Gas Markets, various issuesSept. 2003-Dec. 2004, found at http://www.evomarkets.com, retrieved Dec. 15-16, 2004; andPoint Carbon, “Market Comment,” Carbon Market Analyst, various issues Jun. 2004-Dec.2004, found at http://www.pointcarbon.com, retrieved Dec. 15-16, 2004. 50 Vintage refers to the year in which allowances are delivered. For example, 2006 vintageallowances will be delivered in 2006. 51 Evolution Markets, Monthly Market Update: Greenhouse Gas Markets, June 2004, p. 1,found at http://www.evomarkets.com/, retrieved Dec. 17, 2004. 52 The transaction size under a fully operational EU-ETS likely will be closer to 50,000EUAs. Benedickt von Butler, “Carbon Market Picture Comes Into Focus,” World Power, Apr.2004, found at http://www.evomarkets.com, retrieved Nov. 10, 2004. 53 Evolution Markets, Monthly Market Update: Greenhouse Gas Markets, June 2004, p. 1,found at http://www.evomarkets.com, retrieved Dec. 17, 2004.
5-12
5-3), although a significant volume of EUAs are exchanged bi-laterally betweencompanies.48 During 2003-04, the average forward contract was written for the deliveryof 5,000-10,000 allowances in 2005,49 also known as 2005 vintage.50 Contractdenominations of this size are small relative to corresponding denominations in relatedenergy markets.51 Since most installations will likely receive millions of allowances aspart of the allocation process, market observers believe that contracts of this size are notexecuted to meet compliance targets. Instead, such transactions are likely undertaken togain emissions trading experience, test internal systems and processes, and demonstratethe feasibility of emissions trading to senior management.52
Unlike established commodities markets, a universally-accepted contract for EUAs hasyet to be established. Currently, three types of contracts are used to execute EUAtransactions: the International Emissions Trading Association’s (IETA) EmissionsTrading Master Agreement for the EU scheme; the European Federation of EnergyTraders (EFET) Agreement; and the International Swaps and Derivatives Association,Inc. (ISDA) Master Agreement. To date, the majority of trading has taken place througheither the IETA contract or the EFET contracts. Some industry sources, however,indicate that adoption of the ISDA contract would promote market development andliquidity by facilitating the entry of financial institutions into the EU scheme as well asproviding a framework for the trading of sophisticated financial derivatives such asfutures and options contracts.53
Market Participants
Upon full implementation, more than 5,000 companies are expected to participate in thetrading of emissions allowances on the EU-ETS. Currently, however, largemanufacturing emitters are largely absent from the market. Instead, trading activity onthe EU-ETS is limited almost exclusively to a small number of large European powergenerators that have established commodity trading desks and power generation assets

54 Point Carbon, “Market Comment,” Carbon Market Europe, Dec. 3, 2004, found athttp://www.pointcarbon.com, retrieved Dec. 10, 2004; Point Carbon, “Market Comment,”Carbon Market Europe, Dec. 10, 2004, found at http://www.pointcarbon.com, retrieved Dec.10, 2004; Evolution Markets, “Monthly Market Update: Greenhouse Gas Markets,” Oct.2004, p. 1, found at http://www.evomarkets.com, retrieved Oct. 21, 2004; and Point Carbon,“Industry Chooses Sideline,” Carbon Market Europe, Dec. 17, 2004, found athttp://www.pointcarbon.com, retrieved Dec. 17, 2004. 55 Industry representatives, interviews by USITC staff, London, United Kingdom, Oct. 25-26, 2004. 56 Point Carbon, “EU ETS value growing,” Carbon Market Europe, Dec. 10, 2004, foundat http://www.pointcarbon.com, retrieved Dec. 10, 2004. 57 Industry representatives, interviews by USITC staff, London, United Kingdom, Oct. 26-27; and Point Carbon, “EU ETS Value Growing,” Carbon Market Europe, Point Carbon, Dec.10, 2004, found at http://www.pointcarbon.com, retrieved Dec. 10, 2004.
5-13
Box 5-3Anatomy of an EUA brokered trade
Step 1: Buyer RequirementCustomer calls broker to purchase EUAs.
Step 2: NegotiationBroker contacts likely seller; buyer and sellernegotiate price/terms through broker. Termstypically include price, volume, vintage year, anddelivery date.
Step 3: Verbal ConfirmationTrade is executed, subject to creditconsiderations, between buyer/seller counter-parties via legally binding verbal confirmation(typically over recorded phone lines).
Step 4: Written ConfirmationBroker faxes a written confirmation containingcontract terms and counter-party contactinformation.
Step 5: Contract ExecutionLegal contract is executed and exchangedbetween counter-parties.
Step 6: Broker FeeBroker charges a per ton fee for matchingbuyers and sellers.
Step 7: SettlementDue to the forward nature of the EU-ETSmarket, EUA delivery will take place on aspecified future date after January 1, 2005.Delivery will be accomplished, in accordancewith the terms of the contract, by a transfer fromseller to buyer on an electronic registry.Payment will typically be made concurrent withdelivery; companies with a low credit rating maybe required to make payment prior to delivery.Spot market transactions will likely start in 2005,subject to allowance allocation and registryestablishment.1
1 Evolution Markets, “How To Trade EU Emissions Allowances Using A Broker In Seven Simple Steps,”found at http://www.evomarkets.com, retrieved Nov. 10, 2004; CO2e, “ETS Basics: PracticalConsiderations,” found at http://www.co2e.com, retrieved Nov. 16, 2004, and industry representatives,interviews by USITC staff, London, United Kingdom, Oct. 26-27, 2004.
in several European countries.54 Important traders in the energy/power sector includeRWE (Germany), EDF Energy (U.K.), E-On (Germany), and Electrobel (Belgium).Shell Trading, a division of Royal Dutch Shell (Netherlands/U.K.), is also an activemarket participant.55 By contrast, most large financial institutions currently are not activeplayers in the EU market, largely because low trading volumes limit profit-makingopportunities.56 Fortis Bank (Netherlands/Belgium), which offers retail services–including trading services, risk management advisory services, and emissions portfoliomanagement– is the main financial services firm operating in the European market.Barclays Capital (U.K.) is also relatively active in the EU-ETS forward market.57

58 Point Carbon, Carbon Market Europe, various issues Dec. 2003-Dec. 2004, found athttp://www.pointcarbon.com, retrieved Nov. 22-24, 2004. 59 EUAs for delivery in 2005 (i.e., 2005 vintage) were the most commonly traded contractsduring 2005 and 2004. 60 Point Carbon, “Weekly Closing prices for EU allowances (EUAs) for delivery in 2005,2006, and 2007,” spreadsheet delivered via e-mail, Nov. 30, 2004. 61 Industry representatives, interviews by USITC staff, London, United Kingdom, Oct. 26-27, 2004; and Benedickt von Butler, “Carbon Market Picture Comes Into Focus,” WorldPower, Apr. 2004, found at http://www.evomarkets.com, retrieved Nov. 10, 2004. 62 According to Evolution Markets, companies that expected to have surplus allowanceswere unwilling to sell until the announcement of firm-level allocations. Evolution Markets,Monthly Market Update: Greenhouse Gas Markets, June 2004, found athttp://www.evomarkets.com, retrieved Nov. 17, 2004. 63 Ernst & Young, “The European Union Emissions Trading Scheme: A Challenge ForIndustry Or Just An Illusion,” July 2004. 64 “Welcome To Kyoto Land,” The Economist, Oct. 7, 2004, found athttp://www.economist.com, retrieved Nov. 8, 2004. 65 Point Carbon, Highlights 2003, December 2003, found at http://www.pointcarbon.com,retrieved Nov. 24, 2004. 66 Point Carbon, “Market Comment,” Carbon Market Europe, Dec. 3, 2004, found at foundat http://www.pointcarbon.com, retrieved Dec. 3, 2004; and Point Carbon, “Weekly Closingprices for EU allowances (EUAs) for delivery in 2005, 2006, and 2007,” spreadsheetdelivered via e-mail, Nov. 30, 2004. 67 “Welcome To Kyoto Land,” The Economist, Oct. 7, 2004, found athttp://www.economist.com, retrieved Nov. 8, 2004; Evolution Markets, “Monthly MarketUpdate,” Carbon Market Europe, Aug. 2004, found at http://www.evomarkets.com, retrievedNov. 17, 2004, and industry representatives, interviews by USITC staff, London, UnitedKingdom, Oct. 26-27, 2004. 68 Point Carbon, “Christmas Limits December EU ETS Trades,” Carbon Market Europe,Jan. 7, 2005, found at http://www.pointcarbon.com, retrieved Jan. 7, 2005.
5-14
Market Activity
Although the first forward contract was negotiated in February 2003, trading in EUAcontracts took place on a relatively infrequent basis during 2003 and most of 2004.58
Using data for 2005 vintage EUAs,59 for example, only 1.5 million tons of CO2 weretraded through brokerage firms between September 2003 and August 2004 (figure 5-2);60
such volumes are considered low as compared to established energy and environmentalmarkets.61 Low trading levels are attributed to market infancy, a shortage of sellers,62
a lack of preparation among affected companies,63 and general uncertainty surroundingKyoto ratification64 and the NAP process.65 During September 2004-February 2005,transaction volumes increased significantly, with the number of weekly transactionsregularly exceeding the total number of transactions registered during the first quarterof 2004.66 This sharp increase is predominantly attributed to market psychology effectsstimulated by Russia’s decision to ratify the Kyoto Protocol.67 By the end of 2004,brokered transactions totaling approximately 9.1 million EUAs were recorded in the EU-ETS forward market; 78 percent of this volume was represented by contracts of 2005vintage, while 2006 vintage and 2007 vintage contracts accounted for 9 percent and 13percent, respectively.68
The Commission obtained daily settlement-price data for EUA 2005 forward contractsfor the period July 2003 through January 2005. Using this data, the Commissiondeveloped average price estimates for contracts traded during each month (figure 5-2).

69 Evolution Markets, "Historical Settle Prices For EUAs From 6/23/03," spreadsheetsdelivered via e-mail, Jan. 31, 2005 and Feb. 16, 2005. 70 Evolution Markets, "Historical Settle Prices For EUAs From 6/23/03," spreadsheetsdelivered via e-mail, Jan. 31, 2005 and Feb. 16, 2005. By February 22, 2005, daily prices forEUA 2005 contracts had increased to the i8-9 range. Point Carbon homepage, found athttp://www.pointcarbon.com/, retrieved on Feb. 22, 2005.
5-15
Note.—The tick on the high/low bar represents the average EUA settle price for contracts traded during themonth. The top of the high/low bar represents the highest price during the month while the bottom of thehigh/low bar presents the lowest price during the month. During periods in which no EUA trades occured, thebid/ask midpoint is used as a proxy for the weekly closing price.
Source: Evolution Markets, “Historical Settle Prices For EUAs From 6/23/03,” spreadsheet delivered via e-mail, Jan. 31, 2005; and industry representative, e-mail to USITC staff, Feb. 16, 2005.
During this period, EUA 2005 average prices experienced high levels of volatility,trading between a low of i7.38 in April 2004 and a high of i12.94 in February 2004,before leveling off in the i8-9 range during May 2004 - December 2004.69 DuringJanuary 2005, the average monthly price declined to i7.12.70 Uncertainty regardinganticipated NAP allocations and the EU review process was the dominant factor
-
500,000
1,000,000
1,500,000
2,000,000
2,500,000
3,000,000
3,500,000
4,000,000
4,500,000
5,000,000
5,500,000
6,000,000
6,500,000
Jul 0
3
Aug 03
Sept 0
3
Oct 03
Nov 03
Dec 03
Jan 0
4
Feb 04
Mar 04
Apr 04
May 04
June
04Ju
l 04
Aug 04
Sep 04
Oct 04
Nov 04
Dec 04
Jan 0
5
EU
A V
olum
e
-
1.00
2.00
3.00
4.00
5.00
6.00
7.00
8.00
9.00
10.00
11.00
12.00
13.00
14.00
15.00
Eur
o pe
r EU
A
Figure 5-2EU Emissions Trading Scheme, EU allowance (EUA) prices and volumes arranged throughbrokers, July 2003 - January 2005

71 The expected initial supply of EUAs resulting from the NAP allocation process hashistorically been an important determinant of EUA pricing. For example, when the EuropeanCommission (EC) was perceived as enforcing stringent NAP standards (bullish indicator), theEUA price generally increased. Similarly, during periods when it was perceived that the ECwas being more lenient on NAP standards (bearish indicator), the EUA price generallydecreased. As a result, bullish and bearish NAP announcements and rumors associated withthe NAP allocation process caused prices to fluctuate. Industry representative, interview withUSITC staff, London, United Kingdom, Oct. 26-27, 2004, Point Carbon, “Market Comment,”Carbon Market Europe, Nov. 12, 2004, found at http://www.pointcarbon.com, retrieved Nov.22, 2004; and Point Carbon, “Market Comment,” Carbon Market Europe, Dec. 17, 2004,found at http://www.pointcarbon.com, retrieved Dec. 17, 2004. 72 Point Carbon, “Highlights 2003,” Dec. 19, 2003, found at http://www.pointcarbon.com,retrieved Nov. 22, 2004. 73 The Joint Implementation (JI) Mechanism established under Article 6 of the KyotoProtocol to the United Nations Framework Convention on Climate Change (UNFCCC) grants41 industrialized countries and economies in transition (Annex 1 countries) the right togenerate and/or purchase emissions reduction units (ERUs) from investments in emissionsreduction projects in other Annex 1 countries, subject to certain conditions, IETA, “KyotoMechanisms: Joint Implementation,” found at www.ieta.com, retrieved Sept. 20, 2004. 74 The Clean Development Mechanism (CDM) established under Article 12 of theUNFCCC grants Annex 1 countries the right to generate and/or purchase certified emissionsreductions (CERs) from investments in emissions reduction projects in non-Annex 1countries, under certain conditions, IETA, “Kyoto Mechanisms: Clean DevelopmentMechanism,” found at http://www.ieta.com, retrieved Sept. 20, 2004. 75 Industry representatives, interviews by USITC staff, London, United Kingdom, Oct. 26-27, 2004; and Carbon Market Europe, various issues Jan. 2004-January 2005, found athttp://www.pointcarbon.com, retrieved on Dec. 17, 2004. Directive 2004/101/EC allowscredits from JI and CDM projects to be converted to EUAs and traded on the EU-ETS.European Union, “EU Emissions Trading,” Nov. 18, 2004, found at http://europa.eu.int,retrieved Jan. 6, 2005. 76 Companies classified as Direct Participants have committed to emissions reductiontargets in exchange for a share of a £215 incentive fund. By contrast, Climate ChangeAgreement Participant companies, also known as Indirect Participants, are motivated toreduce emissions by a discount on an energy consumption tax.
5-16
underlying price volatility during much of 2003, 2004, and early 2005.71 Volatilityduring much of this period is also attributed to “gaming” in the early stages of pricediscovery, whereby traders sought to test the price sensitivity of potential buyers andsellers.72 Some observers expect that the factors influencing future price movements willextend beyond the politics of NAP allocations to include supply/demand fundamentalssuch as weather trends, economic growth forecasts, oil/coal forward price differentials,greenhouse gas abatement costs, and supply issues associated with the influx of creditsfrom Kyoto-compliant Joint Implementation (JI)73 and Clean Development Mechanism(CDM)74 projects.75
The United Kingdom Emissions Trading Scheme (UK-ETS)
The United Kingdom’s voluntary emissions trading scheme was launched in April 2002.Although 34 companies joined as Direct Participants, the majority of active marketparticipants are Climate Change Agreement Participants.76 The UK market experienceda relatively high level of trading activity during 2002 and 2003. In 2002, there were 2.48

77 One United Kingdom Allowance (UKA) represents 1 ton of carbon dioxide equivalent(CO2e). 78 Industry representatives, interviews by USITC staff, London, United Kingdom, Oct. 25-26, 2004; and Point Carbon, “Highlights 2003,” Carbon Market Analyst, Dec. 19, 2003, foundat http://www.pointcarbon.com, retrieved Nov. 23, 2004. 79 Industry representative, e-mail message to USITC staff dated Nov. 22, 2004. 80 Industry representatives, interviews by USITC staff, London, United Kingdom, Oct. 25-26, 2004. In 2004, the supply of allowances was estimated to exceed demand byapproximately 11.5 million tons. As a result, the UK government is examining the options forreducing the over-supply Point Carbon, “What is the UK ETS,” Carbon Market Europe,September 10, 2004, p. 3, found at http://www.pointcarbon.com/, retrieved Dec. 17, 2004. 81 Industry representatives, interviews by USITC staff, London, United Kingdom, Oct. 25-26, 2004; and Point Carbon, “Highlights 2003,” Carbon Market Analyst, Dec. 19, 2003, foundat http://www.pointcarbon.com, retrieved Nov. 23, 2004. 82 Admission to the CCX is a voluntary decision. However, upon admittance, companiesmust commit to mandatory emissions targets. Industry representative, interview with USITCstaff, Chicago, Dec. 2, 2004. 83 Industry representative, interview by USITC staff, Chicago, Dec. 2, 2004. 84 Ibid.
5-17
million UKAs77 traded in 434 separate trades, most of which occurred during the finalquarter. Similarly, 140 contracts, representing approximately 500,000 UKAs, weretraded during the first three months of 2003. Heavy trading during this period isreflected in the volatility of spot market prices, which increased from approximately £4per UKA in April 2002 to a peak of £12 per UKA in September 2002, before decliningto £2.50 per UKA by the spring of 2003. This sharp increase in trading is attributed tothe efforts of Indirect Participants to meet their first emissions compliance deadline,combined with the small supply of UKAs, as many companies had not yet received theirallowances. Speculative activity was also considered to be an important factor.78
After the first quarter of 2003, trading volumes decreased significantly, while spot pricesstabilized in the £2-4 per UKA range. By the end of 2004, trading volumes had declinedto an estimated 4,000-8,000 UKAs per month.79 Market participants and BritishGovernment officials attribute lower market activity to a significant over-supply ofallowances.80 In addition, Indirect Participants appear to trade largely for compliancepurposes, remaining absent from the market except during brief periods precedingbiennial compliance deadlines.81
Chicago Climate Exchange (CCX)The Chicago Climate Exchange, which started in December 2003, is a voluntary cap-and-trade scheme.82 Members of the CCX include large U.S. firms such as DuPont, FordMotor Company, and International Paper, as well as university research institutes,nongovernmental organizations, and numerous brokerage firms. Although the CCXallows trading in six greenhouse gases (carbon dioxide, methane, nitrous oxide,hydrofluorocarbons, perfluorocarbons, and sulfur hexafluoride) most trading involvesCO2.83 Member firms typically trade to gain emissions trading experience as well as tomeet emissions compliance targets. However, due to the infancy of the market, monthlytransaction volumes are quite low.84 During January-November 2004, for example, a
85 Emissions on the CCX are packaged as Carbon Financial Instruments (CFIs); one CFI isequal to 100 metric tons of carbon dioxide equivalent (CO2e). 86 Benedick von Butler, “Carbon Market Picture Comes Into Focus,” World Power, Apr.2004, found at http://www.evomarkets.com, retrieved Nov. 10, 2004. 87 Industry representative, interview by USITC staff, Chicago, Dec. 2, 2004. 88 Other brokers operating in emissions trading markets include CO2e.com, GFI,Greenstream, GT Energy, Spectron, and Traditional Financial Services. Point Carbon. “TheCarbon Market Indicator Explained,” found at http://www.pointcarbon.com, retrieved Nov.22, 2004. 89 In general, greenfield investment activity in the emissions trading sector is limited asmost brokerage and market research firms offer emissions trading services through establishedbrokerage operations abroad. Emissions trading activities represent a relatively new activityfor many brokerage and market research firms.
5-18
total of approximately 2.2 million metric tons85 representing 2003, 2004, 2005, and 2006vintages, were traded on the CCX (figure 5-3); volumes of this size are considered smallrelative to more established commodity markets.86
During much of this period, average monthly prices for all vintage years traded below$1.00 per metric ton (figure 5-4). However, during October and November 2004,transaction volumes increased significantly relative to volumes in previous months.During this period, the average price per metric ton increased to approximately $1.50;the volatility of average prices was also high, ranging between $0.97-$2.06 per metricton. The increase in prices, volumes, and volatility during October-November 2004 isattributed to market psychology effects stimulated by Russia’s decision to ratify theKyoto Protocol.87
Trade and InvestmentAlthough services provided in connection with emissions trading activities are linked tothe abatement of air pollution, the primary suppliers of such services are typicallybrokerage and market research firms. The most visible brokerage firms in the emissionstrading market, Evolution Markets LLC and Natsource LLC, are based in the UnitedStates.88 Since these firms are also important providers of brokerage services inEuropean markets, international trade in services likely accounts for a large portion ofactivity within the sector. While brokerage services are traded across borders (Mode 1),the most common delivery method for such services is sales through a foreigncommercial presence (Mode 3). To illustrate, Evolution Markets initially conductedbusiness in Europe through cross-border trade, offering brokerage services to Europeanclients from its offices in White Plains, New York. Starting in January 2004, however,it established an office in London to serve its European customers.89

90 Industry representative, interview by USITC staff, London, United Kingdom, Oct. 27,2004. 91 Point Carbon homepage, found at http://www.pointcarbon.com, retrieved on Jan. 17,2005; and Environmental Finance homepage, found athttp://www.environmental-finance.com, retrieved on Jan. 17, 2005.
5-19
Source: Chicago Climate Exchange, http://www.chicagoclimatex.com/trading/marketData.html, retrieved onDec. 16, 2004.
Market research and data services related to emissions trading are also provided throughcross-border trade (Mode 1) and foreign commercial presence (Mode 3). The mostvisible providers of such services– Point Carbon (Norway), Argus Media (U.K.), andEnvironmental Finance (U.K.)90– deliver their services across borders whensubscription-based research reports and/or newsletters are delivered over the Internet toclients outside their home country. Point Carbon and Argus Media, which maintainestablished offices in a variety of countries, also offer market research and data servicesthrough commercial presence. In addition, Point Carbon and Environmental Financeorganize industry conferences.91 When such conferences are held in the home countryof the conference organizer, services may be delivered via Mode 2 (ConsumptionAbroad). However, when a conference is held in another country, services may bedelivered via Mode 4 (Natural Persons).
-
100,000
200,000
300,000
400,000
500,000
600,000
Jan-04
Feb-04
Mar-04
Apr-04
May-04
Jun-04
Jul-04
Aug-04
Sep-04
Oct-04
Nov-04
Dec-04
Volu
me
in m
etric
tons
2003 2004 2005 2006
Figure 5-3Chicago Climate Exchange, volumes by month and vintage, 2004
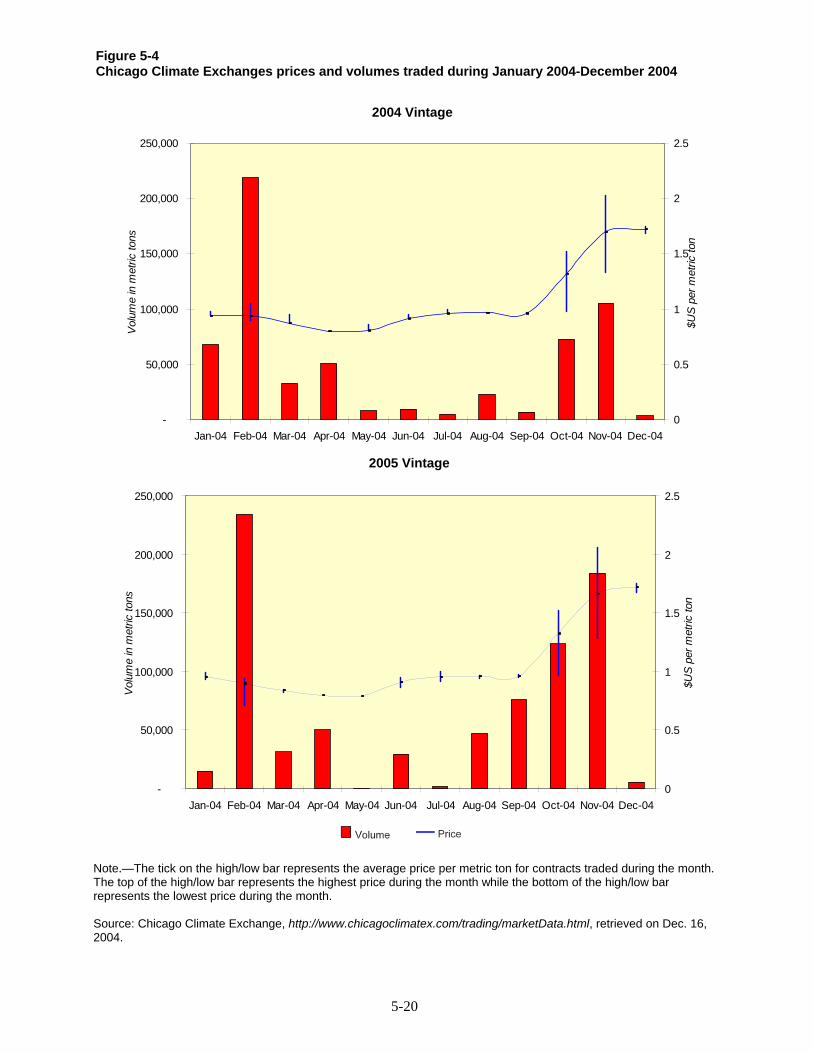
5-20
Figure 5-4Chicago Climate Exchanges prices and volumes traded during January 2004-December 2004
Note.—The tick on the high/low bar represents the average price per metric ton for contracts traded during the month.The top of the high/low bar represents the highest price during the month while the bottom of the high/low barrepresents the lowest price during the month.
Source: Chicago Climate Exchange, http://www.chicagoclimatex.com/trading/marketData.html, retrieved on Dec. 16,2004.
-
50,000
100,000
150,000
200,000
250,000
Jan-04 Feb-04 Mar-04 Apr-04 May-04 Jun-04 Jul-04 Aug-04 Sep-04 Oct-04 Nov-04 Dec-04
Vol
ume
in m
etric
tons
0
0.5
1
1.5
2
2.5
$US
per
met
ric to
n
2004 Vintage
-
50,000
100,000
150,000
200,000
250,000
Jan-04 Feb-04 Mar-04 Apr-04 May-04 Jun-04 Jul-04 Aug-04 Sep-04 Oct-04 Nov-04 Dec-04
Vol
ume
in m
etric
tons
0
0.5
1
1.5
2
2.5
$US
per
met
ric to
n
2005 Vintage

92 For a discussion on the impact of SO2 emissions trading on the market for air pollutionabatement goods and services, see “The U.S. Acid Rain Program (U.S. SO2 Program)” in thischapter. 93 Industry representative, e-mail message to USITC staff, Nov. 19, 2004. 94 Ibid. 95 Point Carbon, “Norway Sets Up Lackluster ETS,” Carbon Market Europe, Dec. 17,2004, found at http://www.pointcarbon.com, retrieved Dec. 17, 2004. 96 Point Carbon, “London To Push For ETS Links To State-level Action In US,” Dec. 12,2004, found at http://www.pointcarbon.com, retrieved Dec. 12, 2004; Point Carbon, “EU-NSW Emissions Trading Link To Be Explored,” Dec. 17, 2004, found athttp://www.pointcarbon.com, retrieved Dec. 17, 2004; Point Carbon, “Linking EmissionsTrading Schemes,” Carbon Market Europe, Jun. 11, 2004, found athttp://www.pointcarbon.com; Point Carbon, “After COP10: What Now For EU ClimatePolicy?” Carbon Market Europe, found at http://www.pointcarbon.com, retrieved Jan. 3,2004, and industry representatives, e-mail messages to USITC staff, Nov. 19, 2004. 97 European Union Allowances will be recorded in accounts held in electronic registries setup by Member States. European Union, “EU Emissions Trading,” Nov. 18, 2004, found athttp://europa.eu.int, retrieved on Jan. 6, 2005. 98 Point Carbon, “EC Finalizes Registry Legislation,” Dec. 21, 2004, found athttp://www.pointcarbon.com/, retrieved on Dec. 21, 2004. Denmark established a nationalregistry and allocated allowances to affected institutions in early 2005, facilitating the firstEUA spot transaction in Denmark on Feb. 7, 2005 between Shell Trading and Energi E2; priceor volume information was not disclosed. Point Carbon, “Shell, Energi E2 Execute First EUETS Spot Contract,” Feb. 7, 2005, found at http://www.pointcarbon.com, retrieved on Feb. 7,2005.
5-21
Market OutlookWith the exception of the SO2 program92 in the United States, emissions trading marketsworldwide are in the early stages of development. As a result, the net affects of emissionstrading programs in their respective markets for air pollution abatement equipment andservices is difficult to determine. Although the newly ratified Kyoto Protocol, whichendorses emissions trading as a tool to reduce greenhouse gas emissions, may providean incentive for more countries to develop emissions trading programs, the EU-ETS willlikely be the most active greenhouse gas trading scheme over the next 3-5 years.93 Someobservers expect that an international emissions trading market will develop through thelinking of regional schemes. Canada and Japan, for example, are expected to developemissions trading schemes which will eventually be linked to the EU-ETS.94 Norwayalso plans to launch a domestic emissions trading scheme that is expected to link to theEU-ETS.95 The EU also has discussed linkages with the New South Wales Scheme andthe developing Regional Greenhouse Gas Initiative (RGGI) in the United States. TheBritish Government, which assumes the EU presidency in June 2005, also has announcedthat it intends to pursue links with the RGGI as well as any schemes that develop inCanada or Japan.96
Following the establishment of national registries97 and the final allocation of allowancesin 2005, many observers believe that a spot market in EUAs likely will develop in theEuropean Union.98 How this market will develop, however, remains unclear. Althoughtraders reportedly hope that an active, sophisticated market will emerge in 2005/2006,many observers believe that trading activity will be relatively muted during the InitialPhase. For example, some analysts believe that generous allowance allocations will leadto an over-supply of EUAs, putting downward pressure on pricing and trading activity,

99 Saffina Rana, “EU Regulations: Emissions Trading Risks Collapse, Markets Warn,”Economist Intelligence Unit Views Wire, Nov. 2, 2004, found at http://www.viewswire.com,retrieved Nov. 19, 2004; Point Carbon, “Market Comment,” Carbon Market Europe, Dec. 10,2004, found at http://www.pointcarbon.com, retrieved Dec. 10, 2004; Point Carbon, “ReportSlams ETS Allocation Process, UK Climate Policy,” Feb. 5, 2005, found athttp://www.pointcarbon.com/, retrieved on Feb. 7, 2005; and industry representatives,interviews by USITC staff, Brussels, Belgium, Oct. 27-28, 2004. 100 Industry representatives, interviews by USITC staff, London, United Kingdom andBrussels, Belgium, Oct. 26-28, 2004. 101 “Welcome To Kyoto Land,” The Economist, Nov. 8, 2004, found athttp://www.economist.com, retrieved Nov. 8, 2004; Point Carbon, “Highlights 2003,” Dec. 19,2003, found at http://www.pointcarbon.com, retrieved Nov. 22, 2004; Point Carbon, “Outlook2004,” Dec. 23, 2003, found at http://www.pointcarbon.com, retrieved Nov. 22, 2004; PointCarbon, “Over-allocation Undermines EU ETS, says WWF,” Dec. 23, 2004, found athttp://www.pointcarbon.com, retrieved Jan. 3, 2005; David Gow, “CO2 Trading Targets TooGenerous, Say Environmentalists,” The Guardian (United Kingdom), Jan. 5, 2004, found athttp://search.ft.com, retrieved Jan. 10, 2004; and Point Carbon, “Report Slams ETS AllocationProcess, UK Climate Policy,” Feb. 5, 2005, found at http://www.pointcarbon.com/, retrievedon Feb. 7, 2005. 102 Industry representative, interview by USITC staff, Oct. 27, 2004; and Point Carbon,“Market Comment,” Carbon Market Europe, Dec. 10, 2004, found athttp://www.pointcarbon.com, retrieved Dec. 10, 2004. 103 Jeremy Grant, “CCX Takes Chicago By Storm,” Financial Times, Nov. 15, 2004, foundat http://www.ft.com, retrieved Nov. 18, 2004; Jeremy Grant, “Exchanges Plan CarbonEmissions Contract,” Financial Times, Aug. 18, 2004, found at http://www.ft.com, retrievedSep. 14, 2004; and industry representative, interview by USITC staff, Chicago, Dec. 2, 2004. 104 An initial trade, between EDF Trading and Statoil, was executed for 5,000 EUAs at aprice of i7.15. An additional 40,000 EUAs traded during the remainder of the day. PointCarbon, “First Clearing Exchange For European Allowances Launches,” Feb. 11, 2005, foundat http://www.pointcarbon.com, retrieved on Feb. 11, 2005; and Point Carbon, “Nord PoolSees 45,000 Tonnes Traded During Debut Day,” Feb. 11, 2005, found athttp://www.pointcarbon.com, retrieved Feb. 11, 2005.
5-22
and possibly resulting in a precipitous reduction in EUA prices.99 Similarly, someparticipants speculate that the influx of emissions reduction “credits” from CDM and JIprojects will increase the supply of EUAs, putting downward pressure on overallpricing.100 Others, particularly environmental groups, worry that allowance allocationswill simply meet existing emissions levels, removing the incentive to abate and/ortrade.101 Low participation rates on the part of many affected firms owing to inexperienceand/or lack of preparation also may reduce trading levels.102
In anticipation of increasing EUA transactions, several organizations are attempting toestablish emissions trading exchanges. For example, the Chicago Climate Exchange andthe International Petroleum Exchange (IPE) announced plans to establish the EuropeanClimate Exchange (ECX; United Kingdom). Under this plan, the CCX will design andmarket CO2 trading products based on the EU-ETS, using the IPE’s exchange andelectronic trading platform to list spot and futures contracts.103 Competing initiatives,which are also in the early planning stages, include the Austrian Energy Exchange(EXAA; Austria), and the European Energy Exchange (EEX; Germany). On February11, 2005, Nord Pool (Norway) launched an electronically-cleared exchange.104 In France,a group composed of Euronext, Powernext, and Caisse de Dépôts et Consignation plan

105 Laetitia Clavreul and Cecile Ducourtieux, “La Bourse francaise d’exchange de quotasde CO2 devrait etre operationnelle en mars,” Le Monde, Jan. 6, 2005, found athttp://www.lemonde.fr, retrieved Jan. 10, 2004. 106 Industry representatives, interviews by USITC staff, London, United Kingdom, Oct. 26-27, 2004; Point Carbon, “Exchanges, Brokers Set To Compete For Market Share,” CarbonMarket Europe, Sept. 10, 2004, found at http:///www.pointcarbon.com, retrieved Nov. 22,2004; and “A Green Future,” The Economist, Sep. 9, 2004, found athttp://www.economist.com, retrieved Sep. 10, 2004.
5-23
to set up a CO2 emissions exchange.105 Although some participants express concern thatexchanges would compete with brokers, scattering liquidity and leading to a fragmentedmarket, others believe that such exchanges will not be harmful to the nascent CO2emissions market. Indeed, some market participants believe that competition among theexchanges will narrow the field and/or result in the emergence of a single dominantexchange.106

1 The Columbia Electronic Encyclopedia, 6th ed., Columbia University Press, found athttp://www.infoplease.com/ce6/sci/A0835810.html, retrieved Sept. 22, 2004. 2 National Pollution Clearinghouse, Noise Pollution, found athttp://www.nonoise.org/aboutno.htm, retrieved Sept. 13, 2004. 3 Dr. Alice H. Suter, “Noise and Its Effects,” Administrative Conference of the UnitedStates, Nov. 1991, found at http://www.nonoise.org/library.htm, retrieved Oct. 27, 2004 4 National Pollution Clearinghouse, Noise Effects on Wildlife, found athttp://www.nonoise.org/library/fctsheet/wildlife.htm, retrieved Sept. 13, 2004. 5 Aftandilian, Dave, “NoisePollution,” Conscious Choice, June 1999, found at http://www.consciouschoice.com/note/note1206.html, retrieved Sept. 13, 2004. 6 For example, government officials in Chile stated that the basic conditions for workplacenoise regulation were established in 1999. These regulations set noise emission requirementsfor most fixed sources and delineated measurement and testing methods. Governmentrepresentative, interview by USITC staff, Santiago, Chile, Dec. 14, 2004.
6-1
CHAPTER 6NOISE POLLUTION ABATEMENTSERVICES AND EQUIPMENT
IntroductionNoise pollution is generally considered to be human-created noise harmful to health orwelfare.1 In addition to hearing loss, noise negatively affects human health by causingstress, high blood pressure, and sleep loss. Noise also affects a person’s quality of life.2Noise pollution has many sources, most of which are associated with urbandevelopment: road, air and rail transport; industry; and recreation.3 In recent years, theimpact of noise on wildlife also has increasingly become a concern.4 Increasedknowledge of the health effects of noise and increased community awareness ofenvironmental noise have created a higher expectation for governments at all levels toreduce noise levels.5
Noise pollution produced by a modern society includes the sounds of landing anddeparting aircraft, the sounds of the millions of cars and trucks traveling along roadways,the sounds of railways and urban subway systems, the constant drone of industrialmachinery, the whines and impacts of construction activities, the steady or intermittentsounds of household appliances, and general annoyances such as loud music and barkingdogs. In the developed world, most reported noise problems are associated with workenvironments and traffic, while the developing world commonly identifies traffic noiseand other community noise as the most significant source of noise pollution. In response,many countries regulate occupational noise in the workplace to protect workers, andmany countries regulate community noise from industrial plants, road and rail traffic,and construction that impact commercial and residential neighborhoods.6 Noiseregulations are generally promulgated, often in conjunction with health departments or

7 World Health Organization, Occupational and community noise, Fact sheet No. 258, Feb.2001, p. 2. 8 Aftandilian, Dave, “NoisePollution,” Conscious Choice, June 1999, found at http://www.consciouschoice.com/note/note1206.html, retrieved Sept. 13, 2004. 9 Government representative, interview by USITC staff, Santiago, Chile, Dec. 14, 2004. 10 Industry representative, interview by USITC staff, Santiago, Chile, Dec. 15, 2004. 11 For example, rotary air compressors have displaced reciprocating piston compressors atmost construction and mining locations. 12 For example, modern jet engines have air entraining baffles which reduce the velocity ofthe exiting gas and effectively increase the orifice size, partly for noise reduction purposes. 13 Other alternatives to noise pollution abatement are to shut down the noise producingactivity or to move the activity to another location. 14 Federico Miyara, Guidelines for an Urban Noise Ordinance, found athttp://www.hfpacoustical.com, retrieved Oct. 15, 2004.
6-2
ministries, by the government entities responsible for the related activity such as traffic,labor and industry, and construction. However, fewer countries regulate neighborhood-generated community noise.7
The intensity of the sound, its duration, and the time and place at which it is heard arefactors to be considered in assessing noise pollution.8 Many countries reportedly followstandards such as those prescribed by the World Health Organization and measurementmethods prescribed by the International Standards Organization. Many countries’standards are similar to those established in larger, developed economies such as theUnited States or the European Union, which developed their noise regulations andprocedures earlier than most world economies. However, even where regulations andstandards are present, noise pollution abatement is often a lower priority and demandsa smaller share of attention and national environmental protection expenditures thanother more pressing problems such as water supply, wastewater management, solidwaste management, and air pollution control.9 In some countries, monitoring andenforcement of regulations is reportedly not systematic, and noise pollution abatementis stimulated primarily by citizen complaints.10
Technologies and MethodsThe principal method for reducing noise pollution is the redesign of products andprocesses. Categories of effective redesign include the substitution of rotary motion forreciprocating action,11 better dynamic balancing of rotating equipment to reducevibration and associated noise, and elimination of high-speed gas jets which producenoisy turbulence.12 Alternatives to product redesign include: confinement within anenclosure or barrier to prevent ‘environmental’ noise propagation, sound absorptionthrough the use of specialized materials, and personal protective gear such as ear plugsand ear muffs.13 The methods chosen to abate noise pollution typically depend on thesource of a particular noise.
Traffic noise is reportedly the most common source of noise pollution. Traffic noise isaffected by factors such as speed, weather, road conditions, terrain and landscaping, aswell as the location and design of structures.14 For example, government officials inCosta Rica and Brazil noted that the lack of insulation in many structures owing tominimal need for heating and limited use of cooling equipment contributes significantly
15 Government representatives, interview by USITC staff, San Jose, Costa Rica, Dec. 6,2004, and Sao Paulo, Brazil, Dec. 17, 2004. 16 Federico Miyara, Guidelines for an Urban Noise Ordinance, found athttp://www.hfpacoustical.com, retrieved Oct. 15, 2004. 17 Government representative, interview by USITC staff, Tokyo, Japan, Nov. 8, 2004. 18 Government representatives, interviews by USITC staff, San Jose, Costa Rica, Dec. 6,2004, Santiago, Chile, Dec. 15, 2004, and Sao Paulo, Brazil, Dec. 17, 2004. 19 Industry representative, interview by USITC staff, Santiago, Chile, Dec. 14, 2004. 20 The term dBA is an expression of the relative loudness of sounds in air as perceived bythe human ear. The use of an A filter reduces unfiltered decibel values of low frequencysounds because the human ear is less sensitive to low frequencies than to high frequencies.Decibels are measured in logarithmic terms to give a manageable set of numbers to cover therange of the human ear. 21 The Sustainable Mobility Project, Mobility 2030: Meeting the challenges tosustainability, World Business Council for Sustainable Development, 2004, p. 126. 22 The Sustainable Mobility Project, Mobility 2030: Meeting the challenges tosustainability, World Business Council for Sustainable Development, 2004, p. 126.
6-3
to noise pollution problems in many urban areas.15 Approaches used to address roadwayand urban traffic noise include limiting the speed and number of vehicles, buildingsmooth and resilient road surfaces which minimize construction breaks, grading andaligning roadways to direct noise away from housing, and constructing noise barriersbetween highways and adjoining neighborhoods.16 Some countries regulate onecomponent of traffic noise– vehicle engine noise– as part of annual or semi-annualvehicle safety inspections. For example, Japan requires that cars pass three noise levelchecks: steady engine speed, acceleration, and exhaust noise.17 Government officials inseveral countries noted that traffic noise, while the most significant noise problemreported, is addressed but not well regulated, and that many countries lack monitoringstations, cannot afford expensive sound barriers along roadways, and have fewmechanisms to address such noise problems other than technical standards for vehicles.18
One industry official noted that absence of strict zoning standards exacerbated theproblem in many countries as noise producing industrial and commercial activities areoften located in or near residential neighborhoods.19
New porous asphalt surfaces, which can reportedly reduce traffic noise by 3-5 dBA20 ascompared with dense asphalt surfaces, are used in several countries. The use of suchsurfaces has become mandatory in Japan, and more than 1,000 km of roads are alreadysurfaced with such materials. A porous elastic road surface (PERS), composed ofgranulated rubber recovered from discarded auto tires with a urethane binder, couldreduce road noise by up to 10 dBA. Through the use of PERS, the share of Japaneseurban highways that meet noise limits, 13 percent in 1998, could rise to 90 percent in thenear future.21 In addition, Japan constructed more than 1,800km of acoustical noisebarriers through 1998. However, noise barriers are costly; the average cost of barriersconstructed in the United States through 1998 was almost $700,000 per kilometer.22

23 Sources of Noise Pollution, found athttp://www.macalester.edu/~psych/whathap/UBNRP/Audition/site/noisesourcestraffic.html,retrieved Sept. 15, 2004. 24 Bugliarello et al. (1976) 25 For example, government officials in Brazil noted that restrictions on airport operationswere in effect at urban airports in both Sao Paulo and Rio de Janeiro, interview by USITCstaff, Sao Paulo, Brazil, Dec. 17, 2004. 26 National Aeronautics and Space Agency, Airport Noise and the Aviation Industry, foundat http://www.aero-space.nasa.gov/library/event_archives/encompat/workshop4/Schiphol.htm,retrieved Oct. 21, 2004. 27 Such an approach was reportedly utilized in Sao Paulo, Brazil. Governmentrepresentative, interview by USITC staff, Sao Paulo, Brazil, Dec. 17, 2004. 28 Industry representative, telephone interview by USITC staff, Sept. 27, 2004. 29 HFP Acoustical Consultants, found at http://www.hfpacoustical.com, retrieved Oct. 15,2004. 30 Sources of Noise Pollution, found athttp://www.macalester.edu/~psych/whathap/UBNRP/Audition/site/noisesourcestraffic.html,retrieved Sept. 15, 2004. 31 HFP Acoustical Consultants, found at http://www.hfpacoustical.com, retrieved Oct. 15,2004. 32 Bugliarello et al. (1976) 33 HFP Acoustical Consultants, found at http://www.hfpacoustical.com, retrieved Oct. 15,2004.
6-4
Aircraft noise affects both passengers and communities located near airports.23 Threemethods are commonly used to reduce the noise impacts of aircraft: implementing noisemanagement plans, mitigating noise at the receiver by using sound insulation, andreducing noise, such as using quieter aircraft.24 Approaches for aircraft noise abatementinclude curfews or time constraints, slot rules, preferential runway usage, specified flighttracks and landing/take-off patterns,25 restrictions on what type of aircraft can use anairport, construction of noise barriers, and use of personal protective gear particularlyby airport workers. In the absence of quieter aircraft or increased restriction of airportoperations, the demand for sound insulation to directly protect nearby residents from thenoise is likely to increase.26 For example, following the preparation of a noise profilearound an airport, an airport authority may make grants available for home owners tocontract for the installation of sound barriers.27 Such methods may reduce noisecomplaints and may be less expensive than trying to reduce aircraft noise at the source.28
Sound barriers for households and businesses may be subsidized or financed by airportoperators or local governments.29
Although railroad noise, including that of subways, is confined to areas near tracks, itis still an important source of noise pollution, particularly in urban areas.30 Abatementtechnologies for noise caused by railways include: tight standards on track alignmentand gauge; wide radii on curves; sound-proofing insulation between cars and frames;and sound dampening materials in tunnels and stations.31
Industrial activities such as product fabrication, product assembly, power generation, andprocessing generate noise. Although people living or working near an industrial facilitymay be affected by industrial noise, the abatement of industrial noise is usually requiredor undertaken to protect the workers within the plant.32 Major industrial noise pollutionsituations also include: basic machinery noise; pipeline pumps and compressors;petrochemical plants, gas plants and refineries; power plants of all kinds (flare and steamventing noise); and, drilling and production at offshore oil and gas platforms.33

34 HFP Acoustical Consultants, found at http://www.hfpacoustical.com, retrieved Oct. 15,2004. 35 Sources of Noise Pollution, found athttp://www.macalester.edu/~psych/whathap/UBNRP/Audition/site/noisesourcestraffic.html,retrieved Sept. 15, 2004. 36 Industry representative, interview by USITC staff, Santiago, Chile, Dec. 15, 2004. 37 Sources of Noise Pollution, found athttp://www.macalester.edu/~psych/whathap/UBNRP/Audition/site/noisesourcestraffic.html,retrieved Sept. 15, 2004.
6-5
Following analyses of noise problems at industrial facilities, abatement methods oftenrecommended and implemented include: industrial mufflers and silencers; equipmentenclosures; and redesign or engineering of industrial process or ancillary equipment.34
Redesign is usually performed by the equipment manufacturer’s engineering staff ratherthan the engineering staff of a contract services firm.
Construction, like manufacturing, is a major source of noise pollution, but unlikeindustrial equipment, which emits noise that primarily affects workers within a facility,construction equipment tends to be used outdoors, and thus affects many other peoplebesides the workers at the site.35 Most countries address noise pollution fromconstruction projects through the redesign of construction equipment and limits on theoperating hours for construction projects or specific types of equipment.36
Consumer products represent a wide range of noise-producing items often grouped inthe following categories: household (e.g., vacuum cleaners), recreational (e.g.,snowmobiles), yard or workshop (e.g., chain saws, lawn mowers, and power saws), andmusic (e.g., personal and home stereos). Most countries limit noise pollution fromconsumer products through the use of product standards and building codes.37
Market Size and CharacteristicsServices related to noise pollution abatement are generally classified as consulting,construction, and engineering services. Examples of specific activities include: soundand vibration testing; noise profiles, assessments, evaluations, and monitoring; modelingof noise from vehicles, aircraft, and stationary sources; planning and design of noisebarriers and enclosures; and technical support for litigation, environmental impactassessments, or public policy. These activities may be associated with the abatement ofnoise from any of the sources noted above.
The global market for services related to noise abatement, as distinguished from theprovision of sound absorbing materials and the redesign of products and processes to beless noise producing, is believed to be extremely small economically as it is essentiallyconfined to various testing, measuring, and modeling activities that might be done byoutside contractors or consultants. Since the vast majority of the services associated withnoise abatement is comprised of inspections, monitoring, engineering, construction, andinstallation services that are often provided as part of large construction or infrastructureprojects, it is difficult to determine how much of those services associated with theconstruction of new facilities or the renovation of existing facilities can be attributed tonoise pollution abatement. No data or estimates were uncovered during the course of theinvestigation that would provide even an approximate size of the global or country
38 Government representative, interview by USITC staff, Tokyo, Japan, Nov. 4, 2004. 39 HFP Acoustical Consultants, found at http://www.hfpacoustical.com, retrieved Oct. 15,2004. 40 Industry representative, interview by USITC staff, Santiago, Chile, Dec. 15, 2004. 41 Industry representative, telephone interview by USITC staff, Sept. 27, 2004. 42 University representative, interview by USITC staff, Santiago, Chile, Dec. 15, 2004.
6-6
markets for the subject services. Given the lack of information on these services, it isdifficult to characterize either the demand or supply for noise pollution abatementservices. However, anecdotal evidence suggests that the market for noise monitoring andtesting may be significant in larger economies with more mature industries andsubstantial enforcement of workplace noise regulations.38
Key Suppliers and ConsumersThe suppliers or providers of noise pollution abatement activities, other than equipmentengineering or installation, are almost entirely specialized engineering and consultingfirms. Most of these firms are quite small– less than 100 employees, frequently less than10 employees.39 However, some larger engineering firms reportedly provide suchservices, particularly to established clients, with a large percentage of these servicesreportedly purchased by large multinational companies.40 One industry representativeindicated that his firm seldom accepted noise abatement consulting services assignmentsexcept as a favor to existing customers because they required too much time and effortfor the compensation received and the sales effort involved.41 Additionally, publiclaboratories and public agencies, in addition to providing enforcement of regulations andstandards, supply noise monitoring and testing, research on noise abatement methodsand technologies, as well as education and training.42
Consumers of noise abatement services are private firms or public entities (e.g., publicairport authorities) responsible for the operation of those facilities that are sources ofenvironmental noise pollution. In many cases, consumers will go directly to barrier orsound dampening material suppliers rather than engaging a consultant to study theproblem and recommend a solution, as such equipment suppliers typically provideadvice, at no additional charge, to prospective customers regarding which of theirproducts would be most suitable for a particular application. In other cases, the consumermay pressure equipment suppliers by adopting a particular noise limit specification toencourage redesign.
Related EquipmentOther than certain equipment on the OECD’s environmental goods list, such as vehiclemufflers, the equipment associated with noise abatement appears to be primarilymeasuring and testing equipment, computer hardware and software, and sounddampening panels. This is consistent with the notion that most actual noise abatementinvolves either the construction of noise barriers or the diminution of noise at its source,and that much of the latter involves incorporating noise limits as part of the productstandards for vehicles and other transportation equipment, construction and processequipment, and consumer goods.

43 Industry representative, telephone interview by USITC staff, Sept. 27, 2004. 44 Ibid. 45 Noise pollution control equipment HS numbers 840991, 840999, and 870892 were notedin “Environmental Goods and Services: An Assessment of the Environmental, Economic andDevelopment Benefits of Further Global Trade Liberalisation,” Joint Working Party on Tradeand Environment (COM/TD/ENV(2000)86/FINAL), Oct. 5, 2000 and can be found athttp://www.oecd.org/searchResult/0,2665,en_2649_201185_1_1_1_1_1,00.html. 46 Import and export data for selected countries as reported by the United Nations for HS840991, 840999, and 870892. Data was retrieved from the WITS database on Dec. 17, 2004. 47 Mufflers and exhaust pipes are classified in HS 870892 and those products cannot bedifferentiated, even in the U.S. Harmonized Tariff Schedule.
6-7
Trade and InvestmentData specific to trade and investment in noise pollution abatement services were notavailable. According to industry officials, trade and investment in services directlyrelated to noise abatement is very small and often included in the cost of constructionmaterials, equipment, or in the design, engineering, and construction of facilities. Thus,in the absence of data, it is difficult to estimate or analyze the extent, direction, orcharacter of trade and investment in this sector. In several of the economies studied,local government and industry officials also indicated that domestic engineering andlaboratory firms provide much of the monitoring and testing work in this sector, thatnoise-related testing equipment is often imported, and that other noise-related goods,such as acoustic panels, are often produced locally. One industry representative indicatedthat cross-border consulting activities are generally unremunerative as the cost ofinternational sales calls to sell such services were prohibitively expensive, and often thecontract, if any, usually went to a local firm.43 For example, the same industryrepresentative reports that Canadian firms typically source sound absorbing materialsfrom domestic suppliers.44
In the absence of an internationally established list of environmental goods andequipment, OECD identified three Harmonized System 6-digit level categories ascontaining noise abatement equipment.45 OECD then used the applied and bound tariffsfor products in these HS 6-digit categories to compare tariff levels across countries inits work on trade liberalization of environmental goods and services. Although OECDdid not use these categories to estimate trade in environmental equipment, one may getan indication of the extent of trade in noise pollution abatement equipment from the totalgoods traded in these HS categories. The three 6-digit categories identified by OECDinclude certain engine parts, vehicle mufflers, and vehicle exhaust pipes. In 2003, U.S.exports and imports of these goods totaled $4.2 billion and $5.5 billion, respectively.Global exports in these products amounted to more than $42.8 billion in 2003.46 Thesefigures include products not associated with noise pollution abatement and thusconsiderably overstate trade in noise abatement equipment. Since HS 870892 includesvehicle mufflers, trade in that category alone may be a better guide. In 2003, U.S.exports and imports of mufflers and exhaust pipes47 totaled $369 and $489 million,respectively. Global exports of mufflers and exhaust pipes amounted to slightly morethan $3.2 billion. These figures still overstate trade in noise abatement equipment, andthe trade in these products follows trade in other automobile parts and is thus notnecessarily a good indicator of trade in equipment used to abate noise from sources otherthan vehicle engines. Noise testing equipment, acoustic panels, and noise and vibration

6-8
dampening materials and equipment are not separately identified in the trade statisticsat that level of aggregation, and thus trade statistics are not available for these products.
As expected, the applied and bound tariffs on vehicle mufflers and exhaust pipes in HS870892 are the lowest (less than 4 percent in 2001) in the those countries with largeautomobile industries (United States, Japan, Canada, and the European Union). In theother countries examined in this study, the applied rates in 2001 ranged from 5 to 35percent, the bound rates exceeded 13 percent, or rates were simply unbound.

7-1
CHAPTER 7SUMMARY OF FINDINGS
The analysis presented in this report indicates that demand for air and noise pollutionabatement services and equipment is driven largely by government regulation andenforcement efforts, and to a lesser extent, by international treaty obligations, publicsentiment, and private-sector financial resources. Regulatory regimes in developingcountries are often less stringent than those in high-income countries, due to developingcountries’ relatively recent experience with such regulations. Similarly, the enforcementof air pollution control regulations tends to be more stringent in developed countriesthan in developing countries. Available evidence indicates that as incomes grow,regulatory stringency increases, which may increase demand for air pollution abatementgoods and services. Participation in regional and multinational environmentalagreements such as the Kyoto Protocol to the United Nations Framework Conventionon Climate Change may spur future demand for air pollution abatement services.Moreover, disclosure of information on pollution levels has been found to motivatepublic demand for environmental compliance by polluters.
Air pollution abatement services and equipment are frequently supplied as part of asingle transaction, with equipment accounting for the majority of the value of the sale.In addition, a substantial portion of air pollution abatement services are classified outsidethe air pollution abatement sector, in industries such as engineering and consulting.Global providers of air pollution abatement goods and services include a handful of largefirms that provide a wide range of goods and services in numerous markets worldwide,and a large number of small firms that provide a narrow range of goods and services.Principal consumers of air pollution abatement goods and services include power plants,manufacturing facilities, waste incineration facilities, and the mining and agriculturalindustries.
The United States is estimated to be the world’s largest consumer of air pollutionabatement goods and services, followed by the European Union, China, and Japan. TheUnited States is also estimated to be the world’s top exporter of air pollution abatementservices, while the European Union is likely the top exporter of air pollution abatementgoods. There are few trade barriers that directly affect trade in air pollution abatementservices, although some measures, largely non-tariff barriers, affect trade in relatedgoods and equipment.
Services provided in connection with emissions trading, a market-based approach to airpollution abatement, are typically provided by brokerage and market research firms.Experience gained with the long-standing and highly successful U.S. Acid Rain Programhas made it the model for more recently established emissions trading programs, mostof which are in the early stages of development. Due to the relative infancy of manyemissions trading programs, the net affect of these schemes in their respective marketsfor air pollution abatement equipment and services is difficult to determine. TheEuropean Union Emissions Trading Scheme (EU-ETS), which was officially launchedin January 2005, is the most prominent, active, and ambitious program designed tomitigate greenhouse gas emissions in accordance with the Kyoto Protocol. Thedevelopment of an international emissions trading market likely will be accomplished

7-2
by linking smaller, emerging schemes, such as those planned by Canada, Japan, andNorway, to the EU-ETS.
Little is known regarding the market for noise pollution abatement services. However,this market is likely very small, as such pollution is often addressed through productstandards and zoning restrictions. As with the abatement of air pollution, many activitiesperformed to abate noise pollution are classified outside of the noise pollution abatementsector, in industries such as engineering and consulting. Likewise, trade in noisepollution abatement services is likely very small, as the cross-border provision of someof these services is reportedly unremunerative.

APPENDIX AREQUEST LETTER

A-2

EXECUTIVE O F F I C E O F T H E P R E S I D E N T O F F I C E O F T H E . U N I T E D S T A T E S T R A D E R E P R E S E N T A T I V E
W A S H I N G T O N , D . C . 20508
The Honorable Stephen Koplan Chairman U.S. International Trade Commission 500 E Street, SW Washington DC, 20436
As you know, members of the World Trade Organization (WTO) have been engaged in negotiations under the General Agreement on Trade in Services (GATS) since January 2000. Negotiations on services are also underway as part of an effort to establish bilateral and regional free trade agreements between the United States and a number of its trading partners. These bilateral, regional, and multilateral negotiations are intended to liberalize services trade by reducing or eliminating measures that limit effective market access.
With these negotiations in mind, two concise reports on discrete segments of the environmental and energy services industries would be of interest to my office. Further information about such services markets will also be useful in carrying out environmental reviews of current and future WTO agreements and bilateral free trade agreements. Certain environmental and energy services- such as, inter alia, air and noise pollution abatement services and renewable energy services- are of significant importance to the global economy in terms of both market size and the role of such industries in achieving sustainable development. Government efforts to address environmental degradation and industry efforts to increase efficiency and
maintain favorable environmental records have increased demand for environmental and energy services. Trade in such services ensures that all economies have access to reliable environmental technologies, and thus facilitates global environmental protection.
Therefore, I request, pursuant to authority delegated by the President under section 332(g) of the Tariff Act of 1930, that the U.S. International Trade Commission conduct two investigations and prepare reports. The first of these reports should cover air and noise pollution abatement services, and the second should cover renewable energy services. Each of these reports should, to the extent possible, (1) provide an overview of foreign and domestic markets for the subject services; (2) examine trade and investment in the subject services markets, including barriers affecting such trade and investment, if any; and (3) if possible, discuss existing regulatory practices that generate demand for the subject services. With regard to the geographic coverage of these reports, the Commission should endeavor to include examples from both developed- and developing-country markets. In addition, the Commission is encouraged to include examples- as appropriate- from those economies with which the United States has established, or is in the process of negotiating, a free trade arrangement. To the extent possible, these reports should also present information on trade and market conditions for those goods related to the subject environmental and energy services. The Commission is encouraged to include information gathered through public hearings and other consultations with interested parties.
The Commission is requested to deliver a report on the air and noise pollution abatement services industry no later than April 1 , 2005. For the purpose of this report, I urge the Commission to define air and noise pollution abatement services to include control services of indoor or outdoor air pollution originating from stationary or mobile sources; services related to the trade of air pollution emission rights; services related to the monitoring, assessment, or control of acid rain; services related to the study of the relationship between
A-3
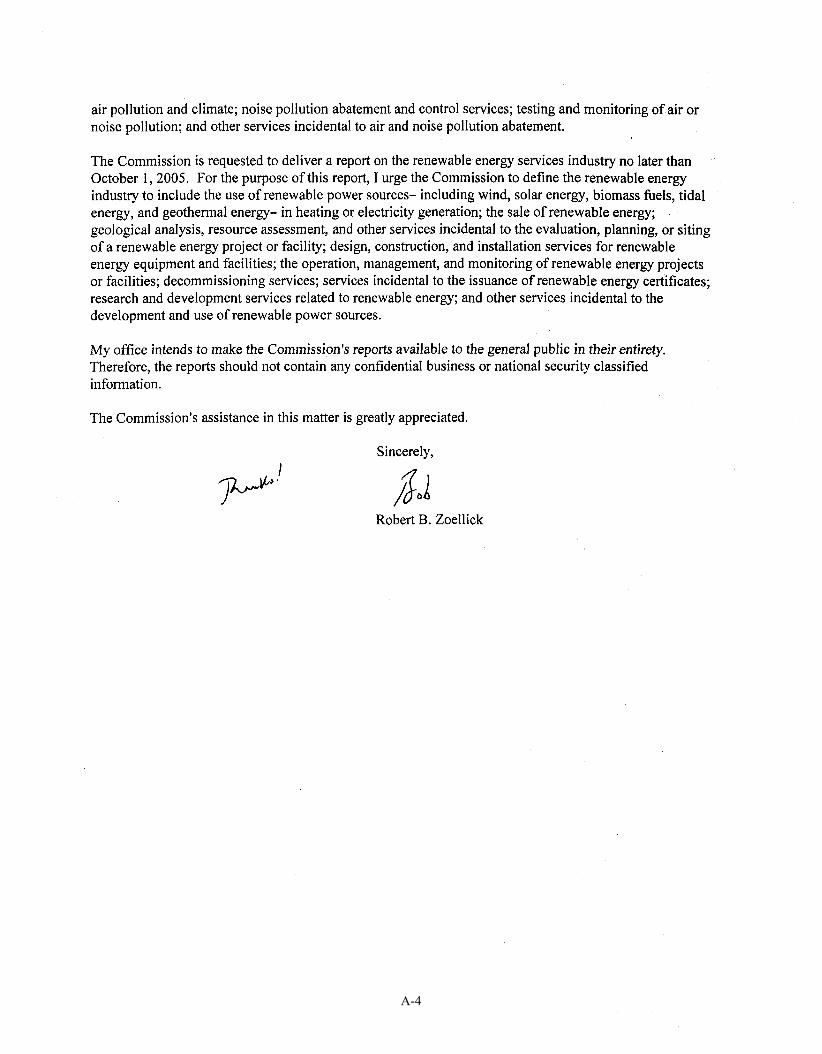
air pollution and climate; noise pollution abatement and control services; testing and monitoring of air or noise pollution; and other services incidental to air and noise pollution abatement.
The Commission is requested to deliver a report on the renewable energy services industry no later than October 1 , 2005. For the purpose of this report, I urge the Commission to define the renewable energy industry to include the use of renewable power sources- including wind, solar energy, biomass fuels, tidal energy, and geothermal energy- in heating or electricity generation; the sale of renewable energy; geological analysis, resource assessment, and other services incidental to the evaluation, planning, or siting of a renewable energy project or facility; design, construction, and installation services for renewable energy equipment and facilities; the operation, management, and monitoring of renewable energy projects or facilities; decommissioning services; services incidental to the issuance of renewable energy certificates; research and development services related to renewable energy; and other services incidental to the development and use of renewable power sources.
My office intends to make the Commission's reports available to the general public in their entirety. Therefore, the reports should not contain any confidential business or national security classified information.
The Commission's assistance in this matter is greatly appreciated.
Sincerely,
Robert B. Zoellick
A-4

APPENDIX BFEDERAL REGISTER NOTICE

B-2
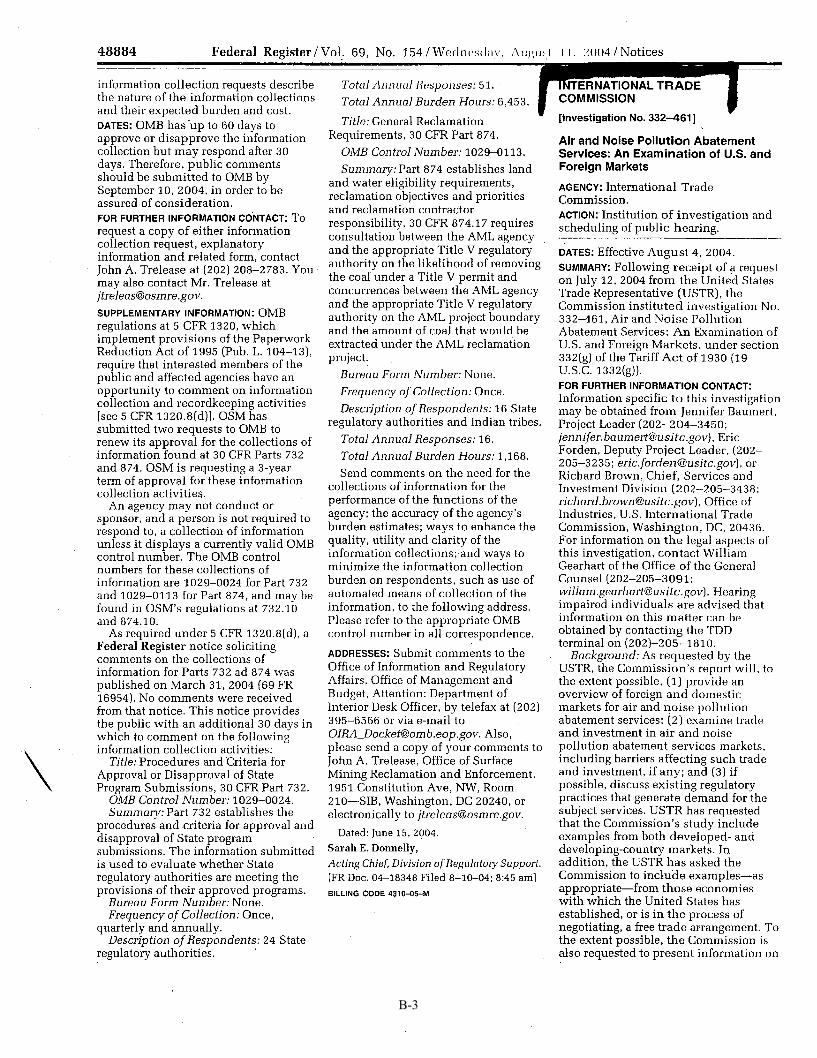
48884 Federal Renister/Vol. 69, No. 154/Wr1dnc.~cl,i\1. IIII : II<I I I , 2004/Notices
\
information collection requests describe the nature of the information collections and their expected burden and cost. DATES: OMB has.up to 60 days to approve or disapprove the information collection but may respond after 30 days. Therefore, public comments shouid be submitted to OMB by September 10, 2004. in order to be assured of consideration. FOR FURTHER INFORMATION CONTACT: TO request a copy of either information collection request, explanatory information and related form, contact John A. Trelease at (202) 208-2783. You may also contact Mr. Trelease at [email protected]. SUPPLEMENTARY INFORMATION: OMB regulations at 5 CFR 1320, which implement provisions of the Paperwork Reduction Act of 1995 (Pub. L. 104-13), require that interested members of the public and affected agencies have an opportunity to comment on information collection and recordkeeping activities [see 5 CFR 1320.8(d)]. OSM has submitted two requests to OMB to renew its approval for the collections of information found at 30 CFR Parts 732 and 874. OSM is requesting a 3-year term of approval for these information collection activities.
sponsor, and a person is not required to respond to, a collection of information unless it displays a currently valid OMB control number. The OMB control numbers for these collections of information are 1029-0024 for Part 732 and 1029-0113 for Part 874, and may be found in OSM’s regulations at 732.10
An agency may not conduct or
and 874.10. As reauired under 5 CFR 1320.81dl. a
. I
Federal Register notice soliciting comments on the collections of information for Parts 732 ad 874 was published on March 31, 2004 (69 FR 16954). No comments were received from that notice. This notice provides the public with an additional 30 days in which to comment on the following information collection activities:
Approval or Disapproval of State Program Submissions, 30 CFR Part 732.
OMB Control Number: 1029-0024. Summary: Part 732 establishes the
procedures and criteria for approval and disapproval of State program submissions. The information submitted is used to evaluate whether State regulatory authorities are meeting the provisions of their approved programs.
Title: Procedures and ‘Criteria for
Bureau Form Number: None. Frequency of Collection: Once,
Description of Respondents: 24 State quarterly and annually.
regulatory authorities.
Total Annual Burden Hours: 6,453. I COMMISSION Title: General Reclamation
Requirements, 30 CFR Part 874. OMB Control Number: 1029-0113. Summary: Part 874 establishes land
v
and water eligibility requirements, reclamation objectives and priorities and reclamation contractor responsibility. 30 CFR 874.1 7 requires consultation between the AML agency and the appropriate Title V regulatory authority on the likelihood of removing the coal under a Title V permit and concurrences between the AML agency and the appropriate Title V regulatory authority on the AML project boundary and the amount of coal that would be extracted under the AML reclamation project.
Bureau Form Number: None. Frequency of Collection: Once. Description of Respondents: 16 State
regulatory authorities and Indian tribes. Total Annual Responses: 16. Total Annual Burden Hours: 1,168. Send comments on the need for the
collections of information for the performance of the functions of the agency; the accuracy of the agency’s burden estimates; ways to enhance the quality, utility and clarity of the information collections; and ways to minimize the information collection burden on respondents, such as use of automated means of collection of the information, to the following address. Please refer to the appropriate OMB control number in all correspondence. ADDRESSES: Submit comments to the Office of Information and Regulatory Affairs. Office of Management and Budget, Attention: Department of Interior Desk Officer, by telefax at (202) 395-6566 or via e-mail to OIR&Docket@omb. eop .gov. Also, please send a copy of your comments to John A. Trelease, Office of Surface Mining Reclamation and Enforcement, 1951 Constitution Ave, NW, Room ZlO-SIB, Washington, DC 20240, or electronically to [email protected].
Sarah E. Donnelly, Acting Cbief, Division of Regulntory Support. [FR Doc. 04-18348 Filed 8-10-04; 8:45 am]
Dated: June 15, 2004.
BILLING CODE 4310-05-M
[Investigation No. 3324611 - Air and Noise Pollution Abatement Services: An Examination of U.S. and Foreign Markets AGENCY: International Trade Commission. ACTl0N:~Institution of investigation and scheduling of public hearing.
DATES: Effective August 4, 2004. SUMMARY: Following receipt of a request on July 1 2 , 2004 from the United States Trade Representative (USTR), the Commission instituted investigation No. 332-461, Air and Noise Pollution Abatement Services: A n Examination of U.S. and Foreign Markets, under section 332(g) of the Tariff Ac t of 1930 (19 U.S.C. 1332(g)). FOR FURTHER INFORMATION CONTACT: Information specific t o this investigation may be obtained from Jennifer Baumert, Project Leader (202-204-3450; jennifer.baurnertOusitc.gov), Eric Forden, Deputy Project Leader, (202- 205-3 235 ; eric. forde~~@,usitc.,yov), or Kichard Brown, Chief, Services and Investment Division (202-205-3438; richor~.broM.n~usitc.gov). Officc? of Industries, U.S. International Trade Commission, Washington, DC, 20436. For information on the legal aspects of this investigation, contact William Gearhart of the Office of the General Counsel (202-205-3091; willam.gsnrhaiZ~usitc.gov). Hearing impaired individuals are advised that information on this matter can hc obtained by contacting the ‘TDD terminal on (202)-205-1810.
USTR, the Commission’s report will, to the extent possible, (1) provide an overview of foreign and domestic markets for air and noise pollution abatement services; ( 2 ) examine trade and investment in air and noise pollution abatement services markets, including barriers affecting such trade and investment, if any; and (3) if possible, discuss existing regulatory practices that generate demand for t he subject services. USTR has requested that the Commission’s study include examples from both developed- and developing-country markets. In addition, the USTR has asked the Commission to include examples-as appropriate-from those economies with which the United States has established, or is in the process of negotiating, a free trade arrangement. To the extent possible, the Commission is also requested to present information on
Background: As requestcd by the
B-3
ro
on
Federal Register I Vol. 69, No. 154 I Wednesday, August 11, 2004 I Notices 48885
trade and market conditions for those goods related to the subject environmental services. For the purpose of this study, air and noise pollution abatement services are defined to include control services of indoor or outdoor air pollution originating from stationary or mobile sources; services related to the trade of air pollution emission rights; services related to the monitoring, assessment, or control of acid rain; services related to the study of the relationship between air pollution and climate; noise pollution abatement and control services; testing and monitoring of air or noise pollution; and other services incidental to air and noise pollution abatement.
The USTR asked that the Commission furnish its report by April 1 , 2005, and that the Commission make the report available to the public in its entirety.
The USTR letter also requests an investigation on renewable energy services. In response, the Commission has instituted Investigation No. 332- 462, Renewable Energy Services: An Examination of U.S. and Foreign Markets, which is due to the USTR on October 1, 2005.
Public Hearine: A Dublic hearing in “ I -
connection with the investigation will be held at the U.S. International Trade Commission Building, 500 E Street SW., Washington, DC, beginning at 9:30 a.m. on October 20, 2004. All persons shall have the right to appear, by counsel or in person, to present information and to be heard. Requests to appear at the public hearing should be filed with the Secretary, United States International Trade Commission, 500 E Street SW., Washington, DC 20436, no later than 5:15 p.m., October 5, 2004. Any prehearing briefs (original and 14 copies) should be filed not later than 5:15 p.m., October 7, 2004; the deadline for filing post-hearing briefs or statements is 5:15 p.m., November 4, ’ 2004. In the event that, as of the close of business on October 5 , 2004, no witnesses are scheduled to appear at the hearing, the hearing will be canceled. Any persons intezested in attending the hearing as an observer or non- participant may call the Secretary of the Commission (202-205-1806) after October 5, 2004, for information concerning whether the hearing will be
confideRtia1 must be submitted on separate sheets of paper, each clearly marked “Confidential Business 1nformation”’at the top. All submissions requesting confidential treatment must conform with the requirements of section S 201.6 of the Commission’s Rules of Practice and Procedure (19 CFR 201.6). All written submissions, except for confidential business information, will be made available in the Office of the Secretary to the Commissim for inspection by interested parties. The Commission will not include any confidential business information in the report it sends to the USTR. To be assured of consideration by the Commission, written statements relating to the Commission’s report should be submitted to the Commission at the earliest practical date and should be received no later than the close of business on November 4, 2004. All submissions should be addressed to the Secretary, United States International Trade Commission, 500 E Street SW., Washington, DC 20436. The Commission’s rules do not authorize filing submissions with the Secretary by facsimile or electronic means, except to the extent permitted by section 201.8 of the Commission’s Rules of Practice and Procedure (19 CFR 201.8) (see Handbook for Electronic Filing Procedures, ftp://ftp. usitc.gov/pub/ reports/electronicfilinghandbook.pdfl. Persons with questions regarding electronic filing should contact the Secretary (202-205-2000 edis8usitc.gov).
who will need special assistance in gaining access to the Commission should contact the Office of the Secretary at 202-205-2000. General information concerning the Commission may also be obtained by accessing its Internet server (http://www. usitc.gov).
List o f Subjects
WTO, GATS, air and noise pollution abatement services. -
Issued: August 5, 2004. By order of the Commission.
Persons with mobility impairments
Marilyn R. Abbott,
INTERNATIONAL T ~ A D E CORllMlSSlON [Investigation No. 332-4621
Renewable Energy Services: An Examination of U.S. and Foreign Markets AGENCY: International Trade Commission. ACTION: Institution of investigation and scheduling of public hearing.
DATES: Effective August 3 , 2004. SUMMARY: Following receipt of a request on July 12, 2004 from the United States Trade Representative (USTR), the Commission instituted investigation No. 3 3 2 4 6 2 , Renewable Energy Services: An Examination of U.S. a n d Foreign Markets, under section 332(g) of the Tariff Act of 1930 (19 U.S.C. 1332(g)). FOR FURTHER INFORMATION CONTACT: Information specific to this investigation may be obtained from Lisa Ferens, Project Leader (202-205-3486; [email protected]), Jennifer Baumert, Deputy Project Leader, (202-205-3450; [email protected]), or Richard Brown, Chief, Services and Investment Division (202-205-3438; [email protected]), Office of Industries, U.S. International Trade Commission, Washington, DC, 20436. For information on the legal aspects of this investigation, contact William Gearhart of the Office of the General Counsel (202-205-3091 ; [email protected]). Hearing impaired individuals are advised that information on this matter can be obtained by contacting the TDD terminal on (202) 205-1810.
USTR, the Commission’s report will, to the extent possible, (1) provide an overview of foreign and domestic markets for renewable energy services; (2) examine trade and investment in renewable energy services markets, including barriers affecting such trade and investment, if any; and (3) if possible, discuss existing regulatory practices that generate demand for the subject services. USTR has requested that the Commission’s study include examples from both developed- and developing-country markets. In . addition, the USTR has asked the
Background: As requested by the
- - Secretary to the Commission. [FR Doc. 04-18315 Filed 8-10-04; 8:45 BKL,NG COOE 7820-02-p
Written Submissions: In lieu of or in addition to participating in the hearing,
held.
interested parties are invited to submit written statements (original and 14 copies) concerning the matters to be addressed by the Commission in its report on this investigation. Commercial or financial information that a submitter desires the Commission to treat as
Commission to include examples-as appropriate-from those economies with which the United States has established, or is in the process of negotiating, free trade arrangements. To the extent possible, the Commission is also requested to present information on trade and market conditions for those goods related to the subject renewable
U B-4

B-5


APPENDIX CCLEANING SERVICES OF EXHAUSTGASES AND NOISE ABATEMENTSERVICES IN THE GENERALAGREEMENT ON TRADE IN SERVICES(GATS)

C-2

1 Under a “positive-list” agreement, members are only bound by those commitments that theyspecifically list within their Schedules, which comprise part of the agreement. By contrast, a“negative-list” agreement binds member countries to all provisions covered by the agreement unlessotherwise specified. 2 World Trade Organization (WTO), “Services Sectoral Classification List,” MTN.GNS/W/120,July 10, 1991. 3 For the purposes of this analysis, the EC-12 is counted as one member as these countries submitteda single schedule. 4 This number includes members that have full or partial commitments. Also included are membersthat submitted commitments under a general environmental services heading (e.g., “EnvironmentalServices” or “Other Environmental Services” ) or that may only include a part of this sector. 5 Ibid.
C-3
Introduction
The General Agreement on Trade in Services (GATS) was signed in April of 1994 and enteredinto force in January of 1995. The GATS is the first multilateral, legally enforceable agreementcovering trade and investment in the service sector. Modeled after the agreement on goods, theGATS is a “positive-list” agreement1 which binds signatories to provide foreign firms with marketaccess and nondiscriminatory treatment, subject to defined exemptions. The primary purpose ofthe agreement is to reduce or eliminate measures that prevent services from being provided acrossborders or that discriminate against locally established service providers with foreign ownership.The agreement is organized in four parts: the main text containing general principles andobligations; annexes dealing with rules for specific sectors; individual countries’ specificcommitments; and lists indicating temporary exemptions from the most-favored nation principleof nondiscrimination.
Country-Specific Commitments
Country-specific commitments typically are organized based on the Services SectoralClassification List,2 which organizes services industries into twelve broad sectoral categories andprovides corresponding numbers from the United Nations Provisional Central ProductClassification (CPC). Under this classification scheme, the environmental services sector includesfour subsectors: sewage services (CPC 9401); refuse disposal services (CPC 9402); sanitation andsimilar services (CPC 9403); and other environmental services, which are generally presumed toinclude cleaning of exhaust gasses (CPC 9404), noise abatement services (CPC 9405), nature andlandscape protection services (CPC 9406) and other environmental services (CPC 9409).
Fifty-one WTO members3 have scheduled specific commitments in the environmental servicessector; 39 of these members have scheduled commitments on cleaning services of exhaust gases4
and 38 members have scheduled commitments on noise abatement services.5 Twenty membershave scheduled commitments granting full market access and national treatment to foreign servicesuppliers that provide cleaning services of exhaust gases and noise abatement services through

6 One of four possible modes of delivering services to foreign consumers, whereby the service istransported beyond the home country of the service supplier to the foreign consumer. Cross-bordersupply may entail transportation by mail, telecommunications, or the physical movement ofmerchandise embodying a service (e.g., a diskette storing information) from one country to another. The mode is “cross-border” when the service supplier is not present within the territory where theservice is delivered. 7 One of four possible modes of delivering services to foreign consumers, whereby the consumer, orthe consumer’s property, receives a service outside the territory of his/her home country, either bymoving or being situated abroad. 8 One of four possible modes of delivering services to foreign consumers, whereby a servicesupplier establishes any type of business or professional establishment in the foreign market. Commercial presence comprises entities such as corporations, trusts, joint ventures, partnerships, soleproprietorships, associations, representative offices, and branches 9 One of four possible modes of delivering services to foreign consumers, whereby an individual,acting alone or as an employee of a service supplier, provides a service by traveling to a foreignmarket.
C-4
cross-border supply (mode 1),6 consumption abroad (mode 2),7 and commercial presence (mode3)8 (table C-1 and C-2). Limitations listed by the remaining countries include, inter alia, licensingrestrictions, provisions requiring approval for the establishment of a commercial presence, aprovision requiring foreign firms to form a joint venture (listed in China’s schedule), and ameasure limiting foreign equity participation to 49 percent (listed in Thailand’s schedule). Severalmember countries have not scheduled bindings on cleaning services of exhaust gases or noiseabatement services provided through cross-border supply as they consider such transactionstechnically infeasible. Most measures regarding the supply of services through the presence ofnatural persons (mode 4)9 are addressed in each member country’s horizontal commitments.
With regard to scope, 26 members have scheduled commitments that cover the full range ofservices in the cleaning of exhaust gases sector and 25 members have scheduled commitments thatcover the full range of services in the noise abatement sector (tables C-1 and C-2). Thirteencountries—Bulgaria, China, Georgia, Korea, Lesotho, Liechtenstein, Norway, Panama, Poland,South Africa, Sweden, Switzerland, and the United States—have limited the range of activitiescovered under their commitments on cleaning services of exhaust gases and/or noise abatementservices. Bulgaria, Liechtenstein, Norway, Sweden, and Switzerland exclude activities providedunder government authority, whereas China, Georgia, Korea, Lesotho, Panama, Poland, SouthAfrica, and the United States limit the type activities covered by their commitments. For example,Liechtenstein, Sweden, and Switzerland’s commitments do not cover public works functions.Among these countries that limit the activities covered by their commitments, Korea excludesconstruction services, while China excludes environmental quality monitoring and pollutionsource inspection. Some countries chose to list a specific set of activities that are covered by theircommitments on cleaning services of exhaust gases and noise abatement services. For instance,Georgia, Lesotho, and South Africa indicate that their commitments on these services segmentscover only consultancy services.

10 Article XIX of the GATS requires WTO member economies to initiate a new round of servicesnegotiations no later than five years after the entry into force of the WTO agreement. 11 World Trade Organization (WTO), Ministerial Declaration: Adopted on 14 November 2001,WT/MIN(01)/DEC/1, Nov. 20, 2001. 12 For more information on the current round of WTO services negotiations, seehttp://www.wto.org/english/tratop_e/serv_e/s_negs_e.htm. 13 WTO, MTN.GNS/W/120, July 10, 1991. 14 WTO, “Communication from the European Communities and their Member States, GATS 2000:Environmental Services,” S/CSS/W/38, Dec. 22, 2000.
C-5
Offers Regarding Cleaning Services of Exhaust Gases andNoise Abatement Services
In keeping with Article XIX of the GATS,10 a new round of services negotiations began in January2000. These negotiations are being conducted through a request-offer approach. Under thisapproach, WTO member economies have submitted initial requests, formally asking other WTOmembers to make specific changes to their schedules of commitments. Following the receipt ofthese requests, WTO members submitted initial offers. Paragraph 15 of the Doha DevelopmentAgenda established March 31, 2003 as the due date for the submission of initial services offers.11
These nonbinding offers are presented in redline-strikeout format, illustrating the changes thatmember economies may be willing to make in their schedules of commitments in response toother members’ requests.12
As of April 2004, 42 member countries had submitted services offers to the WTO, and 12 of theseoffers had been derestricted and made available to the public. Tables C-3 and C-4 provide anoverview of public offers that specifically address the cleaning services of exhaust gases and noiseabatement services segments. The tables indicate the extent to which these offers differ fromcommitments that are currently in place. The tables also indicate which countries have organizedtheir offers based on the WTO Services Sectoral Classification List (also known as the W/120),13
and which countries have offered to recast their commitments based on a classification schemeproposed by the European Union in 2000.14 These classification schemes are compared in tableC-5. Offers submitted by WTO members are not binding, but they illustrate how certain membercountries proposed to alter their services trade commitments at a certain point in time.

C-6
Table C-1Nature of GATS commitments on cleaning services of exhaust gases
Member country
Do commitmentsapply to all or partof the sector?
Did the membercountry schedulefull or partialcommitments?1 Nature of limitations listed in GATS schedule
Albania All Full --
Armenia All Partial The provision of services through cross-border supply (mode 1) is unbound due totechnical infeasibility.
Austria All Partial The provision of services through cross-border supply (mode 1) is unbound due totechnical infeasibility. Commercial presence is required for the provision of servicesthrough the presence of natural persons (mode 4).
Bulgaria Part Full Commitments do not cover environmental services supplied in the exercise ofgovernmental authority, which includes regulatory, administrative, and control servicesby government and municipal bodies related to environmental issues. Additionally,commitments do not apply to services related to the collection, transportation, storage,secondary use, recycling, restoration, use in the production of energy and materials,and disposal of dangerous waste, refuse, and substances. The provision of servicesthrough cross-border supply (mode 1) is unbound due to technical infeasibility.
Canada All Full --
China Part Partial Commitments exclude quality monitoring and pollution source inspection. Additionally,foreign firms are granted market access through a commercial presence (mode 3) onlyin the form of joint ventures, although foreign majority ownership is permitted. Environmental consultation is the only cross-border (mode 1) service covered by thesecommitments.
Croatia All Partial The provision of services through cross-border supply (mode 1) is unbound due totechnical infeasibility.
Ecuador All Full --
El Salvador All Partial Commitments only cover market access for provision of services through acommercial presence (mode 3). There are no commitments on national treatment.
Estonia All Full --
EU All Partial The provision of services through cross-border supply (mode 1) is unbound due totechnical infeasibility.
See footnotes at end of table.

C-7
Table C-1--ContinuedNature of GATS commitments on cleaning services of exhaust gases
Member country
Do commitmentsapply to all or partof the sector?
Did the membercountry schedulefull or partialcommitments?1 Nature of limitations listed in GATS schedule
Finland All Full --
FYR Macedonia All Partial The provision of services through cross-border supply (mode 1) is unbound due totechnical infeasibility.
Georgia Part Full Commitments on cross-border supply (mode 1) apply only to consulting and advisoryservices.
Iceland2 All Partial The provision of services through cross-border supply (mode 1) is unbound due totechnical infeasibility. An environmental operating license is required for marketaccess through commercial presence (mode 3) and presence of natural persons(mode 4).
Japan All Partial The provision of services through cross-border supply (mode 1) is unbound due totechnical infeasibility.
Jordan All Full --
Korea Part Full Commitments cover services other than construction work services under CPC 9404.
Kyrgyz Republic2 All Full --
Latvia All Partial The provision of services through cross-border supply (mode 1) is unbound due totechnical infeasibility.
Lesotho Part Full Commitments cover consultancy services only.
Liechtenstein Part Partial Commitments do not apply to public works functions, whether owned and operated bymunicipalities or the Liechtenstein Government or contracted out by them. Theprovision of services through cross-border supply (mode 1) is unbound due totechnical infeasibility.
Lithuania All Full --
Moldova All Full --
See footnotes at end of table.
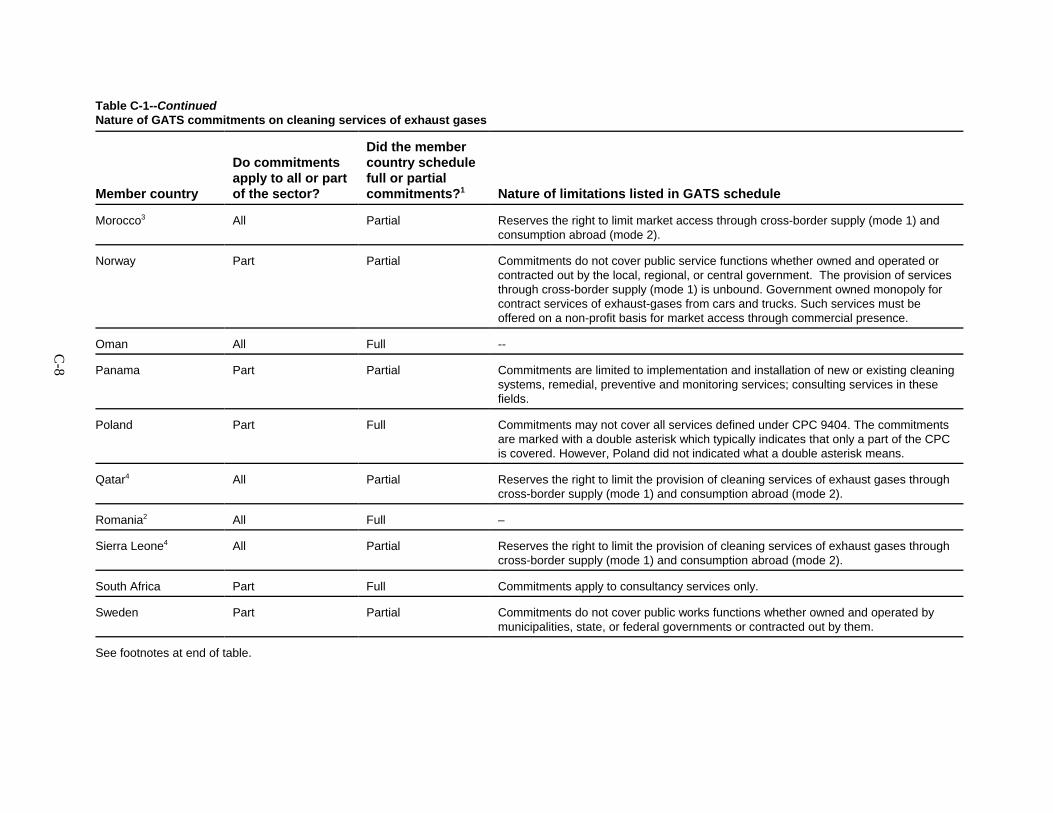
Table C-1--ContinuedNature of GATS commitments on cleaning services of exhaust gases
Member country
Do commitmentsapply to all or partof the sector?
Did the membercountry schedulefull or partialcommitments?1 Nature of limitations listed in GATS schedule
C-8
Morocco3 All Partial Reserves the right to limit market access through cross-border supply (mode 1) andconsumption abroad (mode 2).
Norway Part Partial Commitments do not cover public service functions whether owned and operated orcontracted out by the local, regional, or central government. The provision of servicesthrough cross-border supply (mode 1) is unbound. Government owned monopoly forcontract services of exhaust-gases from cars and trucks. Such services must beoffered on a non-profit basis for market access through commercial presence.
Oman All Full --
Panama Part Partial Commitments are limited to implementation and installation of new or existing cleaningsystems, remedial, preventive and monitoring services; consulting services in thesefields.
Poland Part Full Commitments may not cover all services defined under CPC 9404. The commitmentsare marked with a double asterisk which typically indicates that only a part of the CPCis covered. However, Poland did not indicated what a double asterisk means.
Qatar4 All Partial Reserves the right to limit the provision of cleaning services of exhaust gases throughcross-border supply (mode 1) and consumption abroad (mode 2).
Romania2 All Full –
Sierra Leone4 All Partial Reserves the right to limit the provision of cleaning services of exhaust gases throughcross-border supply (mode 1) and consumption abroad (mode 2).
South Africa Part Full Commitments apply to consultancy services only.
Sweden Part Partial Commitments do not cover public works functions whether owned and operated bymunicipalities, state, or federal governments or contracted out by them.
See footnotes at end of table.

Table C-1--ContinuedNature of GATS commitments on cleaning services of exhaust gases
Member country
Do commitmentsapply to all or partof the sector?
Did the membercountry schedulefull or partialcommitments?1 Nature of limitations listed in GATS schedule
C-9
Switzerland Part Partial Commitments do not cover public works functions whether owned and operated bymunicipalities, cantons, or the Federal Government, or contracted out by them. Theprovision of services through cross-border supply (mode 1) is unbound due totechnical infeasibility.
Taiwan All Full Reserves the right to limit market access through cross-border supply (mode 1).
Thailand All Partial The provision of services through cross-border supply (mode 1) is unbound due totechnical infeasibility. There are no limitations on national treatment for the supply ofservices through a commercial presence (mode 3), as long as foreign equityparticipation does not exceed 49 percent and as indicated in the horizontalcommitments.
United Arab Emirates2 All Full --
United States Part Full Commitments are limited to the following activities: implementation and installation ofnew or existing systems for environmental cleanup, remediation, prevention, andmonitoring; implementation of environmental quality control and pollution reductionservices; maintenance and repair of environment-related systems and facilities notalready covered by the US commitments on maintenance and repair of equipment; on-site environmental investigation, evaluation, and monitoring; sample collectionservices; training on site or at the facility; and consulting related to these areas.
1 Most measures regarding the supply of services through the presence of natural persons (mode 4) are addressed in a member country’s horizontalcommitments. Thus, for the purposes of this table, a full commitment is any commitment that grants full market access or national treatment to foreign individualsor firms that provide cleaning services of exhaust gases through cross-border supply (mode 1), consumption abroad (mode 2), and commercial presence (mode3). 2 Commitments include Other Environmental Services but do not specifically identify cleaning services of exhaust gases or CPC 9404. 3 Does not specifically identify cleaning services of exhaust gases or CPC 9404, but uses the broader CPC 940 category -- which includes cleaning services ofexhaust gases – to define the scope of the sector covered by these commitments. 4 Does not identify specific environmental service categories, but rather treats the entire sector as a whole.
Source: Compiled by the U.S. International Trade Commission.

C-10
Table C-2Nature of GATS commitments on noise abatement services
Member country
Do commitmentsapply to all or partof the sector?
Did the membercountry schedulefull or partialcommitments?1 Nature of limitations listed in GATS schedule
Albania All Full --
Armenia All Partial The provision of services through cross-border supply (mode 1) is unbound due totechnical infeasibility.
Austria All Partial The provision of services through cross-border supply (mode 1) is unbound due totechnical infeasibility. Commercial presence is required for the provision of servicesthrough the presence of natural persons (mode 4).
Bulgaria Part Full Commitments do not cover environmental services supplied in the exercise ofgovernmental authority, which includes regulatory, administrative, and control servicesby government and municipal bodies related to environmental issues. Additionally,commitments do not apply to environmental services related to the collection,transportation, storage, secondary use, recycling, restoration, use in the production ofenergy and materials, and disposal of dangerous waste, refuse, and substances. Theprovision of services through cross-border supply (mode 1) is unbound due totechnical infeasibility.
Canada All Full --
China Part Partial Commitments exclude quality monitoring and pollution source inspection. Additionally,foreign firms are granted market access through a commercial presence (mode 3) onlyin the form of joint ventures, although foreign majority ownership is permitted. Environmental consultation is the only cross-border (mode 1) service covered by thesecommitments.
Croatia All Partial The provision of services through cross-border supply (mode 1) is unbound due totechnical infeasibility.
Ecuador All Full --
El Salvador All Partial Commitments only cover market access for provision of services through acommercial presence (mode 3). There are no commitments on national treatment.
Estonia All Full --
See footnotes at end of table.

C-11
Table C-2--ContinuedNature of GATS commitments on noise abatement services
Member country
Do commitmentsapply to all or partof the sector?
Did the membercountry schedulefull or partialcommitments?1 Nature of limitations listed in GATS schedule
Finland All Full --
FYR Macedonia All Partial The provision of services through cross-border supply (mode 1) is unbound due totechnical infeasibility.
Georgia Part Full Commitments on cross-border supply (mode 1) apply only to consulting and advisoryservices.
Iceland2 All Partial The provision of services through cross-border supply (mode 1) is unbound due totechnical infeasibility. An environmental operating license is required for marketaccess through commercial presence (mode 3) and presence of natural persons(mode 4).
Japan All Partial The provision of services through cross-border supply (mode 1) is unbound due totechnical infeasibility.
Jordan All Full --
Korea Part Full Commitments cover services other than construction work services under CPC 9405.
Kyrgyz Republic2 All Full --
Latvia All Partial The provision of services through cross-border supply (mode 1) is unbound due totechnical infeasibility.
Lesotho Part Full Commitments cover consultancy services only.
Liechtenstein Part Partial Commitments do not apply to public works functions, whether owned and operated bymunicipalities or the Liechtenstein Government or contracted out by them. Theprovision of services through cross-border supply (mode 1) is unbound due totechnical infeasibility.
Lithuania All Full --
Moldova All Full --
See footnotes at end of table.

Table C-2--ContinuedNature of GATS commitments on noise abatement services
Member country
Do commitmentsapply to all or partof the sector?
Did the membercountry schedulefull or partialcommitments?1 Nature of limitations listed in GATS schedule
C-12
Morocco3 All Partial Reserves the right to limit market access through cross-border supply (mode 1) andconsumption abroad (mode 2).
Norway Part Partial Commitments do not cover public service functions whether owned and operated orcontracted out by the local, regional, or central government. The provision of servicesthrough cross-border supply (mode 1) is unbound.
Oman All Full --
Panama Part Partial Commitments are limited to implementation and installation of new or existing cleaningsystems, remedial, preventive and monitoring services; consulting services in thesefields.
Poland Part Full Commitments may not cover all services defined under CPC 9405. The commitmentsare marked with a double asterisk which typically indicates that only a part of the CPCis covered. However, Poland did not indicated what a double asterisk means.
Qatar4 All Partial Reserves the right to limit the provision of noise abatement services through cross-border supply (mode 1) and consumption abroad (mode 2).
Romania2 All Full –
Sierra Leone4 All Partial Reserves the right to limit the provision of noise abatement services through cross-border supply (mode 1) and consumption abroad (mode 2).
South Africa Part Full Commitments apply to consultancy services only.
Sweden Part Partial Commitments do not cover public works functions whether owned and operated bymunicipalities, state, or federal governments or contracted out by them. The provisionof services through cross-border supply (mode 1) is unbound due to technicalfeasibility.
See footnotes at end of table.

Table C-2--ContinuedNature of GATS commitments on noise abatement services
Member country
Do commitmentsapply to all or partof the sector?
Did the membercountry schedulefull or partialcommitments?1 Nature of limitations listed in GATS schedule
C-13
Switzerland Part Partial Commitments do not cover public works functions whether owned and operated bymunicipalities, cantons, or the Federal Government, or contracted out by them. Theprovision of services through cross-border supply (mode 1) is unbound due totechnical infeasibility.
Taiwan All Full Reserves the right to limit market access through cross-border supply (mode 1).
Thailand All Partial The provision of services through cross-border supply (mode 1) is unbound due totechnical infeasibility. There are no limitations on national treatment for the supply ofservices through a commercial presence (mode 3), as long as foreign equityparticipation does not exceed 49 percent and as indicated in the horizontalcommitments.
United Arab Emirates2 All Full --
United States Part Full Commitments are limited to the following activities: implementation and installation ofnew or existing systems for environmental cleanup, remediation, prevention, andmonitoring; implementation of environmental quality control and pollution reductionservices; maintenance and repair of environment-related systems and facilities notalready covered by the US commitments on maintenance and repair of equipment; on-site environmental investigation, evaluation, and monitoring; sample collectionservices; training on site or at the facility; and consulting related to these areas.
1 Most measures regarding the supply of services through the presence of natural persons (mode 4) are addressed in a member country’s horizontalcommitments. Thus, for the purposes of this table, a full commitment is any commitment that grants full market access or national treatment to foreign individualsor firms that provide noise abatement services through cross-border supply (mode 1), consumption abroad (mode 2), and commercial presence (mode 3). 2 Commitments include Other Environmental Services but do not specifically identify noise abatement services or CPC 9405. 3 Does not specifically identify noise abatement services or CPC 9405, but uses the broader CPC 940 category -- which includes noise abatement services – todefine the scope of the sector covered by these commitments. 4 Does not identify specific environmental service categories, but rather treats the entire sector as a whole.
Source: Compiled by the U.S. International Trade Commission.

C-14
Table C-3Publicly available offers submitted by WTO members on cleaning services of exhaust gases
WTO Member
Basis ofenvironmentalservicesclassification
Changes to scope of Uruguay Roundcommitments
Changes to content of Uruguay Roundcommitments
Australia EU proposal Australia previously had no commitments on servicesto reduce exhaust gases and other emissions (CPC9404). Uruguay Round commitments cover the entireindustry segment.
Australia, which previously had no commitments on servicesto reduce exhaust gases and other emissions (CPC 9404), isoffering to schedule partial commitments on this industry. Commitments would reserve the right to limit market accessand national treatment through mode 1 due to lack oftechnical feasibility.
Canada W/120 None-Uruguay Round commitments cover the entireindustry segment
None-Uruguay Round schedule includes full commitments on thisindustry segment
Chile None used None-There continues to be no commitments scheduled onthis industry segment
None-There continues to be no commitments schedule on thisindustry
European Union1 EU proposal Uruguay Round commitments for most EU membercountries cover the entire industry segment. Swedenhas a government owned monopoly for controlservice of exhaust-gas from cars and trucks. Suchservices must be offered on a non-profit basis.
The EU is offering to make some minor changes, making itsmode 4 commitments on this industry segment compatiblewith its new horizontal commitments on mode 4.Commitments would continue to reserve the right to limitmarket access and national treatment through mode 1. Finland would continue to maintain no mode 1 and mode 4restrictions.
Iceland W/120 None-There continues to be no commitments scheduled onthis industry segment.
None-There continues to be no commitments schedule on thisindustry segment.
Japan EU proposal None-Uruguay Round commitments cover the entireindustry segment.
None-Commitments would continue to be unbound for mode 1 dueto lack of technical feasibility.
Liechtenstein W/120 None-Uruguay Round commitments cover the entireindustry segment.
None-Commitments would continue to be unbound for mode 1 dueto lack of technical feasibility.
See footnote at end of table.

C-15
Table C-3—ContinuedPublicly available offers submitted by WTO members on cleaning services of exhaust gases
WTO Member
Basis ofenvironmentalservicesclassification
Changes to scope of Uruguay Roundcommitments
Changes to content of Uruguay Roundcommitments
New Zealand EU proposal New Zealand previously had no commitments onservices to reduce exhaust gases and otheremissions (CPC 9404). Uruguay Roundcommitments cover the entire industry segment.
New Zealand, which previously had no commitments onservices to reduce exhaust gases and other emissions (CPC9404), is offering to schedule full commitments on thisindustry.
Norway EU proposal Norway is offering to eliminate the provision requiringthat services be on a non-profit basis placed oncontrol services of exhaust-gas from cars and trucksgiven the government owned monopoly.
Norway is offering to eliminate the right to limit market accessand national treatment through mode 1.Uruguay Round schedule would now include full commitmentson this industry segment.
Slovenia W/120 None-There continues to be no commitments scheduled onthis industry segment.
None-There continues to be no commitments schedule on thisindustry segment.
Turkey W/120 None-There continues to be no commitments scheduled onthis industry.
None-There continues to be no commitments schedule on thisindustry segment.
United States EU proposal None-Uruguay Round commitments cover the entireindustry segment
None-Uruguay Round schedule includes full commitments on thisindustry segment
1 Sweden: The offer does not include public works functions whether owned and operated by municipalities, state or federal governments or contracted out bythese governments.
Source: Compiled by the U.S. International Trade Commission

C-16
Table C-4Publicly available offers submitted by WTO members on noise abatement services
WTO MemberBasis of environmentalservices classification
Changes to scope of Uruguayround commitments
Changes to content of Uruguay Roundcommitments
Australia EU proposal Australia previously had no commitmentson services to reduce noise pollution(CPC 9405). Uruguay Roundcommitments cover the entire industrysegment.
Australia, which previously had no commitments onservices to reduce noise pollution (CPC 9405), isoffering to schedule partial commitments on thisindustry. Commitments would continue to reservethe right to limit market access and nationaltreatment through mode 1 due to lack of technicalfeasibility.
Canada W/120 None-Uruguay Round commitments cover theentire industry segment.
None-Uruguay Round schedule includes full commitmentson this industry segment.
Chile None used None-There continues to be no commitmentsscheduled on this industry segment.
None-There continues to be no commitments schedule onthis industry.
European Union1 EU proposal The EU previously had no commitmentson noise and vibration abatement (CPC9405). Uruguay Round commitmentscover the entire industry segment.
The EU is offering to make some minor changes,making its mode 4 commitments on this industrysegment compatible with its new horizontalcommitments on mode 4. Commitments will reservethe right to limit market access and nationaltreatment through mode 1. Finland would continueto maintain no mode 1 restrictions. Modes 2 and 3are full for all countries.
Iceland W/120 None-There continues to be no commitmentsscheduled on this industry segment.
None-There continues to be no commitments schedule onthis industry segment.
Japan EU proposal None-Uruguay Round commitments cover theentire industry segment.
None-Commitments would continue to reserve the right tolimit market access and national treatment throughmode 1 due to lack of technical feasibility.
Liechtenstein W/120 None-Uruguay Round commitments cover theentire industry segment.
None-Commitments would continue to reserve the right tolimit market access and national treatment throughmode 1 due to lack of technical feasibility.
See footnote at end of table.

C-17
Table C-4—ContinuedPublicly available offers submitted by WTO members on noise abatement services
WTO MemberBasis of environmentalservices classification
Changes to scope of Uruguay roundcommitments
Changes to content of Uruguay Roundcommitments
New Zealand EU proposal New Zealand previously had nocommitments on services to reducenoise pollution (CPC 9405). UruguayRound commitments cover the entireindustry segment.
New Zealand, which previously had no commitmentson services to reduce noise pollution (CPC 9405), isoffering to schedule full commitments on thisindustry.
Norway EU proposal None-Uruguay Round commitments cover theentire industry segment.
Norway is offering to eliminate the unboundcondition for mode 1. Uruguay Round schedulewould now include full commitments on this industrysegment.
Slovenia W/120 None-There continues to be no commitmentsscheduled on this industry segment.
None-There continues to be no commitments schedule onthis industry segment.
Turkey W/120 None-There continues to be no commitmentsscheduled on this industry.
None-There continues to be no commitments schedule onthis industry segment.
United States EU proposal None-Uruguay Round commitments cover theentire industry segment
None-Uruguay Round schedule includes full commitmentson this industry segment
1 Sweden: The offer does not include public works functions whether owned and operated by municipalities, state or federal governments or contracted out bythese governments.
Source: Compiled by the U.S. International Trade Commission

C-18
Table C-5Environmental services classfications: The W/120 and the European Union proposal
W/120 European Union Proposal
Sewage Disposal Services (CPC 9401) Waste Water Services (CPC 9401)
Refuse Disposal Services (CPC 9402) Solid/Hazardous Waste Services (CPC 9402)
Sanitation and Similar Services (CPC 9403) Sanitation and Similar Services (CPC 9403)
Other Environmental Services:(persumed to include cleaning of exhaustgases (CPC 9404), noise abatement (CPC9405, nature and landscape protectionservices (CPC 9406) and otherenvironmental services (CPC 9409))
Protection of Ambient Air and Climate (CPC 9404)corresponds to Cleaning Services of Exhaust Gases
Noise and Vibration Abatement (CPC 9405)
Remediation and Clean Up of Soil and Waters (part of CPC 9406) corresponds to parts of Nature and Landscape Protection Services
Protection of Biodiversity and Landscape (part of CPC 9406)corresponds to parts of Nature and Landscape Protection Services
Other Environmental and Ancillary Services (CPC9409)
Source: Compiled by the U.S. International Trade Commission based on WTO, MTN.GNS/W/120, July 10, 1991; andWTO, “Communication from the European Communities and their Member States, GATS 2000: EnvironmentalServices,” S/CSS/W/38, Dec. 22, 2000.

APPENDIX DCOUNTRY SUMMARIES

D-2

1 U.S. Commercial Service, “Air Pollution Control Equipment,” Dec. 7, 2000. 2 McIlvaine Co., estimates provided to USITC staff via e-mails, Dec. 23 and 28, 2004. 3 McIlvaine Co., estimates provided to USITC staff via e-mails, Dec. 28, 2004, and Jan. 7 and 11,2005. 4 Ibid. 5 World Trade Organization (WTO), General Agreement on Trade in Services (GATS), Australia:Schedule of Specific Commitments, GATS/SC/6, Apr. 15, 1994. 6 U.S. Trade Representative, 2003 National Trade Estimate Report on Foreign Trade Barriers. 7 U.S.-Australia Free Trade Agreement : Potential Economywide and Selected Sectoral Effects,USITC Publication 3697, May 2004. 8 McIlvaine Co., estimates provided to USITC staff via e-mails, Dec. 23 and 28, 2004.
D-3
This section includes brief overviews of selected country markets for air and noise pollutionabatement services. Specifically, overviews are provided for Australia, Brazil, Canada, Chile,Costa Rica, the European Union (which is discussed in a single section), Japan, Korea, Mexico,South Africa, Thailand, and the United States. These economies were chosen for specialemphasis based on the USTR request for information on both developed- and developing-countrymarkets, as well as information on countries with which the United States has established, or isin the process of establishing, a free trade arrangement, as appropriate.
AustraliaThe market for air and noise pollution abatement services in Australia is believed to be evolving,as meaningful laws governing these sectors have been enacted relatively recently.1 In 2004,Australia’s market for air pollution control engineering, consulting, and monitoring services wasvalued at $28 million, while the market for air pollution control equipment was valued at $515million.2 The country’s relatively comprehensive system of regulations pertaining to air andnoise pollution control combine with public awareness to drive the market. Nonetheless, airpollution control is not presently considered to be among Australia’s top environmentalmanagement issues. Australia’s international obligations in the area of air pollution control andclimate change contribute, in part, to its plans for air pollution abatement.
Australia is a net importer of air pollution abatement services with imports estimated at $5million, and exports estimated at $3 million in 2004.3 Conversely, Australia is a net exporter ofair pollution control equipment with imports estimated at $192 million, and exports estimatedat $357 million in 2004.4 Australia maintains no trade barriers that specifically apply to air ornoise pollution abatement services.5 All foreign firms may face certain obstacles in thatprospective foreign investors must obtain investment approval from the Foreign InvestmentReview Board (FIRB), which may deny specific foreign investments on the basis of nationalinterest.6 However, in practice, the FIRB rarely denies foreign investments.7
BrazilIn 2004, the market for air pollution abatement goods and services in Brazil reached an estimated$1.1 billion, of which service revenues are estimated to represent $56 million, and account for2 percent of the global market for air pollution abatement services.8 Potential market drivers forair pollution abatement services in Brazil include stricter government regulation, community

9 U.S. Foreign Commercial Service (USFCS), “Brazil: Pollution Control,” July 2004, found athttp://www.focusbrazil.org.br/ccg/reports/Pollution.pdf, retrieved Sept. 2004. 10 Government representative, interviews by USITC staff, Rio de Janeiro, Dec. 20, 2004. 11 U.S. Department of Energy, Energy Information Administration (EIA), “Brazil: EnvironmentalIssues,” Aug. 2003, Country Analysis Brief, found athttp://www.eia.doe.gov/emeu/cabs/brazenv.html#ENVIRO, retrieved Jan. 2005; and governmentrepresentative, interviews by USITC staff, Sao Paolo, Dec. 16, 2004. 12 In 1998, Directive 98/69/EC of the European Parliament established limits on emissions of carbonmonoxide, hydrocarbons, NOx, and particulate matter by gasoline and diesel cars and trucks within theEuropean Community. These standards are commonly referred to as “Euro III” standards. Europa,official web site of the European Union, found at http://europa.edint/eur-lex/pri/en/oj/dat/1998/1_350/1_35019981228en00010056.pdf, retrieved Feb. 2005. 13 Government representative, interviews by USITC staff, Sao Paolo, Dec. 16, 2004. 14 McIlvaine Co., estimates provided to USITC staff via e-mails, Dec. 28, 2004, and Jan. 7 and 11,2005. 15 EIA/DOE, Country Analysis Briefs: Canada, Jan. 2004, found atwww.eia.doe.gov/emeu/cabs/canada.html, retrieved Sept. 14, 2004, p. 14. 16 Bureau of National Affairs, Country Profile: Canada, found at http://esweb.bna.com/cgi-bin_isapi.dll//escp.nfo/?advquery, retrieved Sept. 22, 2004, p. 2.
D-4
pressure, and better environmental management practices.9 The Conselho Nacional do MeioAmbiente (CONAMA) is the Brazilian regulatory authority responsible for establishing airquality standards and determining fines for violation thereof. Air pollution in Brazil is largelydue to vehicle emissions, as 90 percent of the country’s electricity is generated by hydroelectricsources.10 Vehicular air pollution is especially severe in the urban areas of Rio de Janeiro and SaoPaolo and tends to be the focus of CONAMA’s regulatory activities. However, enforcementoutside of these urban areas is typically weak.11 Vehicle emissions standards in Brazil have beenset by CONAMA at the Euro III12 level.13
Brazil imported approximately $515 million in air pollution abatement goods and services in2004, with service imports reaching $22 million.14 In that same year, Brazil exported anestimated $2 million in air pollution abatement services. Brazil maintains few, if any, barriersto trade in air pollution abatement services.
CanadaCanada’s abundant energy supplies and reliance on energy intensive industries has led to seriousconcerns regarding air pollution and climate change.15 These concerns, coupled with theCanadian Environmental Protection Act (CEPA), drive the demand for air and noise pollutionabatement related services and equipment. The CEPA, in force since 2000, is the key federallegislation governing air pollution and empowers the environment minister to target and virtuallyeliminate toxic substances from the environment.16 In Canada, the market for services andequipment to address air and noise pollution is mature. As a result, the prospects for growth inthe market in the near future depend largely on new regulatory initiatives and standards.Canada’s Clean Air Agenda– which is aimed at reducing emissions from the transportation andindustrial sectors, as well as transboundary emissions– together with changes in vehicle emission

17 Such standards are currently under development. 18 Bureau of National Affairs, Country Profile: Canada, found at http://esweb.bna.com/cgi-bin_isapi.dll//escp.nfo/?advquery, retrieved Sept. 22, 2004, p. 2. 19 McIlvaine Co., estimates provided to USITC staff via e-mails, Dec. 23 and 28, 2004. 20 McIlvaine Co., estimates provided to USITC staff via e-mails, Dec. 28, 2004, and Jan. 7 and 11,2005. 21 McIlvaine Co., estimates provided to USITC staff via e-mails, Dec. 23 and 28, 2004. 22 BNA, “Chile Overview,” found at http://www.esweb.bna.com/, retrieved Sept. 2004. 23 U.S. Department of Energy, EIA, “Chile,” Country Analysis Brief, July 2002, found athttp://www.eia.doe.gov/emeu/cabs/chile.html, retrieved Jan. 2005. 24 U.S. Department of Energy, EIA, “Chile: Environmental Issues,” Country Analysis Brief, July2002, found at http://www.eia.doe.gov/emeu/cabs/chilenv.html, retrieved Jan. 2005. 25 Ibid. 26 USFCS, Chile Air pollution Control Equipment Report, found at http://www.stat-usa.gov/,retrieved Sept. 2004.
D-5
standards, the addition of PM10 to the toxic substances list, and the possible addition ofnationwide standards for such pollutants as dioxin for iron and steel operations and mercury fromelectric power generation17 may increase demand for air pollution abatement goods andservices.18
An industry source estimates that the market for air pollution abatement goods and services inCanada has risen from $786 million in 1994 to $1.8 billion in 2004 for an average annual growthrate of 9 percent. Goods accounted for $746 million in 1994 and more than $1.7 billion in 2004.Services, which include engineering, consulting, and monitoring, accounted for $40 million in1994 and $92 million in 2004.19 This industry source estimates that Canada imported $849million and $24 million in goods and services, respectively, in 2004. In that same year, Canadaexported $131 million in air pollution abatement goods and posted no exports of air pollutionabatement services.20
ChileIn 2004, the market for air pollution abatement goods and services in Chile reached an estimated$143 million, of which service revenues, specifically, represented about $8 million.21 Data onnoise pollution abatement services for Chile are not available.
The Servicio de Salud Metropolitano del Ambiente (SESMA), an arm of the cabinet-levelMinistry of Health, develops emissions standards, monitors air quality, and implements pollutionreduction programs throughout Chile.22 Air pollution in Chile is largely a product of motorvehicle emissions and copper mining, as over half of Chile’s electricity needs is met byhydropower.23 Vehicular air pollution in Santiago has become severe, with the number of privatevehicles in Chile’s capital having reached 1 million.24 Chile is the largest producer of copper inthe world, and its copper mining and smelting operations in the Santiago area have contributedto high levels of sulphur dioxide and particulate matter.25 In 1996, a Supreme Decree signed bythe Chilean President identified Santiago and its surrounding areas as an “air pollution saturatedzone.”26 Subsequently, the government began providing incentives for private industry to clean

27 Ibid. 28 USFCS, “Chile Country Commercial Guide FY 2004,” found at http://www.stat-usa.gov/,retrieved Sept. 2004. 29 McIlvaine Co., estimates provided to USITC staff via e-mails, Dec. 28, 2004, and Jan. 7 and 11,2005. 30 McIlvaine Co., estimates provided to USITC staff via e-mails, Dec. 23 and 28, 2004. 31 Industry representatives, interviews by USITC staff, Costa Rica, Dec. 6 and 9, 2004. 32 Notably SwissContact, which was been contracted by the government to help develop emissionscontrol strategies, through 2004, and alternative energy sources, ongoing; ENTEBBE; CCAD; theCentral American Alliance for Sustainable Development; LINCOS; and ASODIGITEL. Industryrepresentatives, interviews by USITC staff, San Jose, Costa Rica, Dec. 6-10, 2004. 33 Industry representatives, interviews by USITC staff, Costa Rica, Dec. 6 and 9, 2004. 34 Industry representative, interview by USITC staff, San Jose, Costa Rica, Dec. 6, 2004. 35 Industry representative, interview by USITC staff, San Jose, Costa Rica, Dec. 10, 2004. 36 According to the U.S. Embassy and USAID, over 60 percent of the GDP is services-related andlargely associated with tourism, Government representatives, interviews by USITC staff, Costa Rica,Dec. 6-10, 2004. 37 Capacity is 35 percent, but utilization in 2003 was only 2 percent, according to Centro Nacionalde Planificación Eléctrica (ICE), the national electricity monopoly. 38 Regionally, some municipalities are so over-populated that the availability of fresh water percapita is claimed to be similar to the Saharan desert region. Industry representative, interview byUSITC staff, San Jose, Costa Rica, Dec. 10, 2004
D-6
up its activities and created the Atmosphere Prevention and Decontamination Plan for theMetropolitan Region (PPDA), which establishes legally enforceable limits on industrypollution.27 The recently implemented U.S.-Chile FTA requests that the Chilean governmentenforce the country’s environmental regulations.28
Chile imported approximately $68 million in air pollution abatement goods and services in 2004,with service imports estimated at about $1 million.29 Chile maintains few, if any, barriers to tradein air pollution abatement services.
Costa RicaThe Costa Rican market for air and noise pollution abatement is likely small.30 There are nocountry-specific estimates on the size of Costa Rica’s market for air pollution abatement goodsand services. The primary services market participants are labs that test ambient air quality31 andNon-Government Organization (NGO) consultants.32 Significant international presence, in theform of corporate and NGO involvement, ensures a high international market presence. Most ofthe equipment is sourced from the United States and the European Union (sourced either by localsales subsidiaries of U.S. or EU firms, or directly),33 whereas many consulting services areprovided by EU firms.34 Costa Rica maintains no trade barriers that specifically apply to air ornoise pollution abatement services, and the U.S.-Central American Free Trade Agreementeffectively eliminates tariffs on air and noise pollution control equipment. Representatives ofregional NGOs report that the bulk of Central American pollution abatement is located in CostaRica, but that the primary focus of the region is on “green” (biodiversity) development, not“brown or gray” (pollution) issues.35
Costa Rica does not have a large manufacturing sector,36 and little of its electricity is producedthrough the burning of fossil fuels.37 As such, the country’s primary environmental issues arewater,38 wastewater, and solid waste management. Ambient air quality policy has been under

39 Ley Organica del Ambiente, which established the structure, fines, sanctioning process, andadministration for general air quality. 40 Industry representative, interview by USITC staff, San Jose, Costa Rica, Dec. 7, 2004. 41 Decreto 26789 established vehicular and fuel requirements. 42 Notably, the 2004 Decreto 31849, Reglamento sobre los Procedimientos Evaluacion de ImpactorAmbiental, defines a procedure for monitoring ambient air quality. 43 Government representative, interview by USITC staff, Dec. 6, 2004. 44 Industry representatives, interviews by USITC staff, San Jose, Costa Rica, Dec. 7, 2004. 45 Industry representatives, interviews by USITC staff, Costa Rica, Dec. 6-10, 2004. 46 Industry estimates of consumption are available for 18 Member States of the European Union –Austria, Belgium, Czech Republic, Denmark, Finland, France, Germany, Greece, Hungary, Ireland,Italy, the Netherlands, Poland, Portugal, Slovakia, Spain, Sweden, and the United Kingdom. As these18 countries accounted for an estimated 84 percent of air pollution abatement services and goodsconsumed in Europe in 2004, USITC staff observes that the combined estimates for the 18 countriesprovide a considerable, although slightly underestimated, representation of consumption in the entireEuropean Union. 47 European Union representatives, interviews by USITC staff, Brussels, Belgium, Oct. 29, 2004;and Polish government representatives, interviews by USITC staff, Warsaw, Poland, Nov. 2, 2004. 48 Polish Government representative, interview by USITC staff, Warsaw, Poland, Nov. 2, 2004. 49 The EU-15 includes Germany, France, Belgium, England, Spain, Denmark, Greece, Ireland, Italy,Luxembourg, Portugal, Sweden, Finland, the Netherlands, and the United Kingdom. 50 The Accession countries include Hungary, Poland, Estonia, Latvia, Lithuania, Slovenia, Slovakia,Malta, Cyprus, and the Czech Republic. 51 Polish Government representative, interview by USITC staff, Warsaw, Poland, Nov. 2, 2004. 52 Industry representative, interview by USITC staff, Chicago, U.S., Dec. 3, 2004.
D-7
development since 1994;39 laws and decrees to-date have largely focused on vehicularemissions,40 fuel controls,41 and developing an air quality monitoring framework.42 Standardshave largely been drawn from U.S. EPA standards.43 Within metropolitan San Jose, recent policydevelopment is focused on particulates and noise pollution, both of which are primarily attributedto vehicular congestion, though two cement plants are also now regulated as contributorypolluters.44 Present noise control efforts almost exclusively involve the construction of barriers.45
European UnionIn 2004, consumption of air pollution abatement goods and services in the European Uniontotaled an estimated minimum46 of $9.4 billion, of which services accounted for $445 million.In the European Union, demand for air and noise pollution abatement services and equipmentis driven largely by EU-level legislation.47 All EU Member States are required to incorporate andadopt EU Directives into national regulatory regimes.48 In the EU-15,49 the harmonization of suchlegislation is largely complete, and thus, the air and noise pollution abatement market in thesecountries is largely mature. By contrast, many accession countries,50 which joined the EuropeanUnion in 2004, are currently working to bring their national legislation into compliance with EUDirectives.51 As a result, the accession countries are likely to be a large and growing market forair and noise pollution abatement services and equipment in the near future.52 The EU EmissionsTrading Scheme, which provides an incentive for firms with relatively low marginal abatementcosts to invest in air pollution abatement services and equipment, will likely stimulate demandfor such services and equipment, particularly in the central and eastern European countries. EUfirms are highly competitive in the global market for air pollution abatement goods and services,as their experience in addressing the EU’s strict air pollution standards has given them a

53 Industry representative, interview by USITC staff, Chicago, U.S., Dec. 3, 2004. 54 Industry representatives, interview by USITC staff, Chicago, U.S., Dec. 2-3, 2004; and industryrepresentatives, interview with USITC staff, Warsaw, Poland, Nov. 3, 2004. 55 Industry representatives, interviews by USITC staff, Tokyo, Nov. 4-8, 2004. 56 Government official and industry representatives, interviews by USITC staff, Tokyo, Nov. 4-8,2004. 57 Industry representatives, interviews by USITC staff, Tokyo, Nov. 4-8, 2004. 58 Government officials and industry representatives, interviews by USITC staff, Tokyo, Nov. 4-8,2004. 59 Industry representatives, interviews by USITC staff, Seoul, Nov. 15-16, 2004. 60 Industry representatives, interviews by USITC staff, Tokyo, Nov. 4-8, 2004.
D-8
technological advantage in both domestic and foreign markets.53 Aside from issues related totechnical specifications, however, the EU maintains few, if any, barriers to trade in air and noisepollution abatement services.54
JapanJapan is one of the largest markets for air and noise pollution abatement goods and services inAsia. The country maintains some of the most ambitious air quality goals in the world, withregulations and standards oftentimes more rigorous than those found in the United States orEurope. Although environmental legislation is in place and functional, compliance is largelyvoluntary as penalties offer little deterrence.55 The system works well, however, as Japanesefirms value their public image and would seek to avoid the negative connotations associated withbeing identified as unconcerned with the environment or with neighbors’ sensitivities.56 Thisunderlying social conscienceness, combined with the strict regulatory regime, has createdsignificant demand for air and noise pollution abatement goods and services. However, like mostother developed countries with a history of environmental legislation, market growth is believedto have peaked.57 Most of the major sources of air pollution, such as electricity generating plants,steel mills, and factories, have already implemented air pollution control measures. Newopportunities and market growth may emerge as increasingly stringent standards take effect, newconcerns are identified, and technologies improve. Increasing congestion in and aroundmetropolitan areas continues to create demand for noise abatement goods and services, boththose that target the source (vehicles, trains, aircraft), and those that reduce noise already in theenvironment (highway sound barriers, home insulation).58 Japanese producers of air and noisepollution abatement goods and services are active exporters, particularly in emergingenvironmental markets in Asia such as China, Thailand, and Vietnam. Industry reports that Asiancustomers frequently prefer to do business with other Asians, giving Japanese firms an edge overWestern competitors.59 Japan imports a significant amount of air and noise pollution abatementgoods and services from the United States and Europe, particularly from Germany. Imports oftentake the form of technology transfer, where base goods and services are imported, and thenmodified to meet local needs and requirements.60

61 McIlvaine Co., estimates provided to USITC staff via e-mails, Dec. 23 and 28, 2004. 62 Industry representative, interview by USITC staff, Seoul, Korea, Nov. 15, 2004. 63 Ibid. 64 McIlvaine Co., estimates provided to USITC staff via e-mails, Dec. 23 and 28, 2004. 65 McIlvaine Co., estimates provided to USITC staff via e-mails, Dec. 28, 2004, and Jan. 7 and 11,2005. 66 Industry representative, interview by USITC staff, Seoul, Korea, Nov. 15, 2004. 67 Ibid. 68 Industry representative, interview by USITC staff, Seoul, Korea, Nov. 15, 2004. 69 McIlvaine Co., estimates provided to USITC staff via e-mails, Dec. 23 and 28, 2004.
D-9
KoreaKorea’s market for air pollution control services, which was valued at $74 million in 2004,61 isbelieved to be active but leveling off as a result of slow economic growth and a lack of bigenvironmental projects.62 The air quality measurement segment of this market is currentlystagnant but is believed to be poised for growth as the Korean Government plans to transfer someenvironmental control to local governments.63 Korea’s total air pollution control equipmentmarket was valued at $1.4 billion in 2004.64 Korean imports of air pollution abatement serviceswere valued at $15 million in 2004, while exports totaled $5 million in the same year.65 Foreignengineering and consulting firms can only participate in the Korean market as license or jointventure partners.66 Additionally, a lack of intellectual property protections may deter someforeign companies from establishing joint ventures in Korea. Imports of air pollution abatementequipment, predominately from U.S. and Japanese firms, totaled $497 million in 2004,outweighing exports of $341 million.67 The Korean Government and industry are cooperatingto explore opportunities to export environmental goods and services, including air pollutionabatement goods and services, to China, Indonesia, Malaysia, Philippines, Thailand, andVietnam.68
The value of Korea’s noise pollution abatement services and equipment market is unknown butbelieved to be small. Market growth is likely in the near future as regulatory agencies arebeginning to set noise level targets, with construction site targets having been set for 2009.Although data have not yet been identified, it is believed that trade and investment in noisepollution abatement services is minimal as this is not a high-priority environmental marketsector.
MexicoThe market for air pollution abatement services in Mexico is believed to be small and largelycomprises testing, monitoring, consulting, and engineering services. The provision of suchservices typically occurs as part of the specification, sale, and installation of air pollutionequipment which may occur as part of a larger project. The Mexican market for air pollutioncontrol services in 2004 was reportedly $27 million (US), of which $6 million comprisedexpenditures by the power generation industry.69
The market for noise pollution abatement services in Mexico is believed to be very small, andlargely comprises consulting, measurement, and testing. Noise absorbing or barrier materials aresometimes incorporated in products or structures to reduce transmission of noise. No data are

70 McIlvaine Co., estimates provided to USITC staff via e-mails, Dec. 23 and 28, 2004. Tied withDenmark for last among those reported. 71 Comprised of gaseous and particulate engineering, consulting, and monitoring. 72 The Mining Law of 2003 reverted all property back to the state; significant company valuationrepercussions have occurred as the parties involved attempt to assess fair market values for the land. 73 Worker noise safety laws are proposed; Health and Safety Act, Chief Inspector of Mines,Department of Mining and Environment; found at http://www.infomine-africa.com/, July 13, 2004. 74 Mineral and Petroleum Royalty Bill of 2004, commonly called “The Money Bill.” See “TheSouth African Government Releases Mining Royalty Bill,” Werkmans UK Limited, Mar. 2003, foundat Internet address http://www.werksmans.co.za/uk/alert_20030326.pdf, retrieved July 27, 2004. 75 "Perceived Empowerment Risks Discourage U.S. Investors," Business Day (South Africa), Aug.18, 2003 retrieved Aug. 19, 2003. 76 Daniel Thole, “Resources Take a Pounding,” Moneyweb (Johannesburg), found at http://allafrica.com/stories/printable/200308180609.html, retrieved Aug. 28, 2003. 77 Available at http://www.environment.gov.za/. 78 "South Africa Overview," BNA, Inc., found at http:/esweb.bna.com/cgi-bin/om_isapi.dll/escp.nfo,Sept. 22, 2004. 79 For example, MINTEK is one of the premier mining and metals processing equipment – whichincludes pollution controls goods and services – providers internationally.
D-10
available on the size of the Mexican market for noise pollution abatement services, but themarket is believed to be much smaller than the air pollution abatement services market.
South AfricaThe South African market for air pollution abatement services and goods is midsized andgrowing at a slower rate than most other countries. Estimated consumption of air pollution goodsand services rose from $311 million in 1994 to $403 million in 2004, which represents anaverage annual growth rate of 3 percent.70 The services component71 was reported at $22 millionin 2004 (5 percent of consumption of goods and services), and grew by less than $5 million (2percent per year, on average) since 1994. Multiple factors have combined to make the domesticindustry, particularly the mining industry– which is the major component of South Africa’seconomy– struggle to keep up with increased costs of compliance. These issues include Randdevaluation, new mining and land ownership laws,72 increasing worker safety laws,73 and variedsecurity exchange reforms.74 These factors reportedly discourage foreign investment,75 which isreducing the capital available to further increase the market size or to meet new reformrequirements.76 The Department of Environmental Affairs and Tourism (DEAT), the centralpolicy-formulating and coordinating body,77 created a Law Reform Program which issued aNational Environmental Management Act (NEMA, Act 107) in 1998 for the purpose ofdeveloping regulations during 1999-2002. This work is still ongoing. South Africa is a signatoryto the 1985 Vienna Convention for the Protection of the Ozone Layer and the 1987 MontrealProtocol.78 South Africa has also acceded to the Kyoto Protocol, though as a developing country,it is exempt from emissions reduction requirements.
The major domestic providers of air pollution abatement services and goods trade internationallyand are well thought of, particularly in the mining sector.79 Australian and Asian firms accountfor a significant share of South Africa’s imports of air pollution abatement goods and services,while U.S. firms account for a minimal share of such imports. The international market has verygood access to the South African market; however, less sophisticated technologies are oftenchosen to minimize costs. Barriers include a measure requiring domestic engineering/architecture

80 See WTO GATS SC78. 81 Noise Response, Durban Metropolitan Area, found athttp://www.ceroi.net/reports/durban/issues/noise/response.htm, retrieved Sept. 27, 2004. 82 Government officials and industry representatives, interviews by USITC staff, Bangkok, Nov. 10-12, 2004. 83 Government officials and industry representatives, interviews by USITC staff, Bangkok, Nov. 10-12, 2004. 84 Government officials and industry representatives, interviews by USITC staff, Bangkok, Nov. 10-12, 2004. 85 Industry representatives, interviews by USITC staff, Bangkok, Nov. 12, 2004. 86 Industry representatives, interviews by USITC staff, Bangkok, Nov. 12, 2004.
D-11
participation for large projects and a borrowing limit for entities with greater than 75 percentforeign ownership.80
The Environmental Conservation Act 73 of 1989 defines disturbing noise as that which exceedsthe ambient sound level by 7 dBA or more. According to DEAT, noise pollution (defined asnoise caused by traffic, construction, mining, or commercial, recreational, and industrial sources)is rising in the absence of stringent regulations or enforcement. Little information is available onSouth Africa’s noise pollution abatement market. However, some work has been done at theDurban airport, which involved flight pattern and timing modifications.81
ThailandThailand consumed an estimated $285 million in air pollution abatement goods and services, ofwhich services accounted for $13 million, in 2004. Thailand’s air and noise pollution abatementservices market is small compared to major world markets such as Japan and the United States,but the country’s need for such goods and services is significant. As a developing country,Thailand’s focus on economic development has historically taken priority over environmentalconcerns, and recent stagnant economic conditions have slowed environmental initiatives.82
Consequently, the environmental market in Thailand is comprised of a significant number oflegacy and current projects that require attention, many of which center on air and noisepollution.83 Increasing congestion in metropolitan regions is also derogating air and noise quality,primarily due to increased vehicular traffic and greater demands for electricity.84 Fairlycomprehensive environmental legislation is in place, but enforcement is uneven and corruptionis widespread, likely due to a lack of financial resources.85 Thailand imports most environmentalgoods and services, amounting to $146 million of air pollution abatement goods and $2 millionof such services in 2004, primarily from Japan and the United States.86
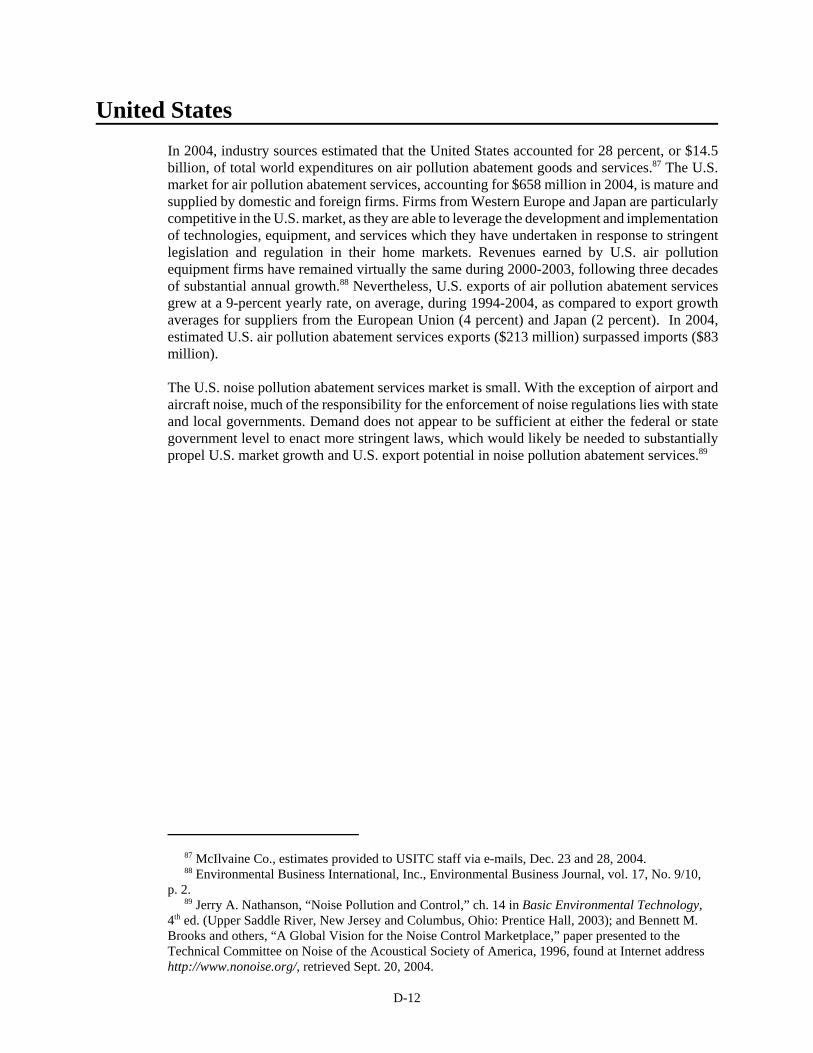
87 McIlvaine Co., estimates provided to USITC staff via e-mails, Dec. 23 and 28, 2004. 88 Environmental Business International, Inc., Environmental Business Journal, vol. 17, No. 9/10,p. 2. 89 Jerry A. Nathanson, “Noise Pollution and Control,” ch. 14 in Basic Environmental Technology,4th ed. (Upper Saddle River, New Jersey and Columbus, Ohio: Prentice Hall, 2003); and Bennett M.Brooks and others, “A Global Vision for the Noise Control Marketplace,” paper presented to theTechnical Committee on Noise of the Acoustical Society of America, 1996, found at Internet addresshttp://www.nonoise.org/, retrieved Sept. 20, 2004.
D-12
United StatesIn 2004, industry sources estimated that the United States accounted for 28 percent, or $14.5billion, of total world expenditures on air pollution abatement goods and services.87 The U.S.market for air pollution abatement services, accounting for $658 million in 2004, is mature andsupplied by domestic and foreign firms. Firms from Western Europe and Japan are particularlycompetitive in the U.S. market, as they are able to leverage the development and implementationof technologies, equipment, and services which they have undertaken in response to stringentlegislation and regulation in their home markets. Revenues earned by U.S. air pollutionequipment firms have remained virtually the same during 2000-2003, following three decadesof substantial annual growth.88 Nevertheless, U.S. exports of air pollution abatement servicesgrew at a 9-percent yearly rate, on average, during 1994-2004, as compared to export growthaverages for suppliers from the European Union (4 percent) and Japan (2 percent). In 2004,estimated U.S. air pollution abatement services exports ($213 million) surpassed imports ($83million).
The U.S. noise pollution abatement services market is small. With the exception of airport andaircraft noise, much of the responsibility for the enforcement of noise regulations lies with stateand local governments. Demand does not appear to be sufficient at either the federal or stategovernment level to enact more stringent laws, which would likely be needed to substantiallypropel U.S. market growth and U.S. export potential in noise pollution abatement services.89

APPENDIX EPOSITION OF INTERESTED PARTY

E-2

1 David Nicholas, Executive Vice President and Chief Operating Officer, Purafil, Inc., Doraville,Georgia, written submission to the Commission, Sept. 30, 2004.
E-3
Purafil, Inc.Purafil, Inc.1 is a small, Georgia-based manufacturer of air filtration systems that are used toeliminate harmful gases released within closed environments such as industrial plants and officebuildings. As over one-half of its current sales are directed to the export market, trade barriersare a key point of concern for Purafil, specifically in the areas of duties and currency exportingrestrictions. In order to maintain competitiveness and overcome the extra cost burdens createdby high tariffs, Purafil has been forced to divert valuable manufacturing jobs away from itsAtlanta facility to lower-cost foreign markets. For example, due to the high duties imposed onPurafil products in the Indian market (up to 42%), most of the firm’s manufacturing for thatmarket must be outsourced to lower-cost equipment fabricators in China. Similarly, in order tooffset high duties in Brazil, Purafil has entered into a special licensing agreement where Purafilwould manufacture its equipment within Brazil and receive royalty payments in return.However, under current Brazilian law, exporting currency for purposes other than goods tradeis problematic and has made it very difficult for Purafil to actually collect these royalties. Thus,Purafil strongly believes that its ability to compete in the Brazilian market and other foreignmarkets would be strengthened by the lowering of duties and the relaxing of currency exportingrequirements. Furthermore, Purafil supports the creation of a standard practice model for theconstruction of drinking water disinfection facilities abroad. Recognizing that a significantpercentage of foreign infrastructure and development projects are funded by U.S. Governmentaid programs and seeing that most of these projects lack any precautionary safety requirements--specifically in cases of toxic chlorine gas releases--Purafil contends that the establishment ofinternational standards could create a broader global market for products used in the emergencyremoval of such harmful contaminants.


APPENDIX FGLOSSARY

F-2

F-3
(The following definitions are based on various sources, including Bloomberg.com’s Financial Glossary,Cantor Fitzgerald’s Environmental Credit Trading Glossary, CO2e.com’s Glossary, the Filter ManufacturersCouncil, Investorwords.com, the Pew Center for Global Climate Change, the U.S. Environmental ProtectionAgency’s Plain English Guide to the Clean Air Act and Terms of the Environment Glossaries, and Webster’sThird New International Dictionary, Unabridged.)
Absorption: A taking up by capillary, osmotic, chemical, or solvent action (i.e., absorption ofmoisture from the air).
Activated charcoal: A highly adsorbent form of carbon used to remove odors and toxic substancesfrom liquid or gaseous emissions. In waste treatment, it is used to remove dissolved organic matterfrom waste drinking water. It is also used in motor vehicle evaporative control systems.
Acute: Refers to an injury that happens suddenly.
Adsorption: The removal of a pollutant from air or water by collecting the pollutant on the surface ofa solid material; e.g. an advanced method of treating waste in which activated carbon removes organicmatter from wastewater.
Air cyclones: A device that uses centrifugal force to remove large particles from polluted air.
Allowance: Allowances grant the holder the right to emit a specific quantity of pollution once (e.g.,one ton). The total quantity of allowances issued by regulators dictates the total quantity of emissionspossible under the system. At the end of each compliance period each source must surrender sufficientallowances to cover their emissions during that period.
Baseline-and-Credit system: Under a baseline-and-credit system (i.e., credit- or project-basedtrading), fixed limits are imposed by a regulatory authority on certain sources of a particular pollutant,usually based on historical activity. A source is required to meet its imposed limit, though it mayreduce its pollution levels below this limit and sell the corresponding pollution “credits” to othersources seeking to meet voluntary or mandatory limits. Under this approach, there is no guaranteethat pollution activities will be reduced, since no overall “cap” is defined for a universe of sources.Although the decision to generate credits is voluntary, certification of these credits requires anadministrative process. Canada’s Pilot Emission Reduction Trading (PERT) is an example of a creditapproach.
Cap-and-Trade system: Involves trading of emission allowances, where the total allowance is strictlylimited or ‘capped’. A regulatory authority established the cap which is usually considerably lower(50% to 85%) than the historic level of emissions. Allowances are created to account for the totalallowed emissions (an allowance is a unit of measurement referred to as AAU). Trading occurs whenan entity has excess allowances, either through actions taken or improvements made, and sells themto an entity requiring allowances because of growth in emissions or an inability to make cost-effectivereductions. Cap and Trade programs are closed systems, but can be modified to allow the creationsof new permits by non-capped sources in the manner of credit-based systems.

F-4
Carbon dioxide equivalents (CO2e): A universal standard of measurement against which the impacts of releasing (or avoid the release of) different greenhouse gases can be evaluated. This standard is
based on the Global Warming Potential (GWP) of particular greenhouse gases. GWP is ameasurement of the impact that a particular gas has on ‘radiative forcing’, the additional heat/energywhich is retained in the Earth’s ecosystem through the addition of a particular gas to the atmosphere.
Catalytic conversion: An air pollution abatement process that removes pollutants from motor vehicle exhaust, either by oxidizing them into carbon dioxide and water or reducing them to nitrogen.
Chronic: Refers to a recurring injury or an injury that evolves over time.
Clean Development Mechanism (CDM): Established under Article 12 of the Kyoto Protocol to theUnited Nations Framework Convention on Climate Change (UNFCCC), the CDM grants 41industrialized countries and economies in transition (Annex 1 countries) the right to generate and/orpurchase certified emissions reductions (CERs) from investments in emissions reduction projects innon-Annex 1 countries, under certain conditions.
Command-and-Control method: A centralized pollution control strategy whereby governments orother regulators utilize non-market restrictions or methods such as special licenses, zoning permits,and minimum standards requirements on pollution sources.
Commercial presence (mode 3): A service supplier establishes a type of business or professionalenterprise in a foreign market.
Consumption abroad (mode 2): A consumer, or the consumer’s property, receives a service outsidethe territory of the consumer’s country.
Credit: A government-recognized right to emit under a baseline-and-credit system.
Criteria air pollutants: A group of very common air pollutants regulated by EPA on the basis ofcriteria (information on health and/or environmental effects of pollution). Criteria air pollutants arewidely distributed all over the country.
Cross-border supply (mode 1): A service is transported beyond the country of the service supplier toa foreign consumer (the service supplier is not present within the territory of the consumer).
Emissions trading registry: An internet-based registry that records and tracks the ownership andtransfer of emission allowances. All market participants must establish an account with the registry.
Exchange: A formal, institutionalized marketplace where securities or other assets are traded.
Fixed (stationary) sources: A place or object from which pollutants are released and which does notmove around. Stationary sources include power plants, gas stations, incinerators, houses etc.

F-5
Flash smelters: A modern substitute for open air roasting of sulfide ores for several hours in a horizontalreverberatory furnace by which finely ground ore concentrates are dispersed at the top of a verticalfurnace, decomposing into metal and SO2 in the few seconds it takes to fall to the bottom. The liquidmetal is taken off the bottom, while the SO2 flows upward countercurrent to the falling oreconcentrates, going to an acid capture plant.
Forward contract: Agreements between two parties, buyer and seller, in which the buyer agrees topurchase an asset from the seller at a specific future date. The price is agreed in advance, althoughpayment is not made until the transaction date. Forward contracts, which are typically customized,one-off contracts, are traded in over-the-counter markets.
Forward market: A market in which forward contracts are traded between two or more parties. Seeforward contract.
Futures contract: It is an agreement to buy or sell a specific amount of a commodity or financialinstrument at a certain time in the future for a particular price. The price is established between thebuyer and seller on a commodity exchange via a standardized contract defined by the exchange.Futures contracts typically have a range of delivery dates and are marked to market daily. Mostfutures contracts close out their position before maturity, either through an offsetting transaction orby selling the futures contract (i.e., a futures contract is tradable in its own right).
Gravity settling chambers: Settling chambers use the force of gravity to remove solid particles. Thegas stream enters a chamber where the velocity of the gas is reduced. Large particles drop out of thegas and are recollected in hoppers. Because settling chambers are effective in removing only largerparticles, they are used in conjunction with a more efficient control device.
Greenhouse gases: Gases such as carbon dioxide, methane, nitrous oxide, perfluorocarbons,hydrofluorocarbons and sulphur hexafluoride, which contribute to potential climate change.
Hazardous air pollutants (HAPs): Chemicals that cause serious health and environmental effects.Health effects include cancer, birth defects, nervous system problems and death due to massiveaccidental releases such as occurred at the pesticide plant in Bhopal, India. Hazardous air pollutantsare released by sources such as chemical plants, dry cleaners, printing plants, and motor vehicles(cars, trucks, buses, etc.)
Joint Implementation (JI) Mechanism: Established under Article 6 of the Kyoto Protocol to theUNFCCC, the JI Mechanism grants Annex 1 countries the right to generate and/or purchase emissionsreduction units (ERUs) from investments in emissions reduction projects in other Annex 1 countries,subject to certain conditions.
Kyoto Protocol: In the greenhouse gas program, the Kyoto Protocol is an agreement between 159nations that attended the 3rd COP to the United Nations Convention on Climate Change which washeld in Kyoto, Japan in December of 1997. The Kyoto Protocol specifies the deadlines and specificlevels of greenhouse gas reductions that signatory countries are to achieve. Overall, developedcountries are to reduce greenhouse gas emissions by 5.2% between 2008 and 2012 as measuredagainst 1990 emission levels.
Liquidity: A high level of trading activity, allowing buying and selling with minimum price disturbance.Also, a market characterized by the ability to buy and sell with relative ease.

F-6
Mobile sources: Moving objects that release pollution; mobile sources include cars, trucks, buses,planes, trains, motorcycles and gasoline-powered lawn mowers. Mobile sources are divided into twogroups: road vehicles, which includes cars, trucks and buses, and non-road vehicles, which includestrains, planes and lawn mowers.
Mode 1: See Cross-border supply.
Mode 2: See Consumption abroad.
Mode 3: See Commercial presence.
Mode 4: See Presence of natural persons.
National Allocation Plan (NAP): A plan which establishes the overall emissions cap for a countryand the amount of emissions allocations to be distributed to each installation within a particularcountry.
Options contract: A contract that gives the option buyer the right, but not the obligation, to buy (orsell) a financial asset at the exercise price (or to) the option seller within a specified time period, oron a specified date (expiration date).
Over-the-Counter Market: Any asset trading activity outside a formal exchange market.
Ozone: A gas which is a variety of oxygen. The oxygen gas found in the air consists of two oxygenatoms stuck together; this is molecular oxygen. Ozone consists of three oxygen atoms stuck togetherinto an ozone molecule. Ozone occurs in nature; it produces the sharp smell you notice near alightning strike. High concentrations of ozone gas are found in a layer of the atmosphere -- thestratosphere -- high above the Earth. Stratospheric ozone shields the Earth against harmful rays fromthe sun, particularly ultraviolet B. Smog's main component is ozone; this ground-level ozone is aproduct of reactions among chemicals produced by burning coal, gasoline and other fuels, andchemicals found in products including solvents, paints, hair sprays, etc.
Particulate matter (PM): A criteria air pollutant, PM includes dust, soot and other tiny bits of solidmaterials that are released into and move around in the air. Particulates are produced by many sources,including burning of diesel fuels by trucks and buses, incineration of garbage, mixing and applicationof fertilizers and pesticides, road construction, industrial processes such as steel making, miningoperations, agricultural burning (field and slash burning), and operation of fireplaces and woodstoves.Particulate pollution can cause eye, nose and throat irritation and other health problems. PM-10 isa measure of particles in the atmosphere with a diameter of less than ten or equal to a nominal 10micrometers. PM-2.5 is a measure of smaller particles in the air. PM-10 has been the pollutantparticulate level standard against which the EPA has been measuring Clean Air Act compliance. Onthe basis of newer scientific findings, the Agency is considering regulations that will make PM-2.5the new “standard”.
Positive crankcase ventilation (PCV): Is a system that was developed to remove harmful vaporsfrom the engine and to prevent those vapors from being expelled into the atmosphere. The PCVsystem does this by using manifold vacuum to draw vapors from the crankcase into the intakemanifold. Vapor is then carried with the fuel/air mixture into the combustion chambers where it isburned.

F-7
Precipitators: An electrostatic precipitator (ESP) uses nonuniform, high-voltage fields to apply largeelectrical charges to particles moving through the field. The charged particles move toward anoppositely charged collection surface, where they accumulate for removal and disposal.
Presence of natural persons (mode 4): One individual, acting alone or as an employee of a serviceprovider, provides a service while present in a foreign market.
Project-based emissions trading: Activities in which buyers of emissions credits participate in thefinancing of an emissions reduction project. In return for their investment, buyers expect to receiveemissions credits.
Scrubbers: An air pollution device that uses a spray of water or reactant or a dry process to trappollutants in emissions.
Separators: Pollution control systems that use adsorbant materials, compressed air, gravity, or staticelectricity to filter contaminants from liquids or gases.
Slurry: A pumpable dispersion of powdered or granular solids in a liquid (usually water).
Spot market: Are markets that involve sales for the immediate delivery of a security, good, or instrumentat a currently prevailing price.
Trace elements: Are inorganic chemicals usually occurring in small amounts in nature.
United National Framework Convention on Climate Change (UNFCCC): The UNFCCC wasestablished in June 1992 at the Rio Earth Summit. Its primary objective is the “stabilization ofgreenhouse gas concentrations in the atmosphere at a level that would prevent dangerousanthropogenic (man-made) interference with the climate system. Such a level should be achievedwithin a time-frame sufficient to allow ecosystems to adapt naturally to climate change, to ensure thatfood production is not threatened, and to enable economic development to proceed in a sustainablemanner.” The UNFCCC is the governing body for international negotiations on climate change.
Vintage: Refers to the year in which an allowance will be delivered. For example, 2005 vintageallowances will be delivered during 2005.
Volatile organic compounds (VOC): Organic chemicals all contain the element carbon (C); organicchemicals are the basic chemicals found in living things and in products derived from living things,such as coal, petroleum and refined petroleum products. Many of the organic chemicals we use do notoccur in Nature, but were synthesized by chemists in laboratories. Volatile chemicals produce vaporsreadily; at room temperature and normal atmospheric pressure, vapors escape easily from volatileliquid chemicals. Volatile organic chemicals include gasoline, industrial chemicals such as benzene,solvents such as toluene and xylene, and tetrachloroethylene (perchloroethylene, the principal drycleaning solvent). Many volatile organic chemicals are also hazardous air pollutants; for example,benzene causes cancer.

F-8
Volatility: The relative rate at which the price of an asset moves up and down. Volatility is found bycalculating the annualized standard deviation of daily change in price. If the price of a stock movesup and down rapidly over short time periods, it has high volatility. If the price almost never changes,it has low volatility.


![11/22/63 [4th lead] The murder weapon reportedly was a 30 ...jfk.hood.edu/Collection/White Files/Warren Commission-Subject/Wea… · 11/22/63 [4th lead] The murder weapon reportedly](https://img.dokumen.tips/doc/110x75/5ea107aa9821ef48c41ff7c8/112263-4th-lead-the-murder-weapon-reportedly-was-a-30-jfkhoodeducollectionwhite.jpg)