Embed Size (px)
Citation preview
Annual Report
June 30, 2006
U.S. GlobalInvestors Funds
U.S. Global Investors
U.S. Global Investors Funds
Annual Report
June 30, 2006
Table of Contents
Letter to Shareholders 1
Management Teams’ Perspectives 8
Expense Example 40
Portfolios of Investments 42
Notes to Portfolios of Investments 88
Statements of Assets and Liabilities 92
Statements of Operations 96
Statements of Changes in Net Assets 100
Notes to Financial Statements 106
Financial Highlights 116
Report of Independent RegisteredPublic Accounting Firm 121
Trustees and Officers 122
Additional Information 125
Nasdaq Symbols
U.S. Treasury Securities Cash Fund USTXX
U.S. Government Securities Savings Fund UGSXX
Near-Term Tax Free Fund NEARX
Tax Free Fund USUTX
All American Equity Fund GBTFX
China Region Opportunity Fund USCOX
Global Resources Fund PSPFX
World Precious Minerals Fund UNWPX
Gold Shares Fund USERX
P.O. Box 781234San Antonio, Texas 78278-1234Tel 1•800•US•FUNDSFax 210•308•1217www.usfunds.com

Dear Shareholder
U.S. Global Investors Funds
It has been another good year for the U.S. GlobalInvestors Funds, and we thank you for the confi-dence you have placed in us. We work hard everyday to keep that confidence.
Naturally, past performance is no guarantee offuture results. We will, however, work with passionto capture opportunities and manage risks with our matrix of investmentmodels.
Our goal is to keep all of our funds in the top half of their peer group on aconsistent basis. The wind continues to hit our sails, and this is importantfor performance, but we have also built a sturdy boat and have a well-trained crew. Our team-based approach, which integrates qualitative anal-ysis and quantitative processes, has helped us attain our performanceleadership.
Three of the five Investors Funds’ equity funds are ranked by Lipper in thenation’s top 50 mutual funds in total return for the year ended June 30,2006. When you look at the last five years, the news is even more dramatic- three of the Investor Funds are in the top five, and one of those funds isalso on the top-performing list for the 10-year period.
The Gold Shares Fund (USERX) has continued its strong performance byposting a 104.2 percent total return for the year ended June 30, 2006,making it #2 among all funds as ranked by Lipper. For the five-year period,Gold Shares’ 41.0 percent annualized return ranks it #3 out of more than7,300 domestic funds in the time period. The Gold Shares Fund ranked 2out of 54, 2 out of 48, 2 out of 39, and 23 out of 24 gold-oriented funds fortotal return for the one-, three-, five- and ten-year periods ended June 30,2006.
The World Precious Minerals Fund (UNWPX), also gold-oriented, joinsGold Shares at the top of the charts. The fund gained 96.2 percent for theone year ended June 30, 2006, according to Lipper, which ranked it thirdamong all domestic funds for that period in total return. For the five-yearperiod, the World Precious Minerals Fund is the #1 overall performer withan annualized total return of 46.8 percent. The World Precious MineralsFund ranked 3 out of 54, 1 out of 48, 1 out of 39, and 14 out of 24 goldoriented funds for total return for the one-, three-, five- and ten-yearperiods ended June 30, 2006.
These funds are not a flash in the pan, as many skeptics pronounced whengold’s rally began. Of course, the Gold Shares and World Precious Miner-als Funds have benefited from the upsurge in prices, but the funds’
�1
U.S. Global Investors Funds
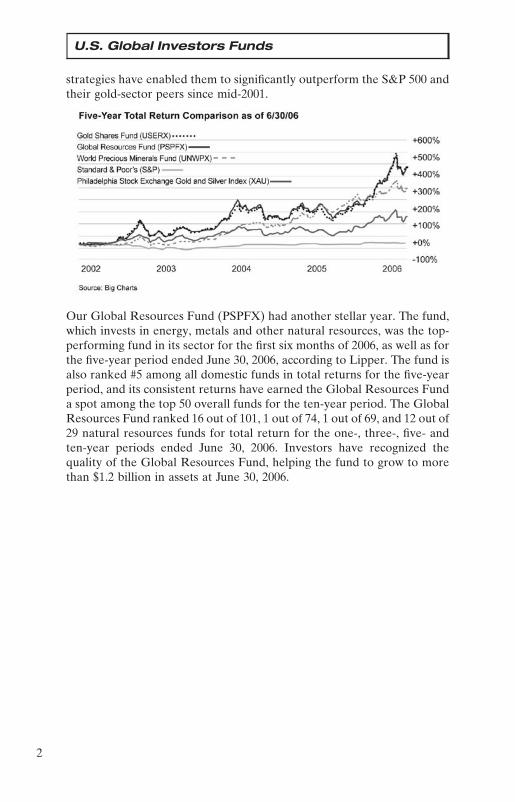
strategies have enabled them to significantly outperform the S&P 500 andtheir gold-sector peers since mid-2001.
Our Global Resources Fund (PSPFX) had another stellar year. The fund,which invests in energy, metals and other natural resources, was the top-performing fund in its sector for the first six months of 2006, as well as forthe five-year period ended June 30, 2006, according to Lipper. The fund isalso ranked #5 among all domestic funds in total returns for the five-yearperiod, and its consistent returns have earned the Global Resources Funda spot among the top 50 overall funds for the ten-year period. The GlobalResources Fund ranked 16 out of 101, 1 out of 74, 1 out of 69, and 12 out of29 natural resources funds for total return for the one-, three-, five- andten-year periods ended June 30, 2006. Investors have recognized thequality of the Global Resources Fund, helping the fund to grow to morethan $1.2 billion in assets at June 30, 2006.
�2

U.S. Global Investors Funds
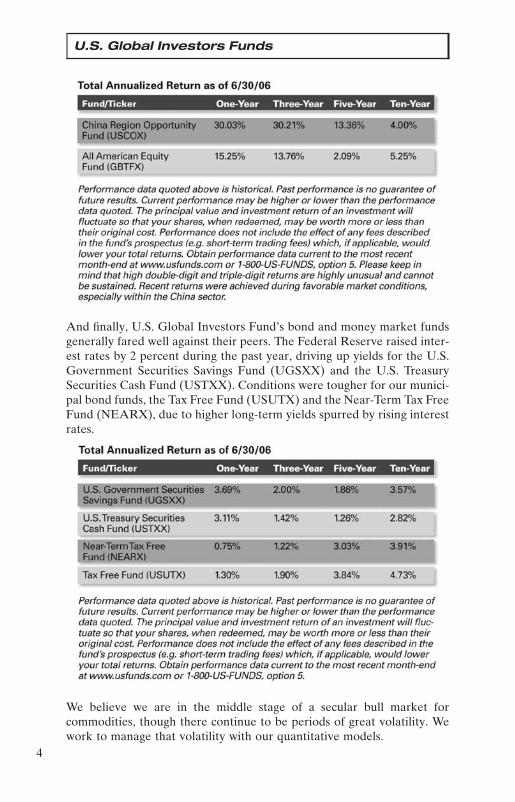
The China Region Opportunity Fund (USCOX) turned in strong perfor-mance during the past year, despite struggling in the final quarter. Thefund’s 30.0 percent total return for the one year ended June 30, 2006,placed it in the top half of China region funds according to Lipper. Thisfund has an outstanding track record in recent years. It ranks #1 in itssector for the latest three-year period and in the top handful over fiveyears. The China region Opportunity Fund ranked 19 out of 38, 1 out of 22,7 out of 22, and 3 out of 7 China region funds for total return for the one-,three-, five- and ten-year periods ended June 30, 2006.
The All American Equity Fund (GBTFX) has done very well compared toits peers in the large-cap sector. The fund’s 15.3 percent return for the yearended June 30, 2006, ranks it in the top 3 percent of funds in that sector,which did not perform as well as the commodities, energy and emergingmarkets sectors over that time period. The All American Equity Fundranked 26 out of 848, 43 out of 725, 201 out of 609, and 190 out of 241large-cap core funds for total return for the one-, three-, five- and ten-yearperiods ended June 30, 2006.
�3
U.S. Global Investors Funds
And finally, U.S. Global Investors Fund’s bond and money market fundsgenerally fared well against their peers. The Federal Reserve raised inter-est rates by 2 percent during the past year, driving up yields for the U.S.Government Securities Savings Fund (UGSXX) and the U.S. TreasurySecurities Cash Fund (USTXX). Conditions were tougher for our munici-pal bond funds, the Tax Free Fund (USUTX) and the Near-Term Tax FreeFund (NEARX), due to higher long-term yields spurred by rising interestrates.
We believe we are in the middle stage of a secular bull market forcommodities, though there continue to be periods of great volatility. Wework to manage that volatility with our quantitative models.
�4

U.S. Global Investors Funds
In the spring of 2006, as money flooded into the commodities sector, wespotted the inevitable correction early and amassed large cash positions inour resource-based funds, in some cases more than 30 percent. Thathelped us in two ways. Our funds dipped during the correction, but not asmuch as their peers that were more fully invested. We also had a readysupply of cash to take advantage of buying opportunities.
Asia’s rapid growth is driving this secular bull market for commodities. Its3 billion people now consume about 20 million barrels of oil daily, while300 million Americans consume 22 million barrels per day. The differenceis that Asia has been growing at 6 percent per year, twice the U.S. rate.Since 2000 there have not been enough new discoveries of oil, gas andprecious metals to meet Asia’s demand as it builds infrastructure.
Since commodities are priced in dollars, volatility for gold and othernatural resources is exaggerated by swings in the dollar’s value. As you cansee from the graph below, most of the time gold performs well when thedollar is struggling, and vice versa. In May 2006, gold was unusually strongand the dollar was unusually weak, which according to our models indi-cated a high probability for the power of mean reversion to take place.That’s when overextended prices revert back to their long-term average.
We believe that gold and natural resource markets will continue to offerexceptional opportunities to investors. We always remind investors, how-ever, that it’s important to diversify between various asset classes and torebalance portfolios at least once a year.
As optimistic as we are, I have seen some global risk issues that can impactbusiness. Each Monday, we track government policies for the G-7 and theE-7 to discover new opportunities and risks. The E-7 are the largestemerging economies for which consistent data is available: China, India,Russia, Brazil, Pakistan, Indonesia and Mexico. We also rely on a SWOTprocess to analyze the strengths and weaknesses of these policies, alongwith the opportunities and threats they present. �5
U.S. Global Investors Funds
We have seen several governments in developing countries begin tochange policies toward international mining companies. These changesinclude harsh taxation and efforts to override previous agreements onnatural resource projects. In other countries, including Germany, we areseeing anti-American feelings that could hurt sales of our mighty multina-tional firms.
Foreign direct investment in the United States is an important componentof our economy that is threatened by the reach of regulators in Washing-ton. The Sarbanes-Oxley Act has now been extended to foreign companieslisted on U.S. exchanges, and we are seeing signs that this may be hurtingU.S. capital markets. A number of companies are opting to delist from theU.S. exchanges because the cost of compliance is so onerous. Last year, 19U.S.-based companies went public on the London Stock Exchange, as didmany others that might have come to America if not for the regulatoryburden and costs.
Trying to subject the world to American laws such as Sarbanes-Oxleybrings to mind the ‘‘Law of Unintended Consequences.’’ Good intentionswhen drafting federal policies can backfire when policymakers have notthoroughly analyszed the complexities of the industries or issues they aretrying to address.
The potential threat for the future is growing resentment of the U.S.government’s application of our laws overseas. Such actions could beperceived as arrogant outside America, and could hurt our economy byclosing off overseas markets to American businesses and blocking accessto natural resources.
How important are international markets to U.S. businesses? Accordingto figures from the ISI Group, foreign sales account for more than half ofthe total sales of companies in the S&P 500’s energy and technologysectors. For the S&P 500 as a whole, foreign sales are more than a third oftotal sales.
U.S. Global Investors prides itself on being a reliable source of informa-tion for its shareholders on market cycles, global trends and the benefits ofdiversification, mean reversion and rebalancing. We are always working toeducate our shareholders about the critical drivers that influence thevarious asset classes. You may wish to take a moment to visitwww.usfunds.com to sign up for our Investor Alert, a weekly SWOTanalysis of key market sectors.
�6

U.S. Global Investors Funds
Again, thank you for investing with us.
Sincerely,
Frank E. HolmesCEO and Chief Investment OfficerU.S. Global Investors, Inc.
Please consider carefully the fund’s investment objectives, risks, charges andexpenses. For this and other important information, obtain a fund prospec-tus by visiting www.usfunds.com or by calling 1-800-US-FUNDS (1-800-873-8637). Read it carefully before investing. Distributed by U.S. GlobalBrokerage, Inc. An investment in a money market fund is neither insurednor guaranteed by the Federal Deposit Insurance Corporation or any othergovernment agency. Although the fund seeks to preserve the value of yourinvestment at $1.00 per share, it is possible to lose money by investing in thefund.
Foreign and emerging market investing involves special risks such ascurrency fluctuation and less public disclosure, as well as economic andpolitical risk. Gold funds may be susceptible to adverse economic, politicalor regulatory developments due to concentrating in a single theme. Theprice of gold is subject to substantial price fluctuations over short periodsof time and may be affected by unpredicted international monetary andpolitical policies. We suggest investing no more than 3% to 5% of yourportfolio in gold or gold stocks. Diversification does not protect an inves-tor from market risks and does not assure a profit. The Philadelphia StockExchange Gold and Silver Index (XAU) is a capitalization-weighted indexthat includes the leading companies involved in the mining of gold andsilver. The S&P 500 Index is a widely recognized capitalization-weightedindex of 500 common stock prices in U.S. companies. Tax-exempt Incomeis federal income tax free. A portion of this income may be subject to stateand local income taxes, and if applicable, may subject certain investors tothe Alternative Minimum Tax as well. Bond funds are subject to interest-rate risk; their value declines as interest rates rise. The U.S. TradeWeighted Dollar Index provides a general indication of the internationalvalue of the U.S. dollar.
�7
Management Team’s Perspective
Money Market Funds
INTRODUCTION
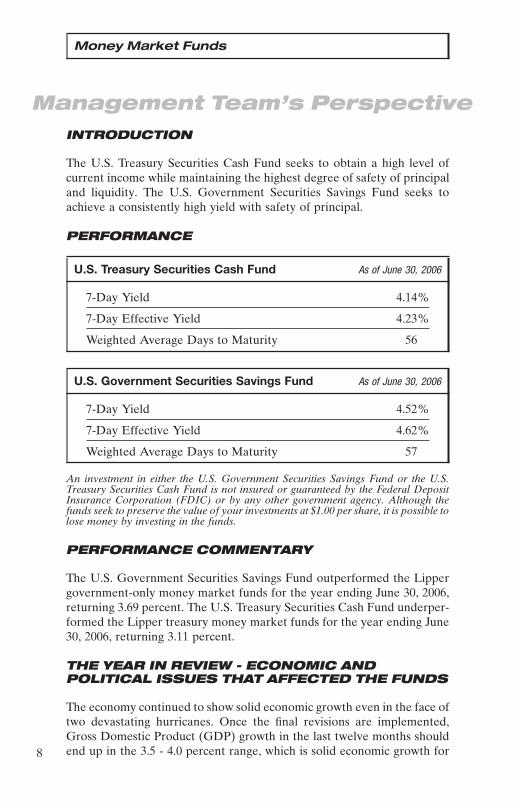
The U.S. Treasury Securities Cash Fund seeks to obtain a high level ofcurrent income while maintaining the highest degree of safety of principaland liquidity. The U.S. Government Securities Savings Fund seeks toachieve a consistently high yield with safety of principal.
PERFORMANCE
U.S. Treasury Securities Cash Fund As of June 30, 2006
7-Day Yield 4.14%
7-Day Effective Yield 4.23%
Weighted Average Days to Maturity 56
U.S. Government Securities Savings Fund As of June 30, 2006
7-Day Yield 4.52%
7-Day Effective Yield 4.62%
Weighted Average Days to Maturity 57
An investment in either the U.S. Government Securities Savings Fund or the U.S.Treasury Securities Cash Fund is not insured or guaranteed by the Federal DepositInsurance Corporation (FDIC) or by any other government agency. Although thefunds seek to preserve the value of your investments at $1.00 per share, it is possible tolose money by investing in the funds.
PERFORMANCE COMMENTARY
The U.S. Government Securities Savings Fund outperformed the Lippergovernment-only money market funds for the year ending June 30, 2006,returning 3.69 percent. The U.S. Treasury Securities Cash Fund underper-formed the Lipper treasury money market funds for the year ending June30, 2006, returning 3.11 percent.
THE YEAR IN REVIEW - ECONOMIC ANDPOLITICAL ISSUES THAT AFFECTED THE FUNDS
The economy continued to show solid economic growth even in the face oftwo devastating hurricanes. Once the final revisions are implemented,Gross Domestic Product (GDP) growth in the last twelve months shouldend up in the 3.5 - 4.0 percent range, which is solid economic growth for�8
Money Market Funds
the largest economy in the world. Employment gains have been less robustbut are still improving. Over the past year, the average gain in non-farmpayrolls averaged about 150,000, which is only modest job growth in anotherwise strong economy. Inflation concerns have increased over the pastyear driven predominantly by sustained higher energy and commodityprices. The Federal Reserve (Fed) continued its path of ‘‘normalizing’’interest rates for the past year. Over the past year, the Fed has raisedinterest rates eight times, bringing the Fed Funds rate to 5.25 percent as ofJune 30, 2006. Since the beginning of this tightening cycle in June 2004, theFed has increased interest rates 17 times, and by 4.25 percent. Short-termbond yields moved up in-line with the rate increases. Over the past year,yields on the three-month T-Bill increased 184 basis points to 4.93 percentand yields on the six-month T-Bills moving up 190 basis points at 5.16percent. One-year agency discount note yields moved up 185 basis pointsto 5.56 percent.
INVESTMENT HIGHLIGHTS
For much of the period, the U.S. Government Securities Savings Fundtook a laddered approach by buying fixed rate securities across the moneymarket spectrum. The fund averaged a weighted average maturity of 53days, which was longer than the peer group average. This proved beneficialas the Fed took a measured approach to rate increases, which met marketexpectations. The fund took advantage of these progressively higher yieldsby selectively extending its ladder. The U.S. Treasury Securities Cash Fundfollowed a similar laddered strategy, averaging a weighted average matur-ity of 40 days. The fund took advantage of relatively high overnight rates,keeping the weighted average maturity lower than the U.S. GovernmentSecurities Savings Fund.
CURRENT OUTLOOK
The Fed is two years into this interest rate cycle and is nearing the end ofits tightening campaign. Core inflation measures have accelerated inrecent months, and concerns over slowing economic growth are building.The housing market appears to be slowing much faster than the Fedexpected, posing a significant risk to the health of the economy. GDPgrowth is likely to slow from the current 3.5 - 4.0 percent range to the 2.5percent range by the end of 2006. Worldwide growth has been unexpect-edly strong but is also likely to slow as we continue through the remainderof 2006. As the economy slows, inflation is likely to slow with it, implyingthat the Fed’s work in normalizing interest rates has likely been com-pleted. With the backdrop of a slowing economy and moderating inflation,the second half of 2006 has the potential to be friendlier to the bondmarket than the first half. �9
Management Team’s Perspective
Tax Free Funds
INTRODUCTION
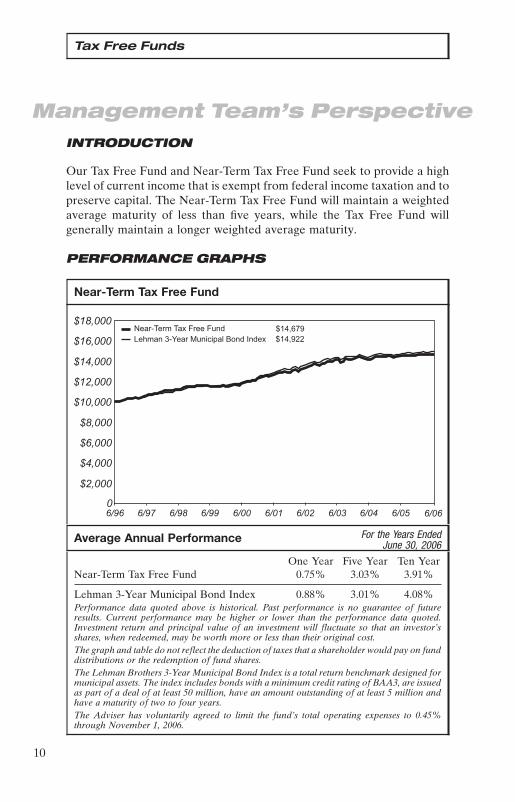
Our Tax Free Fund and Near-Term Tax Free Fund seek to provide a highlevel of current income that is exempt from federal income taxation and topreserve capital. The Near-Term Tax Free Fund will maintain a weightedaverage maturity of less than five years, while the Tax Free Fund willgenerally maintain a longer weighted average maturity.
PERFORMANCE GRAPHS
Near-Term Tax Free Fund
������������������� �������
���
��������������������������� � � � �����!!
���� ���� ���� ���� ���� ���� ��� ��� ���� ���� ����
����
�����
�����
�����
������
�����
������
������
������
Average Annual Performance For the Years EndedJune 30, 2006
One Year Five Year Ten YearNear-Term Tax Free Fund 0.75% 3.03% 3.91%
Lehman 3-Year Municipal Bond Index 0.88% 3.01% 4.08%Performance data quoted above is historical. Past performance is no guarantee of futureresults. Current performance may be higher or lower than the performance data quoted.Investment return and principal value of an investment will fluctuate so that an investor’sshares, when redeemed, may be worth more or less than their original cost.The graph and table do not reflect the deduction of taxes that a shareholder would pay on funddistributions or the redemption of fund shares.The Lehman Brothers 3-Year Municipal Bond Index is a total return benchmark designed formunicipal assets. The index includes bonds with a minimum credit rating of BAA3, are issuedas part of a deal of at least 50 million, have an amount outstanding of at least 5 million andhave a maturity of two to four years.The Adviser has voluntarily agreed to limit the fund’s total operating expenses to 0.45%through November 1, 2006.
�10
Tax Free Funds
Tax Free Fund
��������� ��"�#��
���
��������$������������������� � � � ������"
����
�����
�����
�����
������
�����
������
������
������
���� ���� ���� ���� ���� ���� ��� ��� ���� ���� ����
Average Annual Performance For the Years EndedJune 30, 2006
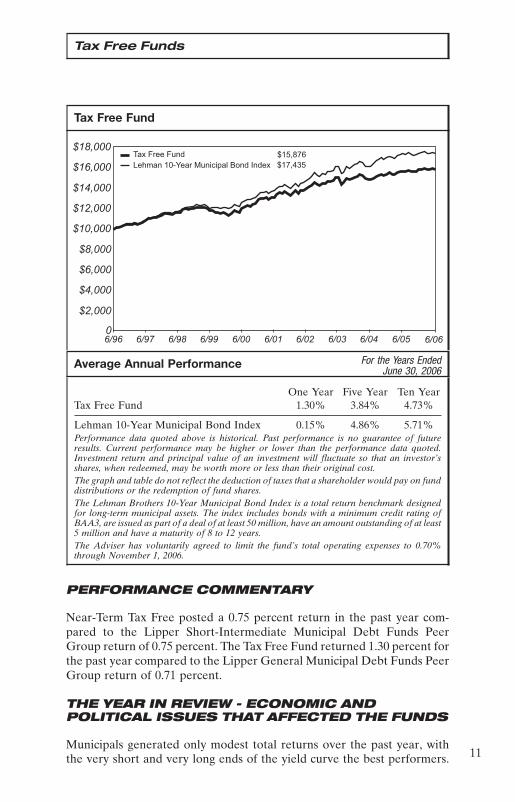
One Year Five Year Ten YearTax Free Fund 1.30% 3.84% 4.73%
Lehman 10-Year Municipal Bond Index 0.15% 4.86% 5.71%Performance data quoted above is historical. Past performance is no guarantee of futureresults. Current performance may be higher or lower than the performance data quoted.Investment return and principal value of an investment will fluctuate so that an investor’sshares, when redeemed, may be worth more or less than their original cost.The graph and table do not reflect the deduction of taxes that a shareholder would pay on funddistributions or the redemption of fund shares.The Lehman Brothers 10-Year Municipal Bond Index is a total return benchmark designedfor long-term municipal assets. The index includes bonds with a minimum credit rating ofBAA3, are issued as part of a deal of at least 50 million, have an amount outstanding of at least5 million and have a maturity of 8 to 12 years.The Adviser has voluntarily agreed to limit the fund’s total operating expenses to 0.70%through November 1, 2006.
PERFORMANCE COMMENTARY
Near-Term Tax Free posted a 0.75 percent return in the past year com-pared to the Lipper Short-Intermediate Municipal Debt Funds PeerGroup return of 0.75 percent. The Tax Free Fund returned 1.30 percent forthe past year compared to the Lipper General Municipal Debt Funds PeerGroup return of 0.71 percent.
THE YEAR IN REVIEW - ECONOMIC ANDPOLITICAL ISSUES THAT AFFECTED THE FUNDS
Municipals generated only modest total returns over the past year, withthe very short and very long ends of the yield curve the best performers. �11
Tax Free Funds
The municipal yield curve rose across the board and flattened considerably- yields on 1-year municipals rose about 110 basis points, while 30-yearmunicipal yields rose by about 30 basis points. Bond yields were drivenhigher by rising inflation concerns starting with the energy price spikeswitnessed after Hurricanes Katrina and Rita. Higher energy prices haveonly recently filtered down into core inflation indicators, which havepressured bond prices in the past several months. The economy hasremained remarkably resilient, pressuring the Fed to continue to increaseinterest rates. Over the past year, the Fed has increased interest rates by 2percent on eight different occasions. In the municipal market, the bestperforming sector was the industrial development sector. The sector isleveraged to volatile tobacco-backed municipals, which received favorablecourt rulings over the past year. The housing and hospital sectors alsoposted strong relative performance during this time. The high yield por-tion of the municipal market, which is tied to airline-backed bonds, alsoposted very strong returns over the past year.
INVESTMENT HIGHLIGHTS
Strengths
• The Tax Free Fund maintained an overweight position in long datedmunicipals, which significantly outperformed during the past year.
• The Tax Free Fund was also significantly overweight in the medical/hospital sector which outperformed during the year.
Weaknesses
• In the past year, both funds were underweighted in Californiamunicipals, which outperformed.
• The funds’ lack of exposure to risky airline and tobacco-backed bondswas detrimental to performance as these two sectors were by far the bestperformers over the past twelve months.
• The funds’ conservative credit profile detracted from performance aslower rated credits generally outperformed.
CURRENT OUTLOOK
Opportunities
• The Fed is at or near the end of its tightening cycle, which would likelyallow bonds to rally.
�12
Tax Free Funds
• With the strong outperformance of high yield-related securities, oddsfavor a reversal, so issues with higher-quality credit may outperformover the next year.
Threats
• Inflation still remains a threat to the market and potential Fed response.
• A stronger than expected global economy could pose a threat to longdated municipals.
• If the Fed were to continue raising interest rates to 6 percent or more,this would be negative for municipals across the board.
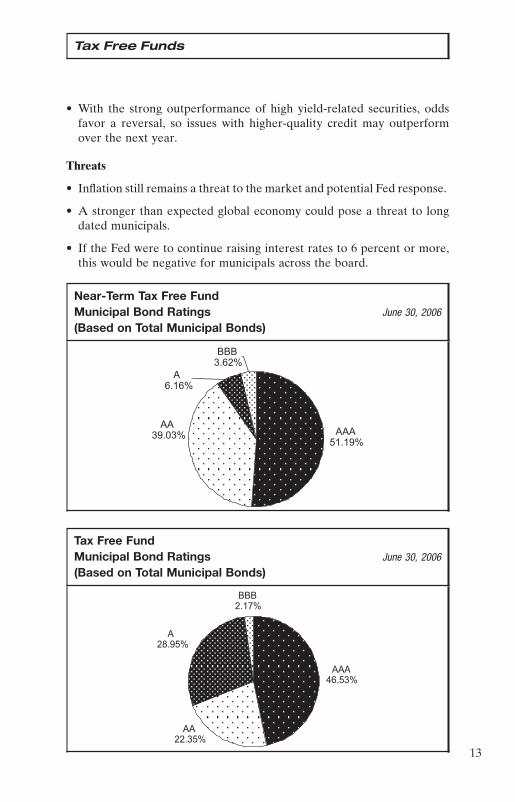
Near-Term Tax Free FundMunicipal Bond Ratings(Based on Total Municipal Bonds)
June 30, 2006
%%%"�&��'
%�&��'
����&�!'
%%��&$�'
Tax Free FundMunicipal Bond Ratings(Based on Total Municipal Bonds)
June 30, 2006
%%%��&"�'
%%!!&�"'
%!#&�"'
���!&��'
�13
Management Team’s Perspective
All American Equity Fund
INTRODUCTION
The principal objective of the All American Equity Fund is to seek capitalappreciation by investing primarily in a broadly diversified portfolio ofdomestic common stocks. The fund invests in large-capitalization stocks,while retaining the flexibility to seek out promising individual stock oppor-tunities. The fund seeks capital appreciation and does not emphasizeincome.
PERFORMANCE GRAPH
All American Equity Fund
%���%��������()��*+��� ������$
���
,-.�"$$� � � �!!�!�"
���� ���� ���� ���� ���� ���� ��� ��� ���� ���� ����
�����
������
������
�����
�����
Average Annual Performance For the Years EndedJune 30, 2006
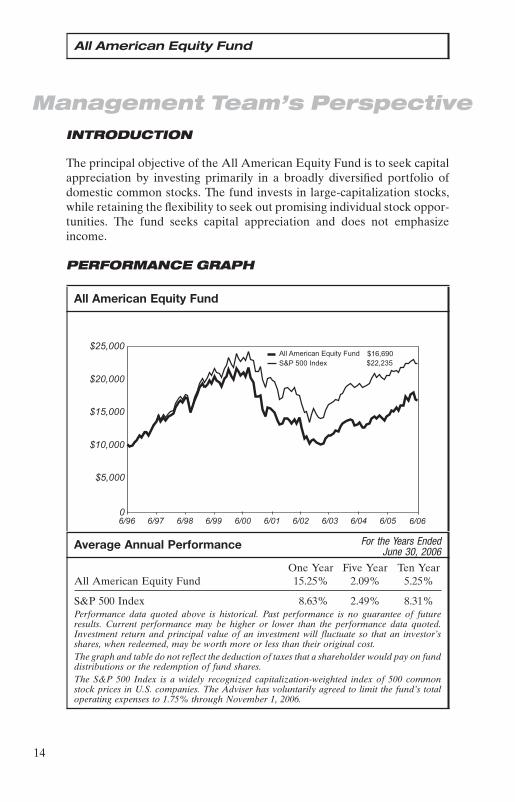
One Year Five Year Ten YearAll American Equity Fund 15.25% 2.09% 5.25%
S&P 500 Index 8.63% 2.49% 8.31%Performance data quoted above is historical. Past performance is no guarantee of futureresults. Current performance may be higher or lower than the performance data quoted.Investment return and principal value of an investment will fluctuate so that an investor’sshares, when redeemed, may be worth more or less than their original cost.The graph and table do not reflect the deduction of taxes that a shareholder would pay on funddistributions or the redemption of fund shares.The S&P 500 Index is a widely recognized capitalization-weighted index of 500 commonstock prices in U.S. companies. The Adviser has voluntarily agreed to limit the fund’s totaloperating expenses to 1.75% through November 1, 2006.
�14
All American Equity Fund
PERFORMANCE COMMENTARY
The fund finished the year ending June 30, 2006 with a gain of 15.25percent. The fund outperformed the S&P 500 Index and the Lipper LargeCap Core Peer Group. The benchmark S&P 500 Index was up 8.63 percentfor the year, while the peer group gained 7.47 percent during the year.
THE YEAR IN REVIEW - ECONOMIC ANDPOLITICAL ISSUES THAT AFFECTED THE FUND
Critical drivers that drove the market higher include the following:
• The Fed increased the Fed Funds rate eight times to finish the fiscal yearat 5.25 percent.
• The price of oil moved from the mid-$50 range to the low-$70 area asstrong global economies, hurricanes and Mideast tensions all served todrive the commodity price higher.
• Gold prices moved significantly higher and at one point crossed the $700threshold.
• Earnings, on a top-down basis on the S&P 500, are estimated to grow 13percent on a year over year basis.
The domestic equity markets performed well in the past 12 months as astronger than expected economy coupled with good corporate profitgrowth helped drive the markets higher. Despite higher interest rates andrising energy prices, consumer spending remained robust. Towards the endof the period, the housing market had clearly slowed down and themarkets were dealing with a new Federal Reserve Chairman as AlanGreenspan retired and the position was handed over to Ben Bernanke.Consumer confidence recovered after taking a hit from HurricanesKatrina and Rita.
Areas of particular strength in the market included energy, materials andindustrials, which all benefited from strong U.S. economic growth.
On the political front, President Bush’s approval ratings hit new lows. Anunresolved situation in Iraq and increasing tensions in Iran and NorthKorea served to weaken the President even more politically.
INVESTMENT HIGHLIGHTS
Strengths
• The energy sector was the best performing sector during the twelve-month period. Strong worldwide economic growth and the effects ofHurricanes Katrina and Rita helped to move crude oil higher. �15

All American Equity Fund
• Materials were the second best performing sector as many precious andbase metals hit new highs as inventory levels fell.
• An energy-related sector that performed well was agricultural productsas there was renewed focus on ethanol as oil prices moved to recordhighs.
Weaknesses
• Healthcare was the worst performing sector as supply companies suf-fered from a contact lens solution recall as well as continued weaknessfrom hospital companies.
• Homebuilding was also one of the worst performing industries as higherinterest rates served to weaken the housing markets.
• The videogame makers also performed poorly as Sony Corp.’s(1) newgame console was pushed back towards the end of 2007. Concerns overthe steep price of new game consoles also contributed to weakness inthis group.
CURRENT OUTLOOK
Opportunities
• Stock selection will be the key to performance over the next 12 months.In an environment of slower growth, the markets tend to favor compa-nies that can provide strong, consistent growth.
• Our use of statistical models will allow for timely accumulation of stockas well as opportune profit taking.
• Recent language from the Fed may indicate that the cycle of Fedtightening may be close to an end.
Threats
• A global slowdown could weigh on the equity markets.
• Global tensions could serve to roil the markets. The situation in Iraq isunresolved and potential new problem areas include Iran and NorthKorea.
• The weakening housing markets could dampen consumer spending,which has propelled the U.S. economy the past few years.
(1)The fund did not hold this security as of June 30, 2006.
�16
All American Equity Fund
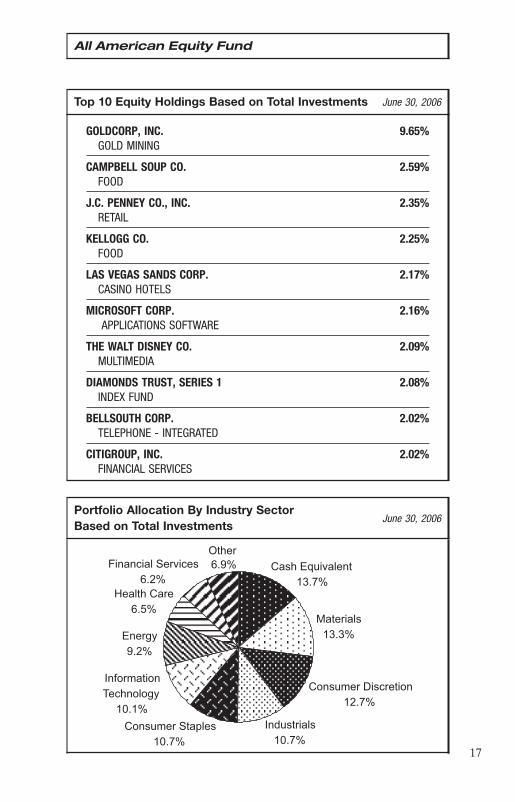
Top 10 Equity Holdings Based on Total Investments June 30, 2006
GOLDCORP, INC. 9.65%GOLD MINING
CAMPBELL SOUP CO. 2.59%FOOD
J.C. PENNEY CO., INC. 2.35%RETAIL
KELLOGG CO. 2.25%FOOD
LAS VEGAS SANDS CORP. 2.17%CASINO HOTELS
MICROSOFT CORP. 2.16%APPLICATIONS SOFTWARE
THE WALT DISNEY CO. 2.09%MULTIMEDIA
DIAMONDS TRUST, SERIES 1 2.08%INDEX FUND
BELLSOUTH CORP. 2.02%TELEPHONE - INTEGRATED
CITIGROUP, INC. 2.02%FINANCIAL SERVICES
Portfolio Allocation By Industry SectorBased on Total Investments
June 30, 2006
/*����&�' 0�1��()��2����*
��&�'
��*�����1��&�'
0��1�����3�1���*����!&�'
� �1*����1�$&�'
0��1�����,*����1�$&�'
�4����*�����������5+
�$&�'
(���5+�&!'
6���*��0����&"'
���������,��2���1�&!'
�17
Management Team’s Perspective
China Region Opportunity Fund
INTRODUCTION
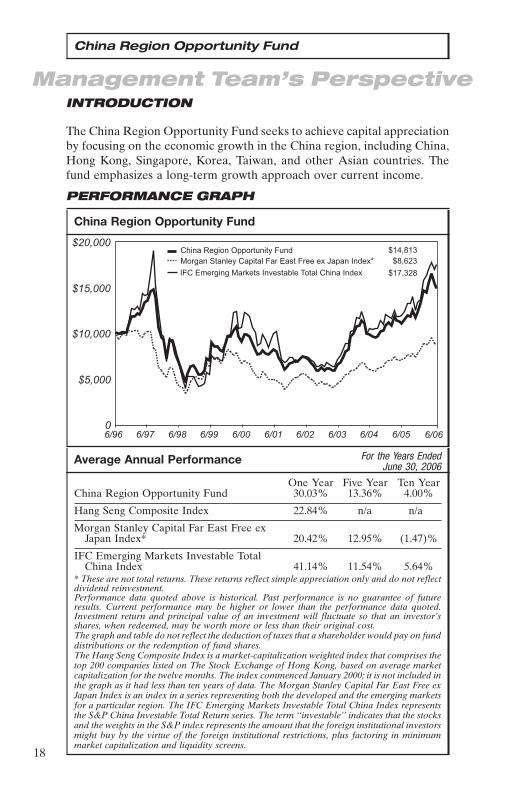
The China Region Opportunity Fund seeks to achieve capital appreciationby focusing on the economic growth in the China region, including China,Hong Kong, Singapore, Korea, Taiwan, and other Asian countries. Thefund emphasizes a long-term growth approach over current income.
PERFORMANCE GRAPH
China Region Opportunity Fund
0�����7�5����/����*���*+��� ����#��
���
���5���,*����+�0���*������(�1*�������8����� � �9�����!# 0�(���5��5����:�*1� �2�1*�;�����*���0����� � ��#��!�
���� ���� ���� ���� ���� ���� ��� ��� ���� ���� ����
�����
������
������
�����
Average Annual Performance For the Years EndedJune 30, 2006
One Year Five Year Ten YearChina Region Opportunity Fund 30.03% 13.36% 4.00%
Hang Seng Composite Index 22.84% n/a n/a
Morgan Stanley Capital Far East Free exJapan Index* 20.42% 12.95% (1.47)%
IFC Emerging Markets Investable TotalChina Index 41.14% 11.54% 5.64%
* These are not total returns. These returns reflect simple appreciation only and do not reflectdividend reinvestment.Performance data quoted above is historical. Past performance is no guarantee of futureresults. Current performance may be higher or lower than the performance data quoted.Investment return and principal value of an investment will fluctuate so that an investor’sshares, when redeemed, may be worth more or less than their original cost.The graph and table do not reflect the deduction of taxes that a shareholder would pay on funddistributions or the redemption of fund shares.The Hang Seng Composite Index is a market-capitalization weighted index that comprises thetop 200 companies listed on The Stock Exchange of Hong Kong, based on average marketcapitalization for the twelve months. The index commenced January 2000; it is not included inthe graph as it had less than ten years of data. The Morgan Stanley Capital Far East Free exJapan Index is an index in a series representing both the developed and the emerging marketsfor a particular region. The IFC Emerging Markets Investable Total China Index representsthe S&P China Investable Total Return series. The term ‘‘investable’’ indicates that the stocksand the weights in the S&P index represents the amount that the foreign institutional investorsmight buy by the virtue of the foreign institutional restrictions, plus factoring in minimummarket capitalization and liquidity screens.�18
China Region Opportunity Fund
PERFORMANCE COMMENTARY
For the twelve-month period ending June 30, 2006, the China RegionOpportunity Fund outperformed its benchmark, the Hang Seng Compos-ite Index, with a total return of 30.03 percent compared to a 22.84 percentreturn on the Hang Seng Composite Index. For the period in review, theChina Shanghai B share market(1) was the best performing market with a45.52 percent gain while the Taiwan market was the worst, with an advanceof 8.93 percent.
THE YEAR IN REVIEW - ECONOMIC ANDPOLITICAL ISSUES THAT AFFECTED THE FUND
Critical drivers for the year include:
• A reacceleration of China’s economy that led to strong inflows intoChinese listed company shares.
• A continued challenging relationship between Taiwan and MainlandChina as Taiwan’s President sought independence while it appears thatthis is less of a concern to a majority of the population.
• Rising tensions in the region as North Korea talked of testing long-rangemissiles.
• More pressure placed on China to revalue its currency as trade balancesseemed to hit new records every month.
The last year has been very rewarding for investors in China. The reac-celeration of the Chinese economy helped to drive the markets to newhighs. Much of the growth was driven by fixed asset investment andexports. Despite revaluing its currency in July 2005, export growth wasunabated, and China reported record trade surpluses almost every month.The move in July was a very small move but does represent a first steptowards a flexible currency regime.
Even with acceleration in growth, inflation remained in check as theConsumer Price Index did not rise above 1.9 percent and ended the periodat 1.5 percent. China also unveiled its eleventh five-year plan, and some ofthe features included improving the livelihood of the rural population, abetter environment and the creation of social benefits such as healthcare.
INVESTMENT HIGHLIGHTS
Strengths
• The fund benefited from its exposure to the H-share market, as evi-denced by the Hang Seng China Enterprises Index(2) being the bestperforming index during the time period. �19
China Region Opportunity Fund
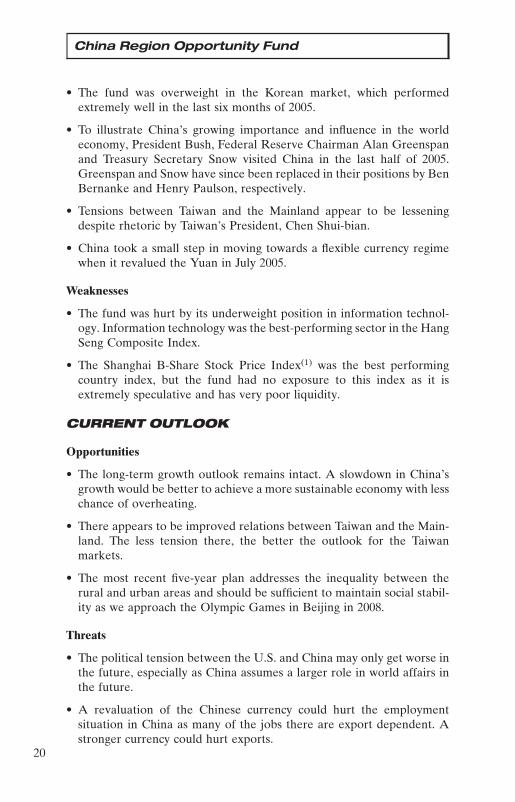
• The fund was overweight in the Korean market, which performedextremely well in the last six months of 2005.
• To illustrate China’s growing importance and influence in the worldeconomy, President Bush, Federal Reserve Chairman Alan Greenspanand Treasury Secretary Snow visited China in the last half of 2005.Greenspan and Snow have since been replaced in their positions by BenBernanke and Henry Paulson, respectively.
• Tensions between Taiwan and the Mainland appear to be lesseningdespite rhetoric by Taiwan’s President, Chen Shui-bian.
• China took a small step in moving towards a flexible currency regimewhen it revalued the Yuan in July 2005.
Weaknesses
• The fund was hurt by its underweight position in information technol-ogy. Information technology was the best-performing sector in the HangSeng Composite Index.
• The Shanghai B-Share Stock Price Index(1) was the best performingcountry index, but the fund had no exposure to this index as it isextremely speculative and has very poor liquidity.
CURRENT OUTLOOK
Opportunities
• The long-term growth outlook remains intact. A slowdown in China’sgrowth would be better to achieve a more sustainable economy with lesschance of overheating.
• There appears to be improved relations between Taiwan and the Main-land. The less tension there, the better the outlook for the Taiwanmarkets.
• The most recent five-year plan addresses the inequality between therural and urban areas and should be sufficient to maintain social stabil-ity as we approach the Olympic Games in Beijing in 2008.
Threats
• The political tension between the U.S. and China may only get worse inthe future, especially as China assumes a larger role in world affairs inthe future.
• A revaluation of the Chinese currency could hurt the employmentsituation in China as many of the jobs there are export dependent. Astronger currency could hurt exports.
�20

China Region Opportunity Fund
• Kim Jong Il remains a threat so long as he remains the leader of NorthKorea. There seldom appears to be any rationale for some of hisrhetoric or actions.
• Historically, China’s boom periods have been followed by bust periods.The reacceleration of the economy and the government’s response tosuch strong growth could lead to problems in later time periods.
(1)The Shanghai B-Share Stock Price Index is a capitalization-weighted index. Theindex tracks the daily price performance of all shares listed on the Shanghai StockExchange that are available for investment by foreign investors. The index ispriced in US dollars.
(2)The Hang Seng China Enterprises Index is a capitalization-weighted index com-prised of state-owned Chinese companies (H-Shares) listed on the Hong KongStock Exchange and included in HSMLCI index.
Top 10 Equity Holdings Based on Total Investments June 30, 2006
PETROCHINA CO., LTD. 3.06%OIL & GAS - INTEGRATED
FOCUS MEDIA HOLDING LTD. 3.00%ADVERTISING
HSBC HOLDINGS PLC 2.97%BANKS
CTRIP.COM INTERNATIONAL LTD. 2.89%E-COMMERCE / SERVICES
HONG KONG & CHINA GAS CO., LTD. 2.80%GAS DISTRIBUTION
KEPPEL CORP., LTD. 2.63%DIVERSIFIED OPERATIONS
SILVERCORP METALS, INC. 2.49%SILVER MINING
CATHAY FINANCIAL HOLDING CO., LTD. 2.48%FINANCIAL SERVICES
CHINA MOBILE (HONG KONG) LTD. 2.43%CELLULAR TELECOMMUNICATIONS
HYUNDAI HEAVY INDUSTRIES CO., LTD. 2.38%SHIPBUILDING
�21
China Region Opportunity Fund
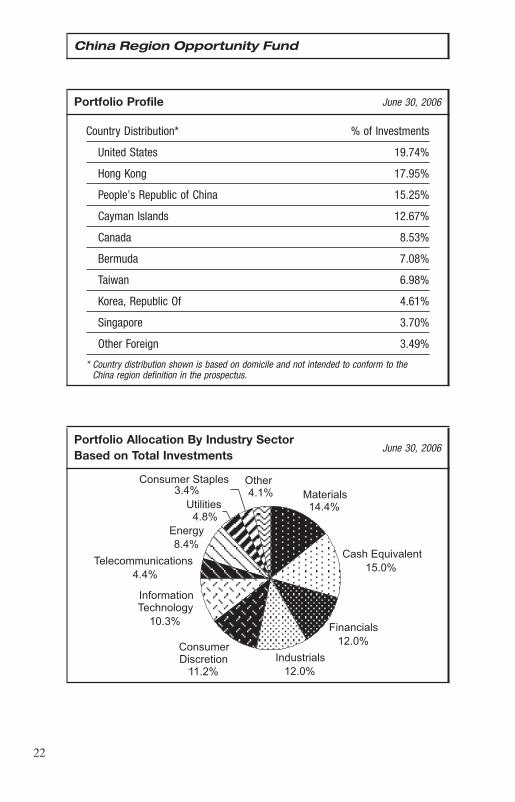
Portfolio Profile June 30, 2006
Country Distribution* % of Investments
United States 19.74%
Hong Kong 17.95%
People’s Republic of China 15.25%
Cayman Islands 12.67%
Canada 8.53%
Bermuda 7.08%
Taiwan 6.98%
Korea, Republic Of 4.61%
Singapore 3.70%
Other Foreign 3.49%
* Country distribution shown is based on domicile and not intended to conform to theChina region definition in the prospectus.
Portfolio Allocation By Industry SectorBased on Total Investments
June 30, 2006
0��1�����,*����1�&�'
<*���*��1�&#'
(���5+#&�'
�������������*���1�&�'
�4����*�����������5+
�$&�'
0��1����3�1���*���
��&!'
/*����&�' ��*�����1
��&�'
0�1��()��2����*�"&$'
��������1�!&$'
� �1*����1�!&$'
�22

Management Team’s Perspective
Global Resources Fund
INTRODUCTION
The Global Resources Fund is a diversified natural resources fund with theprincipal objective of achieving long-term growth of capital, while provid-ing protection against inflation and monetary instability. The fund investsin companies involved in the exploration, production, transportation, andprocessing of petroleum, natural gas, industrial commodities, metals, min-erals, paper and forest products and can invest in any part of the world.
PERFORMANCE GRAPH
Global Resources Fund
=��;���7�1�����1��� ������$
���
,-.�"$$� � ���!��"$,-.�(���5+��� ���*�����1� � ��!!�!�"
�����
������
������
�����
�����
�����
�����
������
������
���� ���� ���� ���� ���� ���� ��� ��� ���� ���� ����
Average Annual Performance For the Years EndedJune 30, 2006
One Year Five Year Ten YearGlobal Resources Fund 48.91% 38.89% 15.27%
S&P 500 Index 8.63% 2.49% 8.31%
S&P Energy and Materials Index 24.17% 14.11% 12.59%Performance data quoted above is historical. Past performance is no guarantee of futureresults. Current performance may be higher or lower than the performance data quoted.Investment return and principal value of an investment will fluctuate so that an investor’sshares, when redeemed, may be worth more or less than their original cost.The graph and table do not reflect the deduction of taxes that a shareholder would pay on funddistributions or the redemption of fund shares.The S&P 500 Index is a widely recognized capitalization-weighted index of 500 commonstock prices in U.S. companies. The S&P Energy and Materials Index is a combination of theS&P Energy Index and the S&P Materials Index calculated on a 70% and 30% weighting,respectively, with monthly rebalancing of weights.
�23
Global Resources Fund
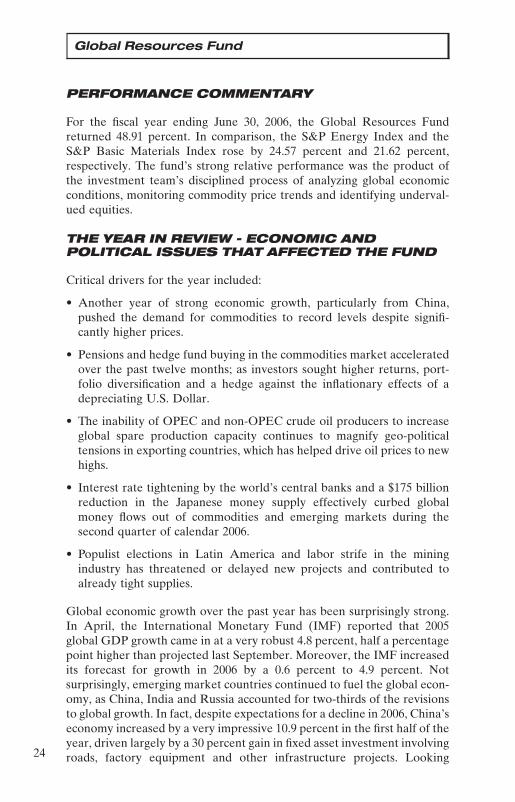
PERFORMANCE COMMENTARY
For the fiscal year ending June 30, 2006, the Global Resources Fundreturned 48.91 percent. In comparison, the S&P Energy Index and theS&P Basic Materials Index rose by 24.57 percent and 21.62 percent,respectively. The fund’s strong relative performance was the product ofthe investment team’s disciplined process of analyzing global economicconditions, monitoring commodity price trends and identifying underval-ued equities.
THE YEAR IN REVIEW - ECONOMIC ANDPOLITICAL ISSUES THAT AFFECTED THE FUND
Critical drivers for the year included:
• Another year of strong economic growth, particularly from China,pushed the demand for commodities to record levels despite signifi-cantly higher prices.
• Pensions and hedge fund buying in the commodities market acceleratedover the past twelve months; as investors sought higher returns, port-folio diversification and a hedge against the inflationary effects of adepreciating U.S. Dollar.
• The inability of OPEC and non-OPEC crude oil producers to increaseglobal spare production capacity continues to magnify geo-politicaltensions in exporting countries, which has helped drive oil prices to newhighs.
• Interest rate tightening by the world’s central banks and a $175 billionreduction in the Japanese money supply effectively curbed globalmoney flows out of commodities and emerging markets during thesecond quarter of calendar 2006.
• Populist elections in Latin America and labor strife in the miningindustry has threatened or delayed new projects and contributed toalready tight supplies.
Global economic growth over the past year has been surprisingly strong.In April, the International Monetary Fund (IMF) reported that 2005global GDP growth came in at a very robust 4.8 percent, half a percentagepoint higher than projected last September. Moreover, the IMF increasedits forecast for growth in 2006 by a 0.6 percent to 4.9 percent. Notsurprisingly, emerging market countries continued to fuel the global econ-omy, as China, India and Russia accounted for two-thirds of the revisionsto global growth. In fact, despite expectations for a decline in 2006, China’seconomy increased by a very impressive 10.9 percent in the first half of theyear, driven largely by a 30 percent gain in fixed asset investment involvingroads, factory equipment and other infrastructure projects. Looking�24

Global Resources Fund
ahead, we expect the U.S. and global economy to slow moderately in 2007mainly due to the lagged effects of global monetary tightening and higheroil prices; however, we expect growth will be more than sufficient to drivefurther demand for commodities.
One area of concern going forward is the recent acceleration in inflationduring the second half of the year. The core Consumer Price Index(excluding food and energy) posted its fourth consecutive monthly gain of0.3 percent in June, its strongest pace since the first quarter of 1995.Additionally, the overall annual rate of inflation climbed to 4.3 percent byJune. These factors raise the concern that the Fed may have to increaserates considerably more than the current 5.25 percent. However, there aresigns that Fed Chairman Ben Bernanke may be forced to end the currentrate tightening campaign given recent weakness in housing and expecta-tions for slower consumer spending this fall.
INVESTMENT HIGHLIGHTS
Strengths
• Precious metals hit multi-year highs with gold up 41 percent and silvergaining 57 percent over the past 12 months. Strong performance of themetals was the key driver for precious metals equities - the PhiladelphiaStock Exchange Gold & Silver Index(1) gained 56 percent.
• Base metal prices hit record highs in the Spring of 2006 on strongdemand and declining global inventories. Annual price gains for copper,nickel, and zinc were 123 percent, 46 percent and 162 percent respec-tively. As a result, the S&P/TSX Metals & Mining Index(2) gained 77percent.
• Crude oil prices gained 30 percent over the past year to $73.93 onincreasing global demand growth of 1.3 percent and rising geo-politicaltensions that have curtailed or threaten to curtail supply growth; theAMEX Major Oil Index(3) increased 30 percent.
• The fund built a significant position in oil service and equipment equi-ties, which gained 44 percent during the period due to a rising rig count,higher day-rates and improving margins.
• World export steel prices climbed 49 percent over the past year as steelconsumption in China surged. The fund did not fully participate in thestrong rally for steel stocks during the period, mainly due to rapidlygrowing steel capacity in China, which could have weakened prices.
�25
Global Resources Fund
Weaknesses
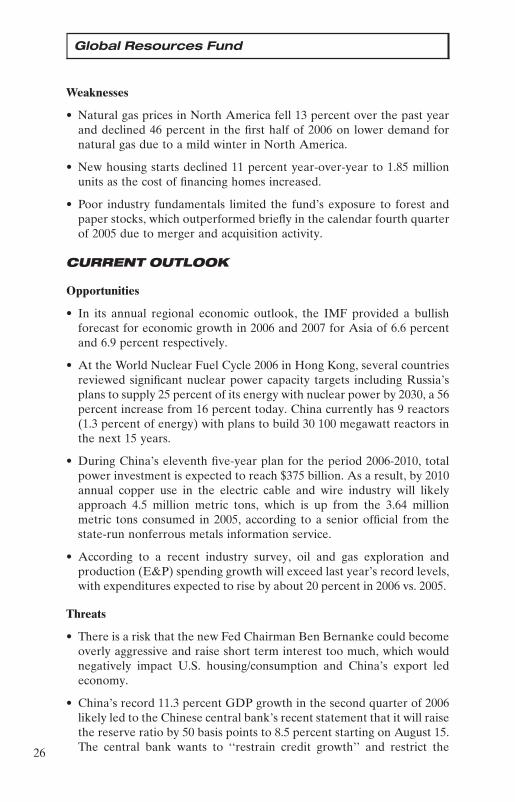
• Natural gas prices in North America fell 13 percent over the past yearand declined 46 percent in the first half of 2006 on lower demand fornatural gas due to a mild winter in North America.
• New housing starts declined 11 percent year-over-year to 1.85 millionunits as the cost of financing homes increased.
• Poor industry fundamentals limited the fund’s exposure to forest andpaper stocks, which outperformed briefly in the calendar fourth quarterof 2005 due to merger and acquisition activity.
CURRENT OUTLOOK
Opportunities
• In its annual regional economic outlook, the IMF provided a bullishforecast for economic growth in 2006 and 2007 for Asia of 6.6 percentand 6.9 percent respectively.
• At the World Nuclear Fuel Cycle 2006 in Hong Kong, several countriesreviewed significant nuclear power capacity targets including Russia’splans to supply 25 percent of its energy with nuclear power by 2030, a 56percent increase from 16 percent today. China currently has 9 reactors(1.3 percent of energy) with plans to build 30 100 megawatt reactors inthe next 15 years.
• During China’s eleventh five-year plan for the period 2006-2010, totalpower investment is expected to reach $375 billion. As a result, by 2010annual copper use in the electric cable and wire industry will likelyapproach 4.5 million metric tons, which is up from the 3.64 millionmetric tons consumed in 2005, according to a senior official from thestate-run nonferrous metals information service.
• According to a recent industry survey, oil and gas exploration andproduction (E&P) spending growth will exceed last year’s record levels,with expenditures expected to rise by about 20 percent in 2006 vs. 2005.
Threats
• There is a risk that the new Fed Chairman Ben Bernanke could becomeoverly aggressive and raise short term interest too much, which wouldnegatively impact U.S. housing/consumption and China’s export ledeconomy.
• China’s record 11.3 percent GDP growth in the second quarter of 2006likely led to the Chinese central bank’s recent statement that it will raisethe reserve ratio by 50 basis points to 8.5 percent starting on August 15.The central bank wants to ‘‘restrain credit growth’’ and restrict the�26

Global Resources Fund
circulation of capital, the statement said. The ratio was last raised onJune 16, 2006, by 0.5 basis points.
• U.S. natural gas storage inventories at 2,542 billion cubic feet, which is32 percent ahead of normal levels and 20 percent ahead of last year. Thiscould weigh on natural gas prices through the end of the storageinjection season until winter weather begins.
• The Energy Information Administration reported coal stocks at domes-tic utilities rose to 133.2 million tons (up 6 percent from 125.1 in April2006). Mild winter weather and a positive supply response have driventhe increasing stockpiles which could weigh on coal prices.
• Rising commodity prices and higher corporate profits are garneringmore attention from labor unions and developing countries who aredemanding higher wages and stronger production sharing contracts andincreased tax rates.
(1)The Philadelphia Stock Exchange Gold & Silver Index (XAU) is a capitalization-weighted index that includes the leading companies involved in the mining of goldand silver.
(2)The S&P/TSX Metals & Mining Index is a modified capitalization-weightedindex, whose equity weights are capped 25 percent and index constituents arederived from a subset stock pool of S&P/TSX Composite Index stocks.
(3)The AMEX Major Oil Index is a price-weighted index, measuring the perfor-mance of the oil industry through changes in the sum of the prices of componentstocks.
�27
Global Resources Fund
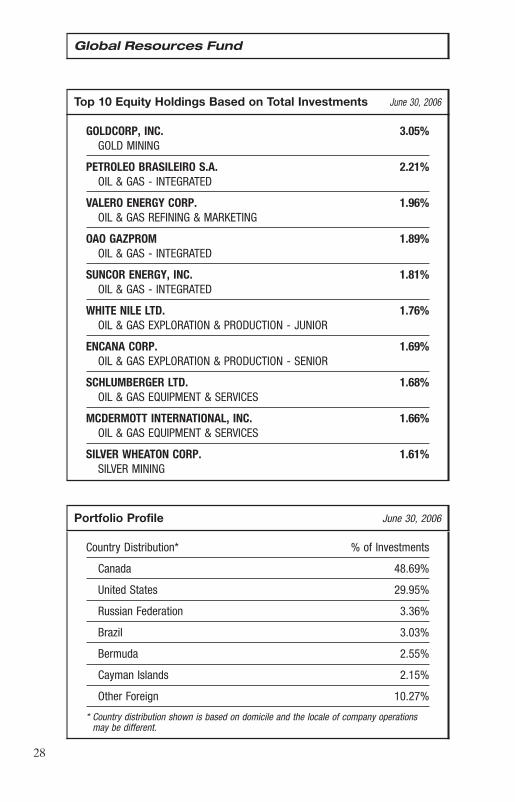
Top 10 Equity Holdings Based on Total Investments June 30, 2006
GOLDCORP, INC. 3.05%GOLD MINING
PETROLEO BRASILEIRO S.A. 2.21%OIL & GAS - INTEGRATED
VALERO ENERGY CORP. 1.96%OIL & GAS REFINING & MARKETING
OAO GAZPROM 1.89%OIL & GAS - INTEGRATED
SUNCOR ENERGY, INC. 1.81%OIL & GAS - INTEGRATED
WHITE NILE LTD. 1.76%OIL & GAS EXPLORATION & PRODUCTION - JUNIOR
ENCANA CORP. 1.69%OIL & GAS EXPLORATION & PRODUCTION - SENIOR
SCHLUMBERGER LTD. 1.68%OIL & GAS EQUIPMENT & SERVICES
MCDERMOTT INTERNATIONAL, INC. 1.66%OIL & GAS EQUIPMENT & SERVICES
SILVER WHEATON CORP. 1.61%SILVER MINING
Portfolio Profile June 30, 2006
Country Distribution* % of Investments
Canada 48.69%
United States 29.95%
Russian Federation 3.36%
Brazil 3.03%
Bermuda 2.55%
Cayman Islands 2.15%
Other Foreign 10.27%
* Country distribution shown is based on domicile and the locale of company operationsmay be different.
�28
Global Resources Fund
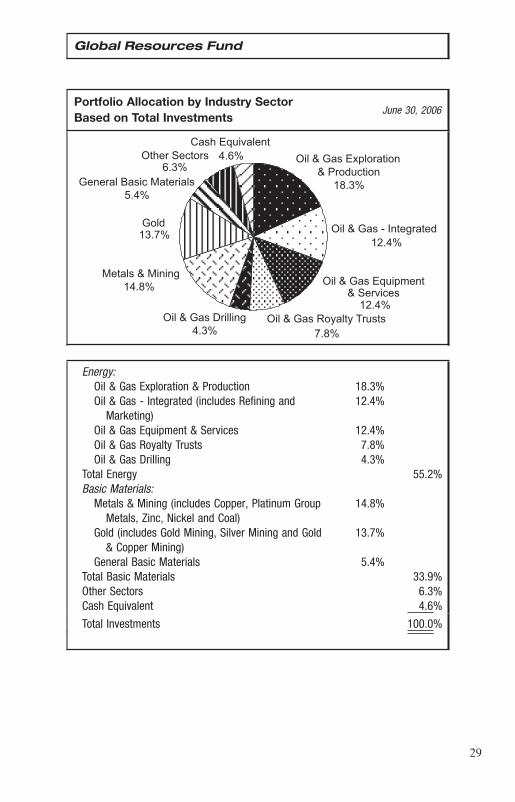
Portfolio Allocation by Industry SectorBased on Total Investments
June 30, 2006
/���-�=�1��� �*�5��*� �!&�'
��*��1�-������5��&#'
/���-�=�1�3������5�&�'
=�� ��&�'
=���������1�����*�����1"&�'
/*����,��*��1�&�'
0�1��()��2����*�&�' /���-�=�1�(�����*���
-�.�� ��*����#&�'
/���-�=�1�()������*-�,��2���1
�!&�'/���-�=�1�7�+��*+����1*1
�&#'
Energy:Oil & Gas Exploration & Production 18.3%Oil & Gas - Integrated (includes Refining and 12.4%
Marketing)Oil & Gas Equipment & Services 12.4%Oil & Gas Royalty Trusts 7.8%Oil & Gas Drilling 4.3%
Total Energy 55.2%Basic Materials:
Metals & Mining (includes Copper, Platinum Group 14.8%Metals, Zinc, Nickel and Coal)
Gold (includes Gold Mining, Silver Mining and Gold 13.7%& Copper Mining)
General Basic Materials 5.4%Total Basic Materials 33.9%Other Sectors 6.3%Cash Equivalent 4.6%
Total Investments 100.0%
�29
Management Team’s Perspective
Gold and Precious Minerals Funds
INTRODUCTION
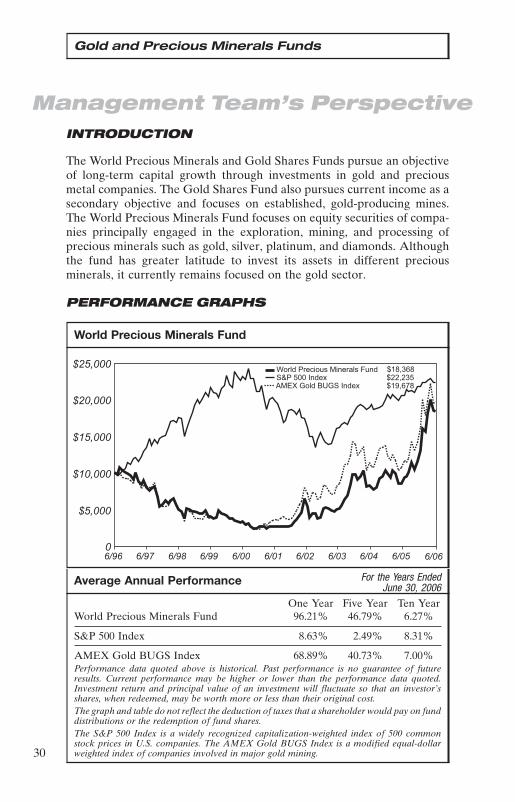
The World Precious Minerals and Gold Shares Funds pursue an objectiveof long-term capital growth through investments in gold and preciousmetal companies. The Gold Shares Fund also pursues current income as asecondary objective and focuses on established, gold-producing mines.The World Precious Minerals Fund focuses on equity securities of compa-nies principally engaged in the exploration, mining, and processing ofprecious minerals such as gold, silver, platinum, and diamonds. Althoughthe fund has greater latitude to invest its assets in different preciousminerals, it currently remains focused on the gold sector.
PERFORMANCE GRAPHS
World Precious Minerals Fund
���
>��� �.������1��������1��� ��#���#,-.�"$$� � �
������#%�(?�=�� ��<=,� � ��!!�!�"
�����
������
������
�����
�����
���� ���� ���� ���� ���� ���� ��� ��� ���� ���� ����
Average Annual Performance For the Years EndedJune 30, 2006
One Year Five Year Ten YearWorld Precious Minerals Fund 96.21% 46.79% 6.27%
S&P 500 Index 8.63% 2.49% 8.31%
AMEX Gold BUGS Index 68.89% 40.73% 7.00%Performance data quoted above is historical. Past performance is no guarantee of futureresults. Current performance may be higher or lower than the performance data quoted.Investment return and principal value of an investment will fluctuate so that an investor’sshares, when redeemed, may be worth more or less than their original cost.The graph and table do not reflect the deduction of taxes that a shareholder would pay on funddistributions or the redemption of fund shares.The S&P 500 Index is a widely recognized capitalization-weighted index of 500 commonstock prices in U.S. companies. The AMEX Gold BUGS Index is a modified equal-dollarweighted index of companies involved in major gold mining.�30
Gold and Precious Minerals Funds
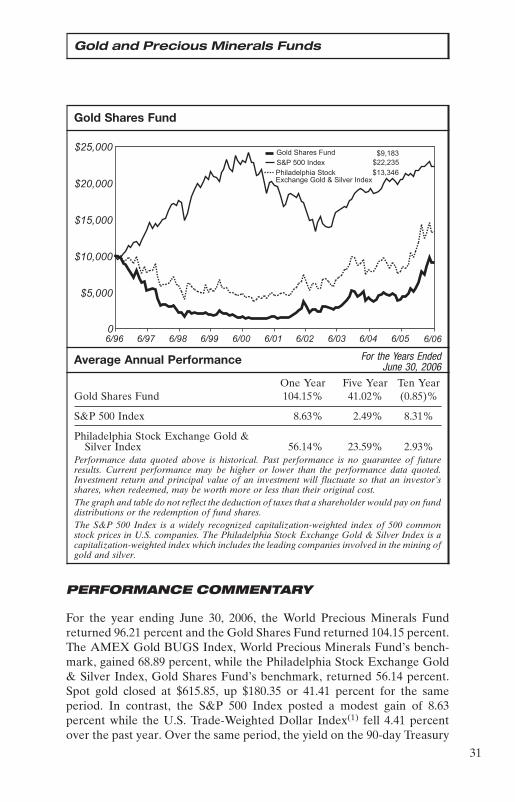
Gold Shares Fund
=�� �,����1��� ����#�
���
,-.�"$$� � ��������.���� �������,*��:
(����5��=�� �-�,��2��� � �
�!!�!�"
���� ���� ���� ���� ���� ���� ��� ��� ���� ���� ����
�����
������
������
�����
�����
Average Annual Performance For the Years EndedJune 30, 2006
One Year Five Year Ten YearGold Shares Fund 104.15% 41.02% (0.85)%
S&P 500 Index 8.63% 2.49% 8.31%
Philadelphia Stock Exchange Gold &Silver Index 56.14% 23.59% 2.93%
Performance data quoted above is historical. Past performance is no guarantee of futureresults. Current performance may be higher or lower than the performance data quoted.Investment return and principal value of an investment will fluctuate so that an investor’sshares, when redeemed, may be worth more or less than their original cost.The graph and table do not reflect the deduction of taxes that a shareholder would pay on funddistributions or the redemption of fund shares.The S&P 500 Index is a widely recognized capitalization-weighted index of 500 commonstock prices in U.S. companies. The Philadelphia Stock Exchange Gold & Silver Index is acapitalization-weighted index which includes the leading companies involved in the mining ofgold and silver.
PERFORMANCE COMMENTARY
For the year ending June 30, 2006, the World Precious Minerals Fundreturned 96.21 percent and the Gold Shares Fund returned 104.15 percent.The AMEX Gold BUGS Index, World Precious Minerals Fund’s bench-mark, gained 68.89 percent, while the Philadelphia Stock Exchange Gold& Silver Index, Gold Shares Fund’s benchmark, returned 56.14 percent.Spot gold closed at $615.85, up $180.35 or 41.41 percent for the sameperiod. In contrast, the S&P 500 Index posted a modest gain of 8.63percent while the U.S. Trade-Weighted Dollar Index(1) fell 4.41 percentover the past year. Over the same period, the yield on the 90-day Treasury
�31

Gold and Precious Minerals Funds
bill jumped almost 60 percent, tacking on 186 basis points to finish at 4.98percent.
Our investment process is an active management style versus a morepassive indexing approach. This is what has allowed us to create value forour shareholders. Over the past year, we have made several criticalinvestment decisions which generated superior relative performance:
1. We focused on mid-cap unhedged gold producers.
2. We also concentrated our investments in companies that producedtwo metals, i.e., copper-gold porphyry deposits, such as Goldcorp,Inc.;(2) Northern Orion Resources, Inc.;(3) and Yamana Gold, Inc.(4)
In addition, we believe silver deposits will be more strategic overtime and have been an early investor in companies like Silver Whea-ton Corp.(5) and Silvercorp Metals, Inc.(6)
3. We invested in companies reflecting the three critical growth drivers:(a) Increasing reserves(b) Increasing production(c) Increasing cash flow
4. We looked for undervalued junior gold companies with inexpensiveresource ounces in the ground.
5. We wanted to own companies wherein a rising gold price wouldgreatly increase their reserve base and net asset value.
6. We searched for companies that were undervalued on a relative peergroup basis for several fundamental metrics; i.e., ounce per share,production per share, net asset value per share, and cash flowmultiples.
7. We used statistical models to manage the price risk of the portfolios,looking for significant moves where the probability of a price reversalis high, and adjusted our cash position accordingly.
YEAR IN REVIEW - ECONOMIC AND POLITICALISSUES THAT AFFECTED THE FUNDS
Critical drivers for the year include:
• Major gold producers are reporting a declining production profile.According to the South Africa’s Chamber of Mines, their gold produc-tion fell to an 82-year low in 2005, further tightening worldwide supply.
�32

Gold and Precious Minerals Funds
• Total production costs are climbing due to currency effects, higher laborcosts, rising general and administrative costs, higher royalties at highergold prices, and bigger exploration budgets. This has contributed tolowering the profitability of the gold industry, particularly when inves-tors have been looking for higher profits to be achieved.
• Resource and reserve quality has also fallen. Despite that greatervolumes of ore have been processed at the mines; the average grade ofthe ore has fallen close to 20 percent over the last five years.
• Political changes in Peru, Bolivia and ongoing Chavez style politics inVenezuela combined with at least 12 countries going to the polls in LatinAmerica in 2006 may signal a change for the worse in trying to advancenew projects in the region.
• Investment demand for gold and silver has grown substantially over thepast year. For the streetTracks Gold Trust(7) ETF, assets invested in goldhave climbed by 198 percent to $7.33 billion in the last year with physicalholdings of about 12 million ounces of gold. The iShares Silver Trust(8)
ETF which started trading at the end of April has accumulated approxi-mately 90 million ounces of silver purchases over its first two-months oftrading.
INVESTMENT HIGHLIGHTS
Strengths
• The price of gold eclipsed a 25-year high in May 2006. Gold FieldsMineral Services (GFMS), a consulting group, forecast in its annualsurvey released in April that gold prices could surge past $800 an ouncein 2006 under the right circumstances.
• GFMS noted that sentiment within the central bank community seemsto have changed, and more recent comments reflect the importance ofgold as a reserve asset.
• At the London Bullion Market Association’s Precious Metals Confer-ence held in November, Maria Gueguina, Head of External ReservesManagement for the Russian Central bank, made a statement that theywant to raise their gold holdings to 10 percent of their reserves.
Weaknesses
• While gold was making higher highs, the majority of the gold stockscontinue to lag the price performance of gold bullion. Interestingly,when gold had one of its biggest falls in recent history as we closed outthe year, gold-backed exchange traded funds actually experienced anincrease in their holdings in bullion. �33

Gold and Precious Minerals Funds
• Gold equities, as measured by the Philadelphia Stock Exchange Gold &Silver Index, are up 12.14 percent over the last six months; however,they have underperformed the 19.12 percent return that gold bullion hasdelivered over this period.
• In a major contraction of the monetary base, Japan’s central bankslashed roughly $175 billion in reserves from the system during the lastthree months. Much of this money was invested abroad via the Euro-Yen market where cheap capital to hedge funds and investment bankshad been funneled. This triggered a rout in commodity and emergingmarkets as we closed out the period.
CURRENT OUTLOOK
Opportunities
• A recent study released by M. Murenbeeld & Associates examined thelength of gold cycles going back to 1800. It found that the average lengthof a decline was just over 19 years with the most recent decline being 21years. The average rising period for gold has been just over 25 years withthe most recent period, 1970 to 1980, being only 10 years in length. Wemay only be four years into the current cycle.
• An economic research group in China suggested that their governmentshould quadruple its gold reserves from 600 tonnes to 2,400 tonnes toreflect China’s status as a major trading nation. Currently, gold accountsfor 1.3 percent of China’s reserves while the global average is closer to10.5 percent.
• Fund flows into commodities have been very strong and could go higherwith pension funds entering the game. The recent note that AIG GlobalInvestment Group’s(9) Japan unit may invest $4.4 billion or 3 percent ofassets into commodity related investments over the next five years asthey seek to diversify from stocks and bonds should help to sustain therally in commodities as they add to positions. Only two percent of fundmanagers are estimated to have exposure to gold. Dr. Marc Faber, aninvestment strategist and author specializing in Asian and commoditiesmarkets, recently noted that dramatic commodity markets all originatedafter extended bear markets and that gold prices soared more than 20-fold and oil rose 8-fold from 1970 to 1980.
Threats
• The European Central Bank had put a 6-month halt on it gold salesprogram in March 2006. This is set to expire in September 2006, and thismay overshadow the gold market as that period expires.
�34
Gold and Precious Minerals Funds
• The gold contango has widened from about 350 basis points to almost560 basis points over the past 12 months, making forward sales of goldmore attractive, but we have not seen any momentum shift to forwardselling at this time.
• As we closed out the year, it became apparent that most of the weakhands have exited the gold market and that buyers who missed the mostrecent run in gold were on the sidelines waiting for just such an opportu-nity to build their gold positions. However, for the gold stocks, buyinginterest seemed to have been concentrated in the senior gold stocksversus the more junior gold stocks, perhaps indicating a lack of commit-ment to the sector at this time.
(1)The U.S. Trade Weighted Dollar Index provides a general indication of theinternational value of the U.S. dollar. (2)This security comprised 17.94% of the total net assets of the World PreciousMinerals Fund and 23.56% of the total net assets of the Gold Shares Fund as of June30, 2006. (3)This security comprised 5.53% of the total net assets of the World PreciousMinerals Fund and 5.53% of the total net assets of the Gold Shares Fund as of June30, 2006. (4)This security comprised 3.16% of the total net assets of the World PreciousMinerals Fund and 3.94% of the total net assets of the Gold Shares Fund as of June30, 2006. (5)This security comprised 3.52% of the total net assets of the World PreciousMinerals Fund and 2.26% of the total net assets of the Gold Shares Fund as of June30, 2006. (6)This security comprised 1.63% of the total net assets of the World PreciousMinerals Fund and 0.00% of the total net assets of the Gold Shares Fund as of June30, 2006. (7)This security comprised 0.56% of the total net assets of the World PreciousMinerals Fund and 0.05% of the total net assets of the Gold Shares Fund as of June30, 2006. (8)This security comprised 0.24% of the total net assets of the World PreciousMinerals Fund and 0.00% of the total net assets of the Gold Shares Fund as of June30, 2006. (9)Neither World Precious Minerals Fund nor the Gold Shares Fund held thissecurity as of June 30, 2006.
�35
Gold and Precious Minerals Funds
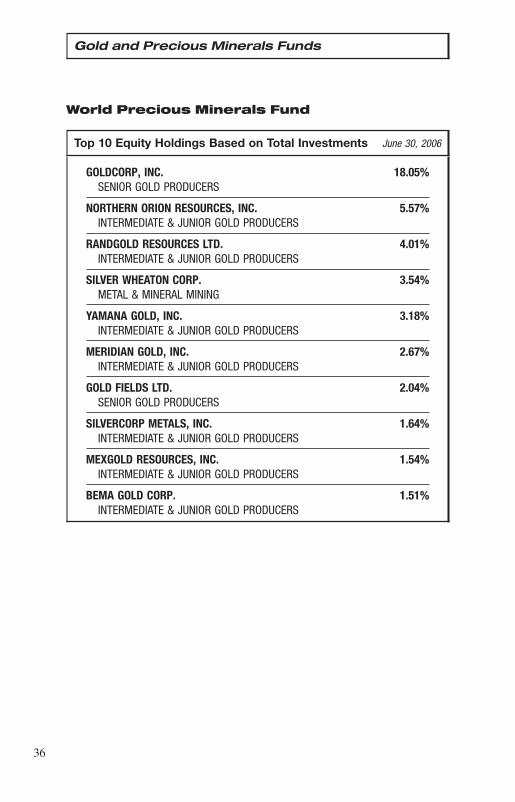
World Precious Minerals Fund
Top 10 Equity Holdings Based on Total Investments June 30, 2006
GOLDCORP, INC. 18.05%SENIOR GOLD PRODUCERS
NORTHERN ORION RESOURCES, INC. 5.57%INTERMEDIATE & JUNIOR GOLD PRODUCERS
RANDGOLD RESOURCES LTD. 4.01%INTERMEDIATE & JUNIOR GOLD PRODUCERS
SILVER WHEATON CORP. 3.54%METAL & MINERAL MINING
YAMANA GOLD, INC. 3.18%INTERMEDIATE & JUNIOR GOLD PRODUCERS
MERIDIAN GOLD, INC. 2.67%INTERMEDIATE & JUNIOR GOLD PRODUCERS
GOLD FIELDS LTD. 2.04%SENIOR GOLD PRODUCERS
SILVERCORP METALS, INC. 1.64%INTERMEDIATE & JUNIOR GOLD PRODUCERS
MEXGOLD RESOURCES, INC. 1.54%INTERMEDIATE & JUNIOR GOLD PRODUCERS
BEMA GOLD CORP. 1.51%INTERMEDIATE & JUNIOR GOLD PRODUCERS
�36
Gold and Precious Minerals Funds
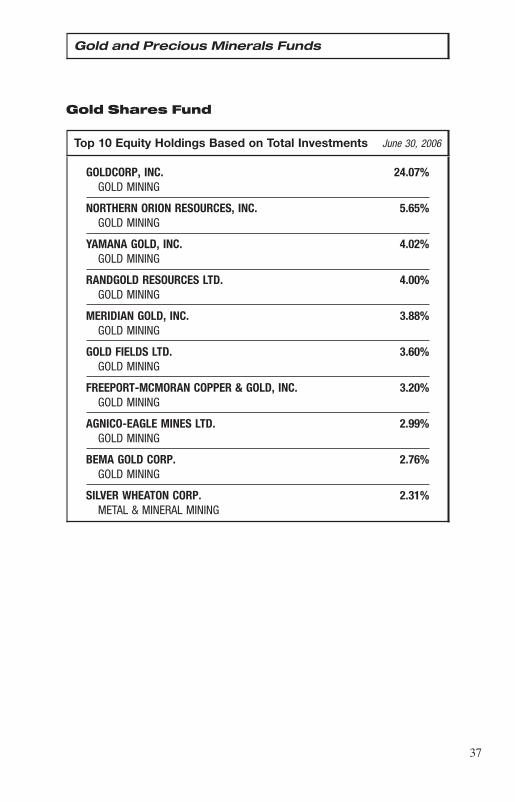
Gold Shares Fund
Top 10 Equity Holdings Based on Total Investments June 30, 2006
GOLDCORP, INC. 24.07%GOLD MINING
NORTHERN ORION RESOURCES, INC. 5.65%GOLD MINING
YAMANA GOLD, INC. 4.02%GOLD MINING
RANDGOLD RESOURCES LTD. 4.00%GOLD MINING
MERIDIAN GOLD, INC. 3.88%GOLD MINING
GOLD FIELDS LTD. 3.60%GOLD MINING
FREEPORT-MCMORAN COPPER & GOLD, INC. 3.20%GOLD MINING
AGNICO-EAGLE MINES LTD. 2.99%GOLD MINING
BEMA GOLD CORP. 2.76%GOLD MINING
SILVER WHEATON CORP. 2.31%METAL & MINERAL MINING
�37
Gold and Precious Minerals Funds
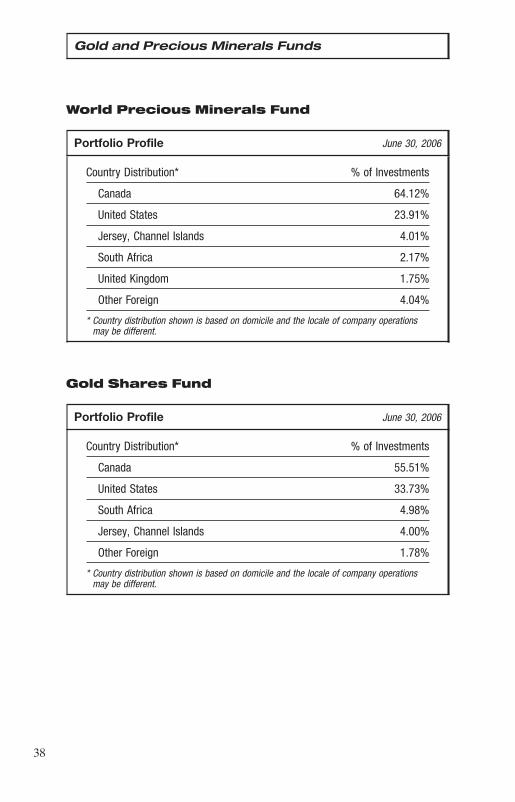
World Precious Minerals Fund
Portfolio Profile June 30, 2006
Country Distribution* % of Investments
Canada 64.12%
United States 23.91%
Jersey, Channel Islands 4.01%
South Africa 2.17%
United Kingdom 1.75%
Other Foreign 4.04%
* Country distribution shown is based on domicile and the locale of company operationsmay be different.
Gold Shares Fund
Portfolio Profile June 30, 2006
Country Distribution* % of Investments
Canada 55.51%
United States 33.73%
South Africa 4.98%
Jersey, Channel Islands 4.00%
Other Foreign 1.78%
* Country distribution shown is based on domicile and the locale of company operationsmay be different.
�38

Gold and Precious Minerals Funds
World Precious Minerals FundPortfolio Allocation by IndustryBased on Total Investments
June 30, 2006
=�� @��������(�����*����-3�2�������*
��&�'
��*���-��������������5"&#'
/*����&�'
0�1��()��2����*��&�'
�*���� ��*��-�8������=�� .�� ����1
!�&�'
,������=�� �.�� ����1!�&!'
Gold Shares FundPortfolio Allocation by IndustryBased on Total Investments
June 30, 2006
/*����&�'
=�� ������5�#&$'
0�1��()��2����*!�&#'
��*���-��������������5!&�'
�39

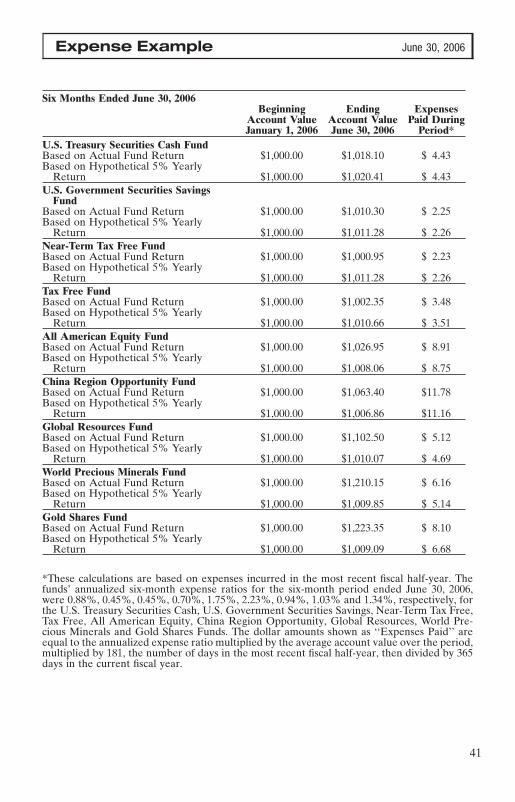
Expense Example June 30, 2006
As a shareholder of the funds, you incur two types of costs: (1) transaction costs,including short-term trading fees and exchange fees; and (2) ongoing costs, includ-ing management fees and other fund expenses. This example is intended to help youunderstand your ongoing costs (in dollars) of investing in other mutual funds.
The example is based on an investment of $1,000 invested at the beginning of theperiod and held for the entire period as indicated below.
• Actual Expenses. The first line of the following table for each fund providesinformation about actual account values and actual expenses. You may use theinformation in this line, together with the amount you invested, to estimate theexpenses you paid over the period. Simply divide your account value by $1,000(for example, an $8,600 account value divided by $1,000 = 8.6), then multiply theresult by the number in the first line under the heading ‘‘Expenses Paid DuringPeriod’’ to estimate the expenses you paid on your account during this period.
• Hypothetical Example for Comparison Purposes. The second line of the follow-ing table for each fund provides information about hypothetical account valuesand hypothetical expenses based on the fund’s actual expense ratio and anassumed rate of return of 5 percent per year before expenses, which is not thefund’s actual return. The hypothetical account values and expenses may not beused to estimate the actual ending account balance or expenses you paid for theperiod. You may use this information to compare the ongoing costs of investing inthese funds and other funds. To do so, compare this 5 percent hypotheticalexample with the 5 percent hypothetical examples that appear in the shareholderreports of other funds.
Please note that the expenses shown in the table are meant to highlight yourongoing costs only and do not reflect any direct or transactional costs, such as smallaccount, exchange or short-term trading fees. Therefore, the second line of the tableis useful in comparing ongoing costs only, and will not help you determine therelative total costs of owning different funds. In addition, if these direct or transac-tional costs were included, your costs would have been higher.
�40
Expense Example June 30, 2006
Six Months Ended June 30, 2006Beginning Ending Expenses
Account Value Account Value Paid DuringJanuary 1, 2006 June 30, 2006 Period*
U.S. Treasury Securities Cash FundBased on Actual Fund Return $1,000.00 $1,018.10 $ 4.43Based on Hypothetical 5% Yearly
Return $1,000.00 $1,020.41 $ 4.43U.S. Government Securities Savings
FundBased on Actual Fund Return $1,000.00 $1,010.30 $ 2.25Based on Hypothetical 5% Yearly
Return $1,000.00 $1,011.28 $ 2.26Near-Term Tax Free FundBased on Actual Fund Return $1,000.00 $1,000.95 $ 2.23Based on Hypothetical 5% Yearly
Return $1,000.00 $1,011.28 $ 2.26Tax Free FundBased on Actual Fund Return $1,000.00 $1,002.35 $ 3.48Based on Hypothetical 5% Yearly
Return $1,000.00 $1,010.66 $ 3.51All American Equity FundBased on Actual Fund Return $1,000.00 $1,026.95 $ 8.91Based on Hypothetical 5% Yearly
Return $1,000.00 $1,008.06 $ 8.75China Region Opportunity FundBased on Actual Fund Return $1,000.00 $1,063.40 $11.78Based on Hypothetical 5% Yearly
Return $1,000.00 $1,006.86 $11.16Global Resources FundBased on Actual Fund Return $1,000.00 $1,102.50 $ 5.12Based on Hypothetical 5% Yearly
Return $1,000.00 $1,010.07 $ 4.69World Precious Minerals FundBased on Actual Fund Return $1,000.00 $1,210.15 $ 6.16Based on Hypothetical 5% Yearly
Return $1,000.00 $1,009.85 $ 5.14Gold Shares FundBased on Actual Fund Return $1,000.00 $1,223.35 $ 8.10Based on Hypothetical 5% Yearly
Return $1,000.00 $1,009.09 $ 6.68
*These calculations are based on expenses incurred in the most recent fiscal half-year. Thefunds’ annualized six-month expense ratios for the six-month period ended June 30, 2006,were 0.88%, 0.45%, 0.45%, 0.70%, 1.75%, 2.23%, 0.94%, 1.03% and 1.34%, respectively, forthe U.S. Treasury Securities Cash, U.S. Government Securities Savings, Near-Term Tax Free,Tax Free, All American Equity, China Region Opportunity, Global Resources, World Pre-cious Minerals and Gold Shares Funds. The dollar amounts shown as ‘‘Expenses Paid’’ areequal to the annualized expense ratio multiplied by the average account value over the period,multiplied by 181, the number of days in the most recent fiscal half-year, then divided by 365days in the current fiscal year.
�41

U.S. TREASURY SECURITIES CASH FUND
Portfolio of Investments June 30, 2006
UNITED STATESGOVERNMENT Coupon Maturity PrincipalOBLIGATIONS 54.25% Rate Date Amount Value
United States Treasury Bills 33.43%Yield 4.71% 07/06/06 $ 10,000,000 $ 9,993,458Yield 4.57% 07/27/06 20,000,000 19,934,169Yield 4.91% 10/05/06 10,000,000 9,870,867
39,798,494
United States Treasury Notes 20.82%3.50% 11/15/06 10,000,000 9,954,077
3.125% 01/31/07 10,000,000 9,890,0123.625% 04/30/07 5,000,000 4,934,679
24,778,768
Total United States Government Obligations 64,577,262
(cost $64,577,262)
REPURCHASE AGREEMENTS 45.75%
Joint Tri-Party Repurchase Agreements,06/30/06, collateralized by U.S. Treasurysecurities held in joint tri-partyrepurchase accounts:
4.40% Bear Stearns, repurchase price$25,009,167 4.40% 07/03/06 25,000,000 25,000,000
4.50% Morgan Stanley Dean Witter,repurchase price $29,464,465 4.50% 07/03/06 29,453,420 29,453,420
Total Repurchase Agreements 54,453,420
(cost $54,453,420)
Total Investments 100.00% 119,030,682
(cost $119,030,682)Other assets and liabilities, net 0.00% (2,366)
NET ASSETS 100% $119,028,316
See notes to portfolios of investments and notes to financial statements.
�42

U.S. GOVERNMENT SECURITIES SAVINGS FUND
Portfolio of Investments June 30, 2006
UNITED STATESGOVERNMENT AND AGENCY Coupon Maturity PrincipalOBLIGATIONS 99.76% Rate Date Amount Value
Federal Farm Credit Bank 27.35%Discount Notes:
Yield 4.95% 07/05/06 $ 10,000,000 $ 9,994,500Yield 4.99% 07/13/06 10,000,000 9,983,400Yield 5.15% 07/21/06 14,380,000 14,338,937Yield 5.18% 07/25/06 12,772,000 12,728,064Yield 4.72% 11/09/06 5,000,000 4,915,577
Fixed Rates:3.70% 07/05/06 6,900,000 6,899,2272.13% 07/17/06 7,000,000 6,992,5794.05% 08/11/06 3,000,000 2,999,9002.80% 08/16/06 2,000,000 1,995,9582.44% 09/01/06 1,000,000 995,1422.60% 09/07/06 6,000,000 5,978,5072.90% 09/29/06 2,500,000 2,490,7592.38% 10/02/06 3,884,000 3,858,7192.70% 11/24/06 5,000,000 4,961,1384.63% 12/27/06 4,000,000 4,000,4363.37% 12/28/06 2,000,000 1,984,1991.88% 01/16/07 10,170,000 9,983,4224.11% 02/02/07 5,000,000 4,964,514
Variable Rate:4.75% 01/03/07 9,000,000 9,001,747
119,066,725
Federal Home Loan Bank 72.41%Discount Notes:
Yield 4.95% 07/03/06 135,175,000 135,138,032Yield 5.00% 07/05/06 19,750,000 19,739,028Yield 5.07% 07/06/06 24,997,000 24,979,398Yield 5.08% 07/12/06 25,000,000 24,961,225Yield 5.18% 07/19/06 20,000,000 19,948,350Yield 5.21% 07/26/06 10,000,000 9,963,958
Fixed Rates:3.25% 07/21/06 4,000,000 3,998,4992.75% 07/28/06 4,000,000 3,996,4772.50% 08/14/06 4,350,000 4,340,2033.50% 08/15/06 1,000,000 998,1922.95% 09/14/06 1,595,000 1,587,6832.70% 09/29/06 2,000,000 1,990,2784.67% 09/29/06 2,000,000 1,996,8975.40% 10/25/06 1,000,000 1,001,1053.00% 11/06/06 1,585,000 1,575,9746.50% 11/15/06 1,400,000 1,406,976
See notes to portfolios of investments and notes to financial statements.
�43

U.S. GOVERNMENT SECURITIES SAVINGS FUND
Portfolio of Investments June 30, 2006
UNITED STATESGOVERNMENT AND Coupon Maturity PrincipalAGENCY OBLIGATIONS Rate Date Amount Value
Federal Home Loan Bank (Cont’d)3.25% 11/28/06 $ 1,000,000 $ 992,6174.28% 11/28/06 2,000,000 1,993,9662.75% 12/15/06 2,520,000 2,493,5173.38% 12/15/06 1,900,000 1,887,4742.65% 01/22/07 5,000,000 4,931,0744.70% 01/30/07 3,000,000 3,000,0002.80% 02/09/07 5,000,000 4,929,8995.00% 02/09/07 3,000,000 3,000,0002.50% 02/13/07 2,000,000 1,966,5385.08% 02/22/07 6,250,000 6,242,3153.75% 03/07/07 5,000,000 4,951,7882.85% 03/08/07 2,000,000 1,967,0444.00% 04/05/07 3,500,000 3,464,3014.00% 04/18/07 3,000,000 2,969,8373.17% 05/04/07 5,000,000 4,913,8992.63% 05/15/07 2,410,000 2,349,4253.03% 05/18/07 3,305,000 3,241,851
Step Coupons:3.50% 11/24/06 1,400,000 1,396,1003.00% 12/22/06 1,000,000 990,224
315,304,144
Total Investments 99.76% 434,370,869
(cost $434,370,869)Other assets and liabilities, net 0.24% 1,046,370
NET ASSETS 100% $435,417,239
See notes to portfolios of investments and notes to financial statements.
�44
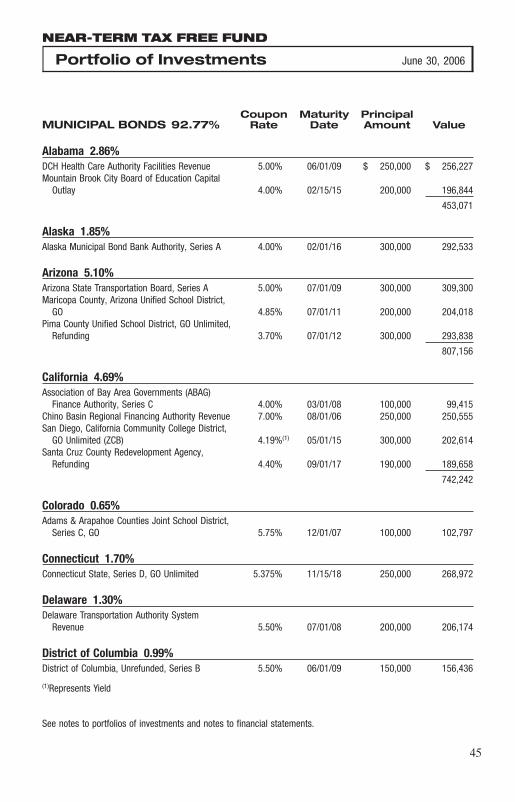
NEAR-TERM TAX FREE FUND
Portfolio of Investments June 30, 2006
Coupon Maturity PrincipalMUNICIPAL BONDS 92.77% Rate Date Amount Value
Alabama 2.86%DCH Health Care Authority Facilities Revenue 5.00% 06/01/09 $ 250,000 $ 256,227Mountain Brook City Board of Education Capital
Outlay 4.00% 02/15/15 200,000 196,844
453,071
Alaska 1.85%Alaska Municipal Bond Bank Authority, Series A 4.00% 02/01/16 300,000 292,533
Arizona 5.10%Arizona State Transportation Board, Series A 5.00% 07/01/09 300,000 309,300Maricopa County, Arizona Unified School District,
GO 4.85% 07/01/11 200,000 204,018Pima County Unified School District, GO Unlimited,
Refunding 3.70% 07/01/12 300,000 293,838
807,156
California 4.69%Association of Bay Area Governments (ABAG)
Finance Authority, Series C 4.00% 03/01/08 100,000 99,415Chino Basin Regional Financing Authority Revenue 7.00% 08/01/06 250,000 250,555San Diego, California Community College District,
GO Unlimited (ZCB) 4.19%(1) 05/01/15 300,000 202,614Santa Cruz County Redevelopment Agency,
Refunding 4.40% 09/01/17 190,000 189,658
742,242
Colorado 0.65%Adams & Arapahoe Counties Joint School District,
Series C, GO 5.75% 12/01/07 100,000 102,797
Connecticut 1.70%Connecticut State, Series D, GO Unlimited 5.375% 11/15/18 250,000 268,972
Delaware 1.30%Delaware Transportation Authority System
Revenue 5.50% 07/01/08 200,000 206,174
District of Columbia 0.99%District of Columbia, Unrefunded, Series B 5.50% 06/01/09 150,000 156,436
(1)Represents Yield
See notes to portfolios of investments and notes to financial statements.
�45
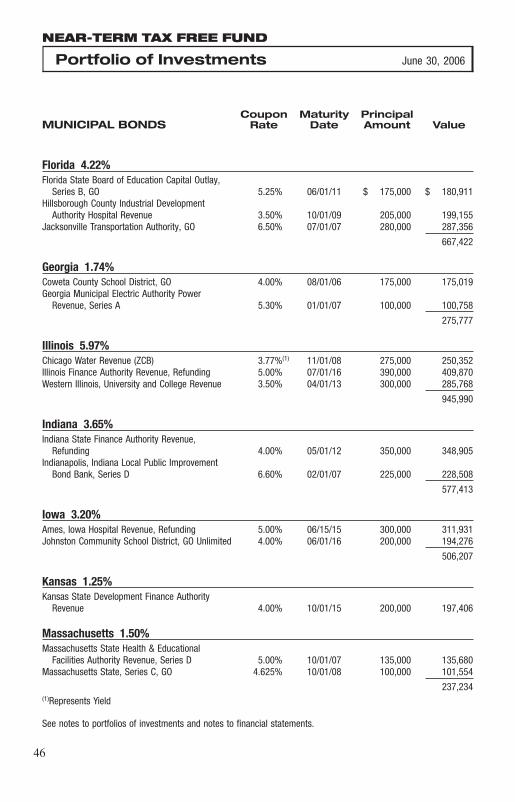
NEAR-TERM TAX FREE FUND
Portfolio of Investments June 30, 2006
Coupon Maturity PrincipalMUNICIPAL BONDS Rate Date Amount Value
Florida 4.22%Florida State Board of Education Capital Outlay,
Series B, GO 5.25% 06/01/11 $ 175,000 $ 180,911Hillsborough County Industrial Development
Authority Hospital Revenue 3.50% 10/01/09 205,000 199,155Jacksonville Transportation Authority, GO 6.50% 07/01/07 280,000 287,356
667,422
Georgia 1.74%Coweta County School District, GO 4.00% 08/01/06 175,000 175,019Georgia Municipal Electric Authority Power
Revenue, Series A 5.30% 01/01/07 100,000 100,758
275,777
Illinois 5.97%Chicago Water Revenue (ZCB) 3.77%(1) 11/01/08 275,000 250,352Illinois Finance Authority Revenue, Refunding 5.00% 07/01/16 390,000 409,870Western Illinois, University and College Revenue 3.50% 04/01/13 300,000 285,768
945,990
Indiana 3.65%Indiana State Finance Authority Revenue,
Refunding 4.00% 05/01/12 350,000 348,905Indianapolis, Indiana Local Public Improvement
Bond Bank, Series D 6.60% 02/01/07 225,000 228,508
577,413
Iowa 3.20%Ames, Iowa Hospital Revenue, Refunding 5.00% 06/15/15 300,000 311,931Johnston Community School District, GO Unlimited 4.00% 06/01/16 200,000 194,276
506,207
Kansas 1.25%Kansas State Development Finance Authority
Revenue 4.00% 10/01/15 200,000 197,406
Massachusetts 1.50%Massachusetts State Health & Educational
Facilities Authority Revenue, Series D 5.00% 10/01/07 135,000 135,680Massachusetts State, Series C, GO 4.625% 10/01/08 100,000 101,554
237,234(1)Represents Yield
See notes to portfolios of investments and notes to financial statements.
�46

NEAR-TERM TAX FREE FUND
Portfolio of Investments June 30, 2006
Coupon Maturity PrincipalMUNICIPAL BONDS Rate Date Amount Value
Michigan 0.83%Detroit, Michigan Local Development Financial
Authority, Series A 5.20% 05/01/10 $ 130,000 $ 131,552
Mississippi 1.87%Mississippi Hospital Equipment & Facilities
Authority Revenue 3.45% 04/01/07 300,000 296,442
Missouri 1.46%Missouri State Health & Educational Facilities
Authority Revenue, Series A 6.75% 05/15/13 200,000 231,264
Nevada 2.85%North Las Vegas, GO Limited 4.00% 03/01/16 200,000 192,368Washoe County Gas & Water Facilities Revenue 6.30% 12/01/14 250,000 258,945
451,313
New Jersey 6.29%Brigantine, New Jersey School Improvements, GO
Unlimited 3.50% 01/15/13 300,000 286,263New Jersey State 5.125% 05/01/10 250,000 260,485New Jersey State Transportation Trust Fund
Authority, Series D 4.00% 06/15/14 250,000 247,148Washington Township Board of Education, GO 5.10% 02/01/08 200,000 201,546
995,442
New York 10.34%Hempstead Township, Series B, GO Unlimited Tax 5.375% 11/15/10 120,000 123,758New York City Transitional Financial Authority
Revenue, Series A 5.25% 11/01/08 225,000 232,268New York, New York, Series B 5.25% 08/01/09 200,000 207,090New York, New York, Series C 3.50% 08/01/07 300,000 299,184New York State, GO 5.00% 03/01/08 250,000 254,710New York State, Local Highway & Bridge, Series A 5.375% 04/01/10 200,000 207,140Schenectady Metroplex Development Authority
Revenue, Series A 5.00% 12/15/12 110,000 112,167Tobacco Settlement Financing Corp., Series B 4.00% 06/01/07 200,000 200,470
1,636,787
See notes to portfolios of investments and notes to financial statements.
�47
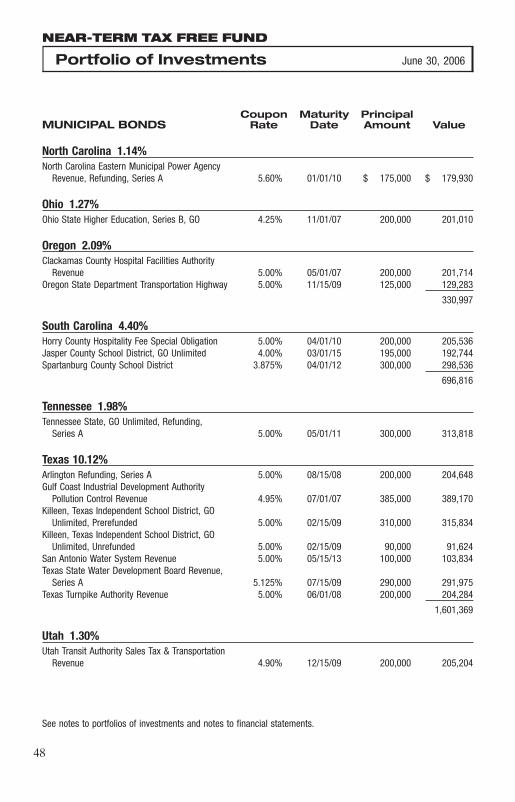
NEAR-TERM TAX FREE FUND
Portfolio of Investments June 30, 2006
Coupon Maturity PrincipalMUNICIPAL BONDS Rate Date Amount Value
North Carolina 1.14%North Carolina Eastern Municipal Power Agency
Revenue, Refunding, Series A 5.60% 01/01/10 $ 175,000 $ 179,930
Ohio 1.27%Ohio State Higher Education, Series B, GO 4.25% 11/01/07 200,000 201,010
Oregon 2.09%Clackamas County Hospital Facilities Authority
Revenue 5.00% 05/01/07 200,000 201,714Oregon State Department Transportation Highway 5.00% 11/15/09 125,000 129,283
330,997
South Carolina 4.40%Horry County Hospitality Fee Special Obligation 5.00% 04/01/10 200,000 205,536Jasper County School District, GO Unlimited 4.00% 03/01/15 195,000 192,744Spartanburg County School District 3.875% 04/01/12 300,000 298,536
696,816
Tennessee 1.98%Tennessee State, GO Unlimited, Refunding,
Series A 5.00% 05/01/11 300,000 313,818
Texas 10.12%Arlington Refunding, Series A 5.00% 08/15/08 200,000 204,648Gulf Coast Industrial Development Authority
Pollution Control Revenue 4.95% 07/01/07 385,000 389,170Killeen, Texas Independent School District, GO
Unlimited, Prerefunded 5.00% 02/15/09 310,000 315,834Killeen, Texas Independent School District, GO
Unlimited, Unrefunded 5.00% 02/15/09 90,000 91,624San Antonio Water System Revenue 5.00% 05/15/13 100,000 103,834Texas State Water Development Board Revenue,
Series A 5.125% 07/15/09 290,000 291,975Texas Turnpike Authority Revenue 5.00% 06/01/08 200,000 204,284
1,601,369
Utah 1.30%Utah Transit Authority Sales Tax & Transportation
Revenue 4.90% 12/15/09 200,000 205,204
See notes to portfolios of investments and notes to financial statements.
�48
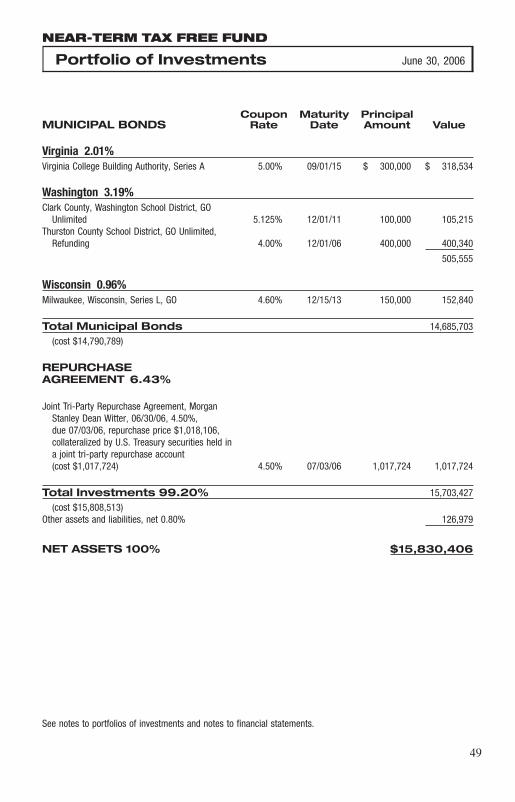
NEAR-TERM TAX FREE FUND
Portfolio of Investments June 30, 2006
Coupon Maturity PrincipalMUNICIPAL BONDS Rate Date Amount Value
Virginia 2.01%Virginia College Building Authority, Series A 5.00% 09/01/15 $ 300,000 $ 318,534
Washington 3.19%Clark County, Washington School District, GO
Unlimited 5.125% 12/01/11 100,000 105,215Thurston County School District, GO Unlimited,
Refunding 4.00% 12/01/06 400,000 400,340
505,555
Wisconsin 0.96%Milwaukee, Wisconsin, Series L, GO 4.60% 12/15/13 150,000 152,840
Total Municipal Bonds 14,685,703
(cost $14,790,789)
REPURCHASEAGREEMENT 6.43%
Joint Tri-Party Repurchase Agreement, MorganStanley Dean Witter, 06/30/06, 4.50%,due 07/03/06, repurchase price $1,018,106,collateralized by U.S. Treasury securities held ina joint tri-party repurchase account(cost $1,017,724) 4.50% 07/03/06 1,017,724 1,017,724
Total Investments 99.20% 15,703,427
(cost $15,808,513)Other assets and liabilities, net 0.80% 126,979
NET ASSETS 100% $15,830,406
See notes to portfolios of investments and notes to financial statements.
�49
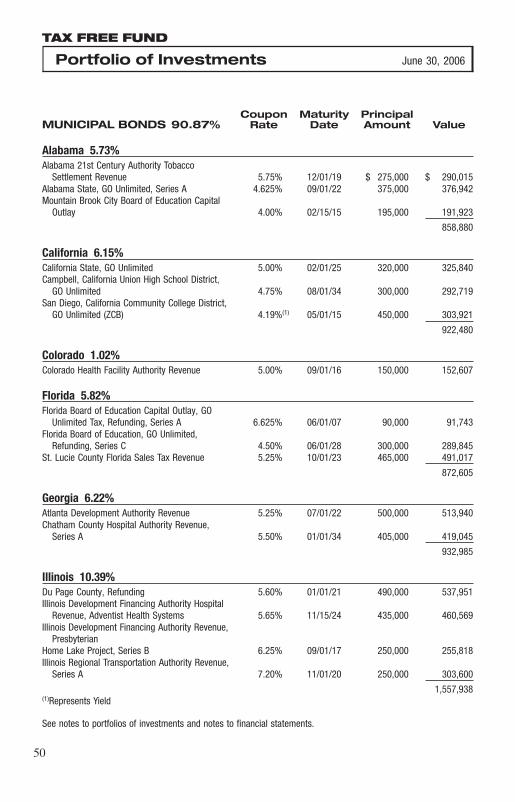
TAX FREE FUND
Portfolio of Investments June 30, 2006
Coupon Maturity PrincipalMUNICIPAL BONDS 90.87% Rate Date Amount Value
Alabama 5.73%Alabama 21st Century Authority Tobacco
Settlement Revenue 5.75% 12/01/19 $ 275,000 $ 290,015Alabama State, GO Unlimited, Series A 4.625% 09/01/22 375,000 376,942Mountain Brook City Board of Education Capital
Outlay 4.00% 02/15/15 195,000 191,923
858,880
California 6.15%California State, GO Unlimited 5.00% 02/01/25 320,000 325,840Campbell, California Union High School District,
GO Unlimited 4.75% 08/01/34 300,000 292,719San Diego, California Community College District,
GO Unlimited (ZCB) 4.19%(1) 05/01/15 450,000 303,921
922,480
Colorado 1.02%Colorado Health Facility Authority Revenue 5.00% 09/01/16 150,000 152,607
Florida 5.82%Florida Board of Education Capital Outlay, GO
Unlimited Tax, Refunding, Series A 6.625% 06/01/07 90,000 91,743Florida Board of Education, GO Unlimited,
Refunding, Series C 4.50% 06/01/28 300,000 289,845St. Lucie County Florida Sales Tax Revenue 5.25% 10/01/23 465,000 491,017
872,605
Georgia 6.22%Atlanta Development Authority Revenue 5.25% 07/01/22 500,000 513,940Chatham County Hospital Authority Revenue,
Series A 5.50% 01/01/34 405,000 419,045
932,985
Illinois 10.39%Du Page County, Refunding 5.60% 01/01/21 490,000 537,951Illinois Development Financing Authority Hospital
Revenue, Adventist Health Systems 5.65% 11/15/24 435,000 460,569Illinois Development Financing Authority Revenue,
PresbyterianHome Lake Project, Series B 6.25% 09/01/17 250,000 255,818Illinois Regional Transportation Authority Revenue,
Series A 7.20% 11/01/20 250,000 303,600
1,557,938(1)Represents Yield
See notes to portfolios of investments and notes to financial statements.
�50

TAX FREE FUND
Portfolio of Investments June 30, 2006
Coupon Maturity PrincipalMUNICIPAL BONDS Rate Date Amount Value
Iowa 1.95%Davenport, Iowa, GO Unlimited, Series A 4.375% 06/01/20 $ 300,000 $ 292,812
Kansas 9.12%Kansas State Development Finance Authority
Hospital Revenue, Series Z 5.00% 12/15/12 500,000 521,240Kansas State Development Finance Authority
Revenue 4.00% 10/01/15 250,000 246,758University of Kansas Hospital Authority Health
Facilities Revenue 5.625% 09/01/27 570,000 598,472
1,366,470
Maryland 2.10%Maryland State Health & Higher Educational
Facilities Authority Revenue 5.75% 07/01/21 300,000 314,805
Michigan 4.01%Detroit, Michigan Local Development Financing
Authority, Refunding, Series A 5.375% 05/01/18 300,000 302,901Macomb County Building Authority, GO Limited 4.50% 11/01/23 300,000 297,843
600,744
Missouri 2.79%St. Louis Airport Development Program,
Prerefunded, Series A 5.00% 07/01/11 165,000 172,770St. Louis Airport Development Program,
Unrefunded, Series A 5.00% 07/01/11 235,000 244,879
417,649
New Jersey 5.24%New Jersey Health Care Facilities Financing
Authority Revenue 4.375% 07/01/10 460,000 461,582New Jersey State Transportation Authority,
Series A 5.00% 06/15/13 315,000 324,623
786,205
New York 4.85%New York, GO Unlimited, Prerefunded, Series H 5.25% 03/15/14 445,000 463,961New York, GO Unlimited, Series J 5.00% 05/15/12 250,000 258,088New York, GO Unlimited, Unrefunded, Series H 5.25% 03/15/14 5,000 5,163
727,212
See notes to portfolios of investments and notes to financial statements.
�51
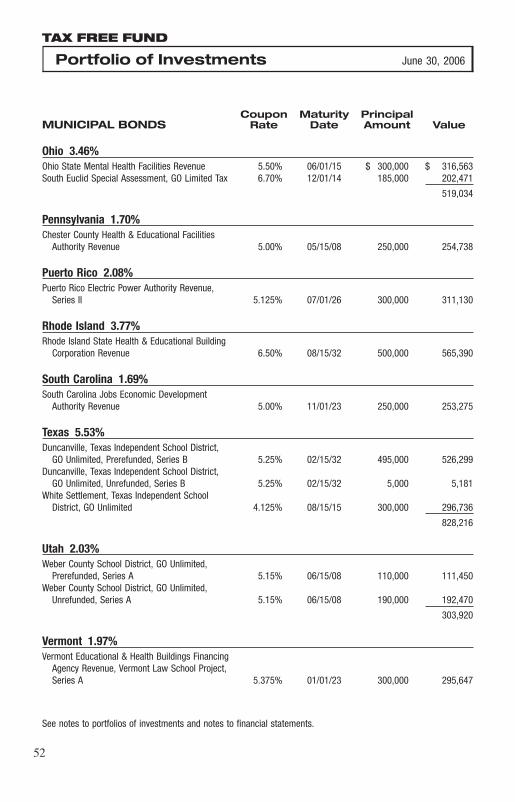
TAX FREE FUND
Portfolio of Investments June 30, 2006
Coupon Maturity PrincipalMUNICIPAL BONDS Rate Date Amount Value
Ohio 3.46%Ohio State Mental Health Facilities Revenue 5.50% 06/01/15 $ 300,000 $ 316,563South Euclid Special Assessment, GO Limited Tax 6.70% 12/01/14 185,000 202,471
519,034
Pennsylvania 1.70%Chester County Health & Educational Facilities
Authority Revenue 5.00% 05/15/08 250,000 254,738
Puerto Rico 2.08%Puerto Rico Electric Power Authority Revenue,
Series II 5.125% 07/01/26 300,000 311,130
Rhode Island 3.77%Rhode Island State Health & Educational Building
Corporation Revenue 6.50% 08/15/32 500,000 565,390
South Carolina 1.69%South Carolina Jobs Economic Development
Authority Revenue 5.00% 11/01/23 250,000 253,275
Texas 5.53%Duncanville, Texas Independent School District,
GO Unlimited, Prerefunded, Series B 5.25% 02/15/32 495,000 526,299Duncanville, Texas Independent School District,
GO Unlimited, Unrefunded, Series B 5.25% 02/15/32 5,000 5,181White Settlement, Texas Independent School
District, GO Unlimited 4.125% 08/15/15 300,000 296,736
828,216
Utah 2.03%Weber County School District, GO Unlimited,
Prerefunded, Series A 5.15% 06/15/08 110,000 111,450Weber County School District, GO Unlimited,
Unrefunded, Series A 5.15% 06/15/08 190,000 192,470
303,920
Vermont 1.97%Vermont Educational & Health Buildings Financing
Agency Revenue, Vermont Law School Project,Series A 5.375% 01/01/23 300,000 295,647
See notes to portfolios of investments and notes to financial statements.
�52

TAX FREE FUND
Portfolio of Investments June 30, 2006
Coupon Maturity PrincipalMUNICIPAL BONDS Rate Date Amount Value
Washington 3.25%King & Snohomish Counties’ School District,
Series C 5.00% 06/15/10 $ 250,000 $ 257,045Spokane County Washington School District, GO
Unlimited 5.05% 06/01/22 255,000 230,676
487,721
Total Municipal Bonds 13,622,463
(cost $13,269,204)
REPURCHASE AGREEMENT 12.19%
Joint Tri-Party Repurchase Agreement, MorganStanley Dean Witter, 06/30/06, 4.50%,due 07/03/06, repurchase price $1,827,961,collateralized by U.S. Treasury securities held ina joint tri-party repurchase account(cost $1,827,276) 4.50% 07/03/06 1,827,276 1,827,276
Total Investments 103.06% 15,449,739
(cost $15,096,480)Other assets and liabilities, net (3.06)% (458,207)
NET ASSETS 100% $14,991,532
See notes to portfolios of investments and notes to financial statements.
�53
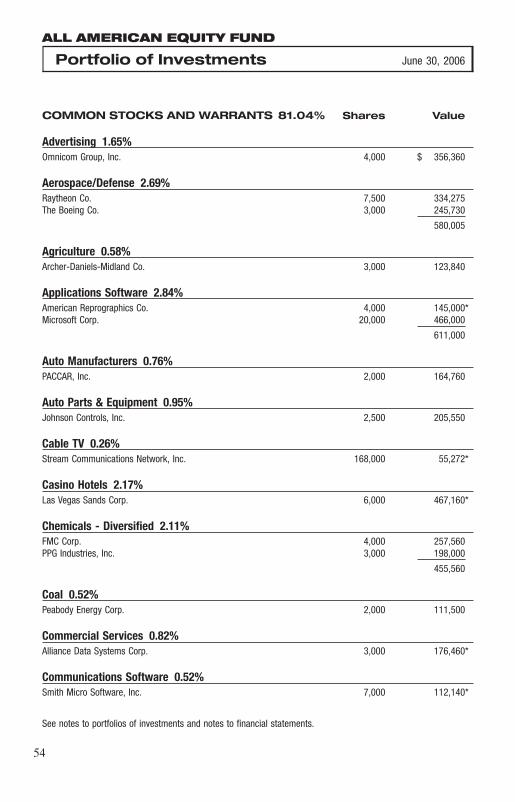
ALL AMERICAN EQUITY FUND
Portfolio of Investments June 30, 2006
COMMON STOCKS AND WARRANTS 81.04% Shares Value
Advertising 1.65%Omnicom Group, Inc. 4,000 $ 356,360
Aerospace/Defense 2.69%Raytheon Co. 7,500 334,275The Boeing Co. 3,000 245,730
580,005
Agriculture 0.58%Archer-Daniels-Midland Co. 3,000 123,840
Applications Software 2.84%American Reprographics Co. 4,000 145,000*Microsoft Corp. 20,000 466,000
611,000
Auto Manufacturers 0.76%PACCAR, Inc. 2,000 164,760
Auto Parts & Equipment 0.95%Johnson Controls, Inc. 2,500 205,550
Cable TV 0.26%Stream Communications Network, Inc. 168,000 55,272*
Casino Hotels 2.17%Las Vegas Sands Corp. 6,000 467,160*
Chemicals - Diversified 2.11%FMC Corp. 4,000 257,560PPG Industries, Inc. 3,000 198,000
455,560
Coal 0.52%Peabody Energy Corp. 2,000 111,500
Commercial Services 0.82%Alliance Data Systems Corp. 3,000 176,460*
Communications Software 0.52%Smith Micro Software, Inc. 7,000 112,140*
See notes to portfolios of investments and notes to financial statements.
�54
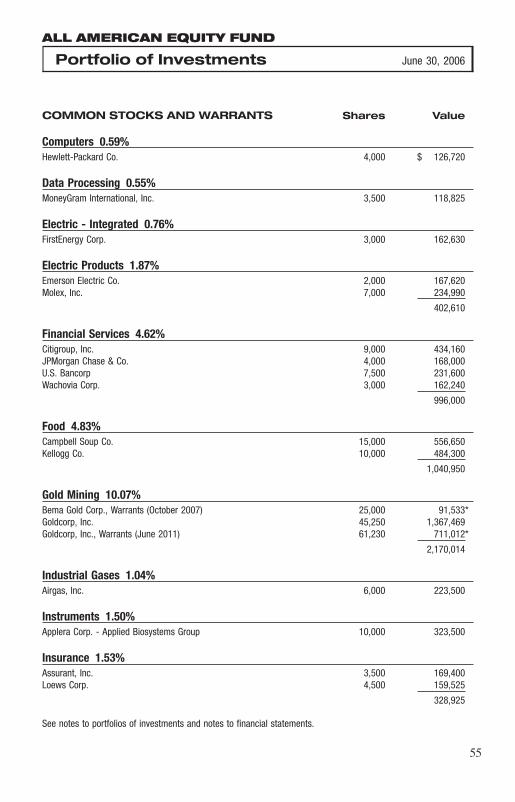
ALL AMERICAN EQUITY FUND
Portfolio of Investments June 30, 2006
COMMON STOCKS AND WARRANTS Shares Value
Computers 0.59%Hewlett-Packard Co. 4,000 $ 126,720
Data Processing 0.55%MoneyGram International, Inc. 3,500 118,825
Electric - Integrated 0.76%FirstEnergy Corp. 3,000 162,630
Electric Products 1.87%Emerson Electric Co. 2,000 167,620Molex, Inc. 7,000 234,990
402,610
Financial Services 4.62%Citigroup, Inc. 9,000 434,160JPMorgan Chase & Co. 4,000 168,000U.S. Bancorp 7,500 231,600Wachovia Corp. 3,000 162,240
996,000
Food 4.83%Campbell Soup Co. 15,000 556,650Kellogg Co. 10,000 484,300
1,040,950
Gold Mining 10.07%Bema Gold Corp., Warrants (October 2007) 25,000 91,533*Goldcorp, Inc. 45,250 1,367,469Goldcorp, Inc., Warrants (June 2011) 61,230 711,012*
2,170,014
Industrial Gases 1.04%Airgas, Inc. 6,000 223,500
Instruments 1.50%Applera Corp. - Applied Biosystems Group 10,000 323,500
Insurance 1.53%Assurant, Inc. 3,500 169,400Loews Corp. 4,500 159,525
328,925
See notes to portfolios of investments and notes to financial statements.
�55

ALL AMERICAN EQUITY FUND
Portfolio of Investments June 30, 2006
COMMON STOCKS AND WARRANTS Shares Value
Internet 1.87%Akamai Technologies, Inc. 9,000 $ 325,710*Stockgroup Information Systems, Inc. 181,625 78,095*
403,805
Machinery 1.37%Terex Corp. 3,000 296,100*
Medical - Drugs 0.63%Aspreva Pharmaceuticals Corp. 5,000 135,700*
Medical - HMO 1.71%WellCare Health Plans, Inc. 7,500 367,875*
Medical - Laboratories 0.72%Laboratory Corp. of America Holdings 2,500 155,575*
Medical - Products 1.95%Johnson & Johnson 7,000 419,440
Multimedia 3.96%News Corp., Class B 20,000 403,600The Walt Disney Co. 15,000 450,000
853,600
Oil & Gas - Integrated 0.74%Hess Corp. 3,000 158,550
Oil & Gas Drilling 0.93%Transocean, Inc. 2,500 200,800*
Oil & Gas Field Services 4.70%Superior Energy Services, Inc. 7,500 254,250*TETRA Technologies, Inc. 7,500 227,175*Universal Compression Holdings, Inc. 4,500 283,365*Weatherford International Ltd. 5,000 248,100*
1,012,890
See notes to portfolios of investments and notes to financial statements.
�56

ALL AMERICAN EQUITY FUND
Portfolio of Investments June 30, 2006
COMMON STOCKS AND WARRANTS Shares Value
Oil & Gas Refining & Marketing 1.31%Frontier Oil Corp. 5,000 $ 162,000Holly Corp. 2,500 120,500
282,500
Retail 8.89%J.C. Penney Co., Inc. 7,500 506,325Starbucks Corp. 8,000 302,080*The Clorox Co. 6,000 365,820The Pantry, Inc. 2,000 115,080*Under Armour, Inc., Class A 4,500 191,790*Wal-Mart Stores, Inc. 9,000 433,530
1,914,625
Semiconductors 1.81%Intel Corp. 12,000 227,400Lam Research Corp. 3,500 163,170*
390,570
Telecommunications 1.11%Tellabs, Inc. 18,000 239,580*
Telephone - Integrated 2.02%BellSouth Corp. 12,000 434,400
Tobacco 1.02%Altria Group, Inc. 3,000 220,290
Transportation 3.07%Burlington Northern Santa Fe Corp. 3,500 277,375FedEx Corp. 2,000 233,720Frontline Ltd. 4,000 151,400
662,495
Total Common Stocks and Warrants 17,462,076
(cost $15,924,714)
See notes to portfolios of investments and notes to financial statements.
�57
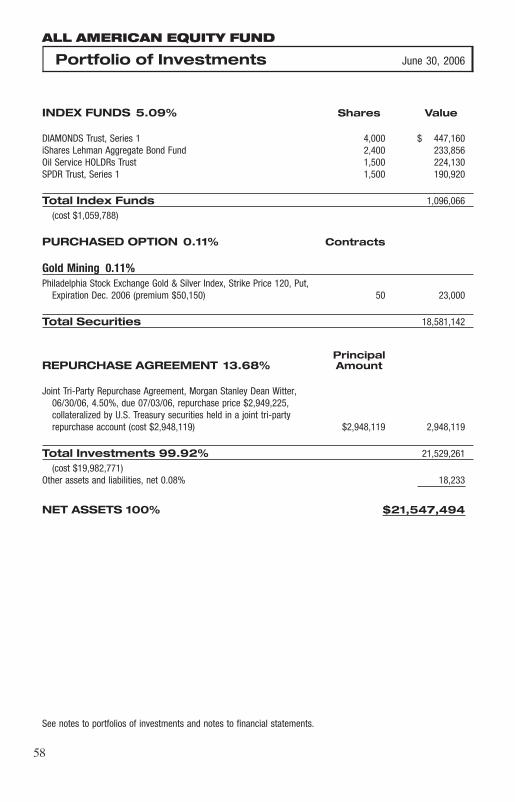
ALL AMERICAN EQUITY FUND
Portfolio of Investments June 30, 2006
INDEX FUNDS 5.09% Shares Value
DIAMONDS Trust, Series 1 4,000 $ 447,160iShares Lehman Aggregate Bond Fund 2,400 233,856Oil Service HOLDRs Trust 1,500 224,130SPDR Trust, Series 1 1,500 190,920
Total Index Funds 1,096,066
(cost $1,059,788)
PURCHASED OPTION 0.11% Contracts
Gold Mining 0.11%Philadelphia Stock Exchange Gold & Silver Index, Strike Price 120, Put,
Expiration Dec. 2006 (premium $50,150) 50 23,000
Total Securities 18,581,142
PrincipalREPURCHASE AGREEMENT 13.68% Amount
Joint Tri-Party Repurchase Agreement, Morgan Stanley Dean Witter,06/30/06, 4.50%, due 07/03/06, repurchase price $2,949,225,collateralized by U.S. Treasury securities held in a joint tri-partyrepurchase account (cost $2,948,119) $2,948,119 2,948,119
Total Investments 99.92% 21,529,261
(cost $19,982,771)Other assets and liabilities, net 0.08% 18,233
NET ASSETS 100% $21,547,494
See notes to portfolios of investments and notes to financial statements.
�58
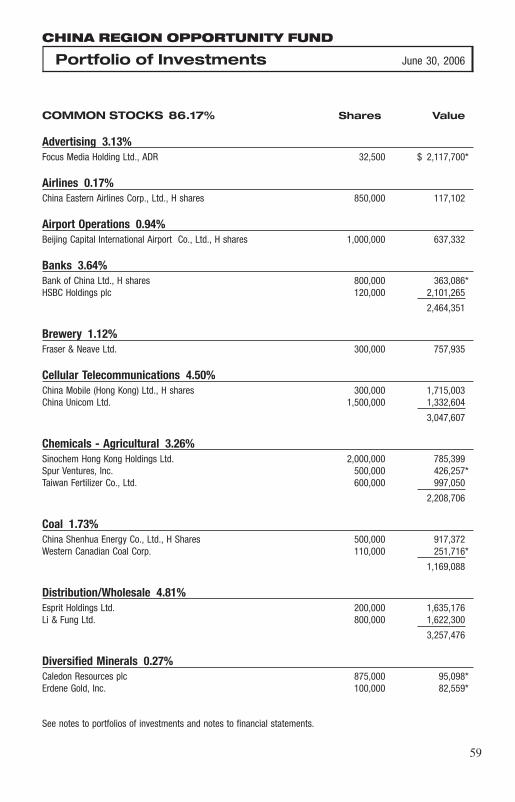
CHINA REGION OPPORTUNITY FUND
Portfolio of Investments June 30, 2006
COMMON STOCKS 86.17% Shares Value
Advertising 3.13%Focus Media Holding Ltd., ADR 32,500 $ 2,117,700*
Airlines 0.17%China Eastern Airlines Corp., Ltd., H shares 850,000 117,102
Airport Operations 0.94%Beijing Capital International Airport Co., Ltd., H shares 1,000,000 637,332
Banks 3.64%Bank of China Ltd., H shares 800,000 363,086*HSBC Holdings plc 120,000 2,101,265
2,464,351
Brewery 1.12%Fraser & Neave Ltd. 300,000 757,935
Cellular Telecommunications 4.50%China Mobile (Hong Kong) Ltd., H shares 300,000 1,715,003China Unicom Ltd. 1,500,000 1,332,604
3,047,607
Chemicals - Agricultural 3.26%Sinochem Hong Kong Holdings Ltd. 2,000,000 785,399Spur Ventures, Inc. 500,000 426,257*Taiwan Fertilizer Co., Ltd. 600,000 997,050
2,208,706
Coal 1.73%China Shenhua Energy Co., Ltd., H Shares 500,000 917,372Western Canadian Coal Corp. 110,000 251,716*
1,169,088
Distribution/Wholesale 4.81%Esprit Holdings Ltd. 200,000 1,635,176Li & Fung Ltd. 800,000 1,622,300
3,257,476
Diversified Minerals 0.27%Caledon Resources plc 875,000 95,098*Erdene Gold, Inc. 100,000 82,559*
See notes to portfolios of investments and notes to financial statements.
�59
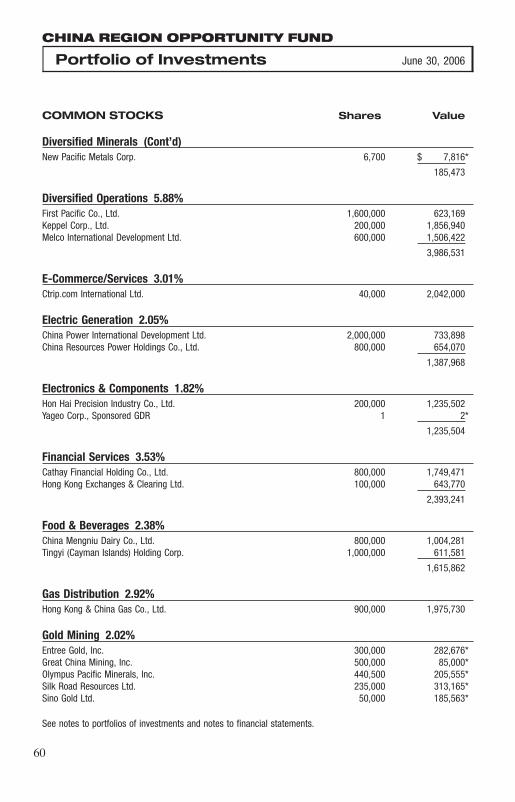
CHINA REGION OPPORTUNITY FUND
Portfolio of Investments June 30, 2006
COMMON STOCKS Shares Value
Diversified Minerals (Cont’d)New Pacific Metals Corp. 6,700 $ 7,816*
185,473
Diversified Operations 5.88%First Pacific Co., Ltd. 1,600,000 623,169Keppel Corp., Ltd. 200,000 1,856,940Melco International Development Ltd. 600,000 1,506,422
3,986,531
E-Commerce/Services 3.01%Ctrip.com International Ltd. 40,000 2,042,000
Electric Generation 2.05%China Power International Development Ltd. 2,000,000 733,898China Resources Power Holdings Co., Ltd. 800,000 654,070
1,387,968
Electronics & Components 1.82%Hon Hai Precision Industry Co., Ltd. 200,000 1,235,502Yageo Corp., Sponsored GDR 1 2*
1,235,504
Financial Services 3.53%Cathay Financial Holding Co., Ltd. 800,000 1,749,471Hong Kong Exchanges & Clearing Ltd. 100,000 643,770
2,393,241
Food & Beverages 2.38%China Mengniu Dairy Co., Ltd. 800,000 1,004,281Tingyi (Cayman Islands) Holding Corp. 1,000,000 611,581
1,615,862
Gas Distribution 2.92%Hong Kong & China Gas Co., Ltd. 900,000 1,975,730
Gold Mining 2.02%Entree Gold, Inc. 300,000 282,676*Great China Mining, Inc. 500,000 85,000*Olympus Pacific Minerals, Inc. 440,500 205,555*Silk Road Resources Ltd. 235,000 313,165*Sino Gold Ltd. 50,000 185,563*
See notes to portfolios of investments and notes to financial statements.
�60
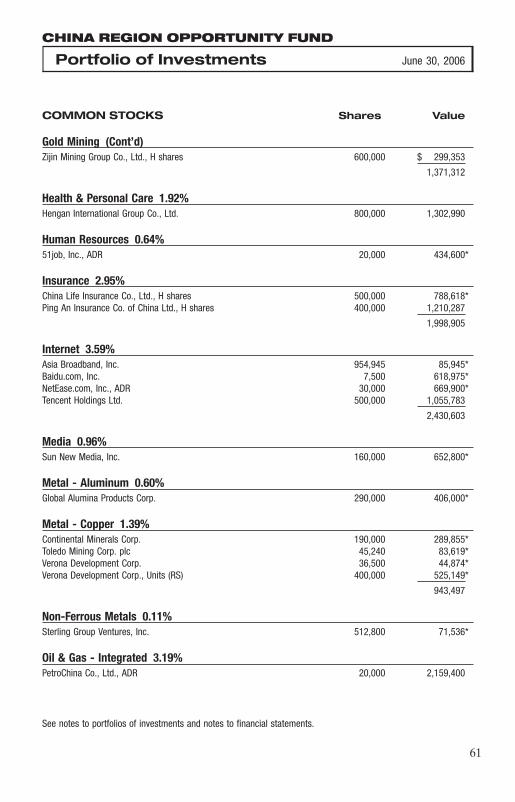
CHINA REGION OPPORTUNITY FUND
Portfolio of Investments June 30, 2006
COMMON STOCKS Shares Value
Gold Mining (Cont’d)Zijin Mining Group Co., Ltd., H shares 600,000 $ 299,353
1,371,312
Health & Personal Care 1.92%Hengan International Group Co., Ltd. 800,000 1,302,990
Human Resources 0.64%51job, Inc., ADR 20,000 434,600*
Insurance 2.95%China Life Insurance Co., Ltd., H shares 500,000 788,618*Ping An Insurance Co. of China Ltd., H shares 400,000 1,210,287
1,998,905
Internet 3.59%Asia Broadband, Inc. 954,945 85,945*Baidu.com, Inc. 7,500 618,975*NetEase.com, Inc., ADR 30,000 669,900*Tencent Holdings Ltd. 500,000 1,055,783
2,430,603
Media 0.96%Sun New Media, Inc. 160,000 652,800*
Metal - Aluminum 0.60%Global Alumina Products Corp. 290,000 406,000*
Metal - Copper 1.39%Continental Minerals Corp. 190,000 289,855*Toledo Mining Corp. plc 45,240 83,619*Verona Development Corp. 36,500 44,874*Verona Development Corp., Units (RS) 400,000 525,149*
943,497
Non-Ferrous Metals 0.11%Sterling Group Ventures, Inc. 512,800 71,536*
Oil & Gas - Integrated 3.19%PetroChina Co., Ltd., ADR 20,000 2,159,400
See notes to portfolios of investments and notes to financial statements.
�61
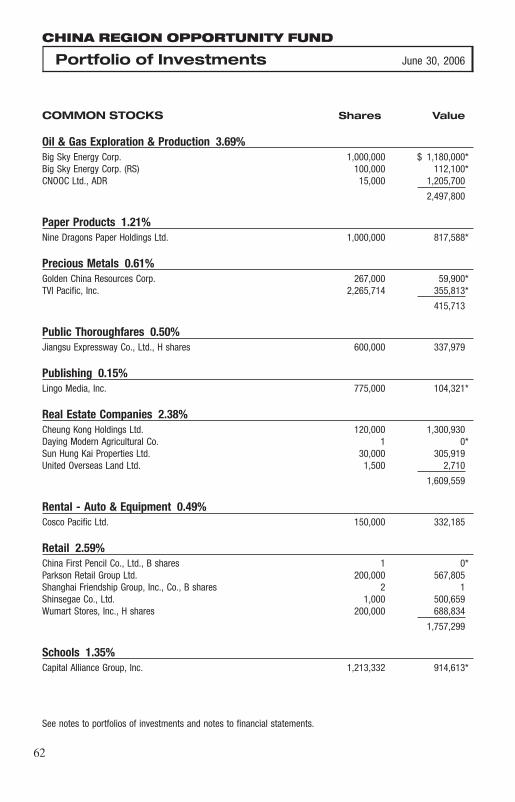
CHINA REGION OPPORTUNITY FUND
Portfolio of Investments June 30, 2006
COMMON STOCKS Shares Value
Oil & Gas Exploration & Production 3.69%Big Sky Energy Corp. 1,000,000 $ 1,180,000*Big Sky Energy Corp. (RS) 100,000 112,100*CNOOC Ltd., ADR 15,000 1,205,700
2,497,800
Paper Products 1.21%Nine Dragons Paper Holdings Ltd. 1,000,000 817,588*
Precious Metals 0.61%Golden China Resources Corp. 267,000 59,900*TVI Pacific, Inc. 2,265,714 355,813*
415,713
Public Thoroughfares 0.50%Jiangsu Expressway Co., Ltd., H shares 600,000 337,979
Publishing 0.15%Lingo Media, Inc. 775,000 104,321*
Real Estate Companies 2.38%Cheung Kong Holdings Ltd. 120,000 1,300,930Daying Modern Agricultural Co. 1 0*Sun Hung Kai Properties Ltd. 30,000 305,919United Overseas Land Ltd. 1,500 2,710
1,609,559
Rental - Auto & Equipment 0.49%Cosco Pacific Ltd. 150,000 332,185
Retail 2.59%China First Pencil Co., Ltd., B shares 1 0*Parkson Retail Group Ltd. 200,000 567,805Shanghai Friendship Group, Inc., Co., B shares 2 1Shinsegae Co., Ltd. 1,000 500,659Wumart Stores, Inc., H shares 200,000 688,834
1,757,299
Schools 1.35%Capital Alliance Group, Inc. 1,213,332 914,613*
See notes to portfolios of investments and notes to financial statements.
�62

CHINA REGION OPPORTUNITY FUND
Portfolio of Investments June 30, 2006
COMMON STOCKS Shares Value
Semiconductors 1.40%Taiwan Semiconductor Manufacturing Co., Ltd., Sponsored ADR 102,999 $ 945,531
Shipbuilding 2.48%Hyundai Heavy Industries Co., Ltd. 15,000 1,683,795
Silver Mining 2.59%Silvercorp Metals, Inc. 136,000 1,757,437*
Steel 3.26%Angang New Steel Co., Ltd., H shares 1,200,000 1,135,610POSCO 4,000 1,072,991
2,208,601
Telecommunications 0.94%Foxconn International Holdings Ltd. 300,000 639,264*
Total Common Stocks 58,392,934
(cost $53,602,770)
INDEX FUNDS 2.39%
iShares FTSE/Xinhua A50 China Tracker 60,000 490,553iShares MSCI Japan Index Fund 15,000 204,600iShares MSCI Singapore Index Fund 30,000 264,000iShares MSCI South Korea Index Fund 7,500 339,375iShares MSCI Taiwan Index Fund 25,000 320,500
Total Index Funds 1,619,028
(cost $1,474,446)
RIGHTS 0.00%
Cellular Telecommunications 0.00%3 Italia SpA, Rights
(cost $0) 20 0*
Total Securities 60,011,962
See notes to portfolios of investments and notes to financial statements.
�63
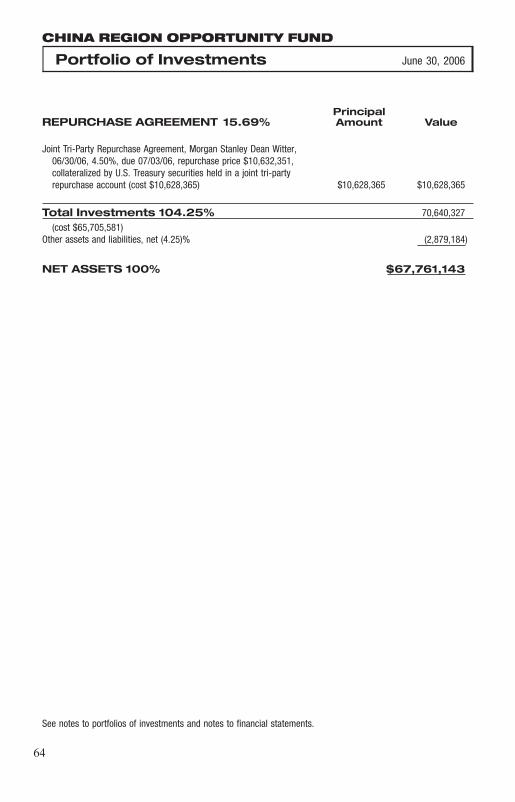
CHINA REGION OPPORTUNITY FUND
Portfolio of Investments June 30, 2006
PrincipalREPURCHASE AGREEMENT 15.69% Amount Value
Joint Tri-Party Repurchase Agreement, Morgan Stanley Dean Witter,06/30/06, 4.50%, due 07/03/06, repurchase price $10,632,351,collateralized by U.S. Treasury securities held in a joint tri-partyrepurchase account (cost $10,628,365) $10,628,365 $10,628,365
Total Investments 104.25% 70,640,327
(cost $65,705,581)Other assets and liabilities, net (4.25)% (2,879,184)
NET ASSETS 100% $67,761,143
See notes to portfolios of investments and notes to financial statements.
�64
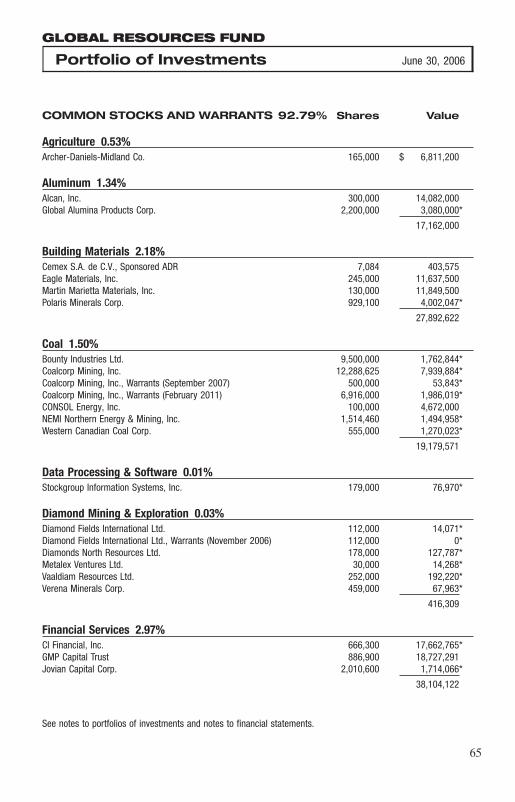
GLOBAL RESOURCES FUND
Portfolio of Investments June 30, 2006
COMMON STOCKS AND WARRANTS 92.79% Shares Value
Agriculture 0.53%Archer-Daniels-Midland Co. 165,000 $ 6,811,200
Aluminum 1.34%Alcan, Inc. 300,000 14,082,000Global Alumina Products Corp. 2,200,000 3,080,000*
17,162,000
Building Materials 2.18%Cemex S.A. de C.V., Sponsored ADR 7,084 403,575Eagle Materials, Inc. 245,000 11,637,500Martin Marietta Materials, Inc. 130,000 11,849,500Polaris Minerals Corp. 929,100 4,002,047*
27,892,622
Coal 1.50%Bounty Industries Ltd. 9,500,000 1,762,844*Coalcorp Mining, Inc. 12,288,625 7,939,884*Coalcorp Mining, Inc., Warrants (September 2007) 500,000 53,843*Coalcorp Mining, Inc., Warrants (February 2011) 6,916,000 1,986,019*CONSOL Energy, Inc. 100,000 4,672,000NEMI Northern Energy & Mining, Inc. 1,514,460 1,494,958*Western Canadian Coal Corp. 555,000 1,270,023*
19,179,571
Data Processing & Software 0.01%Stockgroup Information Systems, Inc. 179,000 76,970*
Diamond Mining & Exploration 0.03%Diamond Fields International Ltd. 112,000 14,071*Diamond Fields International Ltd., Warrants (November 2006) 112,000 0*Diamonds North Resources Ltd. 178,000 127,787*Metalex Ventures Ltd. 30,000 14,268*Vaaldiam Resources Ltd. 252,000 192,220*Verena Minerals Corp. 459,000 67,963*
416,309
Financial Services 2.97%CI Financial, Inc. 666,300 17,662,765*GMP Capital Trust 886,900 18,727,291Jovian Capital Corp. 2,010,600 1,714,066*
38,104,122
See notes to portfolios of investments and notes to financial statements.
�65
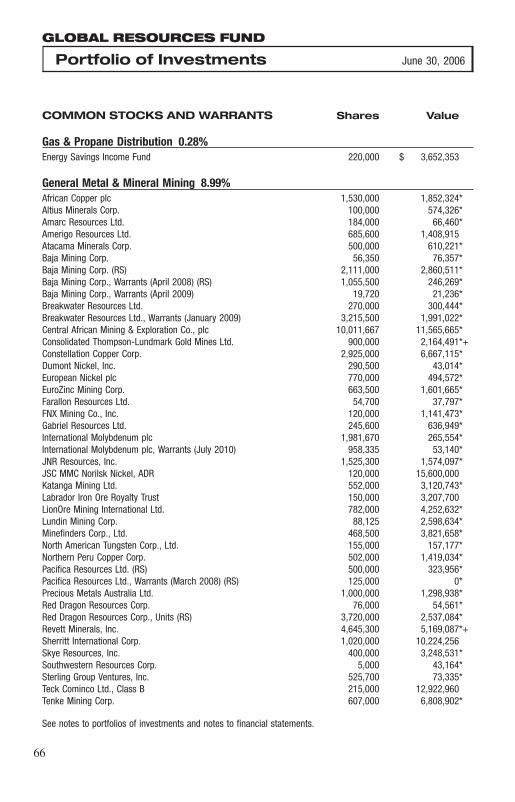
GLOBAL RESOURCES FUND
Portfolio of Investments June 30, 2006
COMMON STOCKS AND WARRANTS Shares Value
Gas & Propane Distribution 0.28%Energy Savings Income Fund 220,000 $ 3,652,353
General Metal & Mineral Mining 8.99%African Copper plc 1,530,000 1,852,324*Altius Minerals Corp. 100,000 574,326*Amarc Resources Ltd. 184,000 66,460*Amerigo Resources Ltd. 685,600 1,408,915Atacama Minerals Corp. 500,000 610,221*Baja Mining Corp. 56,350 76,357*Baja Mining Corp. (RS) 2,111,000 2,860,511*Baja Mining Corp., Warrants (April 2008) (RS) 1,055,500 246,269*Baja Mining Corp., Warrants (April 2009) 19,720 21,236*Breakwater Resources Ltd. 270,000 300,444*Breakwater Resources Ltd., Warrants (January 2009) 3,215,500 1,991,022*Central African Mining & Exploration Co., plc 10,011,667 11,565,665*Consolidated Thompson-Lundmark Gold Mines Ltd. 900,000 2,164,491*+Constellation Copper Corp. 2,925,000 6,667,115*Dumont Nickel, Inc. 290,500 43,014*European Nickel plc 770,000 494,572*EuroZinc Mining Corp. 663,500 1,601,665*Farallon Resources Ltd. 54,700 37,797*FNX Mining Co., Inc. 120,000 1,141,473*Gabriel Resources Ltd. 245,600 636,949*International Molybdenum plc 1,981,670 265,554*International Molybdenum plc, Warrants (July 2010) 958,335 53,140*JNR Resources, Inc. 1,525,300 1,574,097*JSC MMC Norilsk Nickel, ADR 120,000 15,600,000Katanga Mining Ltd. 552,000 3,120,743*Labrador Iron Ore Royalty Trust 150,000 3,207,700LionOre Mining International Ltd. 782,000 4,252,632*Lundin Mining Corp. 88,125 2,598,634*Minefinders Corp., Ltd. 468,500 3,821,658*North American Tungsten Corp., Ltd. 155,000 157,177*Northern Peru Copper Corp. 502,000 1,419,034*Pacifica Resources Ltd. (RS) 500,000 323,956*Pacifica Resources Ltd., Warrants (March 2008) (RS) 125,000 0*Precious Metals Australia Ltd. 1,000,000 1,298,938*Red Dragon Resources Corp. 76,000 54,561*Red Dragon Resources Corp., Units (RS) 3,720,000 2,537,084*Revett Minerals, Inc. 4,645,300 5,169,087*+Sherritt International Corp. 1,020,000 10,224,256Skye Resources, Inc. 400,000 3,248,531*Southwestern Resources Corp. 5,000 43,164*Sterling Group Ventures, Inc. 525,700 73,335*Teck Cominco Ltd., Class B 215,000 12,922,960Tenke Mining Corp. 607,000 6,808,902*
See notes to portfolios of investments and notes to financial statements.
�66
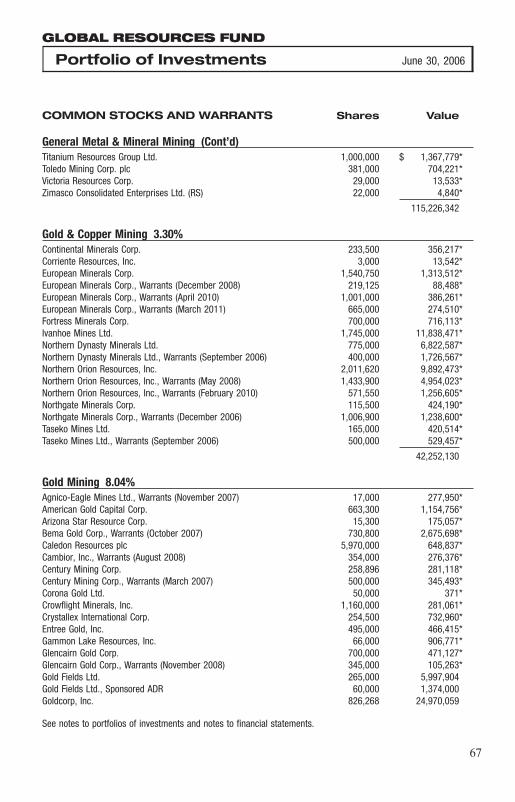
GLOBAL RESOURCES FUND
Portfolio of Investments June 30, 2006
COMMON STOCKS AND WARRANTS Shares Value
General Metal & Mineral Mining (Cont’d)Titanium Resources Group Ltd. 1,000,000 $ 1,367,779*Toledo Mining Corp. plc 381,000 704,221*Victoria Resources Corp. 29,000 13,533*Zimasco Consolidated Enterprises Ltd. (RS) 22,000 4,840*
115,226,342
Gold & Copper Mining 3.30%Continental Minerals Corp. 233,500 356,217*Corriente Resources, Inc. 3,000 13,542*European Minerals Corp. 1,540,750 1,313,512*European Minerals Corp., Warrants (December 2008) 219,125 88,488*European Minerals Corp., Warrants (April 2010) 1,001,000 386,261*European Minerals Corp., Warrants (March 2011) 665,000 274,510*Fortress Minerals Corp. 700,000 716,113*Ivanhoe Mines Ltd. 1,745,000 11,838,471*Northern Dynasty Minerals Ltd. 775,000 6,822,587*Northern Dynasty Minerals Ltd., Warrants (September 2006) 400,000 1,726,567*Northern Orion Resources, Inc. 2,011,620 9,892,473*Northern Orion Resources, Inc., Warrants (May 2008) 1,433,900 4,954,023*Northern Orion Resources, Inc., Warrants (February 2010) 571,550 1,256,605*Northgate Minerals Corp. 115,500 424,190*Northgate Minerals Corp., Warrants (December 2006) 1,006,900 1,238,600*Taseko Mines Ltd. 165,000 420,514*Taseko Mines Ltd., Warrants (September 2006) 500,000 529,457*
42,252,130
Gold Mining 8.04%Agnico-Eagle Mines Ltd., Warrants (November 2007) 17,000 277,950*American Gold Capital Corp. 663,300 1,154,756*Arizona Star Resource Corp. 15,300 175,057*Bema Gold Corp., Warrants (October 2007) 730,800 2,675,698*Caledon Resources plc 5,970,000 648,837*Cambior, Inc., Warrants (August 2008) 354,000 276,376*Century Mining Corp. 258,896 281,118*Century Mining Corp., Warrants (March 2007) 500,000 345,493*Corona Gold Ltd. 50,000 371*Crowflight Minerals, Inc. 1,160,000 281,061*Crystallex International Corp. 254,500 732,960*Entree Gold, Inc. 495,000 466,415*Gammon Lake Resources, Inc. 66,000 906,771*Glencairn Gold Corp. 700,000 471,127*Glencairn Gold Corp., Warrants (November 2008) 345,000 105,263*Gold Fields Ltd. 265,000 5,997,904Gold Fields Ltd., Sponsored ADR 60,000 1,374,000Goldcorp, Inc. 826,268 24,970,059
See notes to portfolios of investments and notes to financial statements.
�67
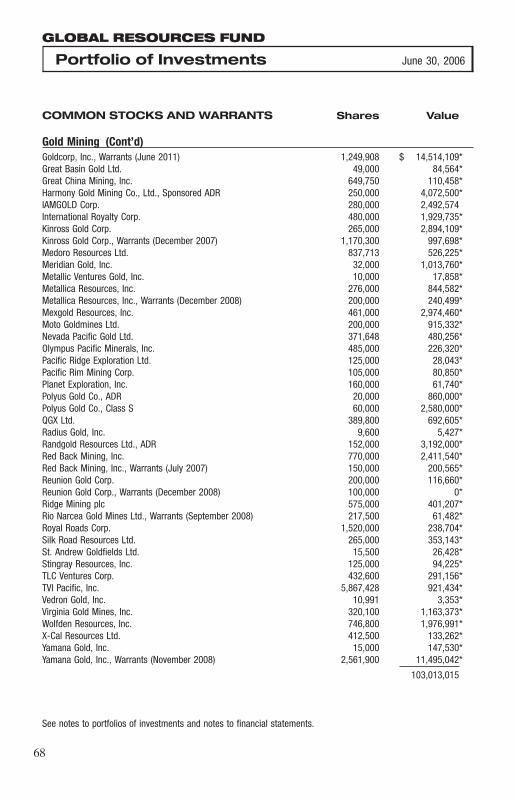
GLOBAL RESOURCES FUND
Portfolio of Investments June 30, 2006
COMMON STOCKS AND WARRANTS Shares Value
Gold Mining (Cont’d)Goldcorp, Inc., Warrants (June 2011) 1,249,908 $ 14,514,109*Great Basin Gold Ltd. 49,000 84,564*Great China Mining, Inc. 649,750 110,458*Harmony Gold Mining Co., Ltd., Sponsored ADR 250,000 4,072,500*IAMGOLD Corp. 280,000 2,492,574International Royalty Corp. 480,000 1,929,735*Kinross Gold Corp. 265,000 2,894,109*Kinross Gold Corp., Warrants (December 2007) 1,170,300 997,698*Medoro Resources Ltd. 837,713 526,225*Meridian Gold, Inc. 32,000 1,013,760*Metallic Ventures Gold, Inc. 10,000 17,858*Metallica Resources, Inc. 276,000 844,582*Metallica Resources, Inc., Warrants (December 2008) 200,000 240,499*Mexgold Resources, Inc. 461,000 2,974,460*Moto Goldmines Ltd. 200,000 915,332*Nevada Pacific Gold Ltd. 371,648 480,256*Olympus Pacific Minerals, Inc. 485,000 226,320*Pacific Ridge Exploration Ltd. 125,000 28,043*Pacific Rim Mining Corp. 105,000 80,850*Planet Exploration, Inc. 160,000 61,740*Polyus Gold Co., ADR 20,000 860,000*Polyus Gold Co., Class S 60,000 2,580,000*QGX Ltd. 389,800 692,605*Radius Gold, Inc. 9,600 5,427*Randgold Resources Ltd., ADR 152,000 3,192,000*Red Back Mining, Inc. 770,000 2,411,540*Red Back Mining, Inc., Warrants (July 2007) 150,000 200,565*Reunion Gold Corp. 200,000 116,660*Reunion Gold Corp., Warrants (December 2008) 100,000 0*Ridge Mining plc 575,000 401,207*Rio Narcea Gold Mines Ltd., Warrants (September 2008) 217,500 61,482*Royal Roads Corp. 1,520,000 238,704*Silk Road Resources Ltd. 265,000 353,143*St. Andrew Goldfields Ltd. 15,500 26,428*Stingray Resources, Inc. 125,000 94,225*TLC Ventures Corp. 432,600 291,156*TVI Pacific, Inc. 5,867,428 921,434*Vedron Gold, Inc. 10,991 3,353*Virginia Gold Mines, Inc. 320,100 1,163,373*Wolfden Resources, Inc. 746,800 1,976,991*X-Cal Resources Ltd. 412,500 133,262*Yamana Gold, Inc. 15,000 147,530*Yamana Gold, Inc., Warrants (November 2008) 2,561,900 11,495,042*
103,013,015
See notes to portfolios of investments and notes to financial statements.
�68

GLOBAL RESOURCES FUND
Portfolio of Investments June 30, 2006
COMMON STOCKS AND WARRANTS Shares Value
Mining Equipment & Services 1.34%Dynatec Corp. 3,405,700 $ 4,125,899*Joy Global, Inc. 250,000 13,022,500
17,148,399
Oil & Gas - Integrated 8.17%ConocoPhillips 100,000 6,553,000Novy Neft II Limited 60,000 2,799,900*Oao Gazprom, Sponsored ADR 580,000 24,389,000Petro-Canada 270,000 12,806,473PetroChina Co., Ltd., ADR 80,000 8,637,600Petroleo Brasileiro S.A., ADR 357,000 28,502,880Suncor Energy, Inc. 260,000 21,062,600
104,751,453
Oil & Gas Drilling 4.11%ENSCO International, Inc. 175,000 8,053,500Global Santa Fe Corp. 200,000 11,550,000Leader Energy Services Ltd. 1,377,000 4,077,803*Nabors Industries, Ltd. 100,000 3,379,000*Rowan Companies, Inc. 128,200 4,562,638Savanna Energy Services Corp. 220,000 4,515,098*Transocean, Inc. 150,000 12,048,000*Xtreme Coil Drilling Corp. 450,000 4,442,051*
52,628,090
Oil & Gas Equipment & Services 11.49%Bristow Group, Inc. 112,400 4,046,400*Calfrac Well Services Ltd. 204,500 4,404,361Cameron International Corp. 150,000 7,165,500*Canadian Sub-Surface Energy Services Corp. (RS) 80,000 443,308*Divestco, Inc. 1,000,000 4,083,098*Grant Prideco, Inc. 255,000 11,411,250*Halliburton Co. 185,000 13,728,850Horizon North Logistics, Inc. (RS) 65,229 0*Horizon North Logistics, Inc., Warrants (August 2006) (RS) 45,900 0*Hyduke Energy Services, Inc. 525,000 1,220,218*Hyduke Energy Services, Inc., Warrants (June 2007) 262,500 0*McDermott International, Inc. 472,500 21,484,575*Mullen Group Income Fund 226,644 5,877,876Oil States International, Inc. 285,000 9,769,800*Pure Energy Services Ltd. 45,000 819,760*Saxon Energy Services, Inc. 1,110,000 4,203,527*Saxon Energy Services, Inc., Warrants (November 2006) 180,000 0*Schlumberger Ltd. 305,000 19,858,550
See notes to portfolios of investments and notes to financial statements.
�69

GLOBAL RESOURCES FUND
Portfolio of Investments June 30, 2006
COMMON STOCKS AND WARRANTS Shares Value
Oil & Gas Equipment & Services (Cont’d)Trican Well Service Ltd. 531,500 $ 10,636,200Veritas DGC, Inc. 110,000 5,673,800*Weatherford International Ltd. 248,000 12,305,760*W-H Energy Services, Inc. 200,000 10,166,000*
147,298,833
Oil & Gas Exploration & Production - Junior 11.31%Aberdeen International, Inc. 250,250 175,165*Anderson Energy Ltd., S/R 50,000 228,833*Bankers Petroleum Ltd. 2,600,000 1,749,899*Bankers Petroleum Ltd., Warrants (November 2009) 2,565,500 874,851*Big Sky Energy Corp. 3,866,100 4,561,998*Big Sky Energy Corp. (RS) 1,400,000 1,569,400*Birchcliff Energy Ltd. 200,000 960,201*Choice Resources Corp. 1,831,500 1,397,025*Dune Energy, Inc. (RS) 377,358 1,090,414*Energy XXI Acquisition Corp. 419,000 2,157,850*Energy XXI Acquisition Corp., Warrants (October 2009) 790,000 900,600*Exile Resources, Inc. 78,675 42,361*+Exile Resources, Inc. (RS) 2,100,000 1,074,169*+Exile Resources, Inc., Warrants (May 2008) (RS) 1,050,000 0*Exploration Company of Delaware 860,000 9,167,600*Gastar Exploration Ltd. 702,000 1,669,404*Geopark Holdings Ltd., 144A 780,000 3,957,502*Goodrich Petroleum Corp. 339,600 9,641,244*Gran Tierra Energy, Inc. 265,350 875,655*Gran Tierra Energy, Inc., Units (RS) 3,100,000 12,000,100*Grove Energy Ltd. 1,600,000 1,033,787Ivanhoe Energy, Inc. 300,000 732,265*Ivory Energy, Inc., Units 1,666,500 1,099,186*Kereco Energy Ltd. 200,000 1,920,402*Legacy Energy LLC, 144A (RS) 263,158 5,000,000*Mission Oil & Gas, Inc. 990,800 12,661,185*Orleans Energy Ltd. 40,500 212,613*Pacific Stratus Energy Ltd. 747,000 2,145,107*+Pacific Stratus Energy Ltd., Warrants (August 2006) 150,000 0*Pacific Stratus Energy Ltd., Warrants (July 2007) 160,000 28,716*Pan-Ocean Energy Corp., Ltd. 252,000 9,945,672*Pearl Exploration and Production Ltd. 109,000 513,528*Petrobank Energy & Resources Ltd. 494,500 6,753,973*PetroWorld Corp. 2,000,000 897,384*+PetroWorld Corp., Warrants (July 2010) 1,000,000 0*Salinas Energy Ltd. 1,075,000 406,939*Signal Energy, Inc. 1,124,800 1,231,441*Sound Oil plc 14,005,500 1,617,942*
See notes to portfolios of investments and notes to financial statements.
�70
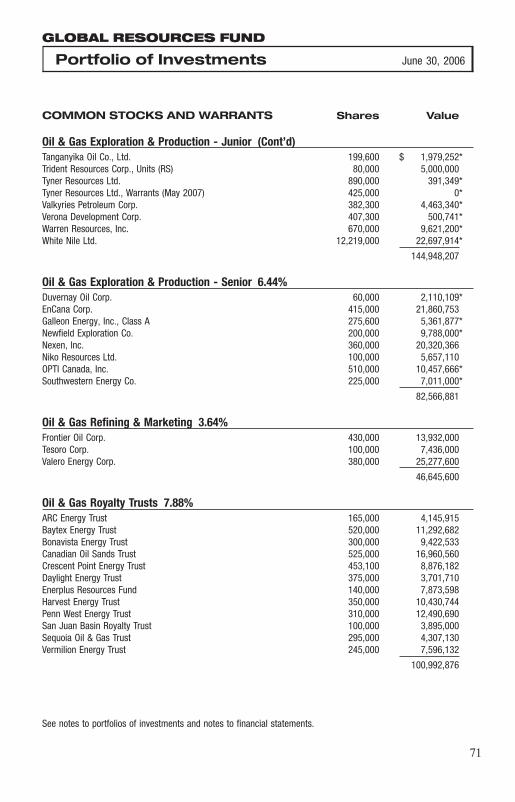
GLOBAL RESOURCES FUND
Portfolio of Investments June 30, 2006
COMMON STOCKS AND WARRANTS Shares Value
Oil & Gas Exploration & Production - Junior (Cont’d)Tanganyika Oil Co., Ltd. 199,600 $ 1,979,252*Trident Resources Corp., Units (RS) 80,000 5,000,000Tyner Resources Ltd. 890,000 391,349*Tyner Resources Ltd., Warrants (May 2007) 425,000 0*Valkyries Petroleum Corp. 382,300 4,463,340*Verona Development Corp. 407,300 500,741*Warren Resources, Inc. 670,000 9,621,200*White Nile Ltd. 12,219,000 22,697,914*
144,948,207
Oil & Gas Exploration & Production - Senior 6.44%Duvernay Oil Corp. 60,000 2,110,109*EnCana Corp. 415,000 21,860,753Galleon Energy, Inc., Class A 275,600 5,361,877*Newfield Exploration Co. 200,000 9,788,000*Nexen, Inc. 360,000 20,320,366Niko Resources Ltd. 100,000 5,657,110OPTI Canada, Inc. 510,000 10,457,666*Southwestern Energy Co. 225,000 7,011,000*
82,566,881
Oil & Gas Refining & Marketing 3.64%Frontier Oil Corp. 430,000 13,932,000Tesoro Corp. 100,000 7,436,000Valero Energy Corp. 380,000 25,277,600
46,645,600
Oil & Gas Royalty Trusts 7.88%ARC Energy Trust 165,000 4,145,915Baytex Energy Trust 520,000 11,292,682Bonavista Energy Trust 300,000 9,422,533Canadian Oil Sands Trust 525,000 16,960,560Crescent Point Energy Trust 453,100 8,876,182Daylight Energy Trust 375,000 3,701,710Enerplus Resources Fund 140,000 7,873,598Harvest Energy Trust 350,000 10,430,744Penn West Energy Trust 310,000 12,490,690San Juan Basin Royalty Trust 100,000 3,895,000Sequoia Oil & Gas Trust 295,000 4,307,130Vermilion Energy Trust 245,000 7,596,132
100,992,876
See notes to portfolios of investments and notes to financial statements.
�71
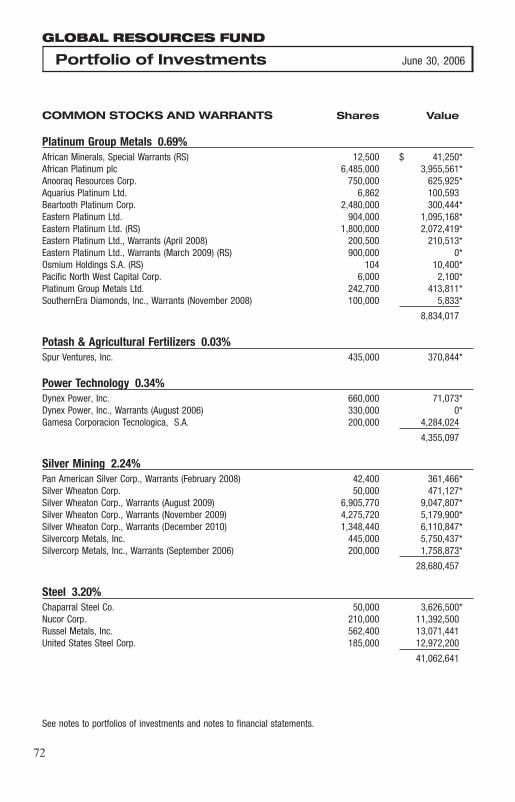
GLOBAL RESOURCES FUND
Portfolio of Investments June 30, 2006
COMMON STOCKS AND WARRANTS Shares Value
Platinum Group Metals 0.69%African Minerals, Special Warrants (RS) 12,500 $ 41,250*African Platinum plc 6,485,000 3,955,561*Anooraq Resources Corp. 750,000 625,925*Aquarius Platinum Ltd. 6,862 100,593Beartooth Platinum Corp. 2,480,000 300,444*Eastern Platinum Ltd. 904,000 1,095,168*Eastern Platinum Ltd. (RS) 1,800,000 2,072,419*Eastern Platinum Ltd., Warrants (April 2008) 200,500 210,513*Eastern Platinum Ltd., Warrants (March 2009) (RS) 900,000 0*Osmium Holdings S.A. (RS) 104 10,400*Pacific North West Capital Corp. 6,000 2,100*Platinum Group Metals Ltd. 242,700 413,811*SouthernEra Diamonds, Inc., Warrants (November 2008) 100,000 5,833*
8,834,017
Potash & Agricultural Fertilizers 0.03%Spur Ventures, Inc. 435,000 370,844*
Power Technology 0.34%Dynex Power, Inc. 660,000 71,073*Dynex Power, Inc., Warrants (August 2006) 330,000 0*Gamesa Corporacion Tecnologica, S.A. 200,000 4,284,024
4,355,097
Silver Mining 2.24%Pan American Silver Corp., Warrants (February 2008) 42,400 361,466*Silver Wheaton Corp. 50,000 471,127*Silver Wheaton Corp., Warrants (August 2009) 6,905,770 9,047,807*Silver Wheaton Corp., Warrants (November 2009) 4,275,720 5,179,900*Silver Wheaton Corp., Warrants (December 2010) 1,348,440 6,110,847*Silvercorp Metals, Inc. 445,000 5,750,437*Silvercorp Metals, Inc., Warrants (September 2006) 200,000 1,758,873*
28,680,457
Steel 3.20%Chaparral Steel Co. 50,000 3,626,500*Nucor Corp. 210,000 11,392,500Russel Metals, Inc. 562,400 13,071,441United States Steel Corp. 185,000 12,972,200
41,062,641
See notes to portfolios of investments and notes to financial statements.
�72

GLOBAL RESOURCES FUND
Portfolio of Investments June 30, 2006
COMMON STOCKS AND WARRANTS Shares Value
Sugar/Ethanol 1.16%Cosan S.A. Industria e Comercio 165,000 $ 10,636,553*Infinity Bio-Energy Ltd. 687,400 3,608,850*Infinity Bio-Energy Ltd., Warrants (May 2010) 1,374,800 659,904*
14,905,307
Transportation 1.02%Burlington Northern Santa Fe Corp. 165,000 13,076,250
Uranium 0.56%Khan Resources Inc., Special Warrants (RS) 400,000 358,954*UMC Energy plc 1,000,000 425,121*+UMC Energy plc, Warrants (January 2007) 500,000 0*UrAsia Energy Ltd. 1,635,850 4,110,360*Western Prospector Group Ltd. 1,143,000 2,287,333*
7,181,768
Total Common Stocks and Warrants 1,189,233,354
(cost $1,002,502,644)
PrincipalCONVERTIBLE DEBENTURES 0.13% Amount
Oil & Gas Exploration & Production - Junior 0.13%Gastar Exploration Ltd., 9.75%, maturity 11/12/09 $ 1,500,000 816,300Ivory Energy, Inc., 10.00%, maturity 12/15/07 CAD 1,000,000 897,384
1,713,684
Total Convertible Debentures 1,713,684
(cost $2,327,472)
NOTE UNIT 0.52%
Oil & Gas Exploration & Production - Junior 0.52%Pacific Stratus Energy Ltd., 13.00%, maturity 6/14/11(RS)
(cost $6,785,196) CAD 7,480,000 6,712,434
See notes to portfolios of investments and notes to financial statements.
�73
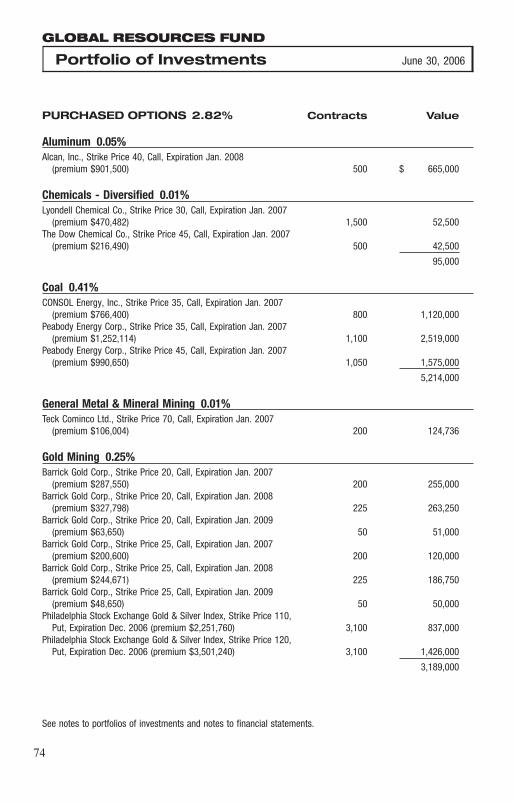
GLOBAL RESOURCES FUND
Portfolio of Investments June 30, 2006
PURCHASED OPTIONS 2.82% Contracts Value
Aluminum 0.05%Alcan, Inc., Strike Price 40, Call, Expiration Jan. 2008
(premium $901,500) 500 $ 665,000
Chemicals - Diversified 0.01%Lyondell Chemical Co., Strike Price 30, Call, Expiration Jan. 2007
(premium $470,482) 1,500 52,500The Dow Chemical Co., Strike Price 45, Call, Expiration Jan. 2007
(premium $216,490) 500 42,500
95,000
Coal 0.41%CONSOL Energy, Inc., Strike Price 35, Call, Expiration Jan. 2007
(premium $766,400) 800 1,120,000Peabody Energy Corp., Strike Price 35, Call, Expiration Jan. 2007
(premium $1,252,114) 1,100 2,519,000Peabody Energy Corp., Strike Price 45, Call, Expiration Jan. 2007
(premium $990,650) 1,050 1,575,000
5,214,000
General Metal & Mineral Mining 0.01%Teck Cominco Ltd., Strike Price 70, Call, Expiration Jan. 2007
(premium $106,004) 200 124,736
Gold Mining 0.25%Barrick Gold Corp., Strike Price 20, Call, Expiration Jan. 2007
(premium $287,550) 200 255,000Barrick Gold Corp., Strike Price 20, Call, Expiration Jan. 2008
(premium $327,798) 225 263,250Barrick Gold Corp., Strike Price 20, Call, Expiration Jan. 2009
(premium $63,650) 50 51,000Barrick Gold Corp., Strike Price 25, Call, Expiration Jan. 2007
(premium $200,600) 200 120,000Barrick Gold Corp., Strike Price 25, Call, Expiration Jan. 2008
(premium $244,671) 225 186,750Barrick Gold Corp., Strike Price 25, Call, Expiration Jan. 2009
(premium $48,650) 50 50,000Philadelphia Stock Exchange Gold & Silver Index, Strike Price 110,
Put, Expiration Dec. 2006 (premium $2,251,760) 3,100 837,000Philadelphia Stock Exchange Gold & Silver Index, Strike Price 120,
Put, Expiration Dec. 2006 (premium $3,501,240) 3,100 1,426,000
3,189,000
See notes to portfolios of investments and notes to financial statements.
�74
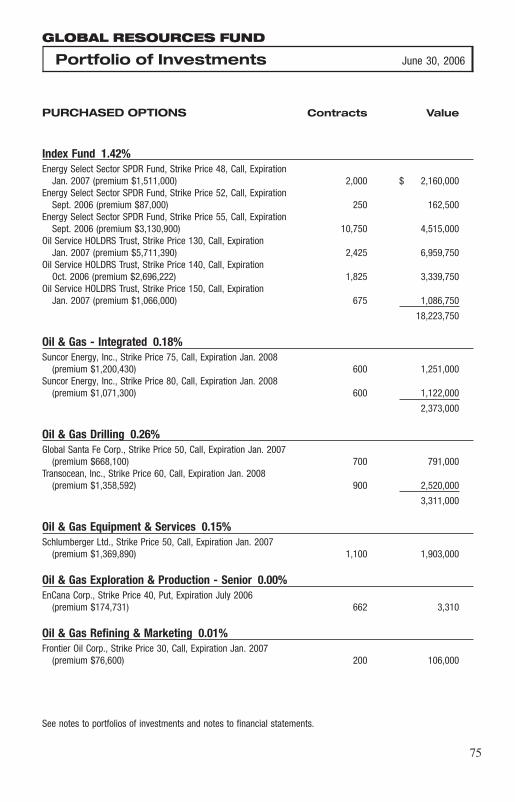
GLOBAL RESOURCES FUND
Portfolio of Investments June 30, 2006
PURCHASED OPTIONS Contracts Value
Index Fund 1.42%Energy Select Sector SPDR Fund, Strike Price 48, Call, Expiration
Jan. 2007 (premium $1,511,000) 2,000 $ 2,160,000Energy Select Sector SPDR Fund, Strike Price 52, Call, Expiration
Sept. 2006 (premium $87,000) 250 162,500Energy Select Sector SPDR Fund, Strike Price 55, Call, Expiration
Sept. 2006 (premium $3,130,900) 10,750 4,515,000Oil Service HOLDRS Trust, Strike Price 130, Call, Expiration
Jan. 2007 (premium $5,711,390) 2,425 6,959,750Oil Service HOLDRS Trust, Strike Price 140, Call, Expiration
Oct. 2006 (premium $2,696,222) 1,825 3,339,750Oil Service HOLDRS Trust, Strike Price 150, Call, Expiration
Jan. 2007 (premium $1,066,000) 675 1,086,750
18,223,750
Oil & Gas - Integrated 0.18%Suncor Energy, Inc., Strike Price 75, Call, Expiration Jan. 2008
(premium $1,200,430) 600 1,251,000Suncor Energy, Inc., Strike Price 80, Call, Expiration Jan. 2008
(premium $1,071,300) 600 1,122,000
2,373,000
Oil & Gas Drilling 0.26%Global Santa Fe Corp., Strike Price 50, Call, Expiration Jan. 2007
(premium $668,100) 700 791,000Transocean, Inc., Strike Price 60, Call, Expiration Jan. 2008
(premium $1,358,592) 900 2,520,000
3,311,000
Oil & Gas Equipment & Services 0.15%Schlumberger Ltd., Strike Price 50, Call, Expiration Jan. 2007
(premium $1,369,890) 1,100 1,903,000
Oil & Gas Exploration & Production - Senior 0.00%EnCana Corp., Strike Price 40, Put, Expiration July 2006
(premium $174,731) 662 3,310
Oil & Gas Refining & Marketing 0.01%Frontier Oil Corp., Strike Price 30, Call, Expiration Jan. 2007
(premium $76,600) 200 106,000
See notes to portfolios of investments and notes to financial statements.
�75

GLOBAL RESOURCES FUND
Portfolio of Investments June 30, 2006
PURCHASED OPTIONS Contracts Value
Silver Mining 0.00%Silver Wheaton Corp., Strike Price 7.50, Put, Expiration Sept. 2006
(premium $95,688) 1,000 $ 35,000
Transportation 0.07%Burlington Northern Santa Fe Corp., Strike Price 65, Call, Expiration
Jan. 2007 (premium $606,500) 500 882,500
Total Purchased Options 36,125,296
(cost $32,453,902)
Total Securities 1,233,784,768
PrincipalREPURCHASE AGREEMENT 4.59% Amount
Joint Tri-Party Repurchase Agreement, Morgan Stanley Dean Witter,06/30/06, 4.50%, due 07/03/06, repurchase price $58,840,967,collateralized by U.S. Treasury securities held in a joint tri-partyrepurchase account (cost $58,818,910) $ 58,818,910 58,818,910
Total Investments 100.85% 1,292,603,678
(cost $1,102,888,124)Other assets and liabilities, net (0.85)% (10,939,197)
NET ASSETS 100% $1,281,664,481
See notes to portfolios of investments and notes to financial statements.
�76
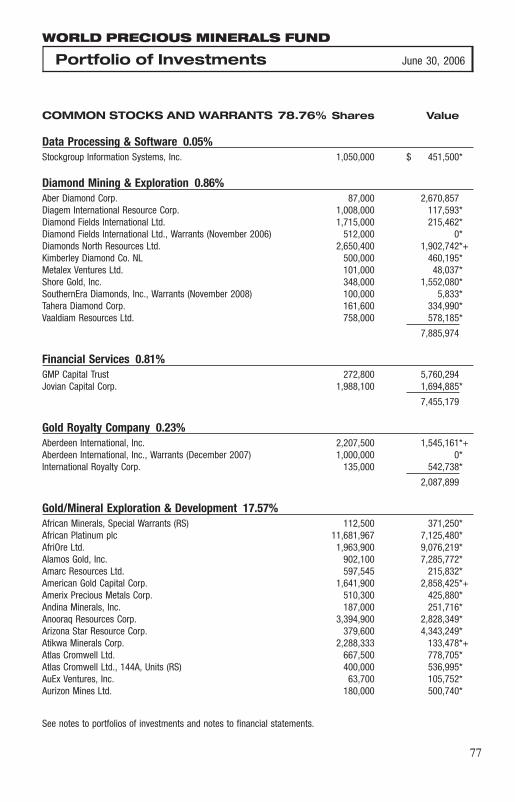
WORLD PRECIOUS MINERALS FUND
Portfolio of Investments June 30, 2006
COMMON STOCKS AND WARRANTS 78.76% Shares Value
Data Processing & Software 0.05%Stockgroup Information Systems, Inc. 1,050,000 $ 451,500*
Diamond Mining & Exploration 0.86%Aber Diamond Corp. 87,000 2,670,857Diagem International Resource Corp. 1,008,000 117,593*Diamond Fields International Ltd. 1,715,000 215,462*Diamond Fields International Ltd., Warrants (November 2006) 512,000 0*Diamonds North Resources Ltd. 2,650,400 1,902,742*+Kimberley Diamond Co. NL 500,000 460,195*Metalex Ventures Ltd. 101,000 48,037*Shore Gold, Inc. 348,000 1,552,080*SouthernEra Diamonds, Inc., Warrants (November 2008) 100,000 5,833*Tahera Diamond Corp. 161,600 334,990*Vaaldiam Resources Ltd. 758,000 578,185*
7,885,974
Financial Services 0.81%GMP Capital Trust 272,800 5,760,294Jovian Capital Corp. 1,988,100 1,694,885*
7,455,179
Gold Royalty Company 0.23%Aberdeen International, Inc. 2,207,500 1,545,161*+Aberdeen International, Inc., Warrants (December 2007) 1,000,000 0*International Royalty Corp. 135,000 542,738*
2,087,899
Gold/Mineral Exploration & Development 17.57%African Minerals, Special Warrants (RS) 112,500 371,250*African Platinum plc 11,681,967 7,125,480*AfriOre Ltd. 1,963,900 9,076,219*Alamos Gold, Inc. 902,100 7,285,772*Amarc Resources Ltd. 597,545 215,832*American Gold Capital Corp. 1,641,900 2,858,425*+Amerix Precious Metals Corp. 510,300 425,880*Andina Minerals, Inc. 187,000 251,716*Anooraq Resources Corp. 3,394,900 2,828,349*Arizona Star Resource Corp. 379,600 4,343,249*Atikwa Minerals Corp. 2,288,333 133,478*+Atlas Cromwell Ltd. 667,500 778,705*Atlas Cromwell Ltd., 144A, Units (RS) 400,000 536,995*AuEx Ventures, Inc. 63,700 105,752*Aurizon Mines Ltd. 180,000 500,740*
See notes to portfolios of investments and notes to financial statements.
�77

WORLD PRECIOUS MINERALS FUND
Portfolio of Investments June 30, 2006
COMMON STOCKS AND WARRANTS Shares Value
Gold/Mineral Exploration & Development (Cont’d)Baja Mining Corp. 116,900 $ 158,405*Baja Mining Corp. (RS) 1,055,500 1,430,255*Baja Mining Corp., Warrants (April 2008) (RS) 527,750 123,135*Baja Mining Corp., Warrants (April 2009) 496,040 534,166*Beartooth Platinum Corp. 3,534,500 428,194*Bendigo Mining NL 1,201,000 1,533,281*Bolnisi Gold NL 1,000,000 1,840,780Caledon Resources plc 20,290,000 2,205,178*+Candente Resource Corp. 260,000 226,320*Central African Gold plc 4,825,000 1,360,039*Central African Mining & Exploration Co., plc 2,510,000 2,899,599*Coalcorp Mining, Inc. 517,500 334,365*Coalcorp Mining, Inc., Warrants (February 2011) 204,000 58,581*Continental Minerals Corp. 641,500 978,642*Continental Precious Minerals, Inc. 256,000 578,921*Coral Gold Resources Ltd. 54,200 198,930*Corona Gold Ltd. 812,500 6,031*Corriente Resources, Inc. 494,300 2,231,192*Crown Resources Corp. 161,500 524,875*Dumont Nickel, Inc. 1,855,500 274,741*Eastern Platinum Ltd. 3,796,425 4,599,250*Eastern Platinum Ltd., Warrants (April 2008) 799,000 838,902*ECU Silver Mining, Inc. 987,000 2,612,869*Erdene Gold, Inc. 524,900 433,354*European Minerals Corp. 1,579,800 1,346,803*European Minerals Corp., Warrants (December 2008) 1,904,200 768,959*European Minerals Corp., Warrants (April 2010) 1,893,500 730,655*European Minerals Corp., Warrants (March 2011) 2,374,000 979,979*European Nickel plc 400,000 256,921*EXMIN Resources, Inc. 1,504,000 276,681*EXMIN Resources, Inc., Warrants (February 2007) 500,000 0*Farallon Resources Ltd. 2,447,500 1,691,188*First Point Minerals Corp. 1,761,500 308,245*Fortress Minerals Corp. 441,000 451,151*Frontier Pacific Mining Corp. 1,538,000 579,674*Gabriel Resources Ltd. 1,321,300 3,426,712*GBS Gold International, Inc. 739,100 1,160,699*Gold Reserve, Inc. 272,600 1,567,992*Gold Summit Corp. 329,000 59,048*Golden China Resources Corp. 1,793,000 402,252*Golden Odyssey Mining, Inc. 1,473,500 350,408*Grandview Gold, Inc. 584,000 581,720*+Grandview Gold, Inc. (RS) 700,000 662,718*+Grandview Gold, Inc., Warrants (August 2006) 200,000 0*Grandview Gold, Inc., Warrants (July 2009) (RS) 350,000 0*Great Basin Gold Ltd. 1,456,300 2,509,172*
See notes to portfolios of investments and notes to financial statements.
�78
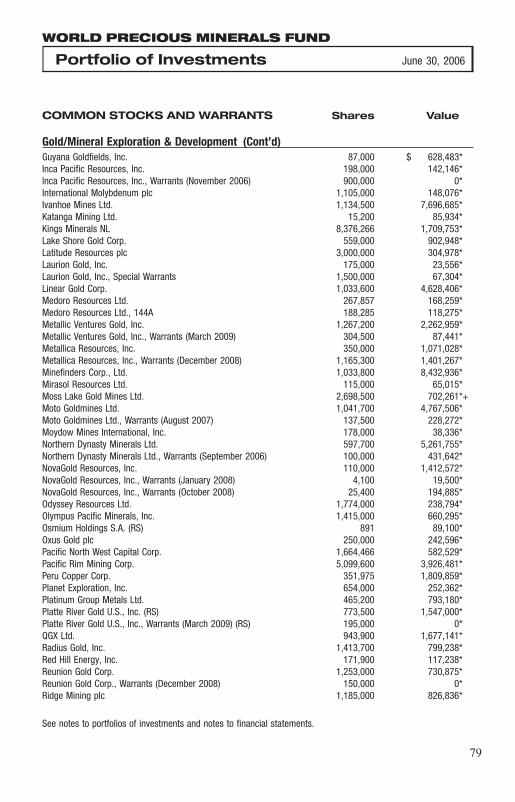
WORLD PRECIOUS MINERALS FUND
Portfolio of Investments June 30, 2006
COMMON STOCKS AND WARRANTS Shares Value
Gold/Mineral Exploration & Development (Cont’d)Guyana Goldfields, Inc. 87,000 $ 628,483*Inca Pacific Resources, Inc. 198,000 142,146*Inca Pacific Resources, Inc., Warrants (November 2006) 900,000 0*International Molybdenum plc 1,105,000 148,076*Ivanhoe Mines Ltd. 1,134,500 7,696,685*Katanga Mining Ltd. 15,200 85,934*Kings Minerals NL 8,376,266 1,709,753*Lake Shore Gold Corp. 559,000 902,948*Latitude Resources plc 3,000,000 304,978*Laurion Gold, Inc. 175,000 23,556*Laurion Gold, Inc., Special Warrants 1,500,000 67,304*Linear Gold Corp. 1,033,600 4,628,406*Medoro Resources Ltd. 267,857 168,259*Medoro Resources Ltd., 144A 188,285 118,275*Metallic Ventures Gold, Inc. 1,267,200 2,262,959*Metallic Ventures Gold, Inc., Warrants (March 2009) 304,500 87,441*Metallica Resources, Inc. 350,000 1,071,028*Metallica Resources, Inc., Warrants (December 2008) 1,165,300 1,401,267*Minefinders Corp., Ltd. 1,033,800 8,432,936*Mirasol Resources Ltd. 115,000 65,015*Moss Lake Gold Mines Ltd. 2,698,500 702,261*+Moto Goldmines Ltd. 1,041,700 4,767,506*Moto Goldmines Ltd., Warrants (August 2007) 137,500 228,272*Moydow Mines International, Inc. 178,000 38,336*Northern Dynasty Minerals Ltd. 597,700 5,261,755*Northern Dynasty Minerals Ltd., Warrants (September 2006) 100,000 431,642*NovaGold Resources, Inc. 110,000 1,412,572*NovaGold Resources, Inc., Warrants (January 2008) 4,100 19,500*NovaGold Resources, Inc., Warrants (October 2008) 25,400 194,885*Odyssey Resources Ltd. 1,774,000 238,794*Olympus Pacific Minerals, Inc. 1,415,000 660,295*Osmium Holdings S.A. (RS) 891 89,100*Oxus Gold plc 250,000 242,596*Pacific North West Capital Corp. 1,664,466 582,529*Pacific Rim Mining Corp. 5,099,600 3,926,481*Peru Copper Corp. 351,975 1,809,859*Planet Exploration, Inc. 654,000 252,362*Platinum Group Metals Ltd. 465,200 793,180*Platte River Gold U.S., Inc. (RS) 773,500 1,547,000*Platte River Gold U.S., Inc., Warrants (March 2009) (RS) 195,000 0*QGX Ltd. 943,900 1,677,141*Radius Gold, Inc. 1,413,700 799,238*Red Hill Energy, Inc. 171,900 117,238*Reunion Gold Corp. 1,253,000 730,875*Reunion Gold Corp., Warrants (December 2008) 150,000 0*Ridge Mining plc 1,185,000 826,836*
See notes to portfolios of investments and notes to financial statements.
�79
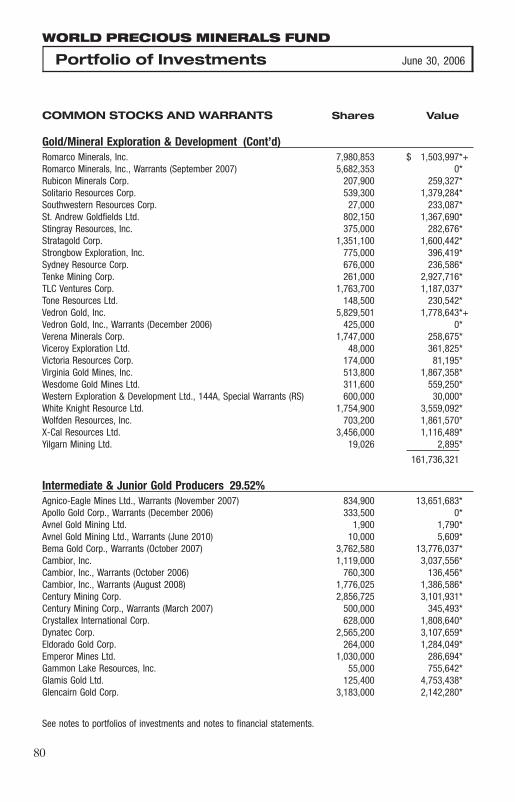
WORLD PRECIOUS MINERALS FUND
Portfolio of Investments June 30, 2006
COMMON STOCKS AND WARRANTS Shares Value
Gold/Mineral Exploration & Development (Cont’d)Romarco Minerals, Inc. 7,980,853 $ 1,503,997*+Romarco Minerals, Inc., Warrants (September 2007) 5,682,353 0*Rubicon Minerals Corp. 207,900 259,327*Solitario Resources Corp. 539,300 1,379,284*Southwestern Resources Corp. 27,000 233,087*St. Andrew Goldfields Ltd. 802,150 1,367,690*Stingray Resources, Inc. 375,000 282,676*Stratagold Corp. 1,351,100 1,600,442*Strongbow Exploration, Inc. 775,000 396,419*Sydney Resource Corp. 676,000 236,586*Tenke Mining Corp. 261,000 2,927,716*TLC Ventures Corp. 1,763,700 1,187,037*Tone Resources Ltd. 148,500 230,542*Vedron Gold, Inc. 5,829,501 1,778,643*+Vedron Gold, Inc., Warrants (December 2006) 425,000 0*Verena Minerals Corp. 1,747,000 258,675*Viceroy Exploration Ltd. 48,000 361,825*Victoria Resources Corp. 174,000 81,195*Virginia Gold Mines, Inc. 513,800 1,867,358*Wesdome Gold Mines Ltd. 311,600 559,250*Western Exploration & Development Ltd., 144A, Special Warrants (RS) 600,000 30,000*White Knight Resource Ltd. 1,754,900 3,559,092*Wolfden Resources, Inc. 703,200 1,861,570*X-Cal Resources Ltd. 3,456,000 1,116,489*Yilgarn Mining Ltd. 19,026 2,895*
161,736,321
Intermediate & Junior Gold Producers 29.52%Agnico-Eagle Mines Ltd., Warrants (November 2007) 834,900 13,651,683*Apollo Gold Corp., Warrants (December 2006) 333,500 0*Avnel Gold Mining Ltd. 1,900 1,790*Avnel Gold Mining Ltd., Warrants (June 2010) 10,000 5,609*Bema Gold Corp., Warrants (October 2007) 3,762,580 13,776,037*Cambior, Inc. 1,119,000 3,037,556*Cambior, Inc., Warrants (October 2006) 760,300 136,456*Cambior, Inc., Warrants (August 2008) 1,776,025 1,386,586*Century Mining Corp. 2,856,725 3,101,931*Century Mining Corp., Warrants (March 2007) 500,000 345,493*Crystallex International Corp. 628,000 1,808,640*Dynatec Corp. 2,565,200 3,107,659*Eldorado Gold Corp. 264,000 1,284,049*Emperor Mines Ltd. 1,030,000 286,694*Gammon Lake Resources, Inc. 55,000 755,642*Glamis Gold Ltd. 125,400 4,753,438*Glencairn Gold Corp. 3,183,000 2,142,280*
See notes to portfolios of investments and notes to financial statements.
�80
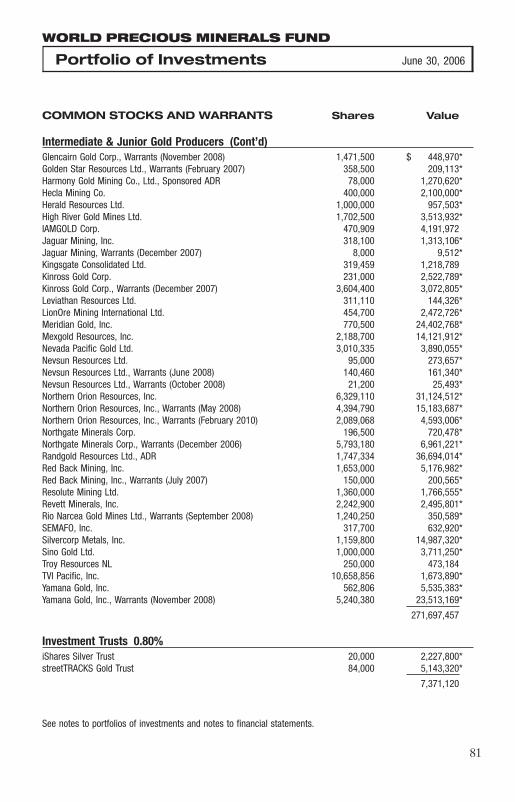
WORLD PRECIOUS MINERALS FUND
Portfolio of Investments June 30, 2006
COMMON STOCKS AND WARRANTS Shares Value
Intermediate & Junior Gold Producers (Cont’d)Glencairn Gold Corp., Warrants (November 2008) 1,471,500 $ 448,970*Golden Star Resources Ltd., Warrants (February 2007) 358,500 209,113*Harmony Gold Mining Co., Ltd., Sponsored ADR 78,000 1,270,620*Hecla Mining Co. 400,000 2,100,000*Herald Resources Ltd. 1,000,000 957,503*High River Gold Mines Ltd. 1,702,500 3,513,932*IAMGOLD Corp. 470,909 4,191,972Jaguar Mining, Inc. 318,100 1,313,106*Jaguar Mining, Warrants (December 2007) 8,000 9,512*Kingsgate Consolidated Ltd. 319,459 1,218,789Kinross Gold Corp. 231,000 2,522,789*Kinross Gold Corp., Warrants (December 2007) 3,604,400 3,072,805*Leviathan Resources Ltd. 311,110 144,326*LionOre Mining International Ltd. 454,700 2,472,726*Meridian Gold, Inc. 770,500 24,402,768*Mexgold Resources, Inc. 2,188,700 14,121,912*Nevada Pacific Gold Ltd. 3,010,335 3,890,055*Nevsun Resources Ltd. 95,000 273,657*Nevsun Resources Ltd., Warrants (June 2008) 140,460 161,340*Nevsun Resources Ltd., Warrants (October 2008) 21,200 25,493*Northern Orion Resources, Inc. 6,329,110 31,124,512*Northern Orion Resources, Inc., Warrants (May 2008) 4,394,790 15,183,687*Northern Orion Resources, Inc., Warrants (February 2010) 2,089,068 4,593,006*Northgate Minerals Corp. 196,500 720,478*Northgate Minerals Corp., Warrants (December 2006) 5,793,180 6,961,221*Randgold Resources Ltd., ADR 1,747,334 36,694,014*Red Back Mining, Inc. 1,653,000 5,176,982*Red Back Mining, Inc., Warrants (July 2007) 150,000 200,565*Resolute Mining Ltd. 1,360,000 1,766,555*Revett Minerals, Inc. 2,242,900 2,495,801*Rio Narcea Gold Mines Ltd., Warrants (September 2008) 1,240,250 350,589*SEMAFO, Inc. 317,700 632,920*Silvercorp Metals, Inc. 1,159,800 14,987,320*Sino Gold Ltd. 1,000,000 3,711,250*Troy Resources NL 250,000 473,184TVI Pacific, Inc. 10,658,856 1,673,890*Yamana Gold, Inc. 562,806 5,535,383*Yamana Gold, Inc., Warrants (November 2008) 5,240,380 23,513,169*
271,697,457
Investment Trusts 0.80%iShares Silver Trust 20,000 2,227,800*streetTRACKS Gold Trust 84,000 5,143,320*
7,371,120
See notes to portfolios of investments and notes to financial statements.
�81
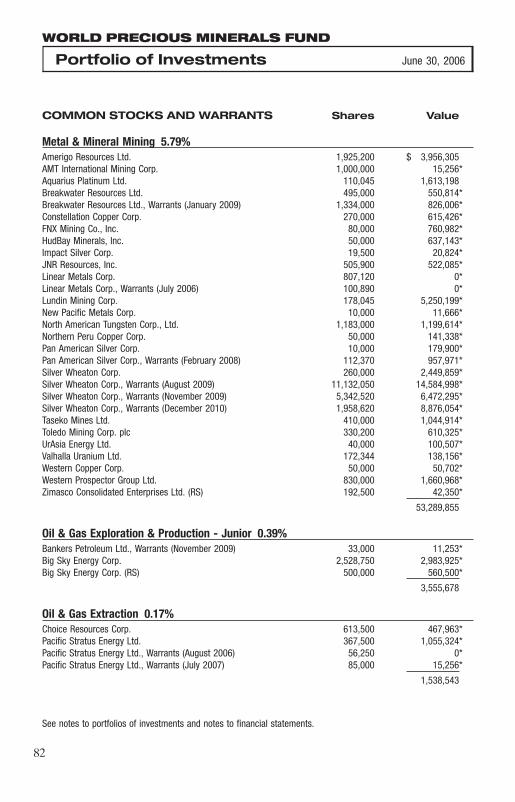
WORLD PRECIOUS MINERALS FUND
Portfolio of Investments June 30, 2006
COMMON STOCKS AND WARRANTS Shares Value
Metal & Mineral Mining 5.79%Amerigo Resources Ltd. 1,925,200 $ 3,956,305AMT International Mining Corp. 1,000,000 15,256*Aquarius Platinum Ltd. 110,045 1,613,198Breakwater Resources Ltd. 495,000 550,814*Breakwater Resources Ltd., Warrants (January 2009) 1,334,000 826,006*Constellation Copper Corp. 270,000 615,426*FNX Mining Co., Inc. 80,000 760,982*HudBay Minerals, Inc. 50,000 637,143*Impact Silver Corp. 19,500 20,824*JNR Resources, Inc. 505,900 522,085*Linear Metals Corp. 807,120 0*Linear Metals Corp., Warrants (July 2006) 100,890 0*Lundin Mining Corp. 178,045 5,250,199*New Pacific Metals Corp. 10,000 11,666*North American Tungsten Corp., Ltd. 1,183,000 1,199,614*Northern Peru Copper Corp. 50,000 141,338*Pan American Silver Corp. 10,000 179,900*Pan American Silver Corp., Warrants (February 2008) 112,370 957,971*Silver Wheaton Corp. 260,000 2,449,859*Silver Wheaton Corp., Warrants (August 2009) 11,132,050 14,584,998*Silver Wheaton Corp., Warrants (November 2009) 5,342,520 6,472,295*Silver Wheaton Corp., Warrants (December 2010) 1,958,620 8,876,054*Taseko Mines Ltd. 410,000 1,044,914*Toledo Mining Corp. plc 330,200 610,325*UrAsia Energy Ltd. 40,000 100,507*Valhalla Uranium Ltd. 172,344 138,156*Western Copper Corp. 50,000 50,702*Western Prospector Group Ltd. 830,000 1,660,968*Zimasco Consolidated Enterprises Ltd. (RS) 192,500 42,350*
53,289,855
Oil & Gas Exploration & Production - Junior 0.39%Bankers Petroleum Ltd., Warrants (November 2009) 33,000 11,253*Big Sky Energy Corp. 2,528,750 2,983,925*Big Sky Energy Corp. (RS) 500,000 560,500*
3,555,678
Oil & Gas Extraction 0.17%Choice Resources Corp. 613,500 467,963*Pacific Stratus Energy Ltd. 367,500 1,055,324*Pacific Stratus Energy Ltd., Warrants (August 2006) 56,250 0*Pacific Stratus Energy Ltd., Warrants (July 2007) 85,000 15,256*
1,538,543
See notes to portfolios of investments and notes to financial statements.
�82

WORLD PRECIOUS MINERALS FUND
Portfolio of Investments June 30, 2006
COMMON STOCKS AND WARRANTS Shares Value
Oil & Gas Royalty Trusts 0.18%ARC Energy Trust 5,000 $ 125,634Bonavista Energy Trust 5,000 157,042Harvest Energy Trust 45,233 1,348,040
1,630,716
Senior Gold Producers 22.39%Barrick Gold Corp. 94,574 2,799,390Freeport-McMoRan Copper & Gold, Inc., Class B 120,000 6,649,200Gold Fields Ltd. 240,000 5,432,064Gold Fields Ltd., Sponsored ADR 571,000 13,075,900Goldcorp, Inc. 4,002,409 120,953,911Goldcorp, Inc., Warrants (April 2007) 100 3,722*Goldcorp, Inc., Warrants (June 2011) 3,798,506 44,108,707*Lihir Gold Ltd. 850,000 1,817,028*Newmont Mining Corp. 100,000 5,293,000Polyus Gold Co., ADR 20,000 860,000*Polyus Gold Co., Class S 117,500 5,052,500*
206,045,422
Total Common Stocks and Warrants 724,745,664
(cost $519,237,449)
INDEX FUND 0.20%
Market Vectors Gold Miners Exchange Traded Fund (ETF)(cost $1,890,601) 49,000 1,896,300*
See notes to portfolios of investments and notes to financial statements.
�83
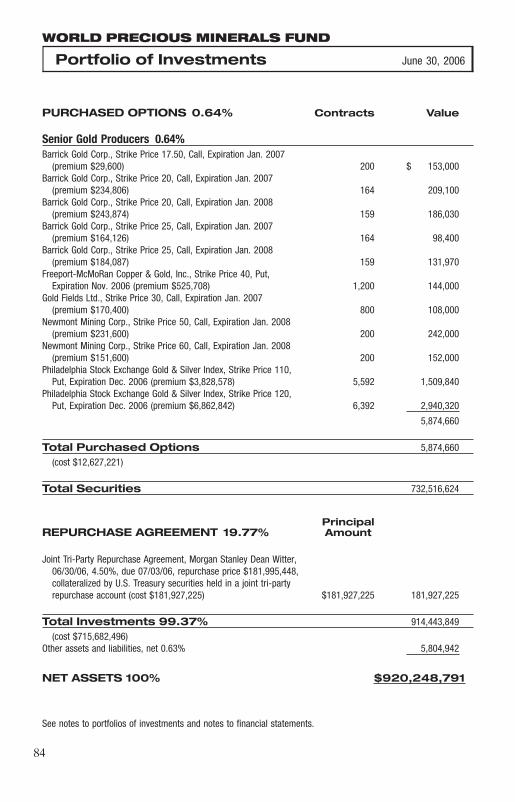
WORLD PRECIOUS MINERALS FUND
Portfolio of Investments June 30, 2006
PURCHASED OPTIONS 0.64% Contracts Value
Senior Gold Producers 0.64%Barrick Gold Corp., Strike Price 17.50, Call, Expiration Jan. 2007
(premium $29,600) 200 $ 153,000Barrick Gold Corp., Strike Price 20, Call, Expiration Jan. 2007
(premium $234,806) 164 209,100Barrick Gold Corp., Strike Price 20, Call, Expiration Jan. 2008
(premium $243,874) 159 186,030Barrick Gold Corp., Strike Price 25, Call, Expiration Jan. 2007
(premium $164,126) 164 98,400Barrick Gold Corp., Strike Price 25, Call, Expiration Jan. 2008
(premium $184,087) 159 131,970Freeport-McMoRan Copper & Gold, Inc., Strike Price 40, Put,
Expiration Nov. 2006 (premium $525,708) 1,200 144,000Gold Fields Ltd., Strike Price 30, Call, Expiration Jan. 2007
(premium $170,400) 800 108,000Newmont Mining Corp., Strike Price 50, Call, Expiration Jan. 2008
(premium $231,600) 200 242,000Newmont Mining Corp., Strike Price 60, Call, Expiration Jan. 2008
(premium $151,600) 200 152,000Philadelphia Stock Exchange Gold & Silver Index, Strike Price 110,
Put, Expiration Dec. 2006 (premium $3,828,578) 5,592 1,509,840Philadelphia Stock Exchange Gold & Silver Index, Strike Price 120,
Put, Expiration Dec. 2006 (premium $6,862,842) 6,392 2,940,320
5,874,660
Total Purchased Options 5,874,660
(cost $12,627,221)
Total Securities 732,516,624
PrincipalREPURCHASE AGREEMENT 19.77% Amount
Joint Tri-Party Repurchase Agreement, Morgan Stanley Dean Witter,06/30/06, 4.50%, due 07/03/06, repurchase price $181,995,448,collateralized by U.S. Treasury securities held in a joint tri-partyrepurchase account (cost $181,927,225) $181,927,225 181,927,225
Total Investments 99.37% 914,443,849
(cost $715,682,496)Other assets and liabilities, net 0.63% 5,804,942
NET ASSETS 100% $920,248,791
See notes to portfolios of investments and notes to financial statements.
�84
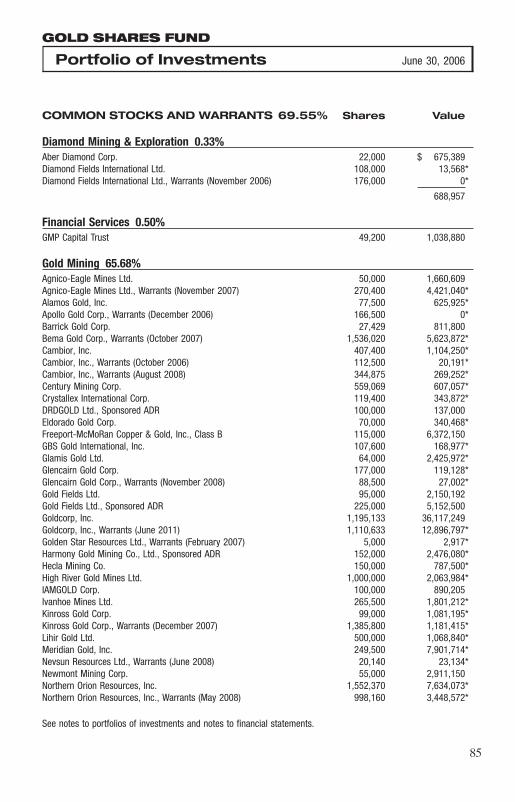
GOLD SHARES FUND
Portfolio of Investments June 30, 2006
COMMON STOCKS AND WARRANTS 69.55% Shares Value
Diamond Mining & Exploration 0.33%Aber Diamond Corp. 22,000 $ 675,389Diamond Fields International Ltd. 108,000 13,568*Diamond Fields International Ltd., Warrants (November 2006) 176,000 0*
688,957
Financial Services 0.50%GMP Capital Trust 49,200 1,038,880
Gold Mining 65.68%Agnico-Eagle Mines Ltd. 50,000 1,660,609Agnico-Eagle Mines Ltd., Warrants (November 2007) 270,400 4,421,040*Alamos Gold, Inc. 77,500 625,925*Apollo Gold Corp., Warrants (December 2006) 166,500 0*Barrick Gold Corp. 27,429 811,800Bema Gold Corp., Warrants (October 2007) 1,536,020 5,623,872*Cambior, Inc. 407,400 1,104,250*Cambior, Inc., Warrants (October 2006) 112,500 20,191*Cambior, Inc., Warrants (August 2008) 344,875 269,252*Century Mining Corp. 559,069 607,057*Crystallex International Corp. 119,400 343,872*DRDGOLD Ltd., Sponsored ADR 100,000 137,000Eldorado Gold Corp. 70,000 340,468*Freeport-McMoRan Copper & Gold, Inc., Class B 115,000 6,372,150GBS Gold International, Inc. 107,600 168,977*Glamis Gold Ltd. 64,000 2,425,972*Glencairn Gold Corp. 177,000 119,128*Glencairn Gold Corp., Warrants (November 2008) 88,500 27,002*Gold Fields Ltd. 95,000 2,150,192Gold Fields Ltd., Sponsored ADR 225,000 5,152,500Goldcorp, Inc. 1,195,133 36,117,249Goldcorp, Inc., Warrants (June 2011) 1,110,633 12,896,797*Golden Star Resources Ltd., Warrants (February 2007) 5,000 2,917*Harmony Gold Mining Co., Ltd., Sponsored ADR 152,000 2,476,080*Hecla Mining Co. 150,000 787,500*High River Gold Mines Ltd. 1,000,000 2,063,984*IAMGOLD Corp. 100,000 890,205Ivanhoe Mines Ltd. 265,500 1,801,212*Kinross Gold Corp. 99,000 1,081,195*Kinross Gold Corp., Warrants (December 2007) 1,385,800 1,181,415*Lihir Gold Ltd. 500,000 1,068,840*Meridian Gold, Inc. 249,500 7,901,714*Nevsun Resources Ltd., Warrants (June 2008) 20,140 23,134*Newmont Mining Corp. 55,000 2,911,150Northern Orion Resources, Inc. 1,552,370 7,634,073*Northern Orion Resources, Inc., Warrants (May 2008) 998,160 3,448,572*
See notes to portfolios of investments and notes to financial statements.
�85
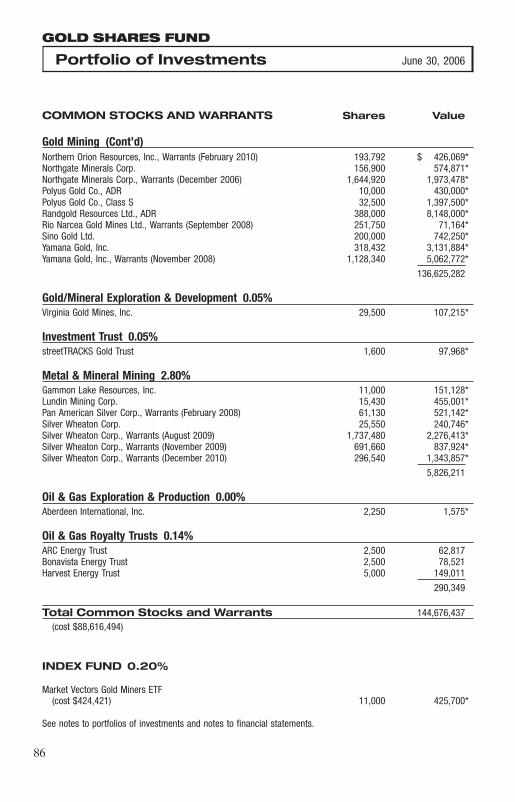
GOLD SHARES FUND
Portfolio of Investments June 30, 2006
COMMON STOCKS AND WARRANTS Shares Value
Gold Mining (Cont’d)Northern Orion Resources, Inc., Warrants (February 2010) 193,792 $ 426,069*Northgate Minerals Corp. 156,900 574,871*Northgate Minerals Corp., Warrants (December 2006) 1,644,920 1,973,478*Polyus Gold Co., ADR 10,000 430,000*Polyus Gold Co., Class S 32,500 1,397,500*Randgold Resources Ltd., ADR 388,000 8,148,000*Rio Narcea Gold Mines Ltd., Warrants (September 2008) 251,750 71,164*Sino Gold Ltd. 200,000 742,250*Yamana Gold, Inc. 318,432 3,131,884*Yamana Gold, Inc., Warrants (November 2008) 1,128,340 5,062,772*
136,625,282
Gold/Mineral Exploration & Development 0.05%Virginia Gold Mines, Inc. 29,500 107,215*
Investment Trust 0.05%streetTRACKS Gold Trust 1,600 97,968*
Metal & Mineral Mining 2.80%Gammon Lake Resources, Inc. 11,000 151,128*Lundin Mining Corp. 15,430 455,001*Pan American Silver Corp., Warrants (February 2008) 61,130 521,142*Silver Wheaton Corp. 25,550 240,746*Silver Wheaton Corp., Warrants (August 2009) 1,737,480 2,276,413*Silver Wheaton Corp., Warrants (November 2009) 691,660 837,924*Silver Wheaton Corp., Warrants (December 2010) 296,540 1,343,857*
5,826,211
Oil & Gas Exploration & Production 0.00%Aberdeen International, Inc. 2,250 1,575*
Oil & Gas Royalty Trusts 0.14%ARC Energy Trust 2,500 62,817Bonavista Energy Trust 2,500 78,521Harvest Energy Trust 5,000 149,011
290,349
Total Common Stocks and Warrants 144,676,437(cost $88,616,494)
INDEX FUND 0.20%
Market Vectors Gold Miners ETF(cost $424,421) 11,000 425,700*
See notes to portfolios of investments and notes to financial statements.
�86
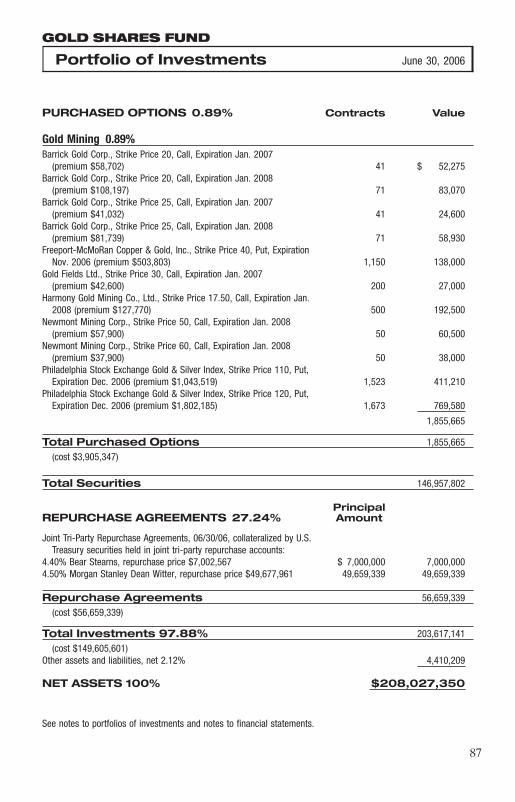
GOLD SHARES FUND
Portfolio of Investments June 30, 2006
PURCHASED OPTIONS 0.89% Contracts Value
Gold Mining 0.89%Barrick Gold Corp., Strike Price 20, Call, Expiration Jan. 2007
(premium $58,702) 41 $ 52,275Barrick Gold Corp., Strike Price 20, Call, Expiration Jan. 2008
(premium $108,197) 71 83,070Barrick Gold Corp., Strike Price 25, Call, Expiration Jan. 2007
(premium $41,032) 41 24,600Barrick Gold Corp., Strike Price 25, Call, Expiration Jan. 2008
(premium $81,739) 71 58,930Freeport-McMoRan Copper & Gold, Inc., Strike Price 40, Put, Expiration
Nov. 2006 (premium $503,803) 1,150 138,000Gold Fields Ltd., Strike Price 30, Call, Expiration Jan. 2007
(premium $42,600) 200 27,000Harmony Gold Mining Co., Ltd., Strike Price 17.50, Call, Expiration Jan.
2008 (premium $127,770) 500 192,500Newmont Mining Corp., Strike Price 50, Call, Expiration Jan. 2008
(premium $57,900) 50 60,500Newmont Mining Corp., Strike Price 60, Call, Expiration Jan. 2008
(premium $37,900) 50 38,000Philadelphia Stock Exchange Gold & Silver Index, Strike Price 110, Put,
Expiration Dec. 2006 (premium $1,043,519) 1,523 411,210Philadelphia Stock Exchange Gold & Silver Index, Strike Price 120, Put,
Expiration Dec. 2006 (premium $1,802,185) 1,673 769,580
1,855,665
Total Purchased Options 1,855,665
(cost $3,905,347)
Total Securities 146,957,802
PrincipalREPURCHASE AGREEMENTS 27.24% Amount
Joint Tri-Party Repurchase Agreements, 06/30/06, collateralized by U.S.Treasury securities held in joint tri-party repurchase accounts:
4.40% Bear Stearns, repurchase price $7,002,567 $ 7,000,000 7,000,0004.50% Morgan Stanley Dean Witter, repurchase price $49,677,961 49,659,339 49,659,339
Repurchase Agreements 56,659,339
(cost $56,659,339)
Total Investments 97.88% 203,617,141
(cost $149,605,601)Other assets and liabilities, net 2.12% 4,410,209
NET ASSETS 100% $208,027,350
See notes to portfolios of investments and notes to financial statements.
�87
Notes to Portfolios of Investments June 30, 2006
Legend
* Non-income producing security GO General Obligation Bond+ Affiliated company (see following) RS Restricted Security (see following)ADR American Depositary Receipt S/R Subscription ReceiptGDR Global Depositary Receipt ZCB Zero Coupon BondCAD Canadian Dollar
General
The yields reflect the effective yield from the date of purchase.
Variable Rate Notes have periodic reset features, which effectively shorten the maturity dates and reset theinterest rates as tied to various interest-bearing instruments. Rates shown are current rates at June 30, 2006.
Securities with a 144A designation are exempt from registration under Rule 144A of the Securities Act of 1933.
Joint Tri-Party Repurchase Agreements
The terms of the joint tri-party repurchase agreements and the securities held as collateral at June 30, 2006were:
Morgan Stanley Dean Witter repurchase agreement, 06/30/06, 4.50%, due 07/03/06:Total principal amount: $417,707,258; Total repurchase price: $417,863,898Collateral:$329,198,000 U.S. Treasury Note, 3.375%, 01/15/07
(total collateral market value, including accrued interest, of $426,061,979)
Bear Stearns repurchase agreement, 06/30/06, 4.40%, due 07/03/06:Total principal amount: $32,000,000; Total repurchase price: $32,011,733Collateral:$18,090,000 U.S. Treasury Note, 2.50%, 09/30/06$15,000,000 U.S. Treasury Note, 3.875%, 07/15/10
(total collateral market value, including accrued interest, of $32,656,193)
Other mutual funds managed by U.S. Global Investors, Inc. participate in the joint tri-party repurchase agree-ments. Each owns an undivided interest in the accounts.
�88
Notes to Portfolios of Investments June 30, 2006
Affiliated Companies - Indicated in Portfolio of Investments as ‘‘+’’
The Investment Company Act of 1940 defines affiliates as companies in which the Fund owns at least 5% of theoutstanding voting securities. The following is a summary of transactions with each affiliated company during theyear ended June 30, 2006.
Shares of Affiliated CompaniesJune 30, 2005 Additions Reductions June 30, 2006
Global Resources FundCoalcorp Mining, Inc. (formerly Adobe
Ventures, Inc.) 2,140,000 19,385,625 (9,237,000) 12,288,625(a)Consolidated Thompson-Lundmark Gold Mines
Ltd. — 900,000 — 900,000Exile Resources, Inc. — 4,278,675 (2,100,000) 2,178,675Pacific Stratus Energy Ltd. 3,000,000 4,282,800 (6,535,800) 747,000(b)PetroWorld Corp. — 2,000,000 — 2,000,000Revett Minerals, Inc. — 4,792,300 (147,000) 4,645,300UMC Energy plc (formerly Uranium Mining
Corp. plc) — 1,000,000 — 1,000,000White Nile Ltd. 12,772,000 748,000 (1,301,000) 12,219,000(a)
At June 30, 2006, the value of investments in affiliated companies was $11,917,720, representing 0.93% of netassets, and the total cost was $10,539,671. Net realized gains on transactions were $511,658, and there was noincome earned for the period.
Shares of Affiliated CompaniesJune 30, 2005 Additions Reductions June 30, 2006
World Precious Minerals FundAberdeen International, Inc. — 3,207,500 (1,000,000) 2,207,500American Gold Capital Corp. 200,000 1,441,900 — 1,641,900Atikwa Minerals Corp. 1,545,333 743,000 — 2,288,333Caledon Resources plc 18,175,000 2,190,000 (75,000) 20,290,000Corona Gold Ltd. 812,500 — — 812,500(a)Diamonds North Resources Ltd. 2,207,000 607,400 (164,000) 2,650,400Endeavour Mining Capital Corp. 1,484,100 — (1,484,100) —(a)Golden Odyssey Mining, Inc. — 1,533,500 (60,000) 1,473,500(a)Grandview Gold, Inc. — 1,754,000 (470,000) 1,284,000Laurion Gold, Inc. 3,438,000 3,242,000 (6,505,000) 175,000(a)Moss Lake Gold Mines Ltd. 2,318,000 435,500 (55,000) 2,698,500Nevada Pacific Gold Ltd. 3,892,335 608,900 (1,490,900) 3,010,335(a)Northern Orion Resources, Inc. 7,336,900 351,100 (1,358,890) 6,329,110(a)Pacific Rim Mining Corp. 5,049,500 239,600 (189,500) 5,099,600(a)Romarco Minerals, Inc. 2,251,000 5,752,353 (22,500) 7,980,853Vedron Gold, Inc. 2,578,500 7,532,259 (4,281,258) 5,829,501
At June 30, 2006, the value of investments in affiliated companies was $13,874,323 representing 1.51% of netassets, and the total cost was $12,733,499. Net realized gains on transactions were $7,959,478, and there was$43,480 of income earned for the period.
(a) At June 30, 2006, the company is no longer defined as an affiliate, although it was an affiliated companyduring the period.
(b) During the period, security was subject to a 1-for-10 stock split.
�89
Notes to Portfolios of Investments June 30, 2006
Restricted Securities - Indicated in Portfolio of Investments as‘‘RS’’
The following securities are subject to legal restrictions on their resale. The issuer bears the cost of registration, ifany, involved in the disposition of these securities.
Acquisition Cost perSECURITY Date Share
China Region Opportunity FundCommon Stocks
Big Sky Energy Corp. 03/01/05 $0.50Verona Development Corp., Units 04/21/06 $0.79
At June 30, 2006, the total cost of restricted securities was $366,525, and the total value was $637,249,representing 0.94% of net assets.
Acquisition Cost perDate Share
Global Resources FundCommon Stocks and Warrants
African Minerals, Special Warrants 07/09/03 $6.00Baja Mining Corp. 03/29/06 $0.77Baja Mining Corp., Warrants (April 2008) 03/29/06 $0.00Big Sky Energy Corp. 03/01/05-08/15/05 $0.64Canadian Sub-Surface Energy Services Corp. 05/23/06 $6.68Dune Energy, Inc. 01/27/06 $2.65Eastern Plantinum Ltd. 03/23/06 $1.07Eastern Plantinum Ltd., Warrants (March 2009) 03/23/06 $0.00Exile Resources, Inc. 05/12/06 $0.45Exile Resources, Inc., Warrants (May 2008) 05/12/06 $0.00Gran Tierra Energy, Inc., Units 05/31/06 $1.50Horizon North Logistics, Inc. 06/05/06 $12.59Horizon North Logistics, Inc., Warrants (August 2006) 06/05/06 $12.59Khan Resources Inc., Special Warrants 03/24/05 $0.82Legacy Energy LLC, 144A 02/27/06 $19.00Osmium Holdings S.A. 10/22/96-01/29/98 $987.07Pacifica Resources Ltd. 03/15/06 $0.61Pacifica Resources Ltd., Warrants (March 2008) 03/15/06 $0.00Red Dragon Resources Corp., Units 06/12/06 $0.68Trident Resources Corp., Units 06/09/06 $62.50Zimasco Consolidated Enterprises Ltd. 06/15/95-09/30/99 $3.73
Note UnitPacific Stratus Energy Ltd. 05/31/06 $0.91
At June 30, 2006, the total cost of restricted securities was $33,597,250, and the total value was $41,345,508,representing 3.23% of net assets.
�90
Notes to Portfolios of Investments June 30, 2006
Acquisition Cost perSECURITY Date Share
World Precious Minerals FundCommon Stocks and Warrants
African Minerals, Special Warrants 07/09/03 $6.00Atlas Cromwell Ltd., 144A, Units 05/03/06 $0.34Baja Mining Corp. 03/29/06 $0.77Baja Mining Corp., Warrants (April 2008) 03/29/06 $0.00Big Sky Energy Corp. 03/01/05 $0.50Grandview Gold, Inc. 02/27/06 $0.96Grandview Gold, Inc., Warrants (July 2009) 02/27/06 $0.00Osmium Holdings S.A. 10/22/96-01/29/98 $1,280.75Platte River Gold U.S., Inc. 03/01/04-06/07/04 $1.15Platte River Gold U.S., Inc., Warrants (March 2009) 03/01/04 $0.00Western Exploration & Development Ltd., 144A, Special Warrants 08/14/97 $0.50Zimasco Consolidated Enterprises Ltd. 06/15/95-09/30/99 $3.73
At June 30, 2006, the total cost of restricted securities was $5,595,466, and the total value was $5,393,303,representing 0.59% of net assets.
�91
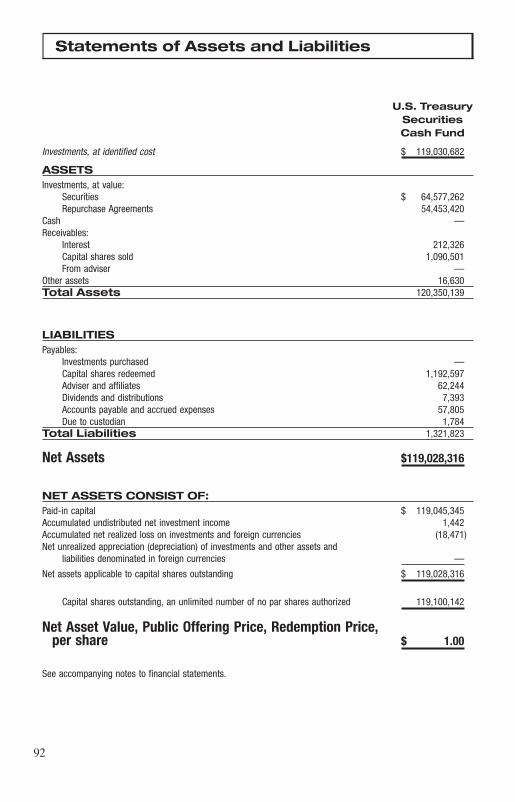
Statements of Assets and Liabilities
U.S. TreasurySecuritiesCash Fund
Investments, at identified cost $ 119,030,682
ASSETSInvestments, at value:
Securities $ 64,577,262Repurchase Agreements 54,453,420
Cash —Receivables:
Interest 212,326Capital shares sold 1,090,501From adviser —
Other assets 16,630Total Assets 120,350,139
LIABILITIESPayables:
Investments purchased —Capital shares redeemed 1,192,597Adviser and affiliates 62,244Dividends and distributions 7,393Accounts payable and accrued expenses 57,805Due to custodian 1,784
Total Liabilities 1,321,823
Net Assets $119,028,316
NET ASSETS CONSIST OF:Paid-in capital $ 119,045,345Accumulated undistributed net investment income 1,442Accumulated net realized loss on investments and foreign currencies (18,471)Net unrealized appreciation (depreciation) of investments and other assets and
liabilities denominated in foreign currencies —
Net assets applicable to capital shares outstanding $ 119,028,316
Capital shares outstanding, an unlimited number of no par shares authorized 119,100,142
Net Asset Value, Public Offering Price, Redemption Price,per share $ 1.00
See accompanying notes to financial statements.
�92
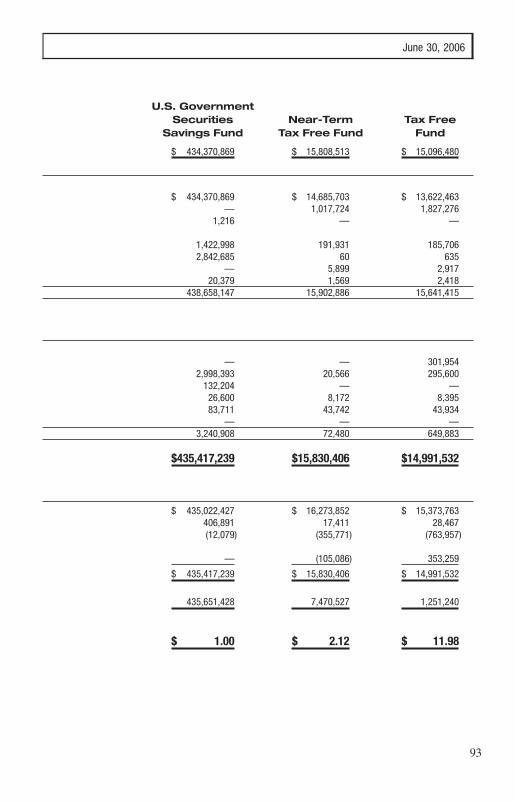
June 30, 2006
U.S. GovernmentSecurities Near-Term Tax Free
Savings Fund Tax Free Fund Fund
$ 434,370,869 $ 15,808,513 $ 15,096,480
$ 434,370,869 $ 14,685,703 $ 13,622,463— 1,017,724 1,827,276
1,216 — —
1,422,998 191,931 185,7062,842,685 60 635
— 5,899 2,91720,379 1,569 2,418
438,658,147 15,902,886 15,641,415
— — 301,9542,998,393 20,566 295,600
132,204 — —26,600 8,172 8,39583,711 43,742 43,934
— — —3,240,908 72,480 649,883
$435,417,239 $15,830,406 $14,991,532
$ 435,022,427 $ 16,273,852 $ 15,373,763406,891 17,411 28,467(12,079) (355,771) (763,957)
— (105,086) 353,259
$ 435,417,239 $ 15,830,406 $ 14,991,532
435,651,428 7,470,527 1,251,240
$ 1.00 $ 2.12 $ 11.98
�93

Statements of Assets and Liabilities
All American China RegionEquity Fund Opportunity Fund
Investments, at identified cost $ 19,982,771 $ 65,705,581
ASSETSInvestments, at value:
Securities of unaffiliated issuers $ 18,581,142 $ 60,011,962Securities of affiliated issuers — —Repurchase Agreements 2,948,119 10,628,365
Cash — —Foreign currencies (cost $216,946, $3,009,
$9,245,927, $1,809,141 and $1,841,824) 217,885 3,009Receivables:
Investments sold 594,626 —Dividends 10,929 111,651Interest 369 1,329Capital shares sold 8,890 607,968
Other assets 5,515 8,219Total Assets 22,367,475 71,372,503
LIABILITIESPayables:
Investments purchased 682,688 3,404,631Capital shares redeemed 76,826 31,767Adviser and affiliates 9,959 84,631Accounts payable and accrued expenses 50,508 90,331
Total Liabilities 819,981 3,611,360
Net Assets $21,547,494 $67,761,143
NET ASSETS CONSIST OF:Paid-in capital $ 17,337,549 $ 65,647,325Accumulated undistributed net investment income
(distributions in excess of net investmentincome) — (1,317,209)
Accumulated net realized gain (loss) on investmentsand foreign currencies 2,660,052 (1,497,142)
Net unrealized appreciation of investments and otherassets and liabilities denominated in foreigncurrencies 1,549,893 4,928,169
Net assets applicable to capital shares outstanding $ 21,547,494 $ 67,761,143
Capital shares outstanding, an unlimited numberof no par shares authorized 781,031 7,783,021
Net Asset Value, Public OfferingPrice, Redemption Price,per share $ 27.59 $ 8.71
See accompanying notes to financial statements.
�94
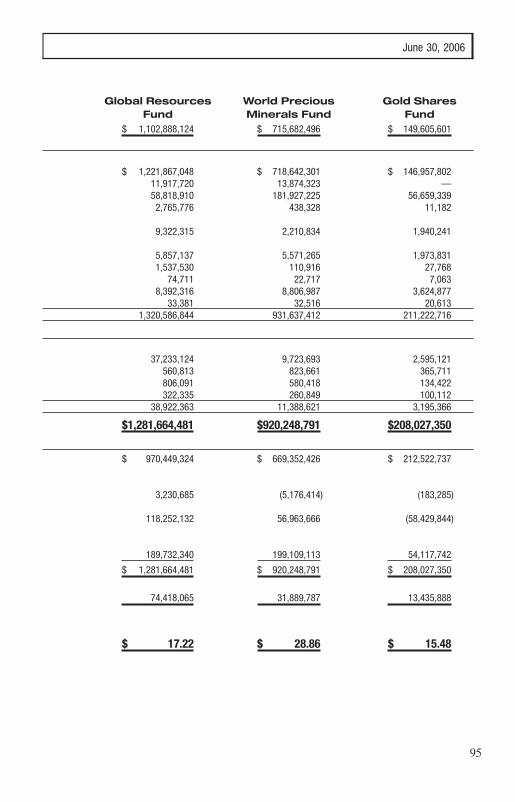
June 30, 2006
Global Resources World Precious Gold SharesFund Minerals Fund Fund
$ 1,102,888,124 $ 715,682,496 $ 149,605,601
$ 1,221,867,048 $ 718,642,301 $ 146,957,80211,917,720 13,874,323 —58,818,910 181,927,225 56,659,3392,765,776 438,328 11,182
9,322,315 2,210,834 1,940,241
5,857,137 5,571,265 1,973,8311,537,530 110,916 27,768
74,711 22,717 7,0638,392,316 8,806,987 3,624,877
33,381 32,516 20,6131,320,586,844 931,637,412 211,222,716
37,233,124 9,723,693 2,595,121560,813 823,661 365,711806,091 580,418 134,422322,335 260,849 100,112
38,922,363 11,388,621 3,195,366
$1,281,664,481 $920,248,791 $208,027,350
$ 970,449,324 $ 669,352,426 $ 212,522,737
3,230,685 (5,176,414) (183,285)
118,252,132 56,963,666 (58,429,844)
189,732,340 199,109,113 54,117,742
$ 1,281,664,481 $ 920,248,791 $ 208,027,350
74,418,065 31,889,787 13,435,888
$ 17.22 $ 28.86 $ 15.48
�95
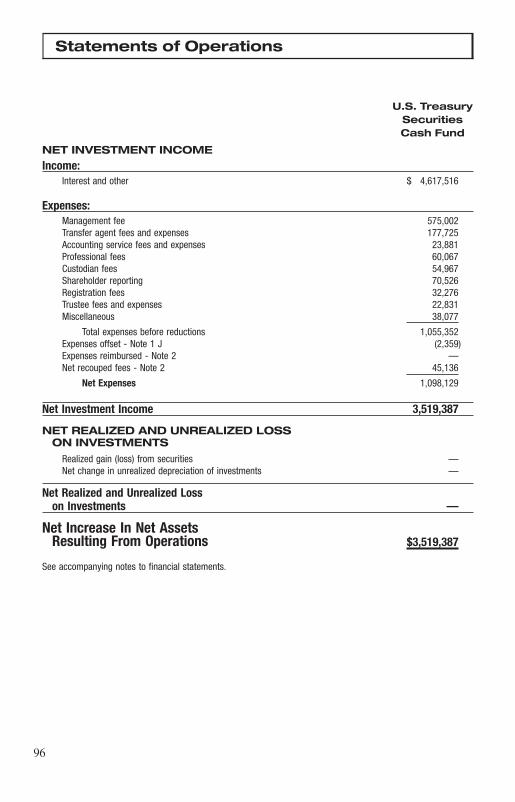
Statements of Operations
U.S. TreasurySecuritiesCash Fund
NET INVESTMENT INCOME
Income:Interest and other $ 4,617,516
Expenses:Management fee 575,002Transfer agent fees and expenses 177,725Accounting service fees and expenses 23,881Professional fees 60,067Custodian fees 54,967Shareholder reporting 70,526Registration fees 32,276Trustee fees and expenses 22,831Miscellaneous 38,077
Total expenses before reductions 1,055,352Expenses offset - Note 1 J (2,359)Expenses reimbursed - Note 2 —Net recouped fees - Note 2 45,136
Net Expenses 1,098,129
Net Investment Income 3,519,387
NET REALIZED AND UNREALIZED LOSSON INVESTMENTS
Realized gain (loss) from securities —Net change in unrealized depreciation of investments —
Net Realized and Unrealized Losson Investments —
Net Increase In Net AssetsResulting From Operations $3,519,387
See accompanying notes to financial statements.
�96

For the Year Ended June 30, 2006
U.S. GovernmentSecurities Near-Term Tax Free
Savings Fund Tax Free Fund Fund
$ 16,818,230 $ 592,304 $ 879,002
1,853,916 83,785 139,880353,547 13,571 14,940
75,039 40,072 36,99369,653 59,607 59,66661,738 13,306 13,824
110,297 4,345 5,41137,762 14,064 13,34322,832 22,831 22,83151,794 6,751 9,135
2,636,578 258,332 316,023— (159) (204)
(786,878) (182,766) (185,264)— — —
1,849,700 75,407 130,555
14,968,530 516,897 748,447
— (198,526) 86,123— (189,289) (662,607)
— (387,815) (576,484)
$14,968,530 $ 129,082 $ 171,963
�97
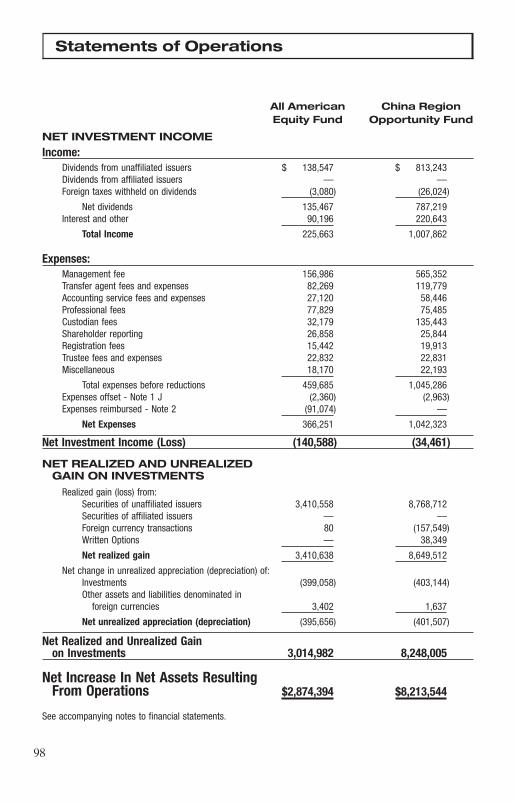
Statements of Operations
All American China RegionEquity Fund Opportunity Fund
NET INVESTMENT INCOME
Income:Dividends from unaffiliated issuers $ 138,547 $ 813,243Dividends from affiliated issuers — —Foreign taxes withheld on dividends (3,080) (26,024)
Net dividends 135,467 787,219Interest and other 90,196 220,643
Total Income 225,663 1,007,862
Expenses:Management fee 156,986 565,352Transfer agent fees and expenses 82,269 119,779Accounting service fees and expenses 27,120 58,446Professional fees 77,829 75,485Custodian fees 32,179 135,443Shareholder reporting 26,858 25,844Registration fees 15,442 19,913Trustee fees and expenses 22,832 22,831Miscellaneous 18,170 22,193
Total expenses before reductions 459,685 1,045,286Expenses offset - Note 1 J (2,360) (2,963)Expenses reimbursed - Note 2 (91,074) —
Net Expenses 366,251 1,042,323
Net Investment Income (Loss) (140,588) (34,461)
NET REALIZED AND UNREALIZEDGAIN ON INVESTMENTS
Realized gain (loss) from:Securities of unaffiliated issuers 3,410,558 8,768,712Securities of affiliated issuers — —Foreign currency transactions 80 (157,549)Written Options — 38,349
Net realized gain 3,410,638 8,649,512
Net change in unrealized appreciation (depreciation) of:Investments (399,058) (403,144)Other assets and liabilities denominated in
foreign currencies 3,402 1,637
Net unrealized appreciation (depreciation) (395,656) (401,507)
Net Realized and Unrealized Gainon Investments 3,014,982 8,248,005
Net Increase In Net Assets ResultingFrom Operations $2,874,394 $8,213,544
See accompanying notes to financial statements.
�98
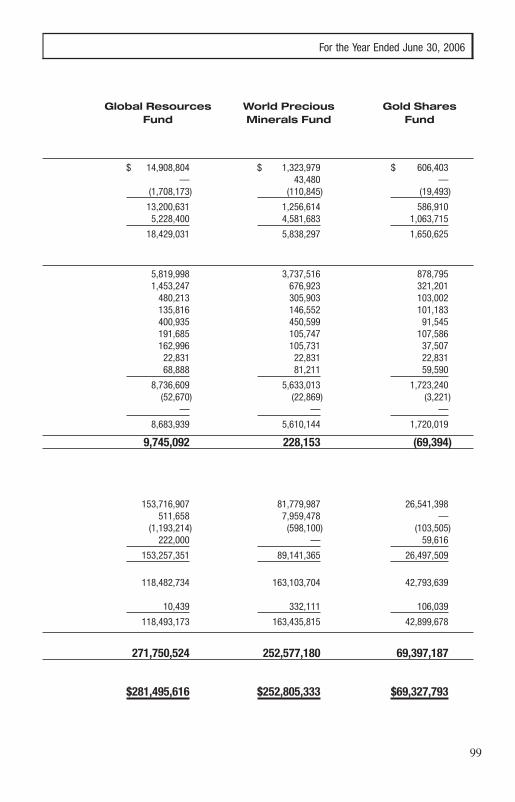
For the Year Ended June 30, 2006
Global Resources World Precious Gold SharesFund Minerals Fund Fund
$ 14,908,804 $ 1,323,979 $ 606,403— 43,480 —
(1,708,173) (110,845) (19,493)
13,200,631 1,256,614 586,9105,228,400 4,581,683 1,063,715
18,429,031 5,838,297 1,650,625
5,819,998 3,737,516 878,7951,453,247 676,923 321,201
480,213 305,903 103,002135,816 146,552 101,183400,935 450,599 91,545191,685 105,747 107,586162,996 105,731 37,50722,831 22,831 22,83168,888 81,211 59,590
8,736,609 5,633,013 1,723,240(52,670) (22,869) (3,221)
— — —
8,683,939 5,610,144 1,720,019
9,745,092 228,153 (69,394)
153,716,907 81,779,987 26,541,398511,658 7,959,478 —
(1,193,214) (598,100) (103,505)222,000 — 59,616
153,257,351 89,141,365 26,497,509
118,482,734 163,103,704 42,793,639
10,439 332,111 106,039
118,493,173 163,435,815 42,899,678
271,750,524 252,577,180 69,397,187
$281,495,616 $252,805,333 $69,327,793
�99
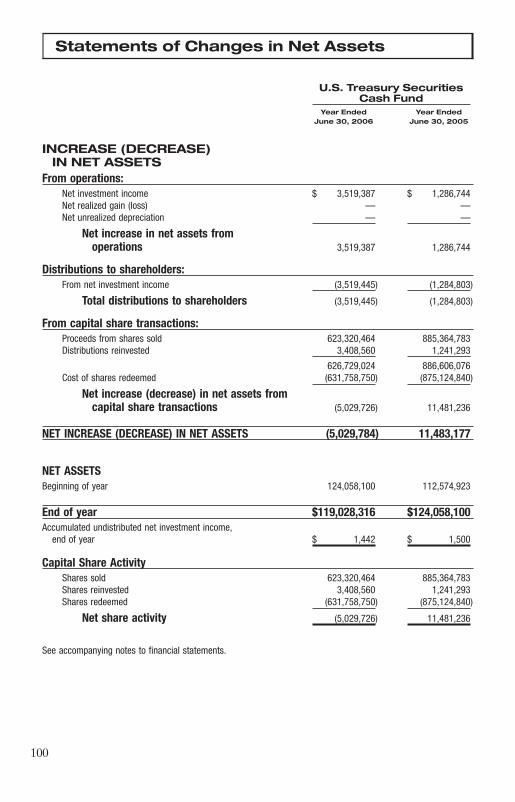
Statements of Changes in Net Assets
U.S. Treasury SecuritiesCash Fund
Year Ended Year EndedJune 30, 2006 June 30, 2005
INCREASE (DECREASE)IN NET ASSETS
From operations:Net investment income $ 3,519,387 $ 1,286,744Net realized gain (loss) — —Net unrealized depreciation — —
Net increase in net assets fromoperations 3,519,387 1,286,744
Distributions to shareholders:From net investment income (3,519,445) (1,284,803)
Total distributions to shareholders (3,519,445) (1,284,803)
From capital share transactions:Proceeds from shares sold 623,320,464 885,364,783Distributions reinvested 3,408,560 1,241,293
626,729,024 886,606,076Cost of shares redeemed (631,758,750) (875,124,840)
Net increase (decrease) in net assets fromcapital share transactions (5,029,726) 11,481,236
NET INCREASE (DECREASE) IN NET ASSETS (5,029,784) 11,483,177
NET ASSETSBeginning of year 124,058,100 112,574,923
End of year $119,028,316 $124,058,100Accumulated undistributed net investment income,
end of year $ 1,442 $ 1,500
Capital Share ActivityShares sold 623,320,464 885,364,783Shares reinvested 3,408,560 1,241,293Shares redeemed (631,758,750) (875,124,840)
Net share activity (5,029,726) 11,481,236
See accompanying notes to financial statements.
�100
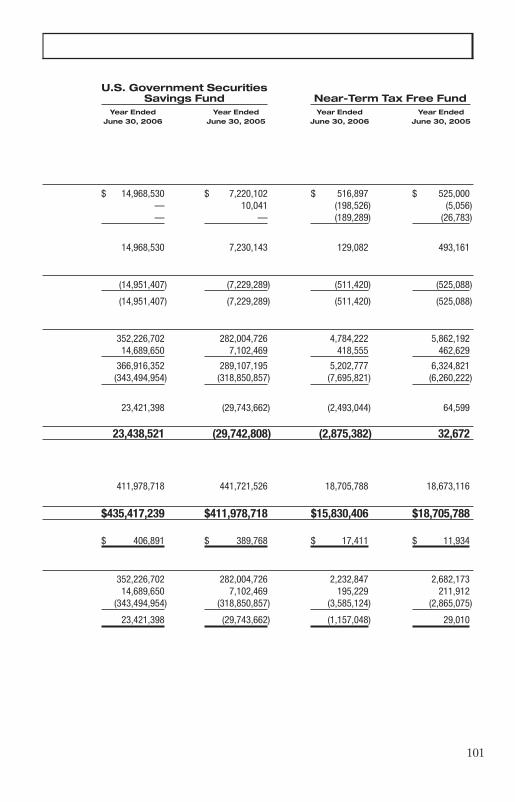
U.S. Government SecuritiesSavings Fund Near-Term Tax Free Fund
Year Ended Year Ended Year Ended Year EndedJune 30, 2006 June 30, 2005 June 30, 2006 June 30, 2005
$ 14,968,530 $ 7,220,102 $ 516,897 $ 525,000— 10,041 (198,526) (5,056)— — (189,289) (26,783)
14,968,530 7,230,143 129,082 493,161
(14,951,407) (7,229,289) (511,420) (525,088)
(14,951,407) (7,229,289) (511,420) (525,088)
352,226,702 282,004,726 4,784,222 5,862,19214,689,650 7,102,469 418,555 462,629
366,916,352 289,107,195 5,202,777 6,324,821(343,494,954) (318,850,857) (7,695,821) (6,260,222)
23,421,398 (29,743,662) (2,493,044) 64,599
23,438,521 (29,742,808) (2,875,382) 32,672
411,978,718 441,721,526 18,705,788 18,673,116
$435,417,239 $411,978,718 $15,830,406 $18,705,788
$ 406,891 $ 389,768 $ 17,411 $ 11,934
352,226,702 282,004,726 2,232,847 2,682,17314,689,650 7,102,469 195,229 211,912
(343,494,954) (318,850,857) (3,585,124) (2,865,075)
23,421,398 (29,743,662) (1,157,048) 29,010
�101
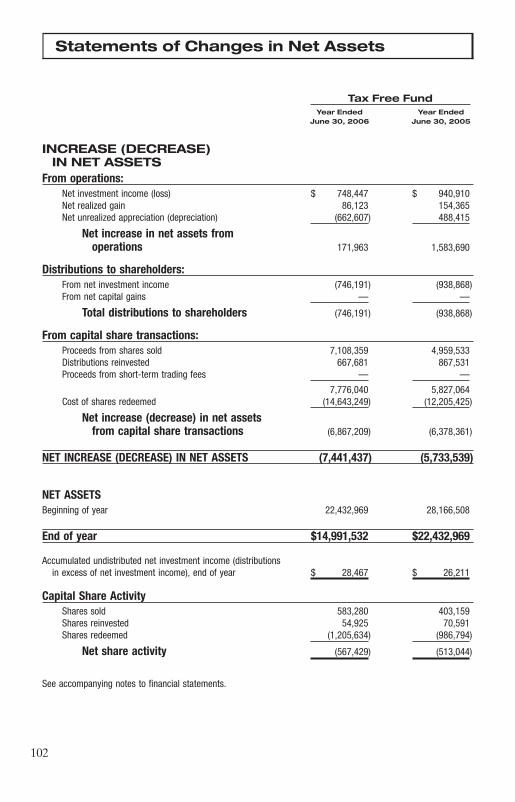
Statements of Changes in Net Assets
Tax Free FundYear Ended Year Ended
June 30, 2006 June 30, 2005
INCREASE (DECREASE)IN NET ASSETS
From operations:Net investment income (loss) $ 748,447 $ 940,910Net realized gain 86,123 154,365Net unrealized appreciation (depreciation) (662,607) 488,415
Net increase in net assets fromoperations 171,963 1,583,690
Distributions to shareholders:From net investment income (746,191) (938,868)From net capital gains — —
Total distributions to shareholders (746,191) (938,868)
From capital share transactions:Proceeds from shares sold 7,108,359 4,959,533Distributions reinvested 667,681 867,531Proceeds from short-term trading fees — —
7,776,040 5,827,064Cost of shares redeemed (14,643,249) (12,205,425)
Net increase (decrease) in net assetsfrom capital share transactions (6,867,209) (6,378,361)
NET INCREASE (DECREASE) IN NET ASSETS (7,441,437) (5,733,539)
NET ASSETSBeginning of year 22,432,969 28,166,508
End of year $14,991,532 $22,432,969
Accumulated undistributed net investment income (distributionsin excess of net investment income), end of year $ 28,467 $ 26,211
Capital Share ActivityShares sold 583,280 403,159Shares reinvested 54,925 70,591Shares redeemed (1,205,634) (986,794)
Net share activity (567,429) (513,044)
See accompanying notes to financial statements.
�102
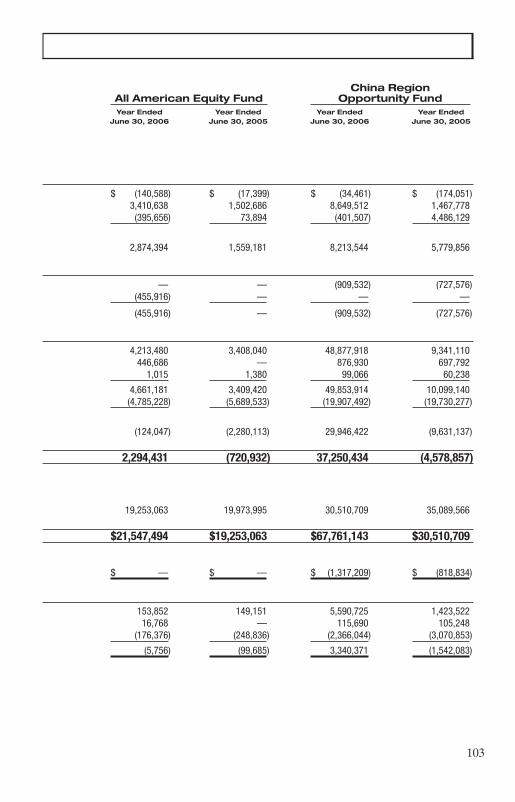
China RegionAll American Equity Fund Opportunity FundYear Ended Year Ended Year Ended Year Ended
June 30, 2006 June 30, 2005 June 30, 2006 June 30, 2005
$ (140,588) $ (17,399) $ (34,461) $ (174,051)3,410,638 1,502,686 8,649,512 1,467,778(395,656) 73,894 (401,507) 4,486,129
2,874,394 1,559,181 8,213,544 5,779,856
— — (909,532) (727,576)(455,916) — — —
(455,916) — (909,532) (727,576)
4,213,480 3,408,040 48,877,918 9,341,110446,686 — 876,930 697,792
1,015 1,380 99,066 60,238
4,661,181 3,409,420 49,853,914 10,099,140(4,785,228) (5,689,533) (19,907,492) (19,730,277)
(124,047) (2,280,113) 29,946,422 (9,631,137)
2,294,431 (720,932) 37,250,434 (4,578,857)
19,253,063 19,973,995 30,510,709 35,089,566
$21,547,494 $19,253,063 $67,761,143 $30,510,709
$ — $ — $ (1,317,209) $ (818,834)
153,852 149,151 5,590,725 1,423,52216,768 — 115,690 105,248
(176,376) (248,836) (2,366,044) (3,070,853)
(5,756) (99,685) 3,340,371 (1,542,083)
�103
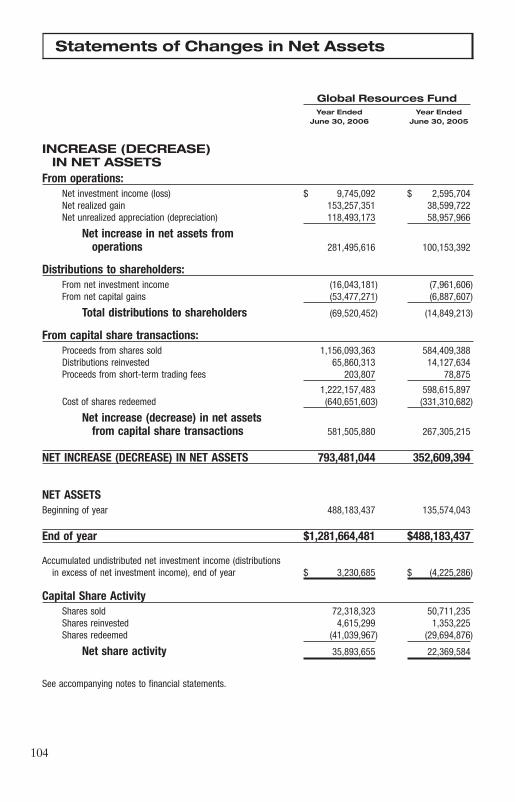
Statements of Changes in Net Assets
Global Resources FundYear Ended Year Ended
June 30, 2006 June 30, 2005
INCREASE (DECREASE)IN NET ASSETS
From operations:Net investment income (loss) $ 9,745,092 $ 2,595,704Net realized gain 153,257,351 38,599,722Net unrealized appreciation (depreciation) 118,493,173 58,957,966
Net increase in net assets fromoperations 281,495,616 100,153,392
Distributions to shareholders:From net investment income (16,043,181) (7,961,606)From net capital gains (53,477,271) (6,887,607)
Total distributions to shareholders (69,520,452) (14,849,213)
From capital share transactions:Proceeds from shares sold 1,156,093,363 584,409,388Distributions reinvested 65,860,313 14,127,634Proceeds from short-term trading fees 203,807 78,875
1,222,157,483 598,615,897Cost of shares redeemed (640,651,603) (331,310,682)
Net increase (decrease) in net assetsfrom capital share transactions 581,505,880 267,305,215
NET INCREASE (DECREASE) IN NET ASSETS 793,481,044 352,609,394
NET ASSETSBeginning of year 488,183,437 135,574,043
End of year $1,281,664,481 $488,183,437
Accumulated undistributed net investment income (distributionsin excess of net investment income), end of year $ 3,230,685 $ (4,225,286)
Capital Share ActivityShares sold 72,318,323 50,711,235Shares reinvested 4,615,299 1,353,225Shares redeemed (41,039,967) (29,694,876)
Net share activity 35,893,655 22,369,584
See accompanying notes to financial statements.
�104
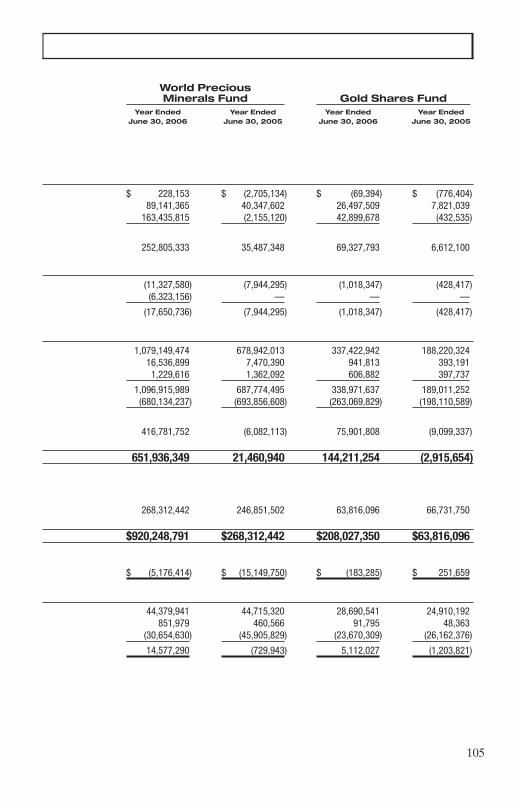
World PreciousMinerals Fund Gold Shares Fund
Year Ended Year Ended Year Ended Year EndedJune 30, 2006 June 30, 2005 June 30, 2006 June 30, 2005
$ 228,153 $ (2,705,134) $ (69,394) $ (776,404)89,141,365 40,347,602 26,497,509 7,821,039
163,435,815 (2,155,120) 42,899,678 (432,535)
252,805,333 35,487,348 69,327,793 6,612,100
(11,327,580) (7,944,295) (1,018,347) (428,417)(6,323,156) — — —
(17,650,736) (7,944,295) (1,018,347) (428,417)
1,079,149,474 678,942,013 337,422,942 188,220,32416,536,899 7,470,390 941,813 393,1911,229,616 1,362,092 606,882 397,737
1,096,915,989 687,774,495 338,971,637 189,011,252(680,134,237) (693,856,608) (263,069,829) (198,110,589)
416,781,752 (6,082,113) 75,901,808 (9,099,337)
651,936,349 21,460,940 144,211,254 (2,915,654)
268,312,442 246,851,502 63,816,096 66,731,750
$920,248,791 $268,312,442 $208,027,350 $63,816,096
$ (5,176,414) $ (15,149,750) $ (183,285) $ 251,659
44,379,941 44,715,320 28,690,541 24,910,192851,979 460,566 91,795 48,363
(30,654,630) (45,905,829) (23,670,309) (26,162,376)
14,577,290 (729,943) 5,112,027 (1,203,821)
�105

Notes to Financial Statements June 30, 2006
NOTE 1: SIGNIFICANT ACCOUNTING POLICIES
U.S. Global Investors Funds (Trust) is organized as a Massachusetts business trust,consisting of nine separate funds (Funds), as follows: U.S. Treasury SecuritiesCash, U.S. Government Securities Savings, Near-Term Tax Free, Tax Free, AllAmerican Equity, China Region Opportunity, Global Resources, World PreciousMinerals and Gold Shares. The Trust is an open-end management investmentcompany registered under the Investment Company Act of 1940, as amended. Allfunds are diversified with the exception of China Region Opportunity, GlobalResources, World Precious Minerals and Gold Shares.
The following is a summary of significant accounting policies consistently followedby the Funds in the preparation of their financial statements. The policies are inconformity with accounting principles generally accepted in the United States.
A. Security ValuationsThe Funds value investments traded on national or international securitiesexchanges or over-the-counter at the last sales price reported by the security’sprimary exchange at the time of daily valuation. Securities for which no sale wasreported are valued at the mean between the last reported bid and asked prices orusing quotes provided by principal market makers. Short-term investments witheffective maturities of sixty days or less at the date of purchase and investments ofU.S. Treasury Securities Cash and U.S. Government Securities Savings Funds arevalued at amortized cost, which approximates market value. An independentpricing service values municipal securities and long-term U.S. Government obliga-tions using a system based on such factors as credit rating, maturity, coupon andtype of security to determine fair value.
B. Fair Valued SecuritiesSecurities for which market quotations are not readily available or which aresubject to legal restrictions are valued at their fair value as determined in goodfaith under consistently applied procedures under the general supervision of theBoard of Trustees. The following factors are generally considered in determiningfair value: nature and duration of any trading restrictions, trading volume, marketvalues of unrestricted shares of the same or similar class, investment manage-ment’s judgment regarding the market experience of the issuer, financial statusand other operational and market factors affecting the issuer, issuer’s manage-ment, quality of the underlying property based on review of independent geologi-cal studies, the extent of a Fund’s investment in the trading securities of the issuer;and other relevant matters. The fair values may differ from what would have beenused had a broader market for these securities existed.
For securities traded on international exchanges, if events which may materiallyaffect the value of a Fund’s securities occur after the close of the primary exchange
�106
Notes to Financial Statements June 30, 2006
and before a Fund’s net asset value is next determined, then those securities willbe valued at their fair value as determined in good faith under the supervision ofthe Board of Trustees. The Funds may use a systematic fair value model providedby an independent third party to value international securities.
C. Security Transactions and Investment IncomeSecurity transactions are accounted for on trade date. Realized gains and lossesfrom security transactions are determined on an identified-cost basis. Dividendincome is recorded on the ex-dividend date, except that certain dividends fromforeign securities where the ex-dividend date may have passed are recorded assoon as a fund is informed of the ex-dividend data in the exercise of reasonablediligence. Interest income, which may include original issue discount, is recordedon an accrual basis. Discounts and premiums on securities purchased are accretedand amortized, respectively, on a yield-to-maturity basis as adjustments to interestincome.
The Funds may purchase securities on a when-issued or delayed-delivery basis andsegregate the liquid assets on their books to collateralize the obligation until tradesettlement. Such investments are accounted for in the same manner as marketableportfolio securities.
The equity funds may invest in private placements and initial public offerings(IPOs), the volatility of which may significantly affect performance. There is noguarantee that these high-risk investments will affect a Fund’s performance in thesame way in the future.
D. Repurchase AgreementsThe Funds may enter into repurchase agreements with recognized financial insti-tutions or registered broker-dealers and, in all instances, hold, as collateral,underlying securities with a value exceeding the principal amount of the repur-chase obligation. The Funds use joint tri-party repurchase agreement accountswith other funds under common management where uninvested cash is collec-tively invested in repurchase agreements, and each participating fund owns anundivided interest in the account.
E. OptionsSome Funds may write or purchase options on securities to manage their exposureto stock or commodity markets as well as fluctuations in interest and currencyconversion rates. Written options include a risk of loss in excess of the optionpremium. The use of options carries the risk of a change in value of the underlyinginstruments, an illiquid secondary market, or failure of the counterparty to per-form its obligations. The option premium is the basis for recognition of unrealizedor realized gain or loss on the option. The cost of securities acquired or theproceeds from securities sold through the exercise of the option is adjusted by the
�107
Notes to Financial Statements June 30, 2006
amount of the premium. Transactions in written call options during the year endedJune 30, 2006, were as follows:
China Region GlobalOpportunity Fund Resources Fund Gold Shares Fund
Number of Premiums Number of Premiums Number of PremiumsContracts Received Contracts Received Contracts Received
Options outstandingat June 30, 2005 — $ — — $ — — $ —
Options written 190 38,349 1,600 222,000 225 59,616Options terminated in
closing purchaseoptions (80) (19,059) (1,600) (222,000) (225) (59,616)
Options expired — — — — — —Options exercised (110) (19,290) — — — —
Options outstanding atJune 30, 2006 — $ — — $ — — $ —
F. Foreign Currency TransactionsSome Funds may invest in securities of foreign issuers. The accounting records ofthese funds are maintained in U.S. dollars. At each net asset value determinationdate, the value of assets and liabilities denominated in foreign currencies aretranslated into U.S. dollars using the current prevailing exchange rate. Securitytransactions, income and expenses are converted at the prevailing rate ofexchange on the respective dates of the transaction. The effect of changes inforeign exchange rates on foreign denominated securities is included with the netrealized and unrealized gain or loss on securities. Other unrealized foreign cur-rency gains or losses are reported separately.
G. Forward Foreign Currency ContractsThe Funds may enter into forward foreign currency contracts to lock in the U.S.dollar cost of purchase and sale transactions or to defend the portfolio againstcurrency fluctuations. A forward foreign currency contract is a commitment topurchase or sell a foreign currency at a future date at a negotiated rate. Thesecontracts are valued daily, and the fund’s net equity therein, representing unreal-ized gain or loss on the contracts as measured by the difference between theforward foreign exchange rates at the dates of entry into the contracts and theforward rates at the reporting, is included in the statement of assets and liabilities.Realized and unrealized gains and losses are included in the statement of opera-tions. Risks may arise upon entering into these contracts from the potentialinability of counterparties to meet the terms of the contract and from unantici-pated movements in the value of foreign currencies relative to the U.S. dollar.There were no open forward foreign currency contracts at June 30, 2006.
H. Federal Income TaxesThe Funds intend to continue to comply with the requirements of Subchapter M ofthe Internal Revenue Code applicable to regulated investment companies and to
�108
Notes to Financial Statements June 30, 2006
distribute substantially all of their taxable income to shareholders. Accordingly,no provision for federal income taxes is required.
In June 2006, the Financial Accounting Standards Board issued Interpretation No.48, Accounting for Uncertainty in Income Taxes (FIN 48). FIN 48 sets forth arecognition threshold and measurement method for the financial statement recog-nition and measurement of a tax position taken or expected to be taken on a taxreturn. FIN 48 will be effective for the Funds’ fiscal year ending June 30, 2008, andwill be applied to all open tax years as of the effective date. No determination hasbeen made whether the adoption of FIN 48 will impact the Funds’ net assets orhave any other effect on the Funds’ financial statements.
I. Dividends and Distributions to ShareholdersThe Funds record dividends and distributions to shareholders on the ex-dividenddate. Distributions are determined in accordance with income tax regulations,which may differ from accounting principles generally accepted in the UnitedStates. Accordingly, periodic reclassifications are made within the Funds’ capitalaccounts to reflect income and gains available for distribution under income taxregulations.
The Funds generally make distributions at least annually. The U.S. TreasurySecurities Cash and U.S. Government Securities Savings Funds accrue dividends,on a daily basis with payment monthly. Tax Free and Near-Term Tax Free paymonthly dividends. Dividends and distributions payable at period end areprocessed for reinvestment on the following business day.
J. ExpensesEach Fund bears expenses incurred specifically on its behalf plus an allocation ofits share of Trust level expenses. Expense offset arrangements have been madewith the Funds’ custodian so the custodian fees may be paid indirectly by creditsearned on the Funds’ cash balances. Such deposit arrangements are an alternativeto overnight investments.
K. Short-Term Trading (Redemption) FeesShares held in the All American Equity Fund less than 30 days are subject to ashort-term trading fee equal to 0.10% of the proceeds of the redeemed shares.Shares held in the China Region Opportunity Fund less than 180 days are subjectto a short-term trading fee equal to 1.00% of the proceeds of the redeemed shares.Shares held in the Global Resources Fund held less than 30 days are subject to ashort-term trading fee equal to 0.25% of the proceeds of the redeemed shares.Shares held in the World Precious Minerals and Gold Shares Funds less than 30days are subject to a short-term trading fee equal to 0.50% of the proceeds of theredeemed shares. These fees, which are retained by the Funds, are accounted foras an addition to paid-in capital.
�109

Notes to Financial Statements June 30, 2006
L. Use of Estimates in Financial Statement PreparationThe preparation of financial statements in conformity with accounting principlesgenerally accepted in the United States requires management to make estimatesand assumptions that affect the reported amounts of assets and liabilities anddisclosure of contingent assets and liabilities at the date of the financial statementsand the reported amounts of income and expenses during the reporting period.Actual results could differ from those estimates.
NOTE 2: RELATED PARTY TRANSACTIONS
U.S. Global Investors, Inc. (Adviser), under an investment advisory agreementwith the Trust in effect through February 28, 2007, furnishes management andinvestment advisory services and, subject to the supervision of the Trustees, directsthe investments of each fund according to its investment objectives, policies andlimitations. The Adviser also furnishes all necessary office facilities, businessequipment and personnel for administering the affairs of the Trust. Frank E.Holmes, a trustee of the Funds, is the controlling owner of the Adviser.
For the services of the Adviser, each fund pays a management fee based upon itsnet assets. Fees are accrued daily and paid monthly. The contractual managementfee for each fund is:
Annual Percentage ofFund Average Daily Net Assets
Gold Shares, All American Equity .75% of the first $250,000,000 andand Tax Free .50% of the excess
U.S. Treasury Securities Cash and .50% of the first $250,000,000 andU.S. Government Securities Savings .375% of the excess
World Precious Minerals and Global 1.00% of the first $250,000,000 andResources .50% of the excess
Near-Term Tax Free 0.50%
China Region Opportunity 1.25%
The Adviser has voluntarily agreed to reimburse specific funds so that their totaloperating expenses will not exceed certain annual percentages of average netassets. The expenses for the year ended June 30, 2006, were voluntarily limited asfollows: U.S. Government Securities Savings at 0.45%, Near-Term Tax Free at0.45%, Tax Free at 0.70% and All American Equity at 1.75%. In addition, theAdviser has contractually limited total fund operating expenses to not exceed0.45% for the U.S. Government Securities Savings Fund, 0.45% for the Near-Term Tax Free Fund, 0.70% for the Tax Free Fund and 1.75% for the AllAmerican Equity Fund on an annualized basis through November 01, 2006, anduntil such later date as the Adviser determines.
�110
Notes to Financial Statements June 30, 2006
The Adviser has also voluntarily agreed to waive fees and/or reimburse U.S.Treasury Securities Cash Fund and U.S. Government Securities Savings Fund tothe extent necessary to maintain the fund’s yield at a certain level as determinedby the Adviser (Minimum Yield). The Adviser may recapture any fees waivedand/or expenses reimbursed within three years after the end of the fiscal year ofsuch waiver and/or reimbursement to the extent that such recapture would notcause the fund’s yield to fall below the Minimum Yield. For the year ended June30, 2004, fees waived and/or expenses reimbursed as a result of this agreementwere $45,136 and $0 for the U.S. Treasury Securities Cash Fund and the U.S.Government Securities Savings Fund, respectively. These amounts were recover-able by the Adviser through June 30, 2007. The U.S. Treasury Securities CashFund reimbursed the Adviser the previously waived amount of $45,136 during theyear ended June 30, 2006. As of June 30, 2006, there were no amounts recoverableby the Adviser under this agreement.
United Shareholder Services, Inc. (USSI), a wholly-owned subsidiary of theAdviser, is the transfer agent for the funds. Each fund pays an annual fee based onits number of shareholder accounts for transfer agency services. Certain accountfees are paid directly by shareholders to the transfer agent, which, in turn, reducesits charge to the Funds. Brown Brothers Harriman & Co. serves as the custodian,fund accounting and administration service agent with a fee structure basedprimarily on average net assets of the Funds. Additionally, the Adviser wasreimbursed for in-house legal and internal administration services pertaining tothe Funds during the year ended June 30, 2006, in the amounts of $232,967 and$33,533, respectively.
During the year ended June 30, 2006, A & B Mailers, Inc., a wholly-ownedsubsidiary of the Adviser, was paid $347,423 for mailing services provided to theFunds.
The independent Trustees receive compensation for serving on the Board. TheChairman and members of special committees receive additional compensation.Trustees are also reimbursed for out-of-pocket expenses incurred while attendingmeetings. Frank E. Holmes receives no compensation from the Funds for servingon the Board.
�111
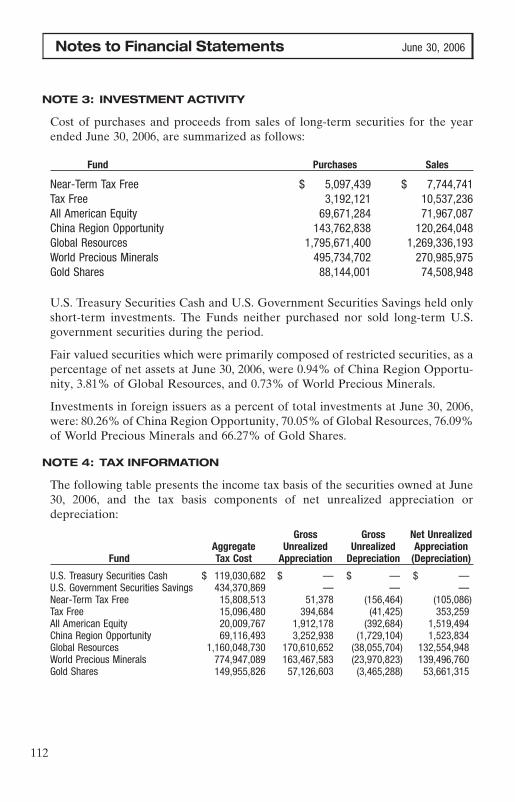
Notes to Financial Statements June 30, 2006
NOTE 3: INVESTMENT ACTIVITY
Cost of purchases and proceeds from sales of long-term securities for the yearended June 30, 2006, are summarized as follows:
Fund Purchases Sales
Near-Term Tax Free $ 5,097,439 $ 7,744,741Tax Free 3,192,121 10,537,236All American Equity 69,671,284 71,967,087China Region Opportunity 143,762,838 120,264,048Global Resources 1,795,671,400 1,269,336,193World Precious Minerals 495,734,702 270,985,975Gold Shares 88,144,001 74,508,948
U.S. Treasury Securities Cash and U.S. Government Securities Savings held onlyshort-term investments. The Funds neither purchased nor sold long-term U.S.government securities during the period.
Fair valued securities which were primarily composed of restricted securities, as apercentage of net assets at June 30, 2006, were 0.94% of China Region Opportu-nity, 3.81% of Global Resources, and 0.73% of World Precious Minerals.
Investments in foreign issuers as a percent of total investments at June 30, 2006,were: 80.26% of China Region Opportunity, 70.05% of Global Resources, 76.09%of World Precious Minerals and 66.27% of Gold Shares.
NOTE 4: TAX INFORMATION
The following table presents the income tax basis of the securities owned at June30, 2006, and the tax basis components of net unrealized appreciation ordepreciation:
Gross Gross Net UnrealizedAggregate Unrealized Unrealized Appreciation
Fund Tax Cost Appreciation Depreciation (Depreciation)
U.S. Treasury Securities Cash $ 119,030,682 $ — $ — $ —U.S. Government Securities Savings 434,370,869 — — —Near-Term Tax Free 15,808,513 51,378 (156,464) (105,086)Tax Free 15,096,480 394,684 (41,425) 353,259All American Equity 20,009,767 1,912,178 (392,684) 1,519,494China Region Opportunity 69,116,493 3,252,938 (1,729,104) 1,523,834Global Resources 1,160,048,730 170,610,652 (38,055,704) 132,554,948World Precious Minerals 774,947,089 163,467,583 (23,970,823) 139,496,760Gold Shares 149,955,826 57,126,603 (3,465,288) 53,661,315
�112

Notes to Financial Statements June 30, 2006
As of June 30, 2006, the components of distributable earnings on a tax basis wereas follows:
Undistributed Undistributed Undistributed Net UnrealizedTax Exempt Ordinary Long-Term Appreciation
Fund Income Income Capital Gains (Depreciation)
U.S. Treasury Securities Cash $ — $ 8,835 $ — $ —U.S. Government Securities Savings — 433,491 — —Near-Term Tax Free — 25,583 — (105,086)Tax Free — 36,862 — 353,259All American Equity — 2,478,347 208,701 1,522,897China Region Opportunity — 1,331,121 — 1,517,257Global Resources — 142,212,918 36,435,112 132,567,127World Precious Minerals — 77,614,502 33,437,343 139,844,520Gold Shares — — — 53,768,080
The differences between book-basis and tax-basis unrealized appreciation (depre-ciation) for All American Equity, China Region Opportunity, Global Resources,World Precious Minerals and Gold Shares are attributable primarily to the taxdeferral of losses on wash sales, investment in passive foreign investment compa-nies (PFIC), forwards marked to market and unreversed return of capital inCanadian Trusts.
The tax character of distributions paid during the year ended June 30, 2006, wereas follows:
Tax-Exempt Ordinary Long-TermFund Income Income Capital Gains Total
U.S. Treasury Securities Cash $ — $ 3,519,445 $ — $ 3,519,445U.S. Government Securities Savings — 14,951,407 — 14,951,407Near-Term Tax Free 458,132 53,288 — 511,420Tax Free 705,578 40,613 — 746,191All American Equity — — 455,916 455,916China Region Opportunity — 909,532 — 909,532Global Resources — 59,079,652 10,440,800 69,520,452World Precious Minerals — 12,189,828 5,460,908 17,650,736Gold Shares — 1,018,347 — 1,018,347
�113
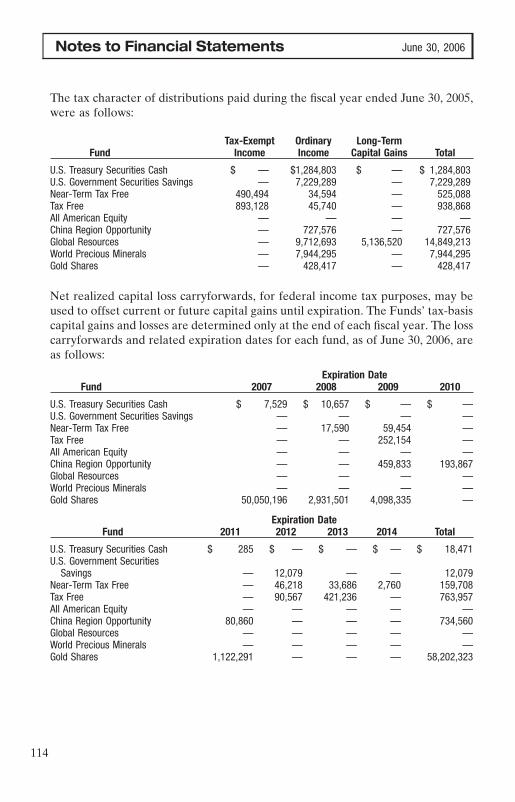
Notes to Financial Statements June 30, 2006
The tax character of distributions paid during the fiscal year ended June 30, 2005,were as follows:
Tax-Exempt Ordinary Long-TermFund Income Income Capital Gains Total
U.S. Treasury Securities Cash $ — $1,284,803 $ — $ 1,284,803U.S. Government Securities Savings — 7,229,289 — 7,229,289Near-Term Tax Free 490,494 34,594 — 525,088Tax Free 893,128 45,740 — 938,868All American Equity — — — —China Region Opportunity — 727,576 — 727,576Global Resources — 9,712,693 5,136,520 14,849,213World Precious Minerals — 7,944,295 — 7,944,295Gold Shares — 428,417 — 428,417
Net realized capital loss carryforwards, for federal income tax purposes, may beused to offset current or future capital gains until expiration. The Funds’ tax-basiscapital gains and losses are determined only at the end of each fiscal year. The losscarryforwards and related expiration dates for each fund, as of June 30, 2006, areas follows:
Expiration DateFund 2007 2008 2009 2010
U.S. Treasury Securities Cash $ 7,529 $ 10,657 $ — $ —U.S. Government Securities Savings — — — —Near-Term Tax Free — 17,590 59,454 —Tax Free — — 252,154 —All American Equity — — — —China Region Opportunity — — 459,833 193,867Global Resources — — — —World Precious Minerals — — — —Gold Shares 50,050,196 2,931,501 4,098,335 —
Expiration DateFund 2011 2012 2013 2014 Total
U.S. Treasury Securities Cash $ 285 $ — $ — $ — $ 18,471U.S. Government Securities
Savings — 12,079 — — 12,079Near-Term Tax Free — 46,218 33,686 2,760 159,708Tax Free — 90,567 421,236 — 763,957All American Equity — — — — —China Region Opportunity 80,860 — — — 734,560Global Resources — — — — —World Precious Minerals — — — — —Gold Shares 1,122,291 — — — 58,202,323
�114
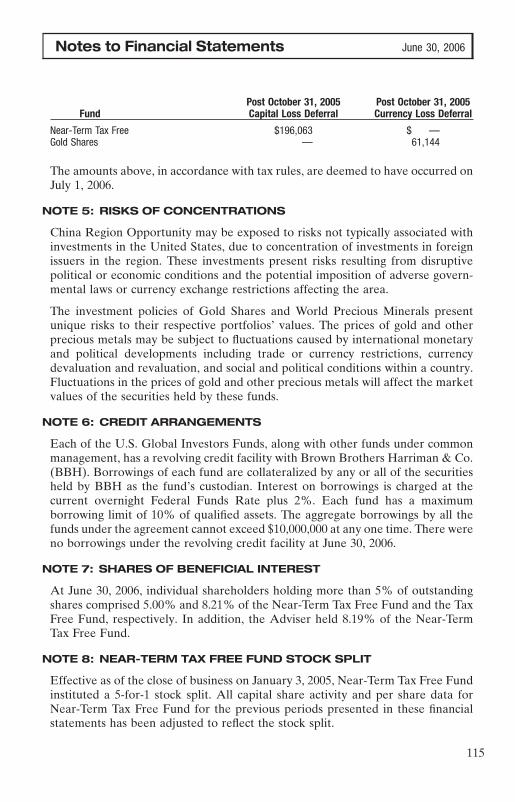
Notes to Financial Statements June 30, 2006
Post October 31, 2005 Post October 31, 2005Fund Capital Loss Deferral Currency Loss Deferral
Near-Term Tax Free $196,063 $ —Gold Shares — 61,144
The amounts above, in accordance with tax rules, are deemed to have occurred onJuly 1, 2006.
NOTE 5: RISKS OF CONCENTRATIONS
China Region Opportunity may be exposed to risks not typically associated withinvestments in the United States, due to concentration of investments in foreignissuers in the region. These investments present risks resulting from disruptivepolitical or economic conditions and the potential imposition of adverse govern-mental laws or currency exchange restrictions affecting the area.
The investment policies of Gold Shares and World Precious Minerals presentunique risks to their respective portfolios’ values. The prices of gold and otherprecious metals may be subject to fluctuations caused by international monetaryand political developments including trade or currency restrictions, currencydevaluation and revaluation, and social and political conditions within a country.Fluctuations in the prices of gold and other precious metals will affect the marketvalues of the securities held by these funds.
NOTE 6: CREDIT ARRANGEMENTS
Each of the U.S. Global Investors Funds, along with other funds under commonmanagement, has a revolving credit facility with Brown Brothers Harriman & Co.(BBH). Borrowings of each fund are collateralized by any or all of the securitiesheld by BBH as the fund’s custodian. Interest on borrowings is charged at thecurrent overnight Federal Funds Rate plus 2%. Each fund has a maximumborrowing limit of 10% of qualified assets. The aggregate borrowings by all thefunds under the agreement cannot exceed $10,000,000 at any one time. There wereno borrowings under the revolving credit facility at June 30, 2006.
NOTE 7: SHARES OF BENEFICIAL INTEREST
At June 30, 2006, individual shareholders holding more than 5% of outstandingshares comprised 5.00% and 8.21% of the Near-Term Tax Free Fund and the TaxFree Fund, respectively. In addition, the Adviser held 8.19% of the Near-TermTax Free Fund.
NOTE 8: NEAR-TERM TAX FREE FUND STOCK SPLIT
Effective as of the close of business on January 3, 2005, Near-Term Tax Free Fundinstituted a 5-for-1 stock split. All capital share activity and per share data forNear-Term Tax Free Fund for the previous periods presented in these financialstatements has been adjusted to reflect the stock split.
�115
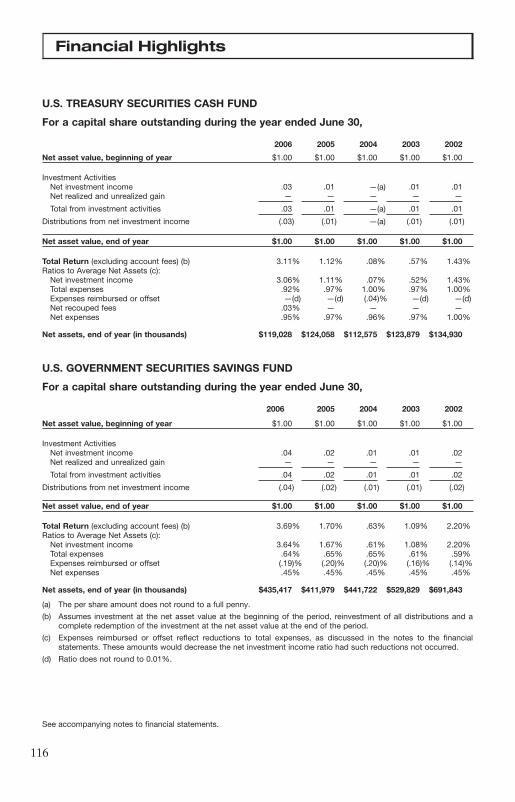
Financial Highlights
U.S. TREASURY SECURITIES CASH FUND
For a capital share outstanding during the year ended June 30,
2006 2005 2004 2003 2002
Net asset value, beginning of year $1.00 $1.00 $1.00 $1.00 $1.00
Investment ActivitiesNet investment income .03 .01 —(a) .01 .01Net realized and unrealized gain — — — — —
Total from investment activities .03 .01 —(a) .01 .01
Distributions from net investment income (.03) (.01) —(a) (.01) (.01)
Net asset value, end of year $1.00 $1.00 $1.00 $1.00 $1.00
Total Return (excluding account fees) (b) 3.11% 1.12% .08% .57% 1.43%Ratios to Average Net Assets (c):
Net investment income 3.06% 1.11% .07% .52% 1.43%Total expenses .92% .97% 1.00% .97% 1.00%Expenses reimbursed or offset —(d) —(d) (.04)% —(d) —(d)Net recouped fees .03% — — — —Net expenses .95% .97% .96% .97% 1.00%
Net assets, end of year (in thousands) $119,028 $124,058 $112,575 $123,879 $134,930
U.S. GOVERNMENT SECURITIES SAVINGS FUND
For a capital share outstanding during the year ended June 30,
2006 2005 2004 2003 2002
Net asset value, beginning of year $1.00 $1.00 $1.00 $1.00 $1.00
Investment ActivitiesNet investment income .04 .02 .01 .01 .02Net realized and unrealized gain — — — — —
Total from investment activities .04 .02 .01 .01 .02
Distributions from net investment income (.04) (.02) (.01) (.01) (.02)
Net asset value, end of year $1.00 $1.00 $1.00 $1.00 $1.00
Total Return (excluding account fees) (b) 3.69% 1.70% .63% 1.09% 2.20%Ratios to Average Net Assets (c):
Net investment income 3.64% 1.67% .61% 1.08% 2.20%Total expenses .64% .65% .65% .61% .59%Expenses reimbursed or offset (.19)% (.20)% (.20)% (.16)% (.14)%Net expenses .45% .45% .45% .45% .45%
Net assets, end of year (in thousands) $435,417 $411,979 $441,722 $529,829 $691,843
(a) The per share amount does not round to a full penny.
(b) Assumes investment at the net asset value at the beginning of the period, reinvestment of all distributions and acomplete redemption of the investment at the net asset value at the end of the period.
(c) Expenses reimbursed or offset reflect reductions to total expenses, as discussed in the notes to the financialstatements. These amounts would decrease the net investment income ratio had such reductions not occurred.
(d) Ratio does not round to 0.01%.
See accompanying notes to financial statements.
�116
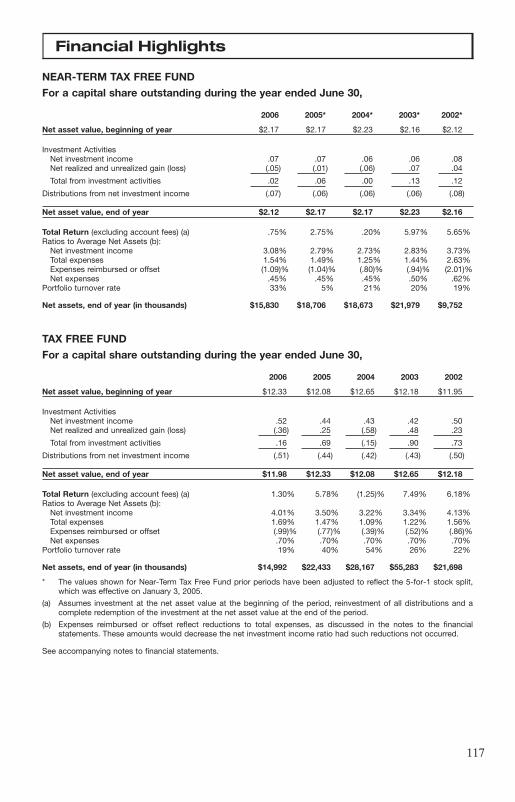
Financial Highlights
NEAR-TERM TAX FREE FUND
For a capital share outstanding during the year ended June 30,
2006 2005* 2004* 2003* 2002*
Net asset value, beginning of year $2.17 $2.17 $2.23 $2.16 $2.12
Investment ActivitiesNet investment income .07 .07 .06 .06 .08Net realized and unrealized gain (loss) (.05) (.01) (.06) .07 .04
Total from investment activities .02 .06 .00 .13 .12
Distributions from net investment income (.07) (.06) (.06) (.06) (.08)
Net asset value, end of year $2.12 $2.17 $2.17 $2.23 $2.16
Total Return (excluding account fees) (a) .75% 2.75% .20% 5.97% 5.65%Ratios to Average Net Assets (b):
Net investment income 3.08% 2.79% 2.73% 2.83% 3.73%Total expenses 1.54% 1.49% 1.25% 1.44% 2.63%Expenses reimbursed or offset (1.09)% (1.04)% (.80)% (.94)% (2.01)%Net expenses .45% .45% .45% .50% .62%
Portfolio turnover rate 33% 5% 21% 20% 19%
Net assets, end of year (in thousands) $15,830 $18,706 $18,673 $21,979 $9,752
TAX FREE FUND
For a capital share outstanding during the year ended June 30,
2006 2005 2004 2003 2002
Net asset value, beginning of year $12.33 $12.08 $12.65 $12.18 $11.95
Investment ActivitiesNet investment income .52 .44 .43 .42 .50Net realized and unrealized gain (loss) (.36) .25 (.58) .48 .23
Total from investment activities .16 .69 (.15) .90 .73
Distributions from net investment income (.51) (.44) (.42) (.43) (.50)
Net asset value, end of year $11.98 $12.33 $12.08 $12.65 $12.18
Total Return (excluding account fees) (a) 1.30% 5.78% (1.25)% 7.49% 6.18%Ratios to Average Net Assets (b):
Net investment income 4.01% 3.50% 3.22% 3.34% 4.13%Total expenses 1.69% 1.47% 1.09% 1.22% 1.56%Expenses reimbursed or offset (.99)% (.77)% (.39)% (.52)% (.86)%Net expenses .70% .70% .70% .70% .70%
Portfolio turnover rate 19% 40% 54% 26% 22%
Net assets, end of year (in thousands) $14,992 $22,433 $28,167 $55,283 $21,698
* The values shown for Near-Term Tax Free Fund prior periods have been adjusted to reflect the 5-for-1 stock split,which was effective on January 3, 2005.
(a) Assumes investment at the net asset value at the beginning of the period, reinvestment of all distributions and acomplete redemption of the investment at the net asset value at the end of the period.
(b) Expenses reimbursed or offset reflect reductions to total expenses, as discussed in the notes to the financialstatements. These amounts would decrease the net investment income ratio had such reductions not occurred.
See accompanying notes to financial statements.
�117
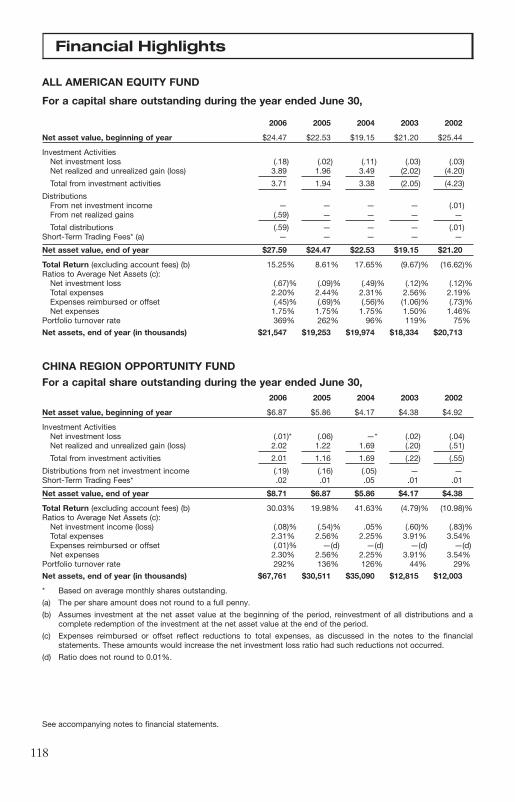
Financial Highlights
ALL AMERICAN EQUITY FUND
For a capital share outstanding during the year ended June 30,
2006 2005 2004 2003 2002
Net asset value, beginning of year $24.47 $22.53 $19.15 $21.20 $25.44
Investment ActivitiesNet investment loss (.18) (.02) (.11) (.03) (.03)Net realized and unrealized gain (loss) 3.89 1.96 3.49 (2.02) (4.20)
Total from investment activities 3.71 1.94 3.38 (2.05) (4.23)
DistributionsFrom net investment income — — — — (.01)From net realized gains (.59) — — — —
Total distributions (.59) — — — (.01)Short-Term Trading Fees* (a) — — — — —
Net asset value, end of year $27.59 $24.47 $22.53 $19.15 $21.20
Total Return (excluding account fees) (b) 15.25% 8.61% 17.65% (9.67)% (16.62)%Ratios to Average Net Assets (c):
Net investment loss (.67)% (.09)% (.49)% (.12)% (.12)%Total expenses 2.20% 2.44% 2.31% 2.56% 2.19%Expenses reimbursed or offset (.45)% (.69)% (.56)% (1.06)% (.73)%Net expenses 1.75% 1.75% 1.75% 1.50% 1.46%
Portfolio turnover rate 369% 262% 96% 119% 75%
Net assets, end of year (in thousands) $21,547 $19,253 $19,974 $18,334 $20,713
CHINA REGION OPPORTUNITY FUND
For a capital share outstanding during the year ended June 30,2006 2005 2004 2003 2002
Net asset value, beginning of year $6.87 $5.86 $4.17 $4.38 $4.92
Investment ActivitiesNet investment loss (.01)* (.06) —* (.02) (.04)Net realized and unrealized gain (loss) 2.02 1.22 1.69 (.20) (.51)
Total from investment activities 2.01 1.16 1.69 (.22) (.55)
Distributions from net investment income (.19) (.16) (.05) — —Short-Term Trading Fees* .02 .01 .05 .01 .01
Net asset value, end of year $8.71 $6.87 $5.86 $4.17 $4.38
Total Return (excluding account fees) (b) 30.03% 19.98% 41.63% (4.79)% (10.98)%Ratios to Average Net Assets (c):
Net investment income (loss) (.08)% (.54)% .05% (.60)% (.83)%Total expenses 2.31% 2.56% 2.25% 3.91% 3.54%Expenses reimbursed or offset (.01)% —(d) —(d) —(d) —(d)Net expenses 2.30% 2.56% 2.25% 3.91% 3.54%
Portfolio turnover rate 292% 136% 126% 44% 29%
Net assets, end of year (in thousands) $67,761 $30,511 $35,090 $12,815 $12,003
* Based on average monthly shares outstanding.
(a) The per share amount does not round to a full penny.
(b) Assumes investment at the net asset value at the beginning of the period, reinvestment of all distributions and acomplete redemption of the investment at the net asset value at the end of the period.
(c) Expenses reimbursed or offset reflect reductions to total expenses, as discussed in the notes to the financialstatements. These amounts would increase the net investment loss ratio had such reductions not occurred.
(d) Ratio does not round to 0.01%.
See accompanying notes to financial statements.
�118
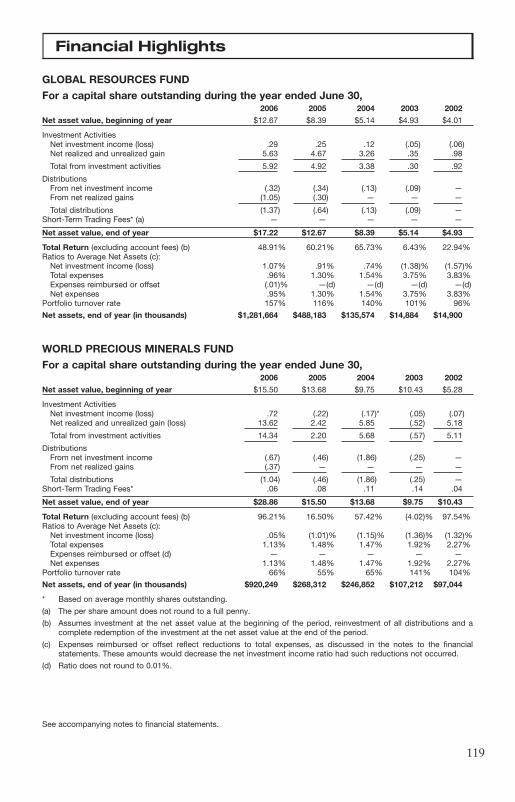
Financial Highlights
GLOBAL RESOURCES FUND
For a capital share outstanding during the year ended June 30,2006 2005 2004 2003 2002
Net asset value, beginning of year $12.67 $8.39 $5.14 $4.93 $4.01
Investment ActivitiesNet investment income (loss) .29 .25 .12 (.05) (.06)Net realized and unrealized gain 5.63 4.67 3.26 .35 .98
Total from investment activities 5.92 4.92 3.38 .30 .92
DistributionsFrom net investment income (.32) (.34) (.13) (.09) —From net realized gains (1.05) (.30) — — —
Total distributions (1.37) (.64) (.13) (.09) —Short-Term Trading Fees* (a) — — — — —
Net asset value, end of year $17.22 $12.67 $8.39 $5.14 $4.93
Total Return (excluding account fees) (b) 48.91% 60.21% 65.73% 6.43% 22.94%Ratios to Average Net Assets (c):
Net investment income (loss) 1.07% .91% .74% (1.38)% (1.57)%Total expenses .96% 1.30% 1.54% 3.75% 3.83%Expenses reimbursed or offset (.01)% —(d) —(d) —(d) —(d)Net expenses .95% 1.30% 1.54% 3.75% 3.83%
Portfolio turnover rate 157% 116% 140% 101% 96%
Net assets, end of year (in thousands) $1,281,664 $488,183 $135,574 $14,884 $14,900
WORLD PRECIOUS MINERALS FUND
For a capital share outstanding during the year ended June 30,2006 2005 2004 2003 2002
Net asset value, beginning of year $15.50 $13.68 $9.75 $10.43 $5.28
Investment ActivitiesNet investment income (loss) .72 (.22) (.17)* (.05) (.07)Net realized and unrealized gain (loss) 13.62 2.42 5.85 (.52) 5.18
Total from investment activities 14.34 2.20 5.68 (.57) 5.11
DistributionsFrom net investment income (.67) (.46) (1.86) (.25) —From net realized gains (.37) — — — —
Total distributions (1.04) (.46) (1.86) (.25) —Short-Term Trading Fees* .06 .08 .11 .14 .04
Net asset value, end of year $28.86 $15.50 $13.68 $9.75 $10.43
Total Return (excluding account fees) (b) 96.21% 16.50% 57.42% (4.02)% 97.54%Ratios to Average Net Assets (c):
Net investment income (loss) .05% (1.01)% (1.15)% (1.36)% (1.32)%Total expenses 1.13% 1.48% 1.47% 1.92% 2.27%Expenses reimbursed or offset (d) — — — — —Net expenses 1.13% 1.48% 1.47% 1.92% 2.27%
Portfolio turnover rate 66% 55% 65% 141% 104%
Net assets, end of year (in thousands) $920,249 $268,312 $246,852 $107,212 $97,044
* Based on average monthly shares outstanding.
(a) The per share amount does not round to a full penny.
(b) Assumes investment at the net asset value at the beginning of the period, reinvestment of all distributions and acomplete redemption of the investment at the net asset value at the end of the period.
(c) Expenses reimbursed or offset reflect reductions to total expenses, as discussed in the notes to the financialstatements. These amounts would decrease the net investment income ratio had such reductions not occurred.
(d) Ratio does not round to 0.01%.
See accompanying notes to financial statements.
�119

Financial Highlights
GOLD SHARES FUND
For a capital share outstanding during the year ended June 30,
2006 2005 2004 2003 2002
Net asset value, beginning of year $7.67 $7.00 $5.18 $5.28 $2.83
Investment ActivitiesNet investment loss (.01)* (.11) (.10) (.10) (.06)Net realized and unrealized gain 7.88 .79 1.91 (.02) 2.48
Total from investment activities 7.87 .68 1.81 (.12) 2.42
Distributions from net investment income (.12) (.05) (.03) — —Short-Term Trading Fees* .06 .04 .04 .02 .03
Net asset value, end of year $15.48 $7.67 $7.00 $5.18 $5.28
Total Return (excluding account fees) (a) 104.15% 10.19% 35.57% (1.89)% 86.57%Ratios to Average Net Assets (b):
Net investment loss (.06)% (1.13)% (1.45)% (1.98)% (1.99)%Total expenses 1.47% 1.97% 1.93% 2.64% 3.57%Expenses reimbursed or offset (c) — — — — —Net expenses 1.47% 1.97% 1.93% 2.64% 3.57%
Portfolio turnover rate 78% 66% 85% 138% 164%
Net assets, end of year (in thousands) $208,027 $63,816 $66,732 $45,720 $52,911
* Based on average monthly shares outstanding.
(a) Assumes investment at the net asset value at the beginning of the period, reinvestment of all distributions and acomplete redemption of the investment at the net asset value at the end of the period.
(b) Expenses reimbursed or offset reflect reductions to total expenses, as discussed in the notes to the financialstatements. These amounts would increase the net investment loss ratio had such reductions not occurred.
(c) Ratio does not round to 0.01%.
See accompanying notes to financial statements.
�120

Report of Independent Registered Public Accounting Firm
The Board of Trustees and Shareholdersof U.S. Global Investors Funds:
We have audited the accompanying statements of assets and liabilities, including theschedules of investments, of the U.S Treasury Securities Cash Fund, U.S. Govern-ment Securities Savings Fund, Near-Term Tax Free Fund, Tax Free Fund, AllAmerican Equity Fund, China Region Opportunity Fund, Global Resources Fund,World Precious Minerals Fund and Gold Shares Fund (collectively, the ‘‘Funds’’),each a portfolio of U.S. Global Investors Funds (Trust) as of June 30, 2006, and therelated statements of operations for the year then ended, and the statements ofchanges in net assets for each of the two years in the period then ended and financialhighlights for each of the years in the five-year period then ended. These financialstatements and financial highlights are the responsibility of the Trust’s management.Our responsibility is to express an opinion on these financial statements andfinancial highlights based on our audits.
We conducted our audits in accordance with the standards of the Public CompanyAccounting Oversight Board (United States). Those standards require that we planand perform the audit to obtain reasonable assurance about whether the financialstatements and financial highlights are free of material misstatement. An auditincludes examining, on a test basis, evidence supporting the amounts and disclo-sures in the financial statements. Our procedures included confirmation of securitiesowned as of June 30, 2006, by correspondence with the custodian and brokers or byother appropriate auditing procedures where replies from brokers were notreceived. An audit also includes assessing the accounting principles used andsignificant estimates made by management, as well as evaluating the overall finan-cial statement presentation. We believe that our audits provide a reasonable basisfor our opinion.
In our opinion, the financial statements and financial highlights referred to abovepresent fairly, in all material respects, the financial position of each of the respectivefunds constituting U.S. Global Investors Funds, as of June 30, 2006, and the resultsof their operations, the changes in their net assets and financial highlights for theperiods described above, in conformity with U.S. generally accepted accountingprinciples.
Boston, MassachusettsAugust 22, 2006
�121
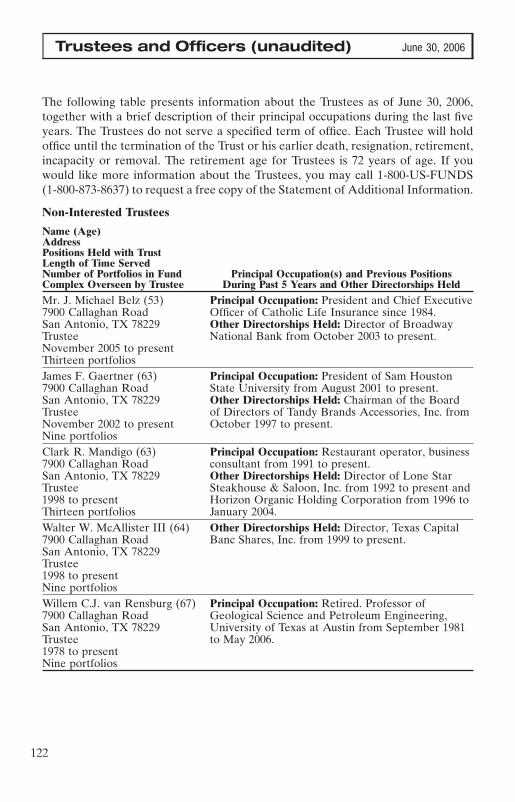
Trustees and Officers (unaudited) June 30, 2006
The following table presents information about the Trustees as of June 30, 2006,together with a brief description of their principal occupations during the last fiveyears. The Trustees do not serve a specified term of office. Each Trustee will holdoffice until the termination of the Trust or his earlier death, resignation, retirement,incapacity or removal. The retirement age for Trustees is 72 years of age. If youwould like more information about the Trustees, you may call 1-800-US-FUNDS(1-800-873-8637) to request a free copy of the Statement of Additional Information.
Non-Interested Trustees
Name (Age)AddressPositions Held with TrustLength of Time ServedNumber of Portfolios in Fund Principal Occupation(s) and Previous PositionsComplex Overseen by Trustee During Past 5 Years and Other Directorships Held
Mr. J. Michael Belz (53) Principal Occupation: President and Chief Executive7900 Callaghan Road Officer of Catholic Life Insurance since 1984.San Antonio, TX 78229 Other Directorships Held: Director of BroadwayTrustee National Bank from October 2003 to present.November 2005 to presentThirteen portfoliosJames F. Gaertner (63) Principal Occupation: President of Sam Houston7900 Callaghan Road State University from August 2001 to present.San Antonio, TX 78229 Other Directorships Held: Chairman of the BoardTrustee of Directors of Tandy Brands Accessories, Inc. fromNovember 2002 to present October 1997 to present.Nine portfoliosClark R. Mandigo (63) Principal Occupation: Restaurant operator, business7900 Callaghan Road consultant from 1991 to present.San Antonio, TX 78229 Other Directorships Held: Director of Lone StarTrustee Steakhouse & Saloon, Inc. from 1992 to present and1998 to present Horizon Organic Holding Corporation from 1996 toThirteen portfolios January 2004.Walter W. McAllister III (64) Other Directorships Held: Director, Texas Capital7900 Callaghan Road Banc Shares, Inc. from 1999 to present.San Antonio, TX 78229Trustee1998 to presentNine portfoliosWillem C.J. van Rensburg (67) Principal Occupation: Retired. Professor of7900 Callaghan Road Geological Science and Petroleum Engineering,San Antonio, TX 78229 University of Texas at Austin from September 1981Trustee to May 2006.1978 to presentNine portfolios
�122

Trustees and Officers (unaudited) June 30, 2006
Interested Trustee
Name (Age)AddressPositions Held with TrustLength of Time ServedNumber of Portfolios in Fund Principal Occupation(s) and Previous PositionsComplex Overseen by Trustee During Past 5 Years and Other Directorships Held
Frank Holmes * (51) Principal Occupation: Director, Chief Executive7900 Callaghan Road Officer, and Chief Investment Officer of theSan Antonio, TX 78229 Adviser. Since October 1989, Mr. Holmes hasTrustee, Chief Executive served and continues to serve in various positionsOfficer, Chief Investment with the Adviser, its subsidiaries, and the investmentOfficer, President companies it sponsors.1989 to present Other Directorships Held: Chairman of the BoardThirteen portfolios of Directors of Endeavour Mining Capital Corp.
from November 2005 to present. Director of 71316Ontario, Inc. from April 1987 to present and ofF. E. Holmes Organization, Inc. from July 1978 topresent. Director of Franc-Or Resources Corp. fromNovember 1994 to November 1996 and from June2000 to November 2003. Chairman of the Board ofDirectors of Consolidated Fortress Resources, Inc.from November 2000 to November 2003. Director ofBroadband Collaborative Solutions from May 2000to June 2002.
*Mr. Holmes is an ‘‘interested person’’ of the Trust by virtue of his positions with U.S. GlobalInvestors, Inc.
�123
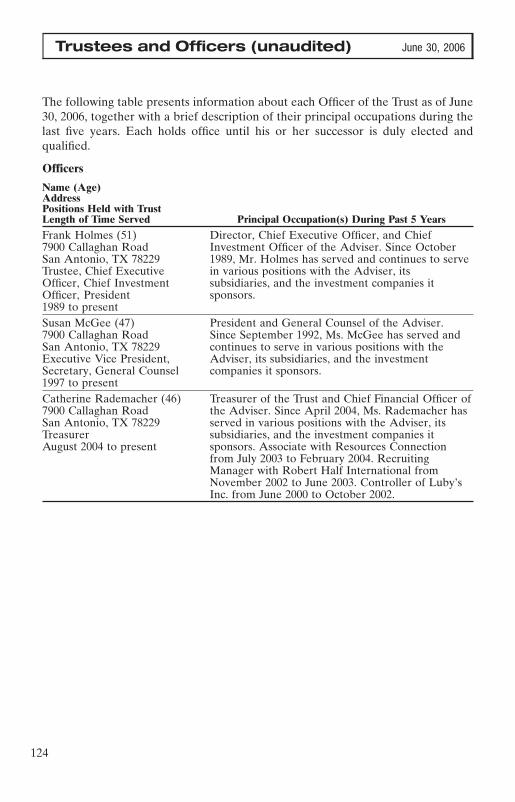
Trustees and Officers (unaudited) June 30, 2006
The following table presents information about each Officer of the Trust as of June30, 2006, together with a brief description of their principal occupations during thelast five years. Each holds office until his or her successor is duly elected andqualified.
Officers
Name (Age)AddressPositions Held with TrustLength of Time Served Principal Occupation(s) During Past 5 Years
Frank Holmes (51) Director, Chief Executive Officer, and Chief7900 Callaghan Road Investment Officer of the Adviser. Since OctoberSan Antonio, TX 78229 1989, Mr. Holmes has served and continues to serveTrustee, Chief Executive in various positions with the Adviser, itsOfficer, Chief Investment subsidiaries, and the investment companies itOfficer, President sponsors.1989 to presentSusan McGee (47) President and General Counsel of the Adviser.7900 Callaghan Road Since September 1992, Ms. McGee has served andSan Antonio, TX 78229 continues to serve in various positions with theExecutive Vice President, Adviser, its subsidiaries, and the investmentSecretary, General Counsel companies it sponsors.1997 to presentCatherine Rademacher (46) Treasurer of the Trust and Chief Financial Officer of7900 Callaghan Road the Adviser. Since April 2004, Ms. Rademacher hasSan Antonio, TX 78229 served in various positions with the Adviser, itsTreasurer subsidiaries, and the investment companies itAugust 2004 to present sponsors. Associate with Resources Connection
from July 2003 to February 2004. RecruitingManager with Robert Half International fromNovember 2002 to June 2003. Controller of Luby’sInc. from June 2000 to October 2002.
�124
Additional Information (unaudited)
Additional Federal Tax Information
The percentage of tax-exempt dividends paid by the Funds for the year ended June 30, 2006,was:
Near-Term Tax Free 89.58%Tax Free 94.56%
The percentage of ordinary income dividends paid by the Funds during the year ended June 30,2006, which qualify for the Dividends Received Deduction available to corporate shareholderswas:
Global Resources 1.59%World Precious Minerals 0.73%Gold Shares 13.57%
The Funds hereby designate the following approximate amounts as capital gain dividends for thepurpose of the dividends paid deduction:
All American Equity $ 455,916Global Resources 10,440,800World Precious Minerals 5,460,908
The amounts which represent foreign source income and foreign taxes paid during the yearended June 30, 2006 are as follows:
Foreign ForeignSource TaxIncome Credit
China Region Opportunity $ 785,056 $ 23,633Global Resources 12,602,619 1,707,076World Precious Minerals 1,008,304 110,836Gold Shares 195,231 19,469
In January 2007, the Funds will report on Form 1099-DIV the tax status of all distributions madeduring the calendar year 2006. The funds intend to distribute the maximum amount of qualifieddividend income allowable. The amount of qualified dividend income distributed by each fund willbe reported to shareholders on their Form 1099-DIV. Shareholders should use the information onForm 1099-DIV for their income tax returns.
�125

Additional Information (unaudited)
Proxy Voting
A description of the policies and procedures that the Funds use to determine how to vote proxiesrelating to portfolio securities is available without charge, upon request, by calling 1-800-US-FUNDS (1-800-873-8637). It also appears in the Funds’ statement of additional information (Form485B), which can be found on the SEC’s website at www.sec.gov.
Information regarding how the Funds voted proxies relating to portfolio securities during the mostrecent 12-month period ended June 30 is available without charge, upon request, by calling 1-800-US-FUNDS (1-800-873-8637) or accessing the Funds’ Form N-PX on the SEC’s website atwww.sec.gov.
Availability of Quarterly Portfolio Schedules
The Funds provide complete lists of holdings four times in each fiscal year, at the quarter-ends.For the second and fourth quarters, the lists appear in the Funds’ semi-annual and annual reportsto shareholders. For the first and third quarters, the Funds file the lists with the SEC on Form N-Q.Shareholders can look up the Funds’ Forms N-Q on the SEC’s website at www.sec.gov. You mayalso visit or call the SEC’s Public Room in Washington, D.C. (1-202-942-8090) or send a requestplus a duplicating fee to the SEC, Public Reference Section, Washington, DC 20549-0102 or byelectronic request at the following e-mail address: [email protected].
Approval of the Advisory Agreement for Each Fund
On February 13, 2006, the Board of Trustees, including all of the Trustees who are not ‘‘interestedpersons’’ of the Trust (the ‘‘Independent Trustees’’), approved continuation of the advisoryagreement with the Adviser for each Fund for an additional one-year term. In considering approvalof the agreement, the Trustees reviewed a variety of materials relating to each Fund and theAdviser, including: (i) comparative performance, fee and expense information versus a peer groupof similar mutual funds provided by Lipper Inc. (each, a ‘‘Peer Group’’), performance informationversus a broader array of comparative mutual funds provided by Lipper Inc. (each, a ‘‘PeerUniverse’’) and performance information versus a benchmark index (each, a ‘‘Fund Benchmark’’),(ii) information regarding the nature, extent and quality of the services provided by the Adviser, (iii)the costs of services provided and estimated profits realized by the Adviser and its affiliates, (iv)the extent to which economies of scale are realized as the Funds grow, (v) whether fee levelsreflect any possible economies of scale for the benefit of Fund shareholders, (vi) comparisons ofservices rendered and amounts paid to other registered investment companies managed by theAdviser and other accounts managed by the Adviser, and (vii) benefits realized by the Adviser (andits affiliates) from its relationship with the Funds.
The Independent Trustees began their process of reviewing information and considering approvalof the agreement in November 2005 and were represented by independent legal counselthroughout the process. After a November 11, 2005 meeting, at the direction of the Independent
�126
Additional Information (unaudited)
Trustees, independent legal counsel requested additional information from the Adviser to beprovided to the Independent Trustees in advance of their February 13, 2006 meeting. As a result,the Independent Trustees received information from the Adviser describing the foregoing informa-tion. In addition, the Independent Trustees received materials from their independent legal counseldiscussing the legal standards applicable to their consideration of the agreement. After theirreview of the information received, the Independent Trustees presented their findings andrecommendations to the full Board.
In considering the nature, extent and quality of the services provided by the Adviser, the Boardreviewed information relating to the Adviser’s operations and personnel. Among other things, theAdviser provided biographical information on its professional staff and descriptions of its organiza-tional and management structure. In the course of its deliberations the Board evaluated, amongother things, information relating to the investment philosophy, strategies and techniques used inmanaging each Fund, the qualifications and experience of the Adviser’s investment personnel, theAdviser’s brokerage practices, including the extent to which the Adviser obtains research through‘‘soft dollar’’ arrangements with the Funds’ brokerage, and the financial and non-financialresources available to provide services required under the advisory agreement.
In considering the reasonableness of the fee payable to the Adviser for managing each Fund, theBoard reviewed, among other things, financial statements of the Adviser and an analysis of theprofitability to the Adviser and its affiliates of their relationship with each Fund over various timeperiods, which analysis identified revenues and other benefits received by the Adviser and itsaffiliates from managing each Fund, the costs associated with providing such services and theresulting profitability to the Adviser and its affiliates from these relationships on a Fund-by-Fundbasis and as a group of Funds. The Board also compared each Fund’s management fee to the feescharged by the Adviser to other registered investment companies and to other clients managed bythe Adviser. (However, the Board noted that those other investment companies have differentinvestment policies than the Funds and that the Adviser does not manage other investmentcompanies similar to the Funds. The Board also noted that, although certain clients may haveinvestment objectives and policies that are similar to some of the Funds, the contractual feespayable to the Adviser for managing those client assets are the same or higher than themanagement fees of the similar Funds.) The Board considered the current and anticipated assetlevels of each Fund and the historical willingness of the Adviser to waive fees and pay expenses ofthe Funds from time to time to limit the total expenses of the Funds. The Board also consideredthat the management fee for all of the Funds except for the Near-Term Tax Free Fund and theChina Region Opportunity Fund include a breakpoint. The Board also noted that the Adviser did notbelieve, with respect to administration and investment advisory services provided, that it wasrealizing significant economies of scale and that the current fees represent an appropriate sharingof economies of scale. The Board concluded that the profitability to the Adviser and its affiliatesfrom their relationship with the Funds is not excessive and that the Adviser is not realizing materialbenefits from economies of scale that would warrant adjustments to the fees for any Fund at thistime. The Board concluded that, in light of the nature, extent and quality of the services providedby the Adviser and the levels of profitability associated with providing these services, the feescharged by the Adviser under the Advisory Agreement to each Fund are reasonable.
�127
Additional Information (unaudited)
In addition to the foregoing, the Board considered the specific factors and reached the relatedconclusions set forth below with respect to each Fund:
U.S. Government Securities Savings Fund
The Board noted that the U.S. Government Securities Saving Fund has been among the topperforming funds of its Peer Group and Peer Universe and has substantially outperformed its FundBenchmark for the one, two, three, four, five and ten year periods ending August 31, 2005.Accordingly, the Board concluded that the Fund’s performance has been satisfactory. In determin-ing that the fees charged by the Adviser are reasonable, the Board also noted that, over varioustime periods, the Adviser has waived fees and paid expenses of the Fund and that the Fund’smanagement fee and total expenses, net of contractual waivers and expense reimbursements, arebelow the median for its Peer Group.
U.S. Treasury Securities Cash Fund
The Board noted that the U.S. Treasury Securities Cash Fund has underperformed its Peer Group,Peer Universe and Fund Benchmark for the one, two, three, four, five and ten year periods endingAugust 31, 2005. The Independent Trustees also requested and reviewed the Fund’s grossperformance, which indicated that the Fund’s performance was competitive on a gross basis andthat the Fund’s net relative underperformance is primarily attributable to the Fund’s high relativeexpenses. As a result, the Board concluded that the Fund’s performance has been consistent withreasonable expectations in light of the nature, quality and extent of the services provided toshareholders. In this regard, the Board noted that the Fund is designed to be used by shareholdersas a substitute for a traditional checking account, that the Fund’s high relative expenses areexplained, in part, by the unlimited free checkwriting and related shareholder services offered bythe Fund, and that the Fund’s relative underperformance is attributable primarily to high expensesincurred by the Fund in making these services available to shareholders. In determining that thefees charged by the Adviser are reasonable, the Board noted that the Fund’s management fee iscompetitive with that of its Peer Group.
Tax Free Fund
The Board noted that the Tax Free Fund has underperformed its Peer Group, Peer Universe andFund Benchmark for the one, two, three, four, five and ten year periods ending August 31, 2005,although the recent performance of the Fund has improved slightly over the past year. The Boardalso noted the small size of the Fund and that the Fund’s performance was adversely affected bythe Fund’s conservative risk profile. In light of the above, the Board concluded that performancewas satisfactory. In determining that the fees charged by the Adviser are reasonable, the Boardnoted that while the Fund’s contractual management fee and total expenses are above the medianfor its Peer Group, over various time periods, the Adviser has waived fees and expenses of theFund and the Fund’s management fee, net of contractual waivers, is below the median for its PeerGroup.
�128
Additional Information (unaudited)
Near-Term Tax Free Fund
The Board noted that the Near-Term Tax Free Fund has performed at or above the median of itsPeer Group for the one, two and three-year periods ending August 31, 2005, although the Fundhas performed slightly below its Fund Benchmark for these same time periods. Accordingly, theBoard concluded that the Fund’s overall performance has been satisfactory. In determining thatthe fees charged by the Adviser are reasonable, the Board noted that the Fund is among thesmallest funds in its Peer Group, that over various time periods the Adviser has waived fees andpaid expenses of the Fund, and that the Fund’s management fee and total expenses, net ofcontractual waivers and expense reimbursements, are below the median for its Peer Group.
All American Equity Fund
The Board noted that the All American Equity Fund has performed well relative to its Peer Groupand Peer Universe for the one, two, three and four year periods ending August 31, 2005. The AllAmerican Equity Fund has also outperformed its Fund Benchmark for the one, two and three yearperiods ending August 31, 2005. Accordingly, the Board concluded that the overall performance ofthe Fund has been satisfactory. In determining that the fees charged by the Adviser arereasonable, the Board noted that, over various time periods, the Adviser has waived fees and paidexpenses of the Fund and that the Fund’s management fee, net of contractual waivers, is belowthe median of the Peer Group. The Board also noted that total expenses of the Fund are high due tothe high non-management related expenses relative to its Peer Group. The Board concluded thatthis is consistent with reasonable expectations in light of the small size of the Fund and the smallaverage account size of the Fund relative to its Peer Group.
China Region Opportunity Fund
The Board noted that the China Region Opportunity Fund has outperformed its Peer Group and PeerUniverse for the one, two, three and four-year periods ending August 31, 2005. Accordingly, theBoard concluded that the overall performance of the Fund has been satisfactory. In determiningthat the fees charged by the Adviser are reasonable, the Board noted that, although the Fund’smanagement fee and total expenses are high compared to its Peer Group, such fees and expensesare consistent with reasonable expectations in light of the size of the Fund and the nature, qualityand extent of the services provided by the Adviser. In this regard, the Board noted that the Adviserhas committed substantial resources to monitor frequent purchases and redemptions of shares ofthe Fund.
Global Resources Fund
The Board noted that the Global Resources Fund has been among the top performing funds in itsPeer Group and Peer Universe for the one, two, three, four and five-year periods ending August 31,2005 and has substantially outperformed its Fund Benchmark for all such periods. Accordingly,the Board concluded that the Fund’s performance has been satisfactory. In determining that thefees charged by the Adviser are reasonable, the Board noted that the Fund’s management fee isclose to the median for its Peer Group and that the Fund’s management fee and total expenses, netof contractual waivers and expense reimbursements, are below the median for its Peer Group. In
�129

Additional Information (unaudited)
this regard, the Board noted that the Adviser has committed substantial resources to monitorfrequent purchases and redemptions of shares of the Fund.
World Precious Minerals Fund
The Board noted that the World Precious Minerals Fund has been among the top performing fundsin its Peer Group and Peer Universe for the one, two, three and four-year periods ending August 31,2005 and has substantially outperformed its Fund Benchmark for all such periods. Accordingly,the Board concluded that the Fund’s performance has been satisfactory. In determining that thefees charged by the Adviser are reasonable, the Board noted that although the Fund’s manage-ment fee and total expenses are slightly above the median for its Peer Group, such fees areconsistent with reasonable expectations in light of the size of the Fund and the nature, quality andextent of the services provided by the Adviser. In this regard, the Board noted that the Adviser hascommitted substantial resources to monitor frequent purchases and redemptions of shares of theFund.
Gold Shares Fund
The Board noted that the Gold Shares Fund has outperformed its Peer Group, Peer Universe and itsFund Benchmark for the one, two, three, four and five-year periods ending August 31, 2005.Accordingly, the Board concluded that the Fund’s performance has been satisfactory. In determin-ing that the fees charged by the Adviser are reasonable, the Board noted that the Fund’smanagement fee is below the median for its Peer Group. In addition, the Board noted that theAdviser has committed substantial resources to monitor frequent purchases and redemptions ofshares of the Fund. The Board also noted that the Fund’s total expenses are among the highest ofits Peer Group, with a large portion of expenses devoted to non-management expenses. The Boardconcluded that such expenses are consistent with reasonable expectations in light of the smallsize of the Fund and the small average account size of the Fund relative to its Peer Group. In thisregard, the Board noted that the Adviser has committed substantial resources to monitor frequentpurchases and redemptions of shares of the Fund.
* * * * * *
Based on all of the above-mentioned factors and related conclusions, with no single factor orconclusion being determinative and with each Trustee not necessarily attributing the same weightto each factor, the Board of Trustees, including the Independent Trustees, concluded that approvalof the advisory agreement would be in the interests of each Fund. Accordingly, on February 13,2006, the Board of Trustees, including the Independent Trustees, voted to approve continuation ofthe advisory agreement with respect to each Fund.
�130
PRSR
T ST
DU
.S. P
OST
AG
EPA
ID
SAN
AN
TON
IO,T
XPE
RM
IT N
O. 6
73U
.S.
Glo
bal
Inve
sto
rs
P.O
. Box
781
234
San
Ant
onio
,Tex
as78
278-
1234


![SMALL BUSINESS LENDING FUND – SECURITIES PURCHASE …...Securities Purchase Agreement – [Insert Company Name] SMALL BUSINESS LENDING FUND – SECURITIES PURCHASE AGREEMENT Name](https://img.dokumen.tips/doc/110x75/5f6e58dd42867365df4c458f/small-business-lending-fund-a-securities-purchase-securities-purchase-agreement.jpg)