Embed Size (px)
Citation preview

U.S. Department of the InteriorU.S. Geological Survey
Open-File Report 2018–1081
U.S. Geological Survey Community for Data Integration 2017 Workshop Proceedings


U.S. Geological Survey Community for Data Integration 2017 Workshop Proceedings
By Leslie Hsu, Vivian B. Hutchison, Madison L. Langseth, and Benjamin Wheeler
Open-File Report 2018–1081
U.S. Department of the InteriorU.S. Geological Survey

U.S. Department of the InteriorRYAN K. ZINKE, Secretary
U.S. Geological SurveyJames F. Reilly II, Director
U.S. Geological Survey, Reston, Virginia: 2018
For more information on the USGS—the Federal source for science about the Earth, its natural and living resources, natural hazards, and the environment—visit https://www.usgs.gov or call 1–888–ASK–USGS.
For an overview of USGS information products, including maps, imagery, and publications, visit https://store.usgs.gov.
Any use of trade, firm, or product names is for descriptive purposes only and does not imply endorsement by the U.S. Government.
Although this information product, for the most part, is in the public domain, it also may contain copyrighted materials as noted in the text. Permission to reproduce copyrighted items must be secured from the copyright owner.
Suggested citation:Hsu, L., Hutchison, V.B., Langseth, M.L., and Wheeler, B., 2018, U.S. Geological Survey Community for Data Integration 2017 Workshop Proceedings: U.S. Geological Survey Open-File Report 2018–1081, 56 p., https://doi.org/10.3133/ofr20181081.
ISSN 2331-1258 (online)

iii
ContentsExecutive Summary .......................................................................................................................................1Introduction.....................................................................................................................................................1Agenda.............................................................................................................................................................3Roadmap Discussions on Enabling Integrated Science .........................................................................6
Data and Data Integration ...................................................................................................................7Where Are We Now? ..................................................................................................................7Where Do We Want to Be? ........................................................................................................7Recommendations .......................................................................................................................7
Modeling.................................................................................................................................................8Where Are We Now? ..................................................................................................................8Where Do We Want to Be? ........................................................................................................8Recommendations .......................................................................................................................8
Computing Capacity .............................................................................................................................9Where Are We Now? ..................................................................................................................9Where Do We Want to Be? ........................................................................................................9Recommendations .....................................................................................................................10
Enterprise Needs ..............................................................................................................10Training, Outreach, and Education .................................................................................10Computing Resources ......................................................................................................10
Science Data Infrastructure .............................................................................................................11Where Are We Now? ................................................................................................................11Where Do We Want to Be? ......................................................................................................11Recommendations .....................................................................................................................11
User Needs and Experience .............................................................................................................12Where Are We Now? ................................................................................................................12Where Do We Want to Be? ......................................................................................................12Recommendations .....................................................................................................................12
Recommended Pilot Projects ...........................................................................................................12Summary of Roadmap Discussions on Enabling Integrated Science ........................................13
Presentations and Panels...........................................................................................................................14Welcome and Opening Remarks ......................................................................................................14Why Enable Integrated Science? ....................................................................................................14Beyond the Fourth Paradigm—Integrative Science Is Also about People ..............................14The Joy of Data Lightning Panel ......................................................................................................14Data Sharing—Agreements and Processes ..................................................................................14Data Science Community of Practice .............................................................................................15Improving the Interface and User Experience for the Data Management Training
Clearinghouse ........................................................................................................................15Advanced Scientific Computing Solutions .....................................................................................15Strategies for Building an Integrated Science Capacity .............................................................15Panel on the Community for Data Integration’s Role in Enabling Integrated Science ............16API Plugfest Report Out .....................................................................................................................17Elevation and Hydrography Data Integration .................................................................................17Keynote Talk .........................................................................................................................................17

iv
Panel on Community for Data Integration in Action .....................................................................18A Road Map for Enabling Integrated Science—The U.S. Geological Survey Has
Experience with This! ...........................................................................................................18Topical Sessions ..........................................................................................................................................19
Information Technology Architecture to Support Integrated Science .....................................19National Map Corps Mapathon ........................................................................................................20Legacy Data—Challenges and Solutions .......................................................................................20Data Citation—What’s All the Fuss? ................................................................................................20Data-Management Plans and Strategies for Science Centers ..................................................21Software Showcase ...........................................................................................................................21Enterprise Tools for Documentation of Protocols, Methods, and Study Designs ....................22Getting Your Hands Dirty with 3D Elevation Program Data..........................................................23U.S. Geological Survey “Science on a Screen” for Parks, Schools, and Museums ...............24Delivery of Real-Time Information....................................................................................................24Trusted Digital Repositories—What Are They and How Do You Become One? ......................26Fine-Tuning Guidelines for Revising Public U.S. Geological Survey Data.................................26National Geospatial Data Development ..........................................................................................27Learn More about Cloud Hosting Solutions (CHS) ........................................................................27
Working Group Meetings ...........................................................................................................................28Data Management Working Group ..................................................................................................28Earth Science Themes Working Group ...........................................................................................30Semantic Web Working Group .........................................................................................................30Tech Stack Working Group ...............................................................................................................31
Selected Birds of a Feather Discussion ...................................................................................................32Data Science Community of Practice .............................................................................................32
Open Lab........................................................................................................................................................32Metadata Reviewers Community of Practice ................................................................................32
Trainings ........................................................................................................................................................33R Workshop for Beginners ................................................................................................................33Introduction to Advanced Scientific Computing ...........................................................................33
DataBlast .......................................................................................................................................................34U.S. Geological Survey Coastal and Marine Geology Data Catalog—A Demonstration of the
Prototype for the U.S. Geological Survey Community for Data Integration ................34Being Charlotte—Weaving Together Information Assets at the Great Lakes
Science Center ......................................................................................................................35Automating the Use of Citizen Scientists’ Biodiversity Surveys in iNaturalist to Facilitate
Early Detection of Species’ Responses to Climate Change ...........................................35Alaska Data Integration Working Group Metadata Toolkit—International Organization for
Standards Metadata Editor .................................................................................................36Team Metadata Creation for Longitudinal Data—Case Study with the Great Lake Science
Center Research Vessel Catch Database .........................................................................36Flocks of a Feather Dock Together—Using Docker and HTCondor to Link High-Throughput
Computing Across the U.S. Geological Survey ................................................................36U.S. Geological Survey Data at Risk—Expanding Legacy Data Inventory and Preservation
Strategies................................................................................................................................37Trusted Digital Repositories—What Are They and How Do You Become One? ......................37Data-First Architecture ......................................................................................................................37

v
Crustal Geophysics and Geochemistry Science Center and Central Mineral and Environmental Resources Science Center Field Collection with ArcGIS Online Tools—Collector and Survey123 .........................................................................................37
Software Release Guidelines ...........................................................................................................38Presenting Complex Analytical Datasets to the Public with Accessible Cloud-Based
Visualizations .........................................................................................................................38Improving the Data Management Training Clearinghouse ..........................................................38ScienceBase as a Platform for Data Release ................................................................................39An Information Ecosystem to Meet the Data-Management Requirements of the Long-Term
Agrocecosystem Research Network .................................................................................39U.S. Geological Survey StreamStats—Hydrologic and Geospatial Data Integrated to
Support Water Science and Management .......................................................................39The Coastal and Marine Ecological Classification Standard, a Common Language That
Facilitates Integrating Data About Marine Ecosystems .................................................40Fundamental Science Practice Advisory Committee Scientific Data Guidance
Subcommittee ........................................................................................................................40The Benefits of Microservice Architectures .................................................................................40A Technique for Converting Time-Series Network Common Data Form (NetCDF) Files to a
Different Convention and Two Options for Discovery and Display ...............................41Web Map Application for a Historical Geologic Field Photo Collection ....................................41An Enterprise-Level Problem—Big Data, Small Science Staff ...................................................41Visualizing Community Exposure and Evacuation Potential to Tsunami Hazards Using an
Interactive Tableau Dashboard ...........................................................................................42Developing Application Programming Interfaces to Support Enterprise-Level
Monitoring Using Existing Tools ..........................................................................................42An Interactive Web-Based Application for Earthquake-Triggered Ground-Failure
Inventories ..............................................................................................................................42Secondary Validation of Geospatial Metadata ..............................................................................43How Can Cloud Hosting Solutions Help You? .................................................................................43A Framework for Managing, Sharing, and Visualizing Land-Use Scenario Data ....................43Dynamic Workflows to Advance Data Interoperability ................................................................43U.S. Geological Survey Near Real-Time Significant Earthquake and Earthquake Scenario
Geographic Information System Feeds .............................................................................44Second Generation Metadata Wizard ............................................................................................44Bridging the Gap Between Water and Elevation—A U.S. Geological Survey Pilot Project ..44A Semantic Architecture for Multidisciplinary Modeling ............................................................45Extending ScienceCache to Accommodate Broader Use within the U.S. Geological
Survey—Project Overview ..................................................................................................45Evaluation and Testing of Standardized Forest Vegetation Metrics Derived from Light
Detection and Ranging (Lidar) Data—Informing Geospatial Data Products for 3D Elevation Program, LANDFIRE, and the National Park Service Vegetation Inventory Programs.................................................................................................................................45
Core Science Analytics, Synthesis, and Library—Facilitating Lifecycle Management of U.S. Geological Survey Data and Information Assets .............................................................46
Summary of Workshop Outcomes ............................................................................................................46Acknowledgments .......................................................................................................................................47References ....................................................................................................................................................47Appendix 1. Interactive Session Questions and Comments .............................................................48

vi
Themes from the Submissions .........................................................................................................48List of Pilot Projects from sli.do ........................................................................................................48Recommendation Polls from Roadmap Discussions on Enabling Integrated Science ..........48
Appendix 2. Attendees.............................................................................................................................51Appendix 3. Community for Data Integration Science Support Framework ..................................56
Figures
1. Visualization of the five themes, as road signs, discussed in the breakout sessions of the Roadmap Discussions on Enabling Integrated Science .................................................6
2. The U.S. Geological Survey Integrated Decision Support System (pyramid) diagram presented and discussed by Kevin Gallagher during his plenary session .......................25
3. The Community for Data Integration Science Support Framework ...................................56
Tables
1. Ideas for pilot projects that came out of the plenary session on the last day of the conference ...................................................................................................................................49
2. Recommendations under the Data and Data Integration category ...................................49 3. Recommendations under the Modeling category .................................................................50 4. Recommendations under the Computing Capacity—Training, Outreach,
and Education category .............................................................................................................50 5. Recommendations under the Science Data Infrastructure category ...............................50 6. List of conference attendees ....................................................................................................51
Conversion FactorsInternational System of Units to U.S. customary units
Multiply By To obtain
Length
kilometer (km) 0.6214 mile (mi)kilometer (km) 0.5400 mile, nautical (nmi)
Abbreviations3DEP 3D Elevation Program
ACC Advanced Computing Cooperative
API application programming interface
app application
BAO Bureau Approving Official
C Computing Capacity

vii
CDI Community for Data Integration
CF climate and forecast
CHS Cloud Hosting Solutions
CMECS Coastal and Marine Ecological Classification Standard
CMGP Coastal Marine Geology Program
COSSA Council of Senior Science Advisors
CSDMS Community Surface Dynamics Modeling System
CSW Catalog Services for the Web
D Data and Data Integration
DevOps software development and information technology operations
DMP data-management plan
DMZ demilitarized zone (computing)
DMWG Data Management Working Group
DOI Digital Object Identifier
DYFI Did You Feel It?
EarthMAP Earth Monitoring, Analyses, and Projections
EPIC Equatorial Pacific Information Collection
ERDDAP Environmental Research Division’s Data Access Program
EROS Earth Resources Observation and Science
ESIP Earth Science Information Partners
FGDC Federal Geographic Data Committee
FORCE11 Future of Research Communications and e-Scholarship
FSPAC Fundamental Science Practices Advisory Committee
GEO Group on Earth Observations
GIS geographic information system
GLSC Great Lakes Science Center
GRACEnet Greenhouse gas Reduction through Agricultural Carbon Enhancement Network
HTC high-throughput computing
HPC high-performance computing
ICEMM Interagency Collaborative for Environmental Modeling and Monitoring
IPDS Information Products Delivery System
ISO International Organization for Standards
LUCAS Land-Use and Carbon Scenario Simulator
M Modeling
MOOC massive open online course

viii
MPI Message Passing Interface
NABat North American Bat Monitoring Program
NetCDF Network Common Data Form
NGP National Geospatial Program
NHD National Hydrography Dataset
NHDPlus National Hydrography Dataset Plus
NOAA National Oceanographic and Atmospheric Administration
NPS National Park Service
OEI Office of Enterprise Information
OPeNDAP Open-source Project for a Network Data Access Protocol
ORCID Open Researcher and Contributor ID
P Recommended Pilot Projects
REST representational state transfer
RGE Research Grade Evaluation
RVCAT Research Vessel Catch
S Science Data Infrastructure
SCSDWG Science Center Strategy Development Working Group
SDC Science Data Catalog
STEWARDS Sustaining the Earth’s Watersheds, Agricultural Research Data System
THREDDS Thematic Real-Time Environmental Distributed Data Services
U User Needs and Experience
UMESC Upper Midwest Environmental Sciences Center
USGS U.S. Geological Survey
W3C PROV World Wide Web Consortium provenance standards
WMS web mapping services
WRET Web Re-Engineering Team
XML Extensible Markup Language
U.S. Geological Survey Community for Data Integration 2017 Workshop Proceedings
By Leslie Hsu, Vivian B. Hutchison, Madison L. Langseth, Benjamin Wheeler
Executive SummaryThe U.S. Geological Survey (USGS) Community for Data Integration (CDI) Workshop was held May 16–19, 2017 at the
Denver Federal Center. There were 183 in-person attendees and 35 virtual attendees over four days. The theme of the workshop was “Enabling Integrated Science,” with the purpose of bringing together the community to discuss current topics, shared challenges, and steps forward to advance integrated science at the USGS.
The CDI welcomed several keynote speakers, including Bill Werkheiser, USGS Acting Director; Kevin T. Gallagher, USGS Associate Director of the Core Science Systems Mission Area; Bruce Caron, Earth Science Information Partners Community Architect; and Tim Quinn, Chief of the USGS Office of Enterprise Information. Their presentations focused on the importance of collaborative, cross-disciplinary, and open science and the role of the CDI in identifying and supporting new opportunities in these areas for the USGS and its partners.
In addition to the stated theme, the workshop agenda was driven by the needs of the CDI, with topics highlighting cur-rent resources and technologies that could help attendees in their daily work. Topical sessions were proposed by CDI members and included subjects such as data citation, information technology architecture, legacy data, real-time data, and many more. Plenary speakers from the community talked about USGS activities in data science, elevation and hydrography data integration, advanced scientific computing solutions, cloud computing, data-management training, and data-sharing agreements. Two panels addressed the role of the CDI in enabling integrated science and examples of CDI-supported projects in action.
Breakout discussions focused on the workshop theme of “Enabling Integrated Science” and covered five topics: Data and Data Integration, Modeling, Computing Capacity, Science Data Integration, and User Needs and Experience. Sessions on each topic identified actions that could bring the USGS and the broader Earth science community closer to the goal of making integrated science commonplace. The breakouts produced recommendations with the broad themes of improving communication and connections across the USGS, reducing duplication and increasing knowledge transfer, increasing training and testbed opportunities to learn and experiment, and creating community-supported standards to enable better integration and interoperability.
The DataBlast poster and live demonstration session showcased 36 projects from around the CDI and included recent CDI-funded projects as well as other USGS and partner initiatives that were related to data and software integration and discovery.
Importantly, the CDI workshop provided a forum for scientists, technologists, data and resource managers, program managers,and others to convene face to face to discuss common methods, interests, challenges, and solutions related to scientific data and technologies. As a result of this rare convergence, new connections were made across disciplines, backgrounds, and geographical locations, seeding future activities and collaborations. Sharing of ideas from all attendees was encouraged through the use of a mobile application to collect real-time questions and feedback from the audience.
The primary outcomes of the workshop are the recommendations from the breakout sessions titled “Roadmap Discussions on Enabling Integrated Science” and from the topical sessions detailed in these proceedings. These sessions, as well as the plenary discussions, identified new areas of collaboration and learning that the CDI will facilitate, such as data science, software development, scientific modeling practices, and user needs and experience. The CDI will build on the results of the workshop to guide its future topics, events, and funding opportunities to support an integrated science capacity for the USGS.
IntroductionThe U.S. Geological Survey (USGS) Community for Data Integration (CDI) is a dynamic community of practice with the
goal of advancing data and information integration and accelerating Earth science research. As a community of practice, the CDI’s purpose is to build a community of people to learn together and increase knowledge and skills that they care about. This

2 U.S. Geological Survey Community for Data Integration 2017 Workshop Proceedings
knowledge and skills building results in community members doing their jobs better and sharing their successes across the USGS. Through partnerships, working groups, funded projects, meetings, and trainings, the CDI enables the development of collaborative tools and best practices in support of data integration and management, cyberinfrastructure, and data visualization.
Guiding principles for CDI projects and activities are to• focus on targeted efforts that yield near-term benefits to science, while laying groundwork for future efforts;• leverage existing capabilities and data;• implement and demonstrate innovative solutions that could be used or replicated by others at scales from project
to enterprise;• preserve, expose, and improve access to Earth science data, models, and other outputs; and• develop, organize, and share knowledge and best practices in data integration.The goals of CDI in-person workshops, which are held approximately every two years, are to identify new, high-value
opportunities for advancing data integration in the Earth sciences, share successes in data integration, applications, and tools, and provide training based on community needs. In 2017, the CDI Workshop was held May 16–19 at the Denver Federal Center. There were 183 in-person attendees and 35 virtual attendees over the four days of the workshop (appendix 2). The theme of the 2017 workshop was “Enabling Integrated Science.”
The workshop year marked the end of the USGS science strategy for 2007–2017 (U.S. Geological Survey, 2007). Although a new strategic plan has not been released, the recent report of the USGS Council of Senior Science Advisors (COSSA), entitled “Grand Challenges for Integrated U.S. Geological Survey Science—A Workshop Report” (Jenni and others, 2017), provides a preview. Both the old strategic plan and new COSSA report stress the importance of interdisciplinary approaches to address the complex scientific issues facing the nation. It is in this context that the CDI was asked to focus its 2017 workshop on “Enabling Integrated Science”—meaning, more specifically, to lay the groundwork for an integrated decision-support system that can be applied to the variety of complex problems within the purview of the USGS.
To address this theme, the CDI coordinators included in the workshop agenda a recurring breakout session entitled “Roadmap Discussions on Enabling Integrated Science”— the goal being to encourage as much participation as possible among the workshop attendees (a shifting cast of characters from one day to the next, providing a wide range of perspectives). In addition, the plenary presentations by Tim Quinn, Marty Goldhaber, Bruce Caron, Kevin Gallagher, Bill Werkheiser, and Viv Hutchison all touched on the theme of integrated science as it relates to the USGS science strategy.
These proceedings provide documentation of the plenary talks, panels, breakout discussions, posters, and live demonstrations from the 2017 CDI workshop. The DataBlast posters are linked to elements of the CDI Science Support Framework, which is described in appendix 3. This document is a record of the topics and activities that are important to the CDI at this time, and our intention is that it will help guide the future activities of the CDI, as well as continue to seed fruitful connections in our diverse community.
Attendees at the 2017 Community for Data Integration Workshop listen to then Acting Director Bill Werkheiser’s keynote talk. Photograph by Viv Hutchison.

Agenda 3
Agenda
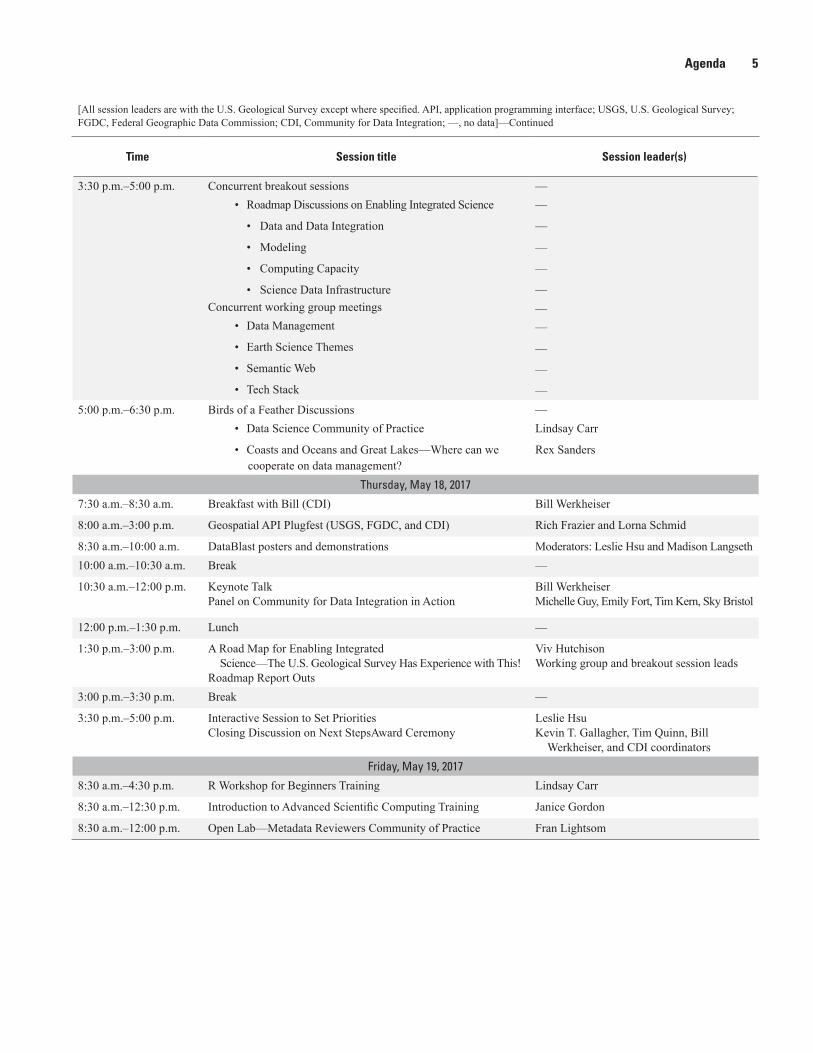
[All session leaders are with the U.S. Geological Survey except where specified. API, application programming interface; USGS, U.S. Geological Survey; FGDC, Federal Geographic Data Commission; CDI, Community for Data Integration; —, no data]—Continued
Time Session title Session leader(s)
Monday, May 15, 2017
1:00 p.m.–4:30 p.m. Geospatial API Plugfest (USGS, FGDC, and CDI) Rich Frazier and Lorna Schmid
Tuesday, May 16, 2017
8:00 a.m.–4:30 p.m. Geospatial API Plugfest (USGS, FGDC, and CDI) Rich Frazier and Lorna Schmid
8:00 a.m.–8:30 a.m. Registration —
8:30 a.m.–10:00 a.m. Welcome and Opening RemarksWhy Enable Integrated Science?Beyond the Fourth Paradigm—Integrative Science Is
also about People
Max Ethridge and Tim QuinnMarty GoldhaberBruce Caron
(Earth Science Information Partners)10:00 a.m.–10:30 a.m. Break —
10:30 a.m.–12:00 p.m. Presentations and Panels• The Joy of Data Lightning Panel
• Data Sharing—Agreements and Processes
• Data Science Community of Practice
• Improving the Interface and User Experience for the DataManagement Training Clearinghouse
• Advanced Scientific Computing Solutions
—
Fran Lightsom
JC Nelson
Lindsay Carr
Sophie Hou (National Center for Atmospheric Research)
Jeff Falgout12:00 p.m.–1:30 p.m. Lunch —
1:30 p.m.–3:00 p.m. Strategies for Building an Integrated Science CapacityPanel on the Community for Data Integration’s
Role in Enabling Integrated Science
Kevin T. GallagherViv Hutchison, Rich Signell, Fran Lightsom,
JC Nelson, and Roland Viger3:00 p.m.–3:30 p.m. Break —
3:30 p.m.–5:00 p.m. Concurrent breakout sessions• Roadmap Discussions on Enabling Integrated Science
• Data and Data Integration
• Modeling
• Computing Capacity
• Science Data Infrastructure
• User Needs and Experience
• Information Technology Architecture to SupportIntegrated Science
• National Map Corps Mapathon
• Legacy Data—Challenges and Solutions
• Data Citation—What’s All the Fuss?
—
—
—
—
—
—
—
Cassandra Ladino, Tim Quinn, and Paul Exter
Elizabeth McCartney
A. Lance Everette
Lisa Zolly
5:00 p.m.–6:30 p.m. Birds of a Feather Discussions• Metadata Reviewers Community of Practice
—Fran Lightsom

4 U.S. Geological Survey Community for Data Integration 2017 Workshop Proceedings
[All session leaders are with the U.S. Geological Survey except where specified. API, application programming interface; USGS, U.S. Geological Survey; FGDC, Federal Geographic Data Commission; CDI, Community for Data Integration; —, no data]—Continued
Time Session title Session leader(s)
Wednesday, May 17, 2017
8:00 a.m.–4:30 p.m. Geospatial API Plugfest (USGS, FGDC, and CDI) Rich Frazier and Lorna Schmid
8:30 a.m.–10:00 a.m. Presentations and Panels• API Plugfest Report Out
• Elevation and Hydrography Data Integration
—Ivan DeLoatch
Steve Aichele, Jason Stoker, and Al Rea
10:00 a.m.–10:30 a.m. Break —
10:30 a.m.–12:00 p.m. Concurrent breakout sessions• Roadmap Discussions on Enabling Integrated Science
• Data and Data Integration
• Modeling
• Computing Capacity
• Science Data Infrastructure
• Data-Management Plans and Strategies for Science Centers
• Software Showcase
• Enterprise Tools for Documentation of Protocols, Methods, and Study Designs
• Getting Your Hands Dirty with 3D Elevation Program Data
• USGS “Science on a Screen” for Parks, Schools, and Museums
——
—
—
—
—
Cassandra Ladino
Michelle Guy and Lynda Lastowka
Rebecca Scully
Jason Stoker
Rex Sanders
12:00 p.m.–1:30 p.m. Lunch —
1:30 p.m.–3:00 p.m. Concurrent breakout sessions• Roadmap Discussions on Enabling Integrated Science
• Data and Data Integration
• Modeling
• Computing Capacity
• Science Data Infrastructure
• Delivery of Real-Time Information
• Trusted Digital Repositories
• Fine-Tuning Guidelines for Revising Public USGS Data
• National Geospatial Data Development
• Learn more about Cloud Hosting Solutions (CHS)
——
—
—
—
—
Jake Weltzin
John Faundeen
Fran Lightsom
John Brakebill
Harold House3:00 p.m.–3:30 p.m. Break —
Agenda 5
[All session leaders are with the U.S. Geological Survey except where specified. API, application programming interface; USGS, U.S. Geological Survey; FGDC, Federal Geographic Data Commission; CDI, Community for Data Integration; —, no data]—Continued
Time Session title Session leader(s)
3:30 p.m.–5:00 p.m. Concurrent breakout sessions• Roadmap Discussions on Enabling Integrated Science
• Data and Data Integration
• Modeling
• Computing Capacity
• Science Data InfrastructureConcurrent working group meetings
• Data Management
• Earth Science Themes
• Semantic Web
• Tech Stack
——
—
—
—
———
—
—
—5:00 p.m.–6:30 p.m. Birds of a Feather Discussions
• Data Science Community of Practice
• Coasts and Oceans and Great Lakes—Where can we cooperate on data management?
—Lindsay Carr
Rex Sanders
Thursday, May 18, 2017
7:30 a.m.–8:30 a.m. Breakfast with Bill (CDI) Bill Werkheiser
8:00 a.m.–3:00 p.m. Geospatial API Plugfest (USGS, FGDC, and CDI) Rich Frazier and Lorna Schmid
8:30 a.m.–10:00 a.m. DataBlast posters and demonstrations Moderators: Leslie Hsu and Madison Langseth10:00 a.m.–10:30 a.m. Break —
10:30 a.m.–12:00 p.m. Keynote TalkPanel on Community for Data Integration in Action
Bill WerkheiserMichelle Guy, Emily Fort, Tim Kern, Sky Bristol
12:00 p.m.–1:30 p.m. Lunch —
1:30 p.m.–3:00 p.m. A Road Map for Enabling Integrated Science—The U.S. Geological Survey Has Experience with This!
Roadmap Report Outs
Viv HutchisonWorking group and breakout session leads
3:00 p.m.–3:30 p.m. Break —
3:30 p.m.–5:00 p.m. Interactive Session to Set PrioritiesClosing Discussion on Next StepsAward Ceremony
Leslie HsuKevin T. Gallagher, Tim Quinn, Bill
Werkheiser, and CDI coordinatorsFriday, May 19, 2017
8:30 a.m.–4:30 p.m. R Workshop for Beginners Training Lindsay Carr
8:30 a.m.–12:30 p.m. Introduction to Advanced Scientific Computing Training Janice Gordon
8:30 a.m.–12:00 p.m. Open Lab—Metadata Reviewers Community of Practice Fran Lightsom

6 U.S. Geological Survey Community for Data Integration 2017 Workshop Proceedings
Roadmap Discussions on Enabling Integrated Science
“This community has the expertise to build high-profile, modular components of an integrated decision support system. I’d like to ask your help in creating a roadmap to achieve the integrated science of the USGS vision.” —Kevin T. Gallagher, USGS, from his plenary presentation to the 2017 CDI workshop
A main goal of the workshop was to begin building a roadmap with actionable steps that the USGS could use to improve our ability to do integrated science. We define “integrated science” to include research efforts that draw on the knowledge, methods, and data of multiple fields in order to address important societal problems. Currently in the USGS, individual projects and activities have been employing integrated science, however, Bureau-wide capabilities and gaps in the integrated science process have not been considered in tandem. Therefore, workshop breakouts and plenaries, with participants from across the USGS, were devoted to this topic. Activities included discussion and brainstorming, followed by group voting on steps that the USGS could take to enable integrated science.
Integrated science is a core concept that drives USGS science, even as the vision and priorities of the USGS evolve. To augment the metaphor of building a roadmap, we find it useful to use the image of multiple teams charting a course to the destination of integrated science, using the available information to navigate a path. This image gives different teams options to break new trails or to develop recommendations for other teams depending on each team’s composition and expertise. As a result, there are many paths to integrated science, and each team can chart a course using the best available knowledge while addressing changing conditions.
At the workshop, breakout sessions were held for each of the following four themes: Data and Data Integration, Modeling, Computing Capacity, and Science Data Infrastructure (fig. 1). In addition, a group on User Needs and Experience was formed as a result of workshop discussion and interest. Each group considered the following questions: where are we now, where do we want to be, how do we get there, and what steps can we take to get to our destination. The groups generated a list of recommended steps, which were voted on by the plenary group on the last day of the workshop. Approximately 100 people with very diverse skillsets attended the four roadmap breakout sessions, and about 70 people participated in the interactive plenary discussion to set priorities (appendix 1).
With regard to the five integrated science themes listed above, this brief report summarizes where we are now, where we want to be, actions recommended, and pilot projects suggested at the workshop. From each theme’s discussion notes, we summarize the current status in the USGS and the desired future outcomes in statements reflecting what we would want to be able to say about each theme in the future. Actions were recommended with respect to the general integrated science concept; this is considered an initial step taken before other groups with the appropriate expertise begin to produce roadmaps for specific integrated science problems, or “grand challenges,” 1 such as those laid out in the “Grand Challenges for Integrated U.S. Geological Survey Science—A Workshop Report” report (Jenni and others, 2017). Each theme and the outcomes of their respective breakout sessions are described below.
1A USGS grand challenge for integrated science is a fundamental problem with broad societal consequences and solutions in Earth system science (Jenni and others, 2017).
Creating a Roadmap to Integrated Science
• Where are we now?• Where do we want to be?• How do we get there?• What steps can we take?
Data & Data Integration
Modeling
Science Data Infrastructure
User Needs and Experience
ComputingCapacity
Figure 1. Visualization of the five themes, as road signs, discussed in the breakout sessions of the Roadmap Discussions on Enabling Integrated Science: Data and Data Integration, Modeling, Computing Capacity, Science Data Infrastructure, and User Needs and Experience. For each theme, breakout groups discussed the questions in the gray box.

Roadmap Discussions on Enabling Integrated Science 7
Data and Data Integration
The Data and Data Integration theme was described by the following questions: what USGS data assets are foundational for integrated science, how could they be linked or combined, and what data are needed to meet the goals and grand challenges.
Where Are We Now?The four breakout sessions identified over 40 assets related to USGS Data and Data Integration. These assets included the
substantial size, temporal length, and scope of USGS data; USGS data validation workflow; data management, preservation and shar-ing resources; and initial lists of additional specific data assets. Instead of concentrating on listing particular databases or systems that could be combined, the discussion focused on steps and methods that would be necessary for linking interdisciplinary data in general.
One tool currently available that provides access to USGS data assets is the USGS Science Data Catalog (SDC; https://data.usgs.gov/). The SDC is a single access point for public USGS scientific datasets and a conduit to external catalogs. The SDC allows the public to access USGS datasets through (1) text- and geographic information system (GIS)-based searching, (2) topical browsing, or (3) keyword, mission area, data source, and scientist faceted searching. In addition, many recent developments arising from the public access plan (U.S. Geological Survey, 2016), including data release procedures and trainings, are supporting data and data-integration capabilities at the USGS.
Where Do We Want to Be?The USGS has increased the discoverability of the many USGS data sources, which span diverse disciplines, project types, and
geographic regions.—Efforts to catalog all USGS data (such as the Science Data Catalog) reach the many different disciplinary and organizational sources, including legacy data and small-scale projects from across the Bureau. Information is consistently provided to the public in both human- and standardized machine-readable formats.
The USGS uses external standards or common protocols to increase interoperability within and outside of the USGS.—We achieve robust semantic interoperability2 and agreed-upon standard protocols for data types, usage, serving, and cataloging. The USGS is able to integrate with external data sources because partner agencies hold the same standards for openly accessible data as we do.
The USGS uses innovative mechanisms to capture and communicate feedback on data usability, quality, and fitness for use.—We have overarching standards for metadata (Federal Geographic Data Committee [FGDC] and the International Organization for Standards [ISO]) as well as discipline-specific guidance that provides documentation at the level required for actual reuse of the data. We have guidelines for properly citing and dealing with versioned data.
RecommendationsThese recommendations are listed in order of participant support, as indicated by electronic voting at the Thursday plenary
interactive discussion. D1. Establish expert teams of scientists and data experts from across mission areas to address data assets, gaps, and next steps
for specific grand challenges. D2. Promote use of standards to advance interoperability and usability of data, such as using standardized web services for
discovery and delivery. The USGS still has large amounts of data (for example, tabular, gridded) that could be delivered by standardized web services (for example, as the National Oceanic and Atmospheric Administration [NOAA] does with Environmental Research Division’s Data Access Program [ERDDAP]3).
D3. Increase training on exposing and using data services. D4. Assess need for new or improved foundational datasets (national efforts that inform a good number of mission-area
products, such as elevation, geology). D5. Maintain more robust registries of information products, for example, by improving the Science Data Catalog with stan-
dard catalog services and more features. D6. Increase use of semantic technologies to improve discovery and connectivity, for example, by using existing algorithms
or developing new ones for intelligent tagging of assets to be able to find associated items.
2 Semantic interoperability is the ability to integrate resources that were developed using different vocabularies and different perspectives on the data. “To achieve semantic interoperability, systems must be able to exchange data in such a way that the precise meaning of the data is readily accessible and the data itself can be translated by any system into a form that it understands.” (Heflin and Hendler, 2000, p. 1).
3 Environmental Research Division’s Data Access Program (ERDDAP) is a data server that gives the user a simple, consistent way to download subsets of scientific datasets in common file formats.

8 U.S. Geological Survey Community for Data Integration 2017 Workshop Proceedings
Modeling
The modeling theme was described by the following question: how could models be developed, reused, and connected to enable integrated science.
The definition of modeling and modelers, and their relation to software and scripts, is not the same for every discipline in the USGS. Here, we define modeling broadly as any numerical simulation meant to logically represent a scientific system.
Where Are We Now?
Our assets are our models, modelers, modeling infrastructure, and modeling technologies. Currently, the USGS uses numer-ous models to test and predict process responses, events, and characteristics. Some models have been operationalized and are updated over time to support ongoing research. Application of many, or even most, of these models is sufficiently complex that the community of those expert enough to use the models is considered an asset.
During the 2017 CDI Workshop, the USGS Office of Enterprise Information (OEI) announced the creation of a USGS code repository in GitLab (https://code.usgs.gov/public/) that will eventually automatically mirror all the repositories in the USGS organization on GitHub. The USGS plans to expand to both public and private Git offerings over the next year.
Where Do We Want to Be?
The USGS uses novel communication methods to share information about new tools, resources, and success stories related to modeling, thus enabling us to leverage modeling knowledge more effectively across the entire Bureau.—Despite the diversity of our modeling community, we are able to communicate about modeling efforts from a science perspective. Modelers working on very different science challenges are able to share similar technological challenges and discuss common interests in modeling tools and resources.
USGS researchers have more modeling-specific training opportunities in best practices for software development and programming (for example, organizing data and workflows, modularizing code, and using version-control software like Git) and advance their research more quickly and efficiently.—The Bureau offers training in new modeling techniques to complement the researchers’ specialized expertise in their area of science with advanced computational skills. The USGS promotes software best practices through existing efforts like Software Carpentry and R training events and specifically targets modelers and their needs, such as identifying model output standards.
Existing and in-progress models and modeling resources are easy to discover across disciplines and mission areas within the USGS through a Bureau-wide registry of modeling efforts, thereby allowing new researchers and projects to get up to speed more quickly.—The USGS offers guidance on metadata for software or models and has a common location and protocols for archiving models. Even though many models are developed to meet specific needs of research projects, the models and their outputs are built to encourage reuse and integration.
USGS researchers can easily work with and publish large datasets (terabyte scale) produced by models.—Analysis and visualization are done next to the data with simulation modeling in the cloud, greatly improving our ability to integrate modeling efforts. Software (for example, JupyterHub and Unidata’s Thematic Real-Time Environmental Distributed Data Services [THREDDS]) is accessible in the computing environment and persistent storage is available next to computing resources.
Recommendations
The first five recommendations are listed in order of the support they received at the Thursday plenary interactive discussion, and the next two were added by discussion leads after the workshop. M1. Provide shared remote workspace (for example, cloud) environment for modelers to help analyze and distribute model
results (for example, with analysis environments like JupyterHub and services for serving environmental data like THREDDS and ERDDAP).
M2. Develop an enterprise-grade model API or toolkit that takes advantage of recently developed standards for model output. Currently, we have community standards established for meteorologic, ocean, groundwater, and surface-water models on both staggered and unstructured grids, but no robust toolbox that supports the standards.
M3. Continue and (or) increase support for the Advanced Computing Cooperative (ACC), a group of USGS science centers who have agreed to collaborate and offer expertise and infrastructure to others in the Bureau.

Roadmap Discussions on Enabling Integrated Science 9
M4. Offer training opportunities that specifically target modelers. Training includes, but is not limited to, modeling standards, soft-ware, and Git best practices. Based on past participant experience, training events are most successful when they are relatively small (about six individuals), do not overburden trainees with terminology, and are taught by USGS modelers who have first-hand accounts of how new techniques have improved their own work as a modeler. Virtual training is a possibility.
M5. Create and promote a modeling listserv or Slack channel to improve communication among modelers across the USGS.
M6. Adopt, establish, and promote a metadata standard for describing models that includes information on inputs and outputs, characterization of processes and algorithms, uncertainty, model configuration, and specifics on the application of the model (for example, user-defined thresholds, filtering of input data). The standard could incorporate elements of the World Wide Web consortium provenance standards (W3C PROV), as done by the USGS Biogeographic Characterization Branch in the Core Science Systems Mission Area, or build on the protocol of the USGS Office of Groundwater.
M7. Establish web-based catalog services for finding models, built on model metadata (recommendation M6), that are light-weight but provide support for model discovery.
Computing Capacity
The computing capacity theme was described with the following questions: what existing and desired computing capacity and support at the USGS would improve our ability to pursue integrated science questions (including high-performance comput-ing [HPC], high-throughput computing [HTC], and more).
Where Are We Now?
Participants took note of the significant advances the USGS has made in recent years in standing up and sharing HPC (through the “Yeti” supercomputing cluster in Denver), HTC (through HTC expertise at the USGS Wisconsin Water Science Center) and cloud computing resources from across the Bureau (through USGS Cloud Hosting Solutions operated by the OEI) and sought to build on these. The Core Science Systems Mission Area has been offering USGS scientists approximately 2 to 3 workshops per year such as R scripting in an HPC world, General HPC 101, and Advanced HPC concepts. Through the ACC, USGS scientists have access to training, consultation (such as code tuning), and infrastructure to support their scientific computing needs. The ACC is made up of those USGS science centers who have agreed to collaborate and offer up expertise and (or) infrastructure to others in the Bureau. Core members of the ACC include the Advanced Research Computing group, the Wisconsin Water Science Center, and the OEI Cloud Hosting Solutions group. Select USGS science centers have also created smaller clusters to meet local needs.
The USGS, through the Core Science Systems Mission Area, has proposed various sustainability plans for new computing-capacity solutions.
Where Do We Want to Be?
The USGS recognizes the differences between quickly evolving scientific computing needs and traditional administrative and enterprise computing needs. This allows the scientific computing needs of researchers to be identified and addressed more quickly.—Researchers have a mixture of open-source and commercial, off-the-shelf tools available to support their activities. These tools can be configured, tuned, and (or) customized to support their needs and associated data.
The USGS continues to build on the growing awareness of developments in computing and resources by increased sharing of existing computing capabilities across the Bureau.—The ACC and other coordinating groups increase their reach and include all science centers that have advanced computing needs, facilitating the communication and sharing of computing capabilities and knowledge.
On-site computing resources (laptops, workstations, local clusters) grow at the same pace as the rapidly increasing magnitude of scientific data collected and used, allowing researchers to save, deliver, and efficiently reproduce our latest data products.—The USGS Council of Senior Science Advisors has identified enhanced scientific computing capabilities as one of the primary needs to resolve future complex, interdisciplinary, computationally intensive science questions including the grand challenges that the USGS must address (Jenni and others, 2017). The USGS develops comprehensive coordination across the Bureau to reduce potential duplication of effort and to respond to challenges in a timely manner.

10 U.S. Geological Survey Community for Data Integration 2017 Workshop Proceedings
Recommendations
The training, outreach, and education recommendations are listed in order of support they received at the Thursday plenary interactive discussion. The other two categories (enterprise needs and computing resources) were not voted on because of time constraints.
Enterprise Needs
C1. Core Science Systems and the OEI collaborate to understand and approve new large computing purchases, plan available resources for broader use, and communicate resources across the Bureau.
C2. Implement advanced, higher speed data transfer technologies such as GridFTP and Globus, to improve transfer of data within the USGS, linking it with appropriate computing resources and safely storing and providing access to it.
C3. Perform a network-traffic study to identify network bottlenecks, implement high-speed connections between key centers, leverage Internet2 and Rocky Mountain Advanced Computing Consortium networks, and evaluate a science demilitarized zone (DMZ)4 for separating administrative and science traffic.
Training, Outreach, and Education
C4. Offer internal trainings or partner with universities to offer more online and in-person courses for USGS staff (for example, on advanced computing, R, modifying USGS scientific data and software to run successfully on advanced computing platforms, and cloud-based resources).
C5. Further develop the USGS ACC and communicate the full range of computing resources available to USGS researchers, for example, additional formal communications, a decision tree for services (guiding researchers toward which advanced computing solution might best meet their needs), pilot projects, reuse of models, coordinated email addresses and contact information, and dedicated staffing for coordination and facilitation.
C6. Develop a USGS Computing Scientific Challenge, a prize competition leveraging cloud, HTC and (or) HPC and driven by an executive charge such as grand challenges or science improvement.
C7. Assist in retooling USGS scientific applications and computing to leverage open-source solutions (for example, courses, workshops, communicating benefits from conversion such as converting proprietary MATLAB to open Python).
Computing Resources
C8. Initiate a study to understand specific computing requirements related to key USGS science questions, grand challenges, and products.
C9. Evaluate common or floating licenses for sharing resources across the Bureau, reducing individual investments in software at science centers.
C10. Identify upcoming software needs for computing resources to ensure HPC, HTC, and cloud computing options all have appropriate software.
C 11. Evaluate and further promote open-source solutions, for example, by providing courses, workshops, and communicating benefits of conversion from proprietary to open technologies).
C12. Set up sandbox environments for research into data integration, data applicability, and tools review (for example, staging data for model evaluation).
4 In computer security, a demilitarized zone (DMZ; sometimes referred to as a perimeter network) is “a network added between a protected network and an external network in order to provide an additional layer of security.” (Young, 2001, p. 2)

Roadmap Discussions on Enabling Integrated Science 11
Science Data Infrastructure
The Science Data Infrastructure theme was described with the following question: what infrastructure would support integration of research data (including methods for collecting, displaying, accessing, and delivering it and communicating about it).
Where Are We Now?
The USGS has enterprise operations and infrastructure in place, but also allows the flexibility and freedom for researchers to innovate at the project level, developing project-specific infrastructure for collecting scientific data. National projects maintain methods and techniques to support data collection and handling. Thus, smaller projects are able to build on common infrastructure. Enterprise operation assets include guidance from Fundamental Science Practices and policies to maintain a high level of data quality and integrity for our science.
Additionally, the USGS maintains enterprise systems to support researchers such as the USGS sensor networks (for example, in the Water and Natural Hazards Mission Areas), The National Map, ScienceBase, Advanced Research Computing (high-performance computing), a telecommunications network, and cloud hosting and cloud computing.
The USGS encourages collaboration and holds significant convening power (the ability and reputation to bring groups together), thus allowing scientists to form groups both within the USGS and among a vast partner network to solve scientific challenges and share information.
Finally, the Core Science Systems Mission Area was identified as an asset that is currently supporting aspects of science and data infrastructure and convening power (for example, the Community for Data Integration and myUSGS).
Where Do We Want to Be?
The USGS maintains and builds an infrastructure that focuses on the interoperability of its many research data types, fostering collaboration between programs and mission areas.—There are many opportunities to link laboratories, databases, and sensor networks across the Bureau that could greatly improve integration of data and science as well as reduce duplication of effort. Major systems in the USGS are integrated and able to exchange information quickly and effectively, thus reaching their full potential.
USGS researchers have a forum to share up-to-date project information such that scientists can collaborate on existing sci-ence infrastructure, reducing costs and duplication of effort.—Information about available infrastructure is gathered together for browsing, and the priority of enterprise support is science. The USGS develops guidelines to allow sharing prerelease data and pre-project data-management planning in order to determine if there are opportunities to share infrastructure.
Recommendations
Recommended actions for Science Data Infrastructure fall under the broad categories of encouraging standard practices across the Bureau, encouraging internal cooperation, and incentivizing infrastructure development for the enterprise (and not just individual programs). Science Data Infrastructure should be a USGS priority, to support USGS science. S1. Incentivize scientists to employ shared science infrastructure, including more innovative distribution methods (for example,
APIs), and a standard model or architecture (technology, database, sensor, lab).
S2. Establish criteria so that foundational data are maintained in such a way that they can be interoperable, such as enterprise-tiered storage capacity linked to trusted digital repositories.
S3. Implement a tiger team to look at USGS enterprise systems and architecture to evaluate how they can more efficiently integrate and (or) interoperate with the result of establishing integrated systems and support resources.
S4. Establish a community of practice to provide consistency in how we are approaching data collection and movement with standardized processes, new technology, and DevOps (software development and information technology operations). (Note the USGS DevOps group, for instance.)
S5. Extend enterprise data handling and distribution capability to help meet transparency requirements and increase availabil-ity of collaboration tools (for example, shared workspaces for both internal and external collaborations).
S6. Develop a more efficient funding mechanism and governance to lessen internal competition and decrease disjointed infra-structure.

12 U.S. Geological Survey Community for Data Integration 2017 Workshop Proceedings
User Needs and Experience
During workshop discussions, User Needs and Experience emerged as an important theme, so a breakout group was created to discuss it.
Where Are We Now?Some parts of the USGS are taking actions to understand who uses our products and how, and what characteristics our
products need to be useful.
Where Do We Want to Be?The USGS establishes a forum to discuss techniques to evaluate and address user needs, thereby leveraging knowledge
across the Bureau to improve user experience with USGS products.—Efforts are made to address not only the funders’ but also the users’ needs. User concerns are considered in planning integrated science products.
The USGS has national assets, such as metrics, to help us understand use of USGS products, allowing us to strategically improve the user experience.
Recommendations
U1. Identify existing assets and processes to help the USGS as a whole and USGS programs understand how our products are used (and not used) or needed by defined audiences.
U2. Identify techniques for integrating information about user experience into a development process for integrated science products.
U3. The USGS or the CDI should set up a group of people to follow through with this, working with Earth Science Information Partners (ESIP) and USGS Libraries to help accomplish this task.
Recommended Pilot Projects
Pilot projects described here are consolidated from similar ideas that came up in the separate discussion groups, and are ordered loosely by anticipated effort required for implementation, starting with the easier to implement and progressing to the more difficult. We realize that the projects are at different levels of feasibility and resource requirements, but each could have a significant effect.
Abbreviations for each theme are used to label the primary theme and then other related themes for each project: D, Data and Data Integration; M, Modeling; C, Computing Capacity; S, Science Data Infrastructure; U, User Needs and Experience. P1. (S, D, M) Sponsor a series of scientist-to-scientist workshops to share best practices related to science data and science-data
infrastructure, thereby improving communication about computing, modeling, and infrastructure resources across the Bureau.
• Example: Demonstrating and developing how current science data infrastructure helps automate manual processes.• Example: Developing cross-domain “data-as-code” projects to demonstrate how data development can be automated.
P2. (M, D) Reproducible Science Interoperability Project: Compile Jupyter or R Markdown notebooks showing interoperabil-ity: accessing, analyzing and visualizing data from two or more web services from different disciplines or mission areas. The project team could create a series of notebooks (for example, notebook of the month) that would demonstrate different linkages in the USGS and among partners with web services.
This pilot project would have a number of benefits:
a) demonstrate successes we already have with interoperable web services, b) find small issues with metadata and services that would be easy to fix, c) point to larger issues that highlight gaps, and d) provide reproducible examples that could be reused for other service and interoperability testing.
Roadmap Discussions on Enabling Integrated Science 13
P3. (D, M, C, S, U) Establish expert cross-mission-area teams of scientists, data experts, and product users to address specific aspects of a USGS grand challenge involving data and data integration, computing, modeling, and science-data infrastructure, such as one or more from the Jenni and others (2017) report.
• Example: Form a team to work on a grand science challenge, such as forecasting invasive species, based on interoperable components—identify where connectivity and components are broken and how they could be fixed (for example, through application of standards). The overarching goal would be to determine what is possible in the USGS with our current assets and to identify ideas on how to improve processes, protocols, and so forth, not necessarily to develop a fully functional invasive species forecasting system.
P4. (C, D) Perform a retrospective on a natural disaster to learn how to leverage computing capacity and data when responding to disasters. The exercise could be run in simulated realtime and document what could have been done—so that response to the next disaster event could be supported in an improved manner.
• Example: the Upper Midwest Environmental Sciences Center (UMESC) is already collecting near-real-time data in its eDNA monitoring of invasive species. (https://umesc.usgs.gov/aquatic/aquatic_invasives24.html).
P5. (S, C) Invest in a science demilitarized zone (DMZ) for the USGS, a subnetwork to handle high-volume data transfers, including scientific and high-performance computing. This would improve enterprise-level data handling, movement, and distribution capability and include a substantial increase in bandwidth for centers.
P6. (D, S, M) Create a new or better mechanism for a registry of tools, data, models, staff expertise, active projects, and other information products.
• Example: Share data-management plans (with methodology, protocols, sample designs, and project descriptions) so that future researchers could more readily discover and use previous project designs and therefore have an easier time developing metadata, improving discovery, integration, and quality.
• Example: Model catalog (see recommendation M7) to improve discovery and application of models.
P7. (S) Charge an enterprise architecture team to design an interoperable architecture that spans USGS enterprise. Engage the Investment Review Board in examining the overarching infrastructure investment process, and evaluating infrastructure purchases based on scalability and reusability for enterprise purposes, with the goal of lessening siloed purchases in the Bureau.
Summary of Roadmap Discussions on Enabling Integrated Science
As presented in the introduction, the recommendations in this document (34 thematic recommendations and 7 pilot projects) represent our community’s venture to chart a course and assist any USGS team in reaching its goal of integrated science, whatever the team’s expertise, current priorities, and requirements. Even as Bureau priorities and strategy change, the recommendations presented here will build a foundation for the different teams in the USGS that are striving to reach their own style of integrated science.
The workshop participants agreed that the USGS has many assets that have been built over time to enable integrated science. But in order to reach the goal of routine and commonplace integrated science everywhere in the Bureau, the USGS must place greater focus on enterprise challenges and make long-term investments to address them for our researchers and data staff. The recommendations and pilot projects presented here have common themes of improving communication, increasing training and testbed opportunities to learn and experiment, and creating community-supported standards for better integration and interoperability. These themes solidly align with the CDI’s strengths and interests. A large number of CDI members noted that they would be interested in participating in future activities to implement the recommendations here, and we look forward to those opportunities.

14 U.S. Geological Survey Community for Data Integration 2017 Workshop Proceedings
Presentations and PanelsBrief summaries of the plenary presentations and panels are provided here in order of occurrence.
Welcome and Opening Remarks
By Tim Quinn (USGS Office of Enterprise Information)The Community for Data Integration exemplifies large-scale collaboration to solve big-data challenges. Over the years, we
have seen the strength and enthusiasm of this grassroots community, and we are looking forward to the outcomes of this workshop, including the Roadmap to Integrated Science discussions that will influence the future of the USGS.
Why Enable Integrated Science?
By Marty Goldhaber (USGS Geology, Geophysics, and Geochemistry Science Center)Change is happening in our world, and the U.S. Geological Survey (USGS) needs to change as well to remain
relevant. The USGS is the only non-regulatory Earth-science agency within the Department of the Interior, with boots-on-the-ground scientists and data spanning the nation. The USGS has an untapped opportunity to engage in integrated science and tackle problems at a large, decision-making scale. The USGS Science Strategy 2007–2017 (U.S. Geological Survey, 2007) is coming to the end of its scope, and the USGS needs to plan for the future. One priority must be to continue to dissolve silos of data and research. The USGS Council of Senior Science Advisors (COSSA) has been thinking about this. COSSA has a long-term vision for an integrated scientific framework that spans traditional scientific boundaries and disciplines and integrates the full portfolio of USGS science. We call it EarthMAP, for Earth Monitoring, Analyses, and Projections. A workshop in February 2017 was held to identify integrative scientific grand challenges that could unite the USGS and guide our efforts toward EarthMAP (Jenni and others, 2017).
Beyond the Fourth Paradigm—Integrative Science Is Also about People
By Bruce Caron (Earth Science Information Partners)We are experiencing a great explosion of science, but there is failure to scale. Scientific communication must
evolve with our technology. For example, scientific posters have been popular for some time now, but take a lot of time, effort, and money and usually do not get reused. Posting ideas and content on the internet can facilitate shorter time to both collaboration and results than in-person workshops. The organization Earth Science Information Partners, uses the internet to host working clusters, as well as to accomplish crowdsourcing, attribution, sharing, and rating of ideas. When in-person science-community gatherings do occur, these gatherings can be thought of as festivals, where all are active participants and all are leaders. It is important for there to be enough trust in the community so that risks can be taken and creativity spawned. In an optimal gathering, all participants are leaders and all contribute to progress.
The Joy of Data Lightning Panel
Moderated by Fran Lightsom (USGS Woods Hole Coastal and Marine Science Center)Did you ever manage to collect good data in an incredibly challenging location? Create cool infographics to communicate
a really complex scientific finding? Build a database that satisfied an impossible combination of requirements? Participants in the Joy of Data Lightning Talks shared the joy by giving a 60-second lightning talk with a single PowerPoint slide that illustrated their challenge, for example, a photo of that measurement site, a screenshot of the infographic, or a Venn diagram of the requirements.
Data Sharing—Agreements and Processes
By JC Nelson (USGS Upper Midwest Environmental Sciences Center)How can we improve the process of data sharing? What successes have we had following the October 1, 2016,
implementation of our USGS public access plan (USGS, 2016), and what challenges remain? How do we handle shared data? Is it possible to have a shared library of approved data-sharing agreements? This talk presented the challenge, reported on progress that has been made in terms of agreement templates, and discussed where to go from here.

Presentations and Panels 15
Data Science Community of Practice
By Lindsay Carr (USGS Office of Water Information)Working knowledge of computer science and statistics (in other words, data science) is increasingly important
for dealing with 21st century data-intensive scientific workflows. One of the biggest barriers in developing efficient workflows can be knowing what appropriate tools, packages, or techniques exist. Channels of communication between users engaged in similar work can help but can be difficult to establish because practitioners are scattered across projects and offices. A subsequent Birds of a Feather session solicited group input on (1) the scope of a data-science community of practice, (2) identification of data-science (or similar) groups that exist within and beyond the Bureau, (3) exploration of opportunities for data science to enhance existing Bureau science, and (4) the potential ownership of such a group, including as a Community for Data Integration working group. An established data science group would promote sharing and exchange of data-science practices across the Bureau, with the ultimate goal of increasing efficiency, reproducibility, and scalability of science throughout the U.S. Geological Survey.
Improving the Interface and User Experience for the Data Management Training Clearinghouse
By Sophie Hou (National Center for Atmospheric Research)The Data Management Training Clearinghouse was developed with seed money received in 2016 from the
U.S. Geological Survey’s Community for Data Integration. The implementation phase of the collaboratively developed clearinghouse allowed the clearinghouse to become operational and ready for people to search, browse, and submit learning resources related to research data management. Although the clearinghouse team was able to complete some informal usability testing of the clearinghouse’s interface during the initial six months of its funding, the team aims to improve and enhance the ease of use for all of the clearinghouse functions. This presentation provided a brief introduction to the clearinghouse’s current design and implementation, and invited the workshop attendees to try out several key functions of the clearinghouse in order to provide feedback and suggest the priorities for its future development.
Advanced Scientific Computing Solutions
By Jeff Falgout (USGS Core Science Analytics, Synthesis, and Library)Advanced computing is the practice of aggregating computing power in a way that delivers much higher performance
than one could get out of a typical desktop computer or workstation in order to solve large problems in science. The U.S. Geological Survey provides several tools to help researchers with their advanced scientific computing needs. The Advanced Computing Cooperative works across organizational boundaries to provide advanced scientific computing capabilities to U.S. Geological Survey researchers. These capabilities include a consulting toolbox, compute toolbox, and data toolbox. Email [email protected] for more information.
Strategies for Building an Integrated Science Capacity
By Kevin T. Gallagher (USGS Core Science Systems)The Community for Data Integration (CDI) is the result of a grassroots effort to increase the efficiencies between
the information technology and research-science communities within the U.S. Geological Survey (USGS). There has been a lot of specialization to advance basic science, but societally significant issues are complex and solutions need to be interdisciplinary in order to deliver useful products and information for decision making. To reach this goal, we must work together and integrate science and information from different disciplines. This community has the expertise to build high-profile, modular components of an integrated decision-support system. I would like to ask your help in creating a roadmap to achieve the integrated science of the USGS vision. The Executive Leadership Team is eager to hear your input; you have a lot of power as a member of the USGS and the CDI to guide the path.
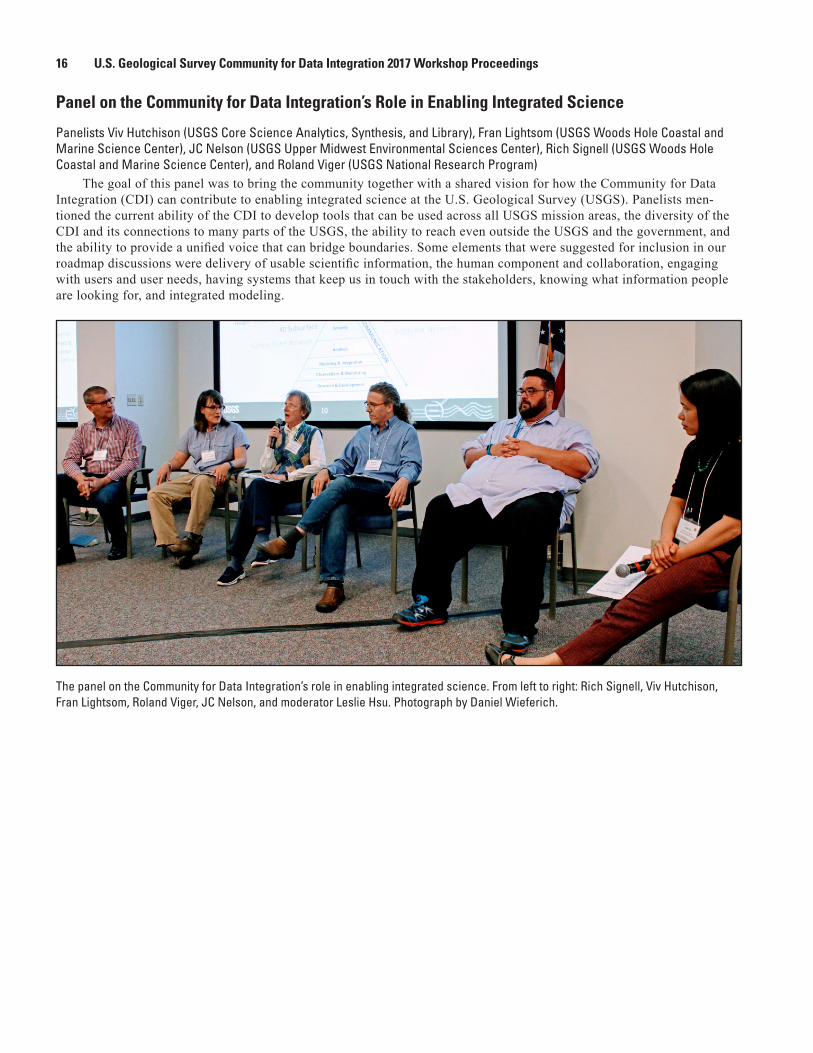
16 U.S. Geological Survey Community for Data Integration 2017 Workshop Proceedings
Panel on the Community for Data Integration’s Role in Enabling Integrated Science
Panelists Viv Hutchison (USGS Core Science Analytics, Synthesis, and Library), Fran Lightsom (USGS Woods Hole Coastal and Marine Science Center), JC Nelson (USGS Upper Midwest Environmental Sciences Center), Rich Signell (USGS Woods Hole Coastal and Marine Science Center), and Roland Viger (USGS National Research Program)
The goal of this panel was to bring the community together with a shared vision for how the Community for Data Integration (CDI) can contribute to enabling integrated science at the U.S. Geological Survey (USGS). Panelists men-tioned the current ability of the CDI to develop tools that can be used across all USGS mission areas, the diversity of the CDI and its connections to many parts of the USGS, the ability to reach even outside the USGS and the government, and the ability to provide a unified voice that can bridge boundaries. Some elements that were suggested for inclusion in our roadmap discussions were delivery of usable scientific information, the human component and collaboration, engaging with users and user needs, having systems that keep us in touch with the stakeholders, knowing what information people are looking for, and integrated modeling.
The panel on the Community for Data Integration’s role in enabling integrated science. From left to right: Rich Signell, Viv Hutchison, Fran Lightsom, Roland Viger, JC Nelson, and moderator Leslie Hsu. Photograph by Daniel Wieferich.

Presentations and Panels 17
API Plugfest Report Out
By Ivan DeLoatch (USGS Federal Geographic Data Committee)The Application Programming Interface (API) plugfest was conducted on Tuesday, May 16, 2017. The plugfest was a
collaborative environment for public-private partnerships to engage in research and development toward interoperability of our many different data sources and tools. The intent of the plugfest was to highlight technology and develop lessons learned in using geospatial APIs. We did this by discussing how to use APIs effectively to exchange information, plan for increased use of protocols, and share thoughts and ideas. The plugfest focused on the themes of water, environment, food, and hazards. The themes are interconnected and must be integrated to support decision-making.
The Federal Geographic Data Committee (FGDC) has been a proponent of developing geospatial technology for the Nation to enable a location-based digital ecosystem. The FGDC is focusing on providing technology such as data, tools, and services, and APIs are part of the framework. We have diverse contributors: organizations represented in the API plugfest included the General Services Administration, the U.S. Department of Agriculture, the Open Geospatial Consor-tium, Esri, the Federal Emergency Management Agency, the National Aeronautics and Space Administration, the National Oceanographic and Atmospheric Administration, the U.S. Geological Survey, the Environmental Protection Agency, the Group on Earth Observations (GEO), and others. We had great participation from API providers.
The following needs to support APIs were identified:• standards for interoperability (critical),
• increased engagement and feedback from users (it was interesting to see perspectives from developers and users),
• resolution of security issues when working across various domains,
• increased bandwidth, and
• improved use of standards, encouraging use of the Open Geospatial Consortium framework.
Elevation and Hydrography Data Integration
By Steve Aichele, Jason Stoker, and Al Rea (all from the USGS National Geospatial Program)The integration of our national elevation data and the National Hydrography Dataset into a more cohesive package is
a priority for both the elevation and hydrography communities. As new, high-resolution elevation data enters through the 3D Elevation Program, older, smaller-scale national hydrographic features may not necessarily align well. The ability to create synthetic streams from elevation data is a fairly automated process, however, routing flow automatically becomes difficult when barriers such as culverts are left in the data. Also, conflating all the attributes from the existing linework to any new or newly aligned streams is not an easy task. This presentation provided some program insights as to where we are in terms of elevation and hydrography integration and where we hope to be by 2020. Topics included the National Geospatial Program (NGP), the National Enhanced Elevation Assessment, the Topo Data Services Strategic Roadmap, and the National Hydrography Dataset Plus (NHDPlus).
Keynote Talk
By Bill Werkheiser (USGS)The Community for Data Integration has done a phenomenal job in using its network and knowledge to advance data
integration and management at the U.S. Geological Survey (USGS). From the first DataBlast many years ago, to recent implementation of data policies and data-management procedures, from your work in integrating different information systems, providing data portals, and making connections within and beyond the USGS, you have taken the opportunity to build your portfolio of accomplishments. Now it is time for us to take another look at our USGS strategic science plan. The Executive Leadership Team has reviewed all of the documents and sources of information and has come up with a new annual science planning process that is nimble and can change with the priorities of the Bureau. We will also be looking at realigning our Bureau to improve communication throughout. Your community, developing tools and delivering outcomes, helps the USGS with its applied science, and I thank you for the work that you do.

18 U.S. Geological Survey Community for Data Integration 2017 Workshop Proceedings
Panel on Community for Data Integration in Action
Panelists Emily Fort (USGS National Climate Change and Wildlife Science Center), Tim Kern (USGS Fort Collins Science Center), Michelle Guy (USGS Geologic Hazards Science Center), and Sky Bristol (USGS Core Science Analytics, Synthesis, and Library)
The goal of this panel was to highlight how the Community for Data Integration has already been enabling integrated science. Each panelist gave a presentation on an example of integrated science: Hunting and Fishing Climate Impacts from the U.S. Geological Survey National Climate Change and Wildlife Science Center (Emily Fort); ScienceCache—Fail Fast, Recover (Tim Kern); The Power of Data Sharing, Integration, and Innovation (Michelle Guy); and the Science of Dam Removal (Sky Bristol).
Elements of success in these previous integrated efforts included acknowledging the challenge of collaborative work and securing funded data stewards, taking on high-risk ideas and sharing lessons learned with the community, integrating free citizen-science data with scientific standardized data, and sharing the integrated data with other agencies. Another theme was coordinating the Powell Center, the Community for Data Integration, and other projects to work off of a common spark for innovation.
Panel on Community for Data Integration in Action. From left to right: Emily Fort, Tim Kern, Michelle Guy, and Sky Bristol. Photograph by Viv Hutchison.
A Road Map for Enabling Integrated Science—The U.S. Geological Survey Has Experience with This!
By Viv Hutchison (USGS Core Science Analytics, Synthesis, and Library)The U.S. Geological Survey (USGS) Associate Directors and the Council of Senior Science Advisors have presented us
with an exciting charge: to engage the Community for Data Integration in the process of creating a roadmap for implementing new innovative ideas that enable the integration of science in the USGS. When the USGS published a plan called “Public Access to Results of Federally Funded Research at the U.S. Geological Survey—Scholarly Publications and Digital Data” (U.S. Geological Survey, 2016), it outlined a framework for activities that would increase public access to scholarly publications and digital scientific data resulting from research funded by the USGS. The plan required collaboration, action, and accountability from a variety of Bureau programs that had not necessarily worked together before to get it implemented. But, we did it. (Who had any doubt?!?) We did it in a 6-month period by understanding our goals, getting the appropriate people on the job, and holding accountability meetings that showcased our progress and our success. Sure, there are still some loose ends in our example—things that need continued work —but let us take a look at the lessons learned and what it took to be successful, so we can show how we, the Community for Data Integration, can actively support and implement a roadmap for enabling integrated science.
Topical Sessions 19
Topical SessionsBrief summaries of the sessions are provided here in order of occurrence.
Information Technology Architecture to Support Integrated Science
Session led by Cassandra Ladino (USGS Eastern Geographic Science Center), Tim Quinn (USGS Office of Enterprise Information), and Paul Exter (USGS Office of Enterprise Information)
The goals of the session were to introduce key people from the Office of Enterprise Information (OEI) and to learn about the need for information technology architecture to support integrated science. We covered two use cases: Alces Flight (a scalable high-performance computing environment for research and scientific computing) and the National Minerals Information Center, and had a discussion about ideas for innovation and community building.
In this session we discussed OEI capabilities and the needs of scientists throughout the U.S. Geological Survey (USGS). Scientists from different disciplines need to access data across traditional boundaries. They require the ability to synthesize, analyze, model, simulate, predict, visualize and display data and results using a wide array of commercial and open-source tool sets. They also require access to computing environments capable of high-performance computing and high-throughput computing, among other capabilities. Finally, scientists require well-curated, accessible storage that allows multidiscipline access and integrated mashing up. This storage needs to be located (virtually or physically) near enough to take advantage of high-end computing resources.
The OEI provides infrastructure and computational services for the USGS that support science projects and web applications and services. OEI’s capabilities include wired and wireless network maintenance, Advanced Research Computing, data-storage options, software tools, customer desktop experience, and security and integrity of information.
With respect to enabling integrated science at the USGS, scientists are often isolated by insufficient network bandwidth, access to software and computing tools, storage, and other information technology capabilities limiting integrated scientific work. Cost of expensive software licensing, high-end servers, and storage often exceed the funds available to individual science centers. Frequent complaints are heard regarding inability to get data to and from where it is needed.
The USGS is and has been a leader in computing for many years in the Department of the Interior. Our cloud and Advanced Research Computing capabilities have been recognized recently by the Department as best practices and are being considered as a shared reimbursable service to other bureaus. However, there are significant gaps in our ability to achieve integrated science because our information technology infrastructure separates the scientist from the data and the processing. Although some of the elements of the proposed coherent architecture exist, we cannot be successful until we address these gaps.
Ideally, we would like to move to a situation where a purpose-designed architecture leverages existing capabilities, improves on the areas where gaps exist, and supports the scientists in a manner in which they deserve. A discussion about and an evaluation of the possibility of establishing a cross-sector integrated architecture team to address these issues could help us get there.
Scientists are ready and willing to utilize advanced computing resources, as was clear from the participation at our session and related Cloud Hosting Solutions sessions. To support integrated science, storage and network challenges must be addressed and more support needs to be dedicated to infrastructure. Consolidation of systems, such as the Advanced Computing Cooperative and cloud, should be encouraged.
Some steps we can take to get to where we want to be are listed below. • Expand the Cloud Hosting Solutions capability.
• Provide training on and enable easier access to sandbox environments.
• Collect additional input from scientists.
• Consolidate common software (for example, Oracle) and infrastructure.
• Increase network bandwidth options with broadband, direct connect, and other technologies.
• Enable virtual-desktop-infrastructure capabilities for scientists located in offices that are challenged with network performance.
• Support data storage staging capabilities to enable advanced scientific computing solutions.
• Provide data storage capabilities that extend beyond the end of the life of a project.

20 U.S. Geological Survey Community for Data Integration 2017 Workshop Proceedings
• Assess whether some applications should be consolidated rather than distributed.
In the next year, some steps that could be taken to reach our goals are to continue to discuss infrastructure that supports integrated science with mission areas, leverage the Federal Information Technology Acquisition Reform Act cross-discipline team to address decreasing stove pipes, work with the Department of the Interior to address telecommunications concerns, and further leverage and resource the cloud.
National Map Corps Mapathon
Session led by Elizabeth McCartney (USGS National Geospatial Technical Operations Center)The National Map Corps is a citizen science project focused on data acquisition and improvement in support of The
National Map geospatial databases. In this session, participants learned about the U.S. Geological Survey (USGS) citizen science project called The National Map Corps and helped to improve data about structures at the same time. We con-firmed, updated, and added new features, and removed obsolete points using our online map editor. Both newly collected and modified point features become part of the USGS National Structures Database, The National Map, and ultimately USGS topographic maps.
Although citizen science is an essential part of integrated science, there continues to be resistance to volunteered geographic information. We need a strong affirmation indicating citizen science is a valid solution for significant mapping or geospatial data problems.
Next steps include expansion in the number and types of features collected or improved, establishment of partnerships both internally and externally to leverage the current web editing application, and the development and implementation of a mobile editor.
See more at https://edits.nationalmap.gov/tnmcorps/.
Legacy Data—Challenges and Solutions
Session led by Lance Everette (USGS Fort Collins Science Center) and John Faundeen (USGS Earth Resources Observation and Science Center)
This was an interactive session that discussed (1) tools to inventory and report U.S. Geological Survey (USGS) legacy data in need of preservation; (2) methods to evaluate and prioritize legacy data inventories based on risk of damage or loss, USGS mission areas, programs and priorities, and geospatial and temporal extents; and (3) funding models for preserving and publishing priority USGS legacy data.
To set the stage, a brief overview of each legacy data challenge was provided, with a presentation of the experiences and solutions developed through the USGS Data Rescue Program (2006–2013), Legacy Data Inventory Reporting System (2014–present), and the Data at Risk preservation project (2016). Participants were encouraged to provide feedback on improvements to existing tools and methods, as well as to suggest new potential solutions to these challenges.
Data Citation—What’s All the Fuss?
Session led by Lisa Zolly (USGS Core Science Analytics, Synthesis, and Library)In this session, we discussed the following questions—What is the real value of data citation? What considerations
should we be mindful of in our use of Digital Object Identifiers (DOI) (at what level should they be applied)? How is the U.S. Geological Survey (USGS) involved in the larger community of practice focusing on data citation? What tools do we have in the USGS to create, reserve, and apply DOIs to our data?
The more we collectively understand the intricacies of data citation and can align our practices related to the application and use of persistent identifiers, the more successful we will be in understanding how our research data are being reused.
Priorities that emerged from the session discussion, organized around the Future of Research Communications and e-Scholarship (FORCE11; https://www.force11.org/) data-citation principles, are summarized as follows.
• Credit and attribution—Data are legitimate, citable products of research that should be afforded the same importance as scholarly publications.
• Evidence—Wherever a claim in the publication relies upon data, the data should be cited. It is therefore important for USGS data to be published in ways that are easy to reference, discover, access, and cite.

Topical Sessions 21
• Unique identification—We currently assign DOIs to static datasets. The next step is to support granular DOIs for citable components of a data release. In the future, we want to figure out dynamic DOI assignment for our queryable, dynamic data systems.
• Access—For static data releases, each DOI should resolve to a landing page that provides access to data, metadata, code, documentation, and other materials. This presumes use of repositories.
• Persistence—DOIs are permanent, not deletable, and must be managed even beyond the life of the data they reference. There is a need for more consistent curation of our DOIs.
• Specificity and verifiability—Link analyses and the supporting data, guarantee provenance, and ensure future access to the exact data that were cited.
Data-Management Plans and Strategies for Science Centers
Session led by Cassandra Ladino (USGS Eastern Geographic Science Center)The goals of the session were to showcase working examples of data-management plans (DMPs) and data-management
strategies. We discussed the obstacles in data-management planning and where science centers need more support, as well as innovative ideas for implementing DMPs and data-management strategies.
This session was a continuation of the Community for Data Integration Science Center Strategy Development work group (SCSDWG) discussion that occurred online in 2016–2017. However, all were welcome, whether they participated in the SCSDWG or not! Our objective was to learn from one another and create solutions that work for science centers and staff. Data-management plan development and implementation was highlighted in this session, although we covered other approaches to developing data-management programs as well.
This topic relates to enabling integrated science at the U.S. Geological Survey because we need functional and repeatable processes for data management in place at the science-center level before we can begin to integrate data across centers or disciplines.
Currently, there are varying degrees of data-management maturity across the U.S. Geological Survey. Gaps exist in maturity of data-management activities across science centers and programs, and in education and implementation of DMPs.
Our goal is to help establish a baseline and provide opportunities for data management to mature. Ideally, we would move to a situation where data strategies at the science center and program level inform scientists about larger data goals and data-management options, where principal investigators are engaged in DMP development and get the most value out of the documentation, and where there is an enterprise solution for creation and management of DMPs that allows for template customization and search, reuse, and discovery of content.
Some steps we can take to get to where we want to be include collaboration and sharing of strategies that work, increased accountability for DMPs, and development of use cases for tools that help with DMP challenges.
Software Showcase
Session led by Michelle Guy and Lynda Lastowka (both from USGS Geologic Hazards Science Center)The goals of this session were to highlight some best practices for software development for all, and to explore how
to bring the numerous U.S. Geological Survey (USGS) software efforts into a search space to better enable finding, using, contributing to, and collaborating on these efforts and tools to support integrated science.
Software is a key component of reproducible, sharable, integrated science especially as our science becomes more complicated, with larger volumes of data. We want software in the USGS to be highly visible and discoverable, managed with actionable and flexible guidelines to cover the wide spectrum of software, community based, available in external and internal spaces, and valued.
Currently in the USGS, a community of those involved in software development is emerging. Within that community, science centers and individuals have their own procedures and work flows that are very different. To start aligning proce-dures and guidelines, the Best Practices project in GitHub (https://github.com/usgs/best-practices) is a valuable resource and is even being used by the Department of the Interior to solve technical issues.
We would like to move to a situation where there are informed and consistent fundamental practices that accommodate diverse needs. Towards the goal of integrated science, sharing software is highly important. Software by its very nature should
22 U.S. Geological Survey Community for Data Integration 2017 Workshop Proceedings
be reusable and shared. However, the stealing (or “scooping”) of another’s code needs to be addressed and transparency is one key to the solution.
Some short term (1–3 years) steps we can take to get to where we want to be are listed below.
• Enable software discovery with centralized hosting. (for example, by using the USGS code repository in GitLab at https://code.usgs.gov/)
• Integrate with the USGS Web Re-Engineering Team (WRET) Science Explorer. This would allow connections with staff pages, research projects, publications, and so forth, and could possibly evolve into a software catalog for the USGS.
• To make software searchable and discoverable, figure out what type of metadata is necessary and develop a system for tagging software. It would be beneficial to develop an application programming interface (API) to help automate meta-data tagging. Recent agency policy was developed to make software citable with a Digital Object Identifier (DOI).
• Implement keyword searching and metadata for software, perhaps in ScienceBase.
• Establish a review process for software. This might be achieved with community volunteers.
• Build a community of practice.
• Get technical staff involved at the start of a project that includes software development, not at the end.
• Establish best practices, a curriculum, and a process for educating software developers on these practices:
• Fundamental Science Practices training and
• Software Carpentry workshops.
• Establish a checklist for approval (such as at the Center Director level) to make the review easier.
Some longer term (3–10 years) steps we can take to get to where we want to be are listed below.
• We might consider some type of Bureau Approving Official (BAO) for software. We do not know exactly what that would look like, but it could be beneficial to have a BAO with sufficient technical knowledge to review and approve software.
• Elevate the value placed on software to a similar level as for research papers or publications. Software is a mechanism to communicate and deliver the science to the users. Publicly accessible software contributes to the transparency and reproducibility of the science and accelerates discovery and innovation. It may also pull in talent from the public if they discover and contribute to an open-source project online.
• Define methods that allow us to identify the value of software. What metrics do we use? How do people get credit? Are there analogies to be drawn with regards to traditional publications?
• Develop a process for hosting code on code.usgs.gov that integrates well with the WRET, as software cannot be hosted in Drupal. The WRET can have a software page listing software. (The software itself would be hosted on the USGS code repository in GitLab at https://code.usgs.gov.)
Enterprise Tools for Documentation of Protocols, Methods, and Study Designs
Session led by Rebecca Scully (USGS Pacific Northwest Aquatic Monitoring Partnership), Jen Bayer (USGS Pacific Northwest Aquatic Monitoring Partnership), and Jake Weltzin (USGS National Phenology Network)
This session focused on sharing Monitoring Resources (https://www.monitoringresources.org), which is an online suite of tools that supports documentation of methods, protocols, and sample designs related to monitoring. The session presented user stories describing the use of the tools and associated application programming interfaces. The goal was to facilitate a discussion on the Monitoring Resource tools as an enterprise resource, to determine how the community of practice could use these tools, to learn what other tools exist that could be integrated to support the Community for Data Integration Science Support Framework, and to identify what improvements could be made.

Topical Sessions 23
Currently, several groups within the U.S. Geological Survey (USGS) are working to support monitoring across large spatial and temporal scales and across jurisdictional boundaries, but we lack tools to support integration of plans for data collection as well as integrated data delivery. To deliver information in a timely and consistent manner, we need enterprise infrastructure to help research and monitoring practitioners manage data and information through the full data lifecycle. In the USGS, we have some of this infrastructure as part of the new Data Release Workbench, but it is not linked to planning of research and monitoring in a way that ultimately facilitates data interoperability, integration, and delivery of higher order data products.
Ideally, we would use the existing tools such as Monitoring Resources to build an open and freely available suite of enterprise tools that supports consistent data collection, analysis, and reporting to generate efficiencies in the management and delivery of information to decision-makers.
The session participants suggested short-term (1–3 years) steps to building enterprise tools, initially focusing on developing and testing enterprise resources to support information transfer from collection of data to implementation of knowledge. Immediate objectives include
• working with the USGS community to understand if Monitoring Resources can serve as an official USGS citation for USGS work, journal work, and so forth;
• linking the tools to the USGS map resources like the National Hydrography Dataset Plus;
• creating and building linkages to transfer information (using application programming interfaces) from Monitoring Resources to pre-populate a metadata record;
• establishing rules for automated information upload into Monitoring Resources from other systems;
• conducting outreach to additional communities of practice to learn if Monitoring Resources fits their needs;
• completing pilot projects to understand needs and make improvements to Monitoring Resources platforms;
• creating a steering committee to guide this effort; and
• conducting outreach to decision makers and program leaders to understand how they consume information and to devise a business plan that could support discussion about meeting these needs.
Longer term (3–10 year) creation of enterprise resources to support information transfer from collection to knowledge would require
• consistent funding support for development, operation, and maintenance of enterprise resources;
• two to three communities of practice using the tools;
• linkages between Monitoring Resources tools and other tools to eliminate duplication of effort and to streamline the creation, review, and release of data and data documentation;
• a team of staff to support users of the tools, including training, development, and outreach; and
• a community of practice operating across Federal organizational boundaries to guide the development and application of enterprise tools in support of coordinating resource monitoring and ultimately data integration and application.
Getting Your Hands Dirty with 3D Elevation Program Data
Session led by Jason Stoker (USGS National Geospatial Program) and Darcee Killpack (USGS National Geospatial Technical Operations Center)
This workshop on the U.S. Geological Survey’s 3D Elevation Program (3DEP) helped participants to add three-dimensional features to their research, gain familiarity with U.S. Geological Survey light detection and ranging (lidar) data (over 4 trillion points and over 75 terabytes), and learn how to get lidar data and what to do with it. Topics included finding data in an area of interest, knowing the difference in products available, connecting to elevation services, understanding spatial and project metadata as it relates to 3DEP, visualizing and processing lidar and lidar-derived products using open-source tools, and high-performance computing with lidar.
24 U.S. Geological Survey Community for Data Integration 2017 Workshop Proceedings
U.S. Geological Survey “Science on a Screen” for Parks, Schools, and Museums
Session led by Rex Sanders (USGS Pacific Coastal and Marine Science Center)The goal of the session was to explore interest in an idea: creating easy to implement, easy to understand, web pages
for kiosks in parks, museums, and schools that present many different kinds of U.S. Geological Survey (USGS) science.About 15 people met to discuss the idea. Most were very supportive, and several wanted to help work on a full project
proposal. Concerns included long-term funding, working with low-resource locations (places with old computers, slow internet, no information technology support), and choosing appropriate external partners. Several participants already work with the public or partners who supply USGS information. Several mentioned the possibility of external funding to serve specific partners, like libraries. We added libraries as potential kiosk partners. Parks and museums have expertise in what works for kiosk information and would make excellent partners. The National Park Service would make an excellent Department of the Interior partner at both high levels and at individual parks. (Point Reyes National Seashore, Calif., is interested in this concept.) We could collaborate with a university group with expertise in application development and user experience.
This project would present integrated USGS science to a very wide audience—potentially millions of visitors annually to parks, museums, schools, and libraries.
Currently, the USGS presents many different kinds of information in widely varied formats, mostly targeted at profes-sional audiences, which are hard to customize for kiosks. It is even harder to present integrated science.
Ideally, we would work toward a situation where a National Park Service interpretive specialist could easily select from a large number of web pages that present USGS science at an appropriate level for park visitors. A USGS server would deliver those pages to an unattended kiosk running on an old computer and a slow internet link with no information technology support. Other users may find this approach useful, including other parks, museums, schools, libraries, congressional offices, and the general public. This project could become one facet of Earth Monitoring, Analyses, and Projections (EarthMAP) (Jenni and others, 2017).
The first short-term step to help us get to our vision would be to create an interest group to develop a project proposal and seek appropriate partners inside and outside the USGS. Further, the interest group could seek funding from the Community for Data Integration, other USGS sources, and outside partners. The group would start developing requirements, find gaps in desired services, and work with partners to fill those gaps, leading to development of products.
In the long term (3–10 years) the project needs long-term support, both financially and organizationally, to keep the service running and updated as new technology and new USGS products become available.
Delivery of Real-Time Information
Session led by Jake Weltzin (USGS National Phenology Network)The goal of this session was to investigate the potential for the U.S. Geological Survey (USGS) to become a leader in
the delivery of real-time data and information across scientific disciplines.About twenty people joined our session, which focused on a broad discussion of the value of real-time information
production and delivery across several disciplines within the USGS. We explored several case studies, including examples from water, biodiversity, and natural hazards including flooding and earthquakes.
Conversation included the following topics.• What are the opportunities and challenges to delivery of data and information realtime?
• How do we create and deliver information that is most useful to our stakeholders?
• What are some good models we can look to, and what are their lessons learned?
• How do we integrate, synthesize and deliver data across disciplines?
• How do we weigh the balance between research and operations?
• How can we comply with new requirements for information management (for example, Survey Manual 502.8)?To help guide our discussion, we reproduced the USGS Integrated Decision Support System (pyramid) diagram (fig. 2)
presented and discussed by Kevin Gallagher during his plenary session. This pyramid diagram illustrates key components of existing USGS capacity (including research and development, observations and monitoring, modeling, integration, analy-sis and delivery—buttressed by communications) required to deliver higher level “branded” products, examples of which included “Famine Early Warning,” “Invasives Forecasting,” “Water Prediction,” and “Biothreat Network.”

Topical Sessions 25
Although the USGS conducts a broad variety of research, ranging from place-based assessments to paleoclimate or geologic reconstructions, the production and delivery of real-time information is demonstrably important to the USGS. For example, that the USGS home page features “Real-time Data” directly under the news banner emphasizes how the USGS is “providing real-time or near real-time data and information on current conditions and earth observations” (U.S. Geological Survey, 2018) and features links to more information about recent earthquakes, current water conditions, airborne sensors, volcanoes, and landslides. Similarly, there are a number of excellent operational examples that organize and deliver real-time or near real-time information.
• Coastwide Reference Monitoring System (https://lacoast.gov/crms2).
• Coastal Change Hazards Portal (https://marine.usgs.gov/coastalchangehazardsportal/).
• National Water Information System (https://waterdata.usgs.gov/nwis).
• National Phenology Network (https://www.usanpn.org/).
• Nonindigenous Aquatic Species information resource (https://nas.er.usgs.gov/).
• Graphing Water Information System (https://www.usgs.gov/news/usgs-releases-new-javascript-library-plotting-water-data-nation).
• Projects of the Earthquakes Hazards Program such as Did You Feel It? (https://earthquake.usgs.gov/data/dyfi/) and
• Tweet Earthquake Dispatch (https://earthquake.usgs.gov/earthquakes/ted/).Development and marketing of branded products by the USGS, using the Integrated Decision Support System, will
require enhanced capacities for production and delivery of real-time data and information, including a robust internal and external communications infrastructure. In addition, to produce such branded products at a spatial and temporal scale useful to science and society, data integration—particularly across disciplines—will be required.
Further, our success will depend on a strong awareness of—and a willingness to embrace both conceptually and organizationally—the “research to operations” continuum. The USGS must both conduct research to develop new under-standing, data, and information products, as well as commit to operationalizing those higher order data and information products (for example, through graphical user interfaces). Our organization excels on the research end of the continuum, but could be strengthened on the operations end of the continuum. This will indeed require a commitment to sustained provision of resources to develop, maintain, improve, and deliver operational products.
Alternatively, if we do not take on these challenges ourselves, we must be content to outsource the operational delivery of USGS data and data products to third parties, which may or may not appropriately acknowledge the value of USGS contribution to the operational product. This approach would require fewer resources, but there is the potential loss of an easily identifiable USGS brand and an eventual loss of relevance to society. This is particularly significant during a time of shrinking Federal budgets.
COMM
UNICATION
Delivery
Analysis
Modeling and Integration
Observations and Monitoring
Research and Development
USGS Integrated Decision Support System
Figure 2. The U.S. Geological Survey Integrated Decision Support System (pyramid) diagram presented and discussed by Kevin Gallagher during his plenary session.
26 U.S. Geological Survey Community for Data Integration 2017 Workshop Proceedings
Participants in this workshop, some of whom attended a similar workshop led by Jake Weltzin at the Innovation Center Workshop, held in Menlo Park, Calif., in December 2016, expressed interest in the potential development of a community of interest for real-time data. An email listserv might help foster communication among interested parties; create efficiencies through sharing of lessons learned; help remove roadblocks to information management and delivery; facilitate enterprise solutions, tools, and technologies; create opportunities for coordination or collaboration; support innovation; improve policy compliance; and serve as a nucleus for continued development of real-time integrated data and information in support of our goals for the Integrated Decision Support System. Further, this group could expand communication and collaboration through organized activities (for example, symposia, workshops, sessions, webinars) within the USGS and at scientific meetings and gatherings or with external partners such as other Department of the Interior Bureaus, the National Oceanic and Atmospheric Administration, or the National Aeronautics and Space Administration.
Over the longer term, the strengths of this community of interest, or practice, could be brought to bear support to the production and delivery of USGS-branded products. This is the vision of the Integrated Decision Support System. Other USGS strategic planning activities such as the Executive Leadership Team science and capacity planning activities, or those suggested by the Council of Senior Science Advisors workshop (Jenni and others, 2017), could also contribute to the aspirations of USGS-branded products in the Integrated Decision Support System.
For more information, see the full report at the workshop presentation page at https://my.usgs.gov/confluence/x/Np7OIQ.
Trusted Digital Repositories—What Are They and How Do You Become One?
Session led by John Faundeen (USGS Earth Resources Observation and Science Center)This was an interactive session to (1) inform the audience of the variety of certification options available, (2) detail the
U.S. Geological Survey (USGS) adopted choice, (3) explain the process to become certified, (4) share experiences with using the USGS approach, and (5) discuss where we think the trusted digital repositories process is headed. Audience interaction was encouraged throughout this session.
Fine-Tuning Guidelines for Revising Public U.S. Geological Survey Data
Session led by Fran Lightsom (USGS Woods Hole Coastal and Marine Science Center)The goal of the session was to include a broad range of U.S. Geological Survey (USGS) data experience in reviewing
the new Fundamental Science Practices Advisory Committee (FSPAC) guidelines for revising data releases as well as suggest needed clarifications or additional factors to consider. We looked together at the guidance, which is available on the Fundamental Science Practices website at https://www2.usgs.gov/fsp/data_versioning.asp. Generally the FSPAC Scientific Data Guidance Subcommittee has done a good job, although we identified some areas where improvement is possible.
Integrated science would presumably involve repurposing existing data, which would benefit from corrected data releases and clear documentation of these revisions. Currently, data releases are a relatively new requirement, and very few have been revised as of yet. Going forward, the guidance will be important to ensure the quality of USGS data and metadata.
Ideally, we would like the FSPAC guidance to address the wide variety of USGS research and data in a way that maintains quality and integrity without discouraging productivity. In the short term, the observations of the session are being communicated to the FSPAC subcommittee, where we have confidence they will be used to create a better guidance document. In the longer term, the Community for Data Integration might adopt a future role of reviewing sections of FSPAC data-release guidance at all of our meetings to assist FSPAC in keeping current with research and innovations in information science.

Topical Sessions 27
National Geospatial Data Development
Session led by John Brakebill Presentations by John Brakebill (USGS Maryland, Delaware, and the District of Columbia Water Science Center), Al Rea (USGS National Geospatial Program), Mike Wieczorek (USGS Maryland, Delaware, and the District of Columbia Water Science Center), and Roland Viger (USGS National Research Program)
The goals of the National Geospatial Data Development session were to (1) provide an overview of key geospatial data development and current needs, (2) describe integration applications, and (3) present community ideas (for example, how to share, communicate).
Throughout the U.S. Geological Survey (USGS) and other Federal agencies, many national-scale geospatial datasets are being created, developed, modified, and associated to hydrologic frameworks to suit multiple programs and projects in support of environmental assessments. This session discussed and described the following topics: key data being developed, scales and units, benefits and limitations, what some of the remaining needs are, what the key frameworks are, and how one finds out what is being compiled. Collaborative approaches with other agencies were addressed, including successes and failures. Mechanisms to allow for faster notification and awareness of development, updates, and access were also discussed. Critical hydrologic net-works, like the National Hydrography Dataset (and NHDPlus), were discussed as crucial frameworks for multiple applications.
National geospatial data development relates to enabling integrated science at the USGS because knowledge and access of geospatial data allows for additional data sharing and applications beyond the original intent of development. Knowledge prior to data development allows for an expanded scope and input for a variety of needs. Assigning key data to stable networks (for example, hydrologic networks) allows for integration. Finally, interactions with other Federal agencies are very critical.
Currently, some duplication of effort exists at the USGS with regard to national geospatial data development. There is an opportunity for support (technical, computer, systems) to be improved. The online Confluence wiki website and ScienceBase system are good steps forward. The current business model affects the ability to work across layers.
Ideally, there would be a community that produces standard operating procedures and serves as an outlet to post and communicate activities and needs. With respect to data, enterprise data would be identified, communicated, and practiced. There would be seamless integration across the Bureau and other Federal agencies.
A short-term step we can take to get to where we want to be is to improve cooperation with other Federal agencies such as the Natural Resources Conservation Service and the Environmental Protection Agency. Longer term steps would be to examine possible improvements to the USGS funding model and to support enterprise USGS data development, including getting some applications included in the Presidential budget proposal (that is, the “Green Book”).
Learn More about Cloud Hosting Solutions (CHS)
Session led by Harold House (USGS Office of the Director), Courtney Owens (USGS Office of Enterprise Information), and Jennifer Erxleben (USGS Cloud Hosting Solutions)
In this session, participants learned about Cloud Hosting Solutions (CHS), the secure cloud offering for U.S. Geological Survey science centers and mission areas. CHS is operated and maintained by the Office of Enterprise Information in cooperation and governance with the Department of the Interior. We provided a detailed overview of the CHS program, its strategic vision, fiscal year 2016 accomplishments, lessons learned, and current service offerings. We presented information on U.S. Geological Survey programs that are currently operating in the CHS cloud environment, and provided demonstrations on the CHS Sandbox, cluster computing (Alces Flight), and offsite backup (CloudBerry).

28 U.S. Geological Survey Community for Data Integration 2017 Workshop Proceedings
Working Group Meetings
Four working groups met during the workshop (listed alphabetically).
• Data Management Working Group
• Earth Science Themes Working Group
• Semantic Web Working Group
• Tech Stack Working Group
Data Management Working Group
Session led by Viv Hutchison (USGS Core Science Analytics, Synthesis, and Library) and Cassandra Ladino (USGS Eastern Geo-graphic Science Center)
The main goal of this session was to determine how the Data Management Working Group (DMWG) could best contribute to enabling integrated science. This included identifying specific challenges that we could tackle in the form of subteams within the DMWG and gathering ideas for the types of presentations in our monthly meetings that would be most helpful to U.S. Geological Survey data managers and other colleagues.
The DMWG is open to all those who are interested in advancing data-management best practices in the Bureau. This session was a chance for anyone interested in participating in the DMWG to meet face to face and discuss what we wanted to see the group accomplish next. Currently, the working group is a monthly forum where we share new tools and applications and highlight updates and Bureau progress in data management. We sponsor subteams that meet for a short period of time to tackle an aspect of data management in need of guidance or direction.
Discussion included the following topics.
• What challenges are we facing that we can make progress on through the working group?
• How can we best contribute to enabling integrated science?
• What small teams should we think about leading this year?
Participants brainstorm ideas at the Data Management Working Group breakout session. Photograph by Viv Hutchison.

Working Group Meetings 29
• What kinds of presentations or discussion topics would you like to see in DMWG?
• What ideas do you have to make the DMWG even more relevant and helpful in your daily job?In a brainstorming session, we considered the sentence “If ____ was easier, I could do my work in data management more
efficiently” in light of Science Data Lifecycle Model components and associated topics. Ideas for phrases that could complete the blank in the sentence were posted, and those that received the most support from the group are listed here by Science Data Lifecycle Model Component and associated topics:
• Plan
• accessing and searching data-management plans (DMP) between the centers
• developing more standardized DMPs (better defined plans with boilerplate language)
• developing templates with consistent fields
• achieving better communication of expectations to managers
• adding data support staff
• Acquire
• convincing scientists to use consistent data schemas
• Process
• moving large volumes of data
• Analyze
• aggregation of data
• Preserve
• moving and copying big data
• migrating data to new media
• Publish and Share
• integrating DMPs with the Information Products Delivery System (IPDS) and metadata systems so information is not retyped
• doing software release and review
• creating interactive websites
• getting scientists credit for data releases
• Metadata
• developing guidelines for review and training
• linking DMPs to metadata
• finding available metadata reviewers
• automating metadata creation
• communicating incentives for good metadata creation
• applying universally consistent vocabulary and keywords
• Quality
• finding better guidelines for review

30 U.S. Geological Survey Community for Data Integration 2017 Workshop Proceedings
• performing quality reviews
• using consistent definitions for quality
• Other
• change in culture
• educating managers
• getting recognition and acceptance of effort
• finding the right people to do the work (staffing, outsourcing, contracting, skill sets)
• hiring data-management support staff at agency level
• using ScienceBase
Earth Science Themes Working Group
Session led by Roland Viger (USGS National Research Program)The Earth Science Themes Working Group is an umbrella group to facilitate sharing of methods, data, software, and
conceptual models for more specific Earth-science themes. A main message from the Earth Science Themes Working Group breakout is that adapting one’s style of work and culture to be more open is key to advancing overall scientific progress. This is not necessarily hard, but it requires a somewhat conscious effort to change long-established patterns.The breakout included a series of talks focusing on the river corridor, looking to continue on with collaboration between the 3D Elevation Program and other projects, for example, ecological flows and drought. The session included the following:
• a talk by the Powell Center project co-director Martin Goldhaber;
• a presentation by Andrea Ostroff on the ecological flows initiative and drought;
• a presentation by Jason Stoker on leveraging 3D Elevation Program lidar data for extraction of features and landscape characterization, such as floodplain mapping and near-stream canopy-height and biomass estimation; and
• a presentation by Michael Wieczorek about the National Water-Quality Assessment on soils data and riparian-zone mapping from the U.S. Forest Service.
We discussed national datasets and their role in our science. There are lots of national datasets being produced, and we need to share our work more efficiently. There are national hydrological and hydrographical frameworks for organizing information (for example, other data types and observations). The community is needed to generate feedback and guidance from stakehold-ers. Several likely topics for national dataset creation were vegetation height and biomass near streams, manure, and culverts.
Although not present for the workshop, the Earth Science Themes Working Group includes the Bioinformatics Community of Practice, which is very active, and the Interagency Collaborative for Environmental Modeling and Monitoring (ICEMM), a Federal interagency group. The ICEMM is about 15 years old and has moved into the Community for Data Integration’s wiki space. It has its own governance and internal structure of working groups. We received lots of friendly feedback from them in preparing for the workshop and would like to develop relationships on this topic. It is possible they might have opinions on model archiving.
Semantic Web Working Group
Session led by Fran Lightsom (USGS Woods Hole Coastal and Marine Science Center)The Community for Data Integration (CDI) Semantic Web Working Group is an open and ongoing CDI working group that
explores semantic web technologies as possible methods for exposing U.S. Geological Survey data and information projects. Semantic web has important applications for “Enabling Integrated Science,” which is this year’s CDI workshop theme. In our breakout session, we introduced CDI members to the basics of semantic web and to the projects our working group has pursued.
Semantic web techniques are good for making connections among disparate data and for identifying the specific and subtle requirements of complex projects.

Working Group Meetings 31
Tech Stack Working Group
Session led by Rich Signell (USGS Woods Hole Coastal and Marine Science Center)The Community for Data Integration (CDI) Tech Stack Working Group is interested in tools and techniques that improve
data discoverability, interoperability, and access efficiency and workflow reproducibility. In this session, we invited speakers to lead discussions on the following topics of interest to our group:
Software Release Policy (Sky Bristol)—The instructional manual is being tested and will be refined as needed. We are working toward appropriate vetting and documentation, hopefully without too many roadblocks. Bureau approval for software is moving to the Center Director level. Provisional software release and use of GitHub, for example, is allowed with Center Director approval.
Dealing with Sub-Petabyte Data (Rich Signell and Jeff Falgout)—Dealing with large datasets is a pervasive problem, that results in many ad hoc local solutions and no way to meet the publication requirements. A shared remote solution is needed, with fast access for science. There is a developing paradigm of data-centric computing—where data remain in place and the computing resources are brought to the data. To be economically feasible, we need to provide multiple tiers of storage—from extremely high-performing storage such as Non-Volatile Memory Express to extremely high-capacity storage, such as Enterprise-level tape libraries. These tiers must be appropriate to the type of computational analysis performed. To make these tiers effective, the data must flow between tiers, enabling the data lifecycle workflow (Faundeen and others, 2013). There is a multiphase pilot project underway to address the challenges of large datasets. The first phase of the project enables users of the U.S. Geological Survey’s (USGS) high-performance computing environment, where a significant amount of data is analyzed and produced, to move between data, on demand, between tiers. The next phase is to integrate on-demand data movement with ScienceBase publishing. The final phase of the pilot will explore multi-site replication over wide area networks in a user-controlled, multi-tiered data-storage environment. We need to set up tools for analysis and visualization of data that work close to the data and will provide increased performance processing, reduce data-egress charges, and obviate the need for the user to have fast network connections. The goal is to allow users to effectively process, analyze, and visualize large datasets, for example, from their hotel room using only a web browser on a Chromebook.
Simulation Model Archiving (Roland Viger)—The motivation for this topic is that we need best practices for archiving models for different modeling communities; for example, the groundwater group at the USGS has developed an example approach. This topic could be discussed jointly across other CDI working groups, as it is relevant to the Data Management Working Group and possibly the Semantic Web Working Group. We are interested in finding others to participate here.
The Tech Stack Working Group plans to host a series of talks that will hopefully result in some consensus building. Possible presentation topics include
• the USGS Water Mission Area first generation protocols for model archiving, which have differing levels of sophisticationacross their disciplines; groundwater is in the lead and we would like to hear more about their motivations, concepts, andtechnology choices;
• experiments by the Core Science Systems Mission Area’s Biogeographic Characterization Branch on using the WorldWide Web Consortium provenance standards for describing data provenance;
• semantic meta-modeling; and
• a number of related academic groups that are addressing similar topics, particularly which is the best starting point forus—Earth System Documentation (https://earthsystemcog.org/projects/es-doc-models/) for models, based on the CommonInformation Model, and the Community Surface Dynamics Modeling System (CSDMS), among others.
A next step would be to develop lists or use cases around CDI member needs and USGS policy (Fundamental Science Practices, publications, and so forth). This is a big, complicated, common problem, and we definitely do not want to reinvent anything. There are already some folks working on or around this issue within the USGS, as well as beyond. Our purpose in pursuing this topic is to educate ourselves a bit, develop thinking about our specific needs, think about increasing the effect of modeling-based science produced by CDI members, and help guide policy and protocol development around this type of scientific information content.

32 U.S. Geological Survey Community for Data Integration 2017 Workshop Proceedings
Selected Birds of a Feather DiscussionA brief summary of a selected Birds of a Feather Discussion is provided here.
Data Science Community of Practice
Session led by Lindsay Carr (USGS Office of Water Information)Working knowledge of computer science and statistics (in other words, data science) is increasingly important for
dealing with 21st century data-intensive scientific workflows. One of the biggest barriers in developing efficient workflows can be knowing what appropriate tools, packages, or techniques exist. Channels of communication between users engaged in similar work can help, but can be difficult to establish because practitioners are scattered across projects and offices. This session solicited group input on (1) the scope of a data science community of practice, (2) identifying data science (or similar) groups that exist within and beyond the Bureau, (3) exploring opportunities for data science to enhance existing Bureau science, and (4) the potential ownership of such a group, including as a Community for Data Integration working group. The establishment of a data science group would promote sharing and exchange of data science practices across the Bureau, with the ultimate goal of increasing efficiency, reproducibility, and scalability of science throughout the U.S. Geological Survey.
In our discussion, we affirmed that we wanted a forum to have data-science-related discussions but not additional monthly meetings. We aimed for the “clusters” concept presented by Bruce Caron in one of the workshop keynotes.
The community of practice developed the following list of action items.• Create a U.S. Geological Survey best-practices GitHub repository (https://github.com/usgs/best-practices):
• use the Issues feature to ask questions, suggest potential projects, and opt out when conversation is not applicable and
• in the read-me file (data-science/README.md), collect resources, examples of data science, and contact information.
• Create a Community for Data Integration Confluence page pointing to the GitHub repository.
Open Lab
Metadata Reviewers Community of Practice
Session led by Fran Lightsom (USGS Woods Hole Coastal and Marine Science Center)The Metadata Reviewers Community of Practice explored new metadata tools together at the workshop Open Lab
(a meeting space at the workshop for those who wanted to meet and work on any topic).After a spirited discussion of the larger work citation and the best place in the metadata record for a citation of an
associated publication, we had three demonstrations: the new stand-alone version of Metadata Wizard (Colin Talbert), secondary validation of metadata records using the U.S. Geological Survey (USGS) Geospatial Metadata Validation Service at https://mrdata.usgs.gov/validation/ (Peter Schweitzer), and the Alaska Science Center metadata editor (Dennis Walworth). Additional notes are at https://my.usgs.gov/confluence/display/cdi/Meetings+of+the+Metadata+Reviewers+Community.
To the extent that integrated science requires integrating data, metadata will be essential in discovering and reusing the data.
Current metadata tools are insufficiently user-friendly, especially for some data types and research topics. New toolsare in the final stages of development and should be operational within a year.
Ideally, we want to move to a situation where we have the following: (1) a spectrum of metadata profiles to ensure quality and facilitate metadata creation for the wide range of USGS data, (2) web services for a wide range of controlled vocabularies to facilitate data discovery and metadata creation, and (3) a situation where we maintain a USGS collection of data dictionaries or data-dictionary items for incorporation into metadata records and use in designing data collection and facilitating data integration.
Short term (1–3 years) steps we can take to get to where we want to be are listed below.• Have a Metadata Reviewers Community of Practice session to experiment with mdEditor when it is ready (year 1).
• Encourage early adopters to help refine the new metadata tools (year 1).

Trainings 33
• Start offering ongoing interactive training for use of metadata tools and for metadata review.
• Use case analyses for metadata profiles.
• Use case analysis for a USGS collection of data-dictionary items.
• Reinvigorate the USGS Thesaurus team.Longer term (3–10 years) steps we can take to get to where we want to be are listed below.• Work toward USGS adoption of mdJSON as the internal USGS standard for metadata compliant with standards established
by the International Organization for Standards, with translation capabilities for interfacing with external systems that require Extensible Markup Language (XML). Steps would include development of a service for reusable snippets such as contact information or data-dictionary items and development of tools for metadata review.
Trainings
R Workshop for Beginners
Contacts: Lindsay Carr and Emily Read (both from USGS Office of Water Information)Format: full-day training session
Learn the basics of scientific computing in R, including how to• import data into R from local files or web sources,
• reformat and clean data to prepare for analysis,
• analyze and visualize data, and
• repeat and reproduce workflows.This course covered similar concepts to a full, three-day Introduction to R course but did not go as far in depth given the
time limitation.
Introduction to Advanced Scientific Computing
Contact: Janice Gordon (USGS Core Science Analytics, Synthesis, and Library)Format: half-day training session
This training session provided an introduction to advanced computing paradigms, including high-performance computing, high-throughput computing, parallelism, OpenMP, and Message Passing Interface (MPI) and provided scientific use cases for each type of technology. Hands-on labs taught participants how to access and run jobs on USGS in-house advanced comput-ing resources, such as the “Yeti” supercomputing cluster and the HTCondor high-throughput computing systems.
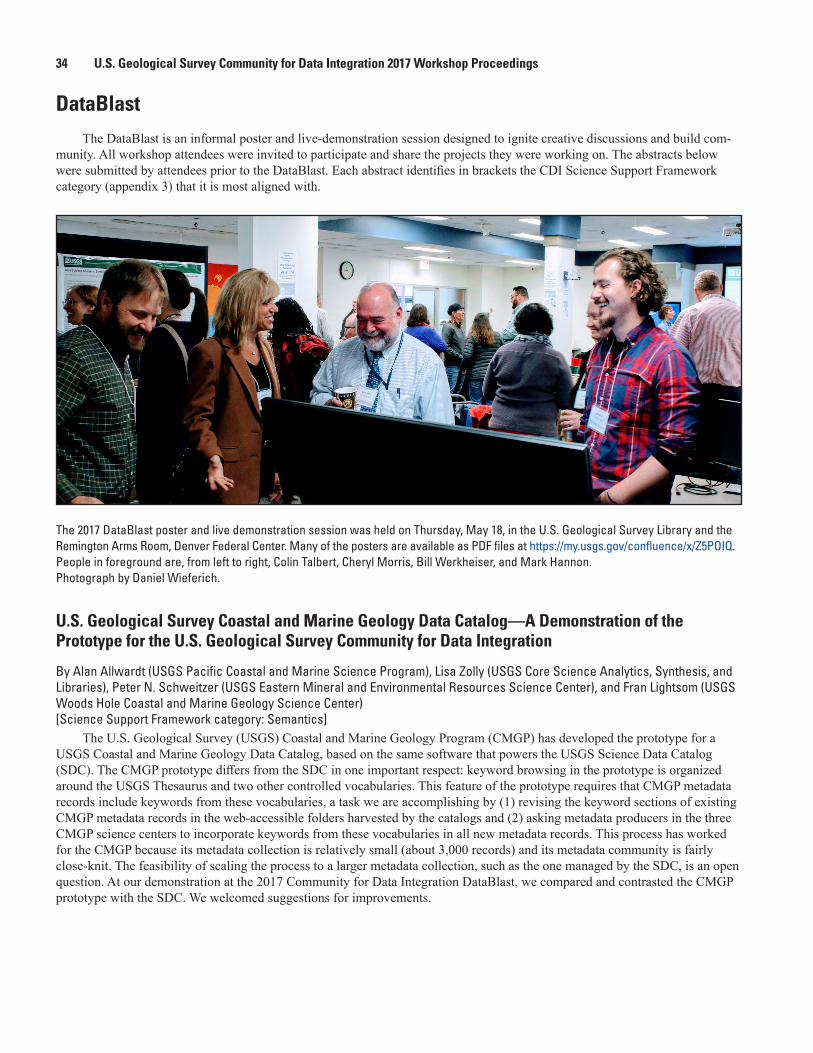
34 U.S. Geological Survey Community for Data Integration 2017 Workshop Proceedings
DataBlastThe DataBlast is an informal poster and live-demonstration session designed to ignite creative discussions and build com-
munity. All workshop attendees were invited to participate and share the projects they were working on. The abstracts below were submitted by attendees prior to the DataBlast. Each abstract identifies in brackets the CDI Science Support Framework category (appendix 3) that it is most aligned with.
The 2017 DataBlast poster and live demonstration session was held on Thursday, May 18, in the U.S. Geological Survey Library and the Remington Arms Room, Denver Federal Center. Many of the posters are available as PDF files at https://my.usgs.gov/confluence/x/Z5POIQ. People in foreground are, from left to right, Colin Talbert, Cheryl Morris, Bill Werkheiser, and Mark Hannon. Photograph by Daniel Wieferich.
U.S. Geological Survey Coastal and Marine Geology Data Catalog—A Demonstration of the Prototype for the U.S. Geological Survey Community for Data Integration
By Alan Allwardt (USGS Pacific Coastal and Marine Science Program), Lisa Zolly (USGS Core Science Analytics, Synthesis, and Libraries), Peter N. Schweitzer (USGS Eastern Mineral and Environmental Resources Science Center), and Fran Lightsom (USGS Woods Hole Coastal and Marine Geology Science Center) [Science Support Framework category: Semantics]
The U.S. Geological Survey (USGS) Coastal and Marine Geology Program (CMGP) has developed the prototype for a USGS Coastal and Marine Geology Data Catalog, based on the same software that powers the USGS Science Data Catalog (SDC). The CMGP prototype differs from the SDC in one important respect: keyword browsing in the prototype is organized around the USGS Thesaurus and two other controlled vocabularies. This feature of the prototype requires that CMGP metadata records include keywords from these vocabularies, a task we are accomplishing by (1) revising the keyword sections of existing CMGP metadata records in the web-accessible folders harvested by the catalogs and (2) asking metadata producers in the three CMGP science centers to incorporate keywords from these vocabularies in all new metadata records. This process has worked for the CMGP because its metadata collection is relatively small (about 3,000 records) and its metadata community is fairly close-knit. The feasibility of scaling the process to a larger metadata collection, such as the one managed by the SDC, is an open question. At our demonstration at the 2017 Community for Data Integration DataBlast, we compared and contrasted the CMGP prototype with the SDC. We welcomed suggestions for improvements.

DataBlast 35
Being Charlotte—Weaving Together Information Assets at the Great Lakes Science Center
By Tara Bell and Sofia Dabrowski (both from USGS Great Lakes Science Center) [Science Support Framework category: Knowledge Management]
With approximately 160 contract and Federal employees and 138 concurrent studies, the Great Lakes Science Center pro-duces a lot of information. Along with the 70–100 journal articles and reports we produce each year are a deluge of photographs, videos, books, archival materials, and (of course) data. Besides our current products, we have legacy products dating back to 1921. Presently, the catalogs for these products are distributed among ProCite databases and Excel spreadsheets. By cataloging these products in one place, we hope to create a system that has the following capabilities:
• answers annual data calls,
• allows us to analyze trends in research,
• manages media for communication purposes,
• establishes intellectual control over products,
• accommodates changes in formats,
• stores metadata for digital and physical products,
• contributes to the center’s publication review and award process,
• is easily searchable by and accessible to center staff, and
• links products to the study or center activity that created them.Not all of these information types are considered official records of the U.S. Geological Survey, but nonetheless they are an
important piece of our institutional history. This poster will specifically discuss the publications catalog within the broader context of our goal to move beyond a network of outdated, disparate tools into a comprehensive information-management system.
Automating the Use of Citizen Scientists’ Biodiversity Surveys in iNaturalist to Facilitate Early Detection of Species’ Responses to Climate Change
By Erin Boydston (USGS Western Ecological Research Center), Jenny Briggs (USGS Geosciences and Environmental Change Science Center), Vijay Barve (Florida Museum of Natural History), Lena Lee (National Park Service Mediterranean Coast Network Inventory and Monitoring Program), and Toni Lyn Morelli (USGS Northeast Climate Science Center) [Science Support Framework category: Science Data Lifecycle—Processing]
With changing climate and land use, plants and animals may respond by moving into new areas. Early detection of these shifts is a challenge for resource managers, but citizen scientists and new technology can help. In 2016, the National Park Ser-vice (NPS) hosted BioBlitz surveys in which visitors and staff used the iNaturalist smartphone application (app) to document species, yielding over 100,000 observations in a spatially explicit database of verifiable records. For a subset of participating parks, we examined what percent of biodiversity was recorded, how percentages varied across taxa and parks, and if new species were documented. We identified several species not on current NPS species lists, indicating the potential of iNaturalist data for monitoring and conserving biodiversity. Our Community for Data Integration project will build on this pilot effort to leverage existing capabilities, code, resources, and diverse collaborative expertise (U.S. Geological Survey ecologists, NPS resource stewards, university biologists, computer scientists) to translate iNaturalist information into actionable knowledge across parks. We will automate the integration and cross-referencing of the NPS and iNaturalist databases and test the app with park partners. The resulting tools will support early detection of native and non-native species’ range shifts, giving Department of the Interior agencies a head start in managing threats to biodiversity.

36 U.S. Geological Survey Community for Data Integration 2017 Workshop Proceedings
Alaska Data Integration Working Group Metadata Toolkit—International Organization for Standards Metadata Editor
By Josh Bradley (Arctic Landscape Conservation Cooperative), Stan Smith (Arctic Landscape Conservation Cooperative), and Dennis Walworth (USGS Alaska Integrated Science Center) [Science Support Framework category: Applications]
The mdEditor is an end-user web application designed for authoring International Organization for Standards (ISO)-compliant metadata. mdEditor is a part of an integrated suite of applications for authoring and editing metadata called the Metadata Toolkit. The toolkit is being developed by the Alaska Data Integration working group as an open-source project. The intent of the toolkit is to promote the creation and use of ISO-compliant metadata by lowering the level of technical expertise required to produce archival-quality metadata.
At the heart of the toolkit is mdJSON, an intermediate metadata format based on JavaScript Object Notation. mdJSON is capable of capturing 95 percent of ISO 19115–1 and 100 percent of Federal Geographic Data Committee content standard for digital geospatial metadata-compliant content.
The mdEditor application is used to author metadata content for projects, data products, collections, and more in the mdJSON format. The editor interfaces with mdTranslator to produce metadata in a supported output format, such as ISO 19115–2 Extensible Markup Language (XML).
This poster session provided an opportunity to learn about the toolkit and try out a beta version of the mdEditor application.
Team Metadata Creation for Longitudinal Data—Case Study with the Great Lake Science Center Research Vessel Catch Database
By Sofia Dabrowski (USGS Great Lakes Science Center) [Science Support Framework category: Data Management]
The simple question facing the Great Lakes Science Center (GLSC) was, how can we publish the entirety of our Research Vessel Catch (RVCAT) database? The question became more complex as we considered the time span of data collection, varying history of data collection, different needs of each geographic location, and changes in methodology over space and time. How do we engage users to write meaningful metadata and curate this data?
Many years and miles both connect and separate the numerous hands that have added data to the GLSC’s RVCAT. The RVCAT contains data from multiple operations conducted on all of the Great Lakes from 1958 to present (with some 1930s data in the works), which represents a total of 36 different vessels used over time. Operations data represented in RVCAT are collected and used in connection with numerous research projects, reports to various organizations on Great Lakes’ ecosystem health, and for longitudinal data about environmental conditions and species inhabiting the Great Lakes.
The GLSC information services team has taken on the task of writing metadata for the dataset and coordinating its release with multiple primary investigators. This poster described that process and illustrated how a simple question can have complex answers.
Flocks of a Feather Dock Together—Using Docker and HTCondor to Link High-Throughput Computing Across the U.S. Geological Survey
By Richard Erickson (USGS Upper Midwest Environmental Sciences Center), Sunnie McCalla (USGS Upper Midwest Environmental Sciences Center), and Michael Fienen (USGS Wisconsin Water Science Center) [Science Support Framework category: Communities of Practice]
U.S. Geological Survey (USGS) scientists often face computationally intensive tasks. Examples include calibrating groundwater models, monitoring invasive species using genetic methods, and processing geospatial data. Several USGS sci-ence centers have developed high-throughput computing facilities that address these needs, and most of these facilities use HTCondor to run their computational pools. Our project will help science centers by documenting how to connect HTCondor pools by a process called “flocking” within the USGS. Additionally, we will help USGS scientists use HTCondor by develop-ing tutorials on how to sandbox code using Docker within the USGS for use with high-throughput computing. To date, we have posted our tutorials on the Community for Data Integration Bitbucket page (https://my.usgs.gov/bitbucket/projects/CDI/repos/hunting_invasive_species_with_htcondor/) and have flocked three USGS science centers.
DataBlast 37
U.S. Geological Survey Data at Risk—Expanding Legacy Data Inventory and Preservation Strategies
By Cristiana Falvo (USGS Fort Collins Science Center) [Science Support Framework category: Science Data Lifecycle—Preservation]
As one of the largest and oldest science organizations in the world, the U.S. Geological Survey (USGS) has produced more than a century of Earth-science data that is currently unavailable to the greater scientific community because of inaccessible or obsolete media, formats, or technology. These innumerable legacy data sets would be invaluable for extending our historical understanding of the world’s natural resources, landscapes, and hazards if preserved and released. The challenge of legacy data preservation is not the preservation work itself but rather the act of finding the needles in the monstrous haystack. Choosing the “needles,” or the highest priority datasets, requires methods and tools to evaluate and prioritize legacy data.
The 2016 Data at Risk project used the Legacy Data Inventory Reporting System application to implement methods for evaluating and prioritizing USGS legacy datasets. By scoring datasets based on their geospatial and temporal extents, loss and damage risk factors, and relevance to current USGS mission areas and programs, users are able to easily identify which legacy data should be preserved and released. These methods were used to select and preserve five USGS legacy datasets in FY16 (see more details at https://my.usgs.gov/confluence/x/xovHI). Those data releases were used as case studies to investigate the time and resources required to preserve various types of legacy data. The 2017 Data at Risk project will build on these efforts by refining Legacy Data Inventory Reporting System prioritization parameters, expanding USGS legacy data inventory, and con-tinuing to preserve legacy data with greatest potential effects to society.
Trusted Digital Repositories—What Are They and How Do You Become One?
By John Faundeen (USGS Earth Resources Observation and Science Center), Clara Brown (USGS Core Science Systems), and Keith Kirk (USGS Office of Science Quality and Integrity) [Science Support Framework category: Science Data Lifecycle—Preservation]
Trusted digital repositories ensure long-term preservation of and access to digital assets. To address multiple Federal man-dates, the U.S. Geological Survey aspires to include the trusted digital repositories concept as part of its adoption of life-cycle management practices for Bureau science records. This poster details the Fundamental Science Practices Advisory Committee Data Preservation Sub-Committee’s review process, lists the specific topical areas to be addressed, details the team members involved, and includes the sources reviewed that led to this U.S. Geological Survey process.
Data-First Architecture
By Jeremy Fee (USGS Geologic Hazards Science Center) [Science Support Framework category: Web Services]
Data-first architectures separate data access and presentation using well-defined interfaces and formats. Loose coupling between data access and presentation allows data services and applications to be developed, maintained, and scaled indepen-dently. A separate data service also ensures data can be accessed programmatically, rather than requiring human interaction, making it easier to use the data in new ways in the future. Separate data services also provide access to the data sooner, before additional application development is complete. Finally, a data service may be all that is required to make new data available to existing applications.
The Geologic Hazards Science Center hazards development team uses a data-first approach when developing applications for the U.S. Geological Survey Earthquake Hazards, Geomagnetism, and Landslide Hazards Programs. The earthquake event web service, map and list, and event page applications are example components of a data-first architecture.
Crustal Geophysics and Geochemistry Science Center and Central Mineral and Environmental Resources Science Center Field Collection with ArcGIS Online Tools—Collector and Survey123
By Maggie Goldman and Michaela Johnson (both from USGS Crustal Geophysics and Geochemistry Science Center) [Science Support Framework category: Science Data Lifecycle—Acquisition]
As part of data-management responsibilities, migrating scientists from paper to tablet collection in the field will aid in managing data throughout the U.S. Geological Survey data life cycle and tailoring it to the needs of the science center. Mobile data collection allows for standardized data collection; picklists; advance preparation for field work; no paper maps; no transcription errors; and the ability to keep photos, location, and field notes together. We present examples of mobile

38 U.S. Geological Survey Community for Data Integration 2017 Workshop Proceedings
geographic information system (GIS) data collection using Esri’s Collector for ArcGIS and Survey123 for ArcGIS in recon-naissance surveys, magnetotelluric surveys, and geochemical sample collection in the Crustal Geophysics and Geochemistry Science Center and Central Mineral and Environmental Resources Science Center projects. Our experience demonstrates that through successive testing with incorporation of feedback from scientists, these applications can be successfully integrated into field operations. ArcGIS mobile applications can be used on multiple platforms (Android, Windows, iOS) to streamline data collection, analysis, and storage.
Software Release Guidelines
By Michelle Guy, Eric Martinez, and Lynda Lastowka (all from USGS Geologic Hazards Science Center) [Science Support Framework category: Science Data Lifecycle—Publishing and Sharing]
At the U.S. Geological Survey (USGS), software often supports our science and data. Just as the science and data are reviewed and made publicly available, our software should be as well. In October 2016, the USGS issued an instructional memorandum on software releases. Although the instructional memorandum is an interim document and subject to change, it outlines some best practices that can be described in an example workflow of a software release. Software spans a wide spectrum of applications and environments as represented in the Community for Data Integration’s Computational Tools and Services element. Because of such diversity, each project may need special or additional considerations when going through a release process to publish software. However, in general, software should be well documented, able to cite licenses and depen-dencies, well tested, version controlled, reviewed, and assigned a Digital Object Identifier (DOI). The release process is intended to ensure the quality and integrity of the software the USGS produces.
Presenting Complex Analytical Datasets to the Public with Accessible Cloud-Based Visualizations
By Kevin Henry, Jeanne Jones, Nathan Wood, Peter Ng, Jeff Peters, and Jamie Jones, (all from USGS Western Geographic Science Center) [Science Support Framework category: Applications]
Prior U.S. Geological Survey research on vulnerability to natural hazards has resulted in a large amount of analytical geospatial data, which provides actionable information for developing risk-reduction efforts that can save lives or reduce dam-ages from natural hazards. However, these data are not easily accessible by internal or external sources and frequently requires presentation within the context of other data and information for useful interpretation. To address this, browser-based applica-tions can be created to share information in an illustrative manner. Various technologies exist to visualize data in widely accessi-ble formats through a web browser, yet their capacity to display the large analytical datasets from vulnerability-assessment projects is unknown. We present two separate projects that involved the visualization of natural hazard exposure information in web-mapping technologies. The first project uses a cloud-based server stack combined with vector tiles to present analytical information for 9 indicators across 36 sea-level rise scenarios. The second project presents a lightweight application using ScienceBase as a data host to present geospatial data in the Cesium three-dimensional viewer. Affordances and constraints of each application approach were discovered and can be useful to inform future projects that aim to present complex geospatial analytical information to a wide audience.
Improving the Data Management Training Clearinghouse
By Sophie Hou (National Center for Atmospheric Research) and Nancy Hoebelheinrich (Knowledge Motifs, LLC) [Science Support Framework category: Applications]
The Data Management Training Clearinghouse was developed with seed money received in 2016 from the U.S. Geological Survey’s Community for Data Integration. The implementation phase of the collaboratively developed clearinghouse allowed the clearinghouse to become operational and ready for people to search for, browse, and submit learning resources related to research data management. Although the clearinghouse team was able to complete some informal usability testing of the clear-inghouse’s interface during the initial six months of its funding, the team aims to improve and enhance the ease of use for all of the clearinghouse functions. At this session, the clearinghouse team provided a brief introduction to the clearinghouse’s current design and implementation and invited the session attendees to try out several key functions of the clearinghouse in order to provide feedback and suggest priorities for its future development.

DataBlast 39
ScienceBase as a Platform for Data Release
By Drew A. Ignizio, Tamar Norkin, Michelle Y. Chang, Madison L. Langseth, and Vivian B. Hutchison (all from USGS Core Science Analytics, Synthesis, and Libraries) [Science Support Framework category: Data Management]
Originally developed as a catalog and collaborative data-management platform, ScienceBase (www.sciencebase.gov) is being leveraged to serve as a robust data-hosting solution for U.S. Geological Survey (USGS) scientists. With the goal of main-taining persistent access to formal data products and supporting a management approach for stable data citation, the ScienceBase data-release team was established in 2015 to help ensure quality, consistency, and the meaningful organization of USGS data in ScienceBase through a standardized workflow and best practices.
The ScienceBase data release workflow (https://www.sciencebase.gov/about/content/data-release) provides a clear, step-by-step path for scientists to publish citable USGS data products in adherence with the requirements of the USGS data-release policies. USGS personnel can log in to ScienceBase to add content and have the ability to manage access to resources and data while finalizing a data release. The ScienceBase data-release team assists authors with steps such as the creation of new landing pages and obtaining Digital Object Identifiers (DOIs). The team also provides guidance on policy considerations, open file formats, best practices for metadata, and strategies for organizing content in ScienceBase in a meaningful, logical way. As part of their process, the team lastly runs a quality-control check on ScienceBase data-release pages before making them public.
ScienceBase has recently built out new features to support data release, including adding in the ability to send the metadata records associated with data-release products directly from ScienceBase to the USGS Science Data Catalog (https://data.usgs.gov), temporary access links to facilitate review, and metrics to allow data authors to track site visits and file downloads. There is also ongoing work to automate the process of creating new landing pages, as well as planned updates for the user interface to help provide a more efficient, intuitive interaction with the system.
By facilitating data publication and employing a dedicated team to help USGS scientists publish their data, ScienceBase is helping to meet data-management challenges and ensure that reliable USGS data are accessible to and reusable by the public.
An Information Ecosystem to Meet the Data-Management Requirements of the Long-Term Agrocecosystem Research Network
By Nicole E. Kaplan, Gerardo A. Armendariz, Dan K. Arthur, Jennifer Carter, Justin D. Derner, Philip Heilman, Peter J.A. Kleinman, Pat Nash, E. John Sadler, and Bruce Vandenberg (all from USDA Agricultural Research Service) [Science Support Framework category: Data Management]
The U.S. Department of Agriculture’s Long-Term Agroecosystem Research (LTAR) Network consists of 18 locations across the continental United States and comprises sites supported by government agencies, universities, and nongovernment organizations. The Network’s research on the sustainability of agricultural production and associated provision of ecosystem services relies upon historical data and insights, as well as on new findings from network-wide common experiments.
Traditionally, researchers at LTAR sites have managed data within their own local systems, most without a systematic approach to enabling data and information sharing. However, LTAR scientists need timely access to various data in useable formats to conduct cross-site analysis and perform simulation modelling. It is therefore critical to implement interoperability of data and systems for efficient analyses of complex questions within and across spatio-temporal scales.
As the LTAR Network designs and develops its data-management systems, an LTAR “Information Ecosystem” (Nardi and O’Day, 1999) is envisioned to enable effective communication and collaboration, data-sharing policies, standardization of exchange formats for data and metadata, integration of various types of data, and quality assurance and quality control. We present how LTAR sites, emerging centers for data management, such as the National Agricultural Library; the Center for Agricultural Resources Research; Sustaining the Earth’s Watersheds, Agricultural Research Data System (STEWARDS); Greenhouse gas Reduction through Agricultural Carbon Enhancement Network (GRACEnet); and the new National Wind Erosion Research Network, are identifying existing capacity that can be expanded to meet data-management requirements for LTAR.
U.S. Geological Survey StreamStats—Hydrologic and Geospatial Data Integrated to Support Water Science and Management
By Katharine Kolb (USGS South Atlantic Water Science Center) [Science Support Framework category: Applications]
StreamStats (http://streamstats.usgs.gov) is a U.S. Geological Survey web-service-based geographic information services (GIS) application that provides information used by engineers, hydrologists, managers, planners, and others to make informed decisions on water-related activities. It integrates multiple datasets, such as the National Hydrography Dataset, the Watershed

40 U.S. Geological Survey Community for Data Integration 2017 Workshop Proceedings
Boundary Dataset, and the 3D Elevation Program, to allow users to delineate a watershed for a stream point of interest. The principal benefit of StreamStats is that the delineation process that used to take hours now can be accomplished in a matter of minutes and is replicable between users. StreamStats users can also calculate flow statistics for the watershed of interest and compute basin characteristics such as National Land Cover Dataset land use and land cover values and average precipitation. Future enhancements will include network navigation tools to trace up and downstream on the National Hydrography Dataset flowlines, as well as time of travel.
The Coastal and Marine Ecological Classification Standard, a Common Language That Facilitates Integrating Data About Marine Ecosystems
By Fran Lightsom (USGS Woods Hole Coastal and Marine Science Center) [Science Support Framework category: Semantics]
The Coastal and Marine Ecological Classification Standard (CMECS) is a Federal Geographic Data Committee standard for use in federally funded research. In it, the geological, physical, biological, and chemical components of ecosystems are classified separately. If used consistently, CMECS data can be integrated to compare sites, identify change, or assemble regional assessments.
The CMECS works for the whole ocean, from the coastline’s intertidal zone to the deep ocean, even up river channels to the limit of tidal influence. CMECS data are considered a snapshot in time, explicitly including ephemeral habitats and features. The standard provides a language for describing 6 aspects of the ecosystem:
1. biogeographic setting—Ecoregions defined by climate, geology, and evolutionary history;
2. aquatic setting—Zones defined by salinity, coastal proximity, and tidal regime;
3. water-column component—Structure and characteristics of the water column;
4. geoform component—Geomorphic structural character of the coast or seafloor;
5. substrate component—Character and composition of the surface and near-surface of the solid Earth; and
6. biotic component—Assemblages of living organisms.
Terms defined in the CMECS can be used as metadata keywords, the distinctions expressed by the CMECS can be used in data dictionaries and map legends, or crosswalks to CMECS categories can provide for data that is measured in more precise units.
Fundamental Science Practice Advisory Committee Scientific Data Guidance Subcommittee
By Fran Lightsom (USGS Woods Hole Coastal and Marine Science Center), Viv Hutchinson (USGS Core Science Analytics, Syn-thesis, and Libraries), and Keith Kirk (USGS Office of Science Quality and Integrity) [Science Support Framework category: Policy and Guidance]
The new (formed March 17, 2017) Fundamental Science Practices Advisory Committee Scientific Data Guidance Subcommittee concentrates broadly on the development and revision of U.S. Geological Survey agencywide policies related to scientific data and develops guidance materials associated with these policies.
The Benefits of Microservice Architectures
By Eric Martinez (USGS Geologic Hazards Science Center) [Science Support Framework category: Web Services]
A microservice architecture decomposes the traditional monolithic web service into several component, single-purpose web services, loosely coupled together in order to achieve the same result. In doing so, multiple benefits are realized: development is accelerated, maintenance is simplified, and operations are necessarily fully automated. Additionally, the architecture scales more efficiently both vertically and horizontally in order to achieve an appropriately sized solution in all cases.

DataBlast 41
A Technique for Converting Time-Series Network Common Data Form (NetCDF) Files to a Different Convention and Two Options for Discovery and Display
By Ellyn Montgomery (USGS Woods Hole Coastal and Marine Science Center) [Science Support Framework category: Applications]
U.S. Geological Survey Coastal and Marine Geology Program oceanographic time-series data are released as Equatorial Pacific Information Collection (EPIC)-compliant Network Common Data Form (NetCDF) files. In the last decade, climate and forecast (CF) convention has supplanted the EPIC convention. To enhance usability or our data holdings, we worked with Axiom Data Science, LLC and the U.S. Geological Survey Center for Integrated Data Analytics to develop open-source Python software on GitHub that converts EPIC-compliant files to conform to the CF convention. Since we had consistently used the same dimension structure and EPIC variable names, the necessary transformations were straightforward. After conversion, the CF-compliant data were harvested by the Coastal and Marine Geology Program Oceanographic Model and Data Portal and now are available for browsing and display at http://cmgdata.usgsportals.net/#module-metadata/590b5a22-b61e-11e4-b2db-00265529168c/6878f136-b61e-11e4-a8f5-00265529168c.
Similar to the portal, the National Oceanic and Atmospheric Administration’s Earth Research Division Data Access Program (ERDDAP) (https://coastwatch.pfeg.noaa.gov/erddap/index.html) provides web-based data discovery and display. In addition, ERDDAP has the amazingly useful capacity to read a wide range of data formats, then output the data in a different format or convention.
Web Map Application for a Historical Geologic Field Photo Collection
By Sarah Nagorsen (USGS Science Publishing Network), Jason Sherba (USGS Western Geographic Science Center), Chris-topher Soulard (USGS Western Geographic Science Center), and Drew Ignizio (USGS Core Science Analysis, Synthesis, and Libraries) [Science Support Framework category: Science Data Lifecycle—Publishing and Sharing]
The quantity and quality of digital, geotagged field photos is increasing as more U.S. Geological Survey (USGS) scientists use geographic information systems for geologic mapping and field studies. However, many field photos remain undocumented, or unpublished, because traditional USGS information products cannot display large numbers of photos in a spatial context. Funds from the USGS Community for Data Integration will support efforts to (1) repurpose an existing photo map application (Land Cover Trends Field Photo Map) to fit 1,500 historical (1967–2010) Grand Canyon field photos that were collected by George Billingsley during 43 years of geologic mapping and (2) produce open-source tools that will allow users to build and publish their own photo map applications. We will accomplish these objectives by developing JavaScript and Python tools that will import metadata into field photos of the Grand Canyon, upload the field photos to ScienceBase, and then pull these field photos and their metadata from ScienceBase for display in an interactive online map. The outcomes of this project will improve access to a USGS Grand Canyon field photo collection and will provide a replicable process for building and publishing a photo mapping application as a USGS general information product.
An Enterprise-Level Problem—Big Data, Small Science Staff
By Shad O’Neel (USGS Alaska Science Center), Emily Baker (USGS Alaska Science Center), Anthony Arendt (University of Wash-ington), and Landung (Don) Setiawan (University of Washington) [Science Support Framework category: Data Management]
Advances in data-driven Earth science must span large spatial and temporal scales and administrative and political boundaries. Generating high-quality science from such datasets requires reproducible, transparent workflows, but this is difficult to achieve with existing data-management practices, especially in small research groups with limited resources. Structured, automated approaches to data and metadata management are key to research efficiency and productivity.
Here, we show progress on a concentrated effort to implement a cloud-based, data and metadata management framework within an agency-academic working group. Our framework is built around several independent science efforts, which inherently require flexibility and a generalized approach. Using relational databases accessed using object-relational mapping techniques and simple input spreadsheets of metadata with each additional dataset uploaded, we are able to automate generation of Federal Geographic Data Commission-compliant Extensible Markup Language (XML) metadata. Future iterations will use the object-relational mapping implicit in Django web framework, thus allowing management of the relational database to occur fully within a Python-based open-source environment. Collaboration is currently occurring on GitHub at https://github.com/ehbaker/ice2O.
42 U.S. Geological Survey Community for Data Integration 2017 Workshop Proceedings
Visualizing Community Exposure and Evacuation Potential to Tsunami Hazards Using an Interactive Tableau Dashboard
By Jeff Peters, Kevin Henry, and Nathan Wood (all from USGS Western Geographic Science Center) [Science Support Framework category: Science Data Lifecycle—Publishing and Sharing]
U.S. Geological Survey (USGS) research on community exposure and evacuation potential to natural hazards is being used for risk-reduction planning at all levels of government across the United States. USGS researchers currently disseminate this work through published reports and journal articles that contain static maps, figures, and tables. As these projects grow in scope, with many communities and multiple hazard zones, static graphics become difficult to create, publish, and interpret. Interactive graphics would allow users to more easily visualize multidimensional data and would allow partner agencies to tailor the content, form, and appearance of a vulnerability analysis to best suit their specific planning needs. We will create a new workflow for disseminating hazard-exposure data using third-party software (Tableau) technologies to provide interactive interpretation of results through an online dashboard. To prototype this approach, we will use results from a case study of community exposure and pedestrian evacuation for tsunami hazards on the island of Oʻahu, Hawaii. Results of this project will directly benefit State and county emergency managers in Hawaii and lay the foundation for a new way to serve USGS partners in communicating community vulnerability to hazards.
Developing Application Programming Interfaces to Support Enterprise-Level Monitoring Using Existing Tools
By Brian Reichert (USGS Fort Collins Science Center), Jen Bayer (USGS Pacific Northwest Aquatic Monitoring Partnership), Rebecca Scully (USGS Pacific Northwest Aquatic Monitoring Partnership), Jake Weltzin (USGS National Phenology Network), and Patricia Stevens (USGS Fort Collins Science Center) [Science Support Framework category: Science Data Lifecycle—Publishing and Sharing]
In this age of rapidly developing technology, scientific information is constantly being gathered across large spatial scales, yet our ability to coordinate large-scale monitoring efforts and to share knowledge depends on further development of tools that leverage and integrate multiple sources of data.
North American bats are experiencing unparalleled population declines. The North American Bat Monitoring Program (NABat), a multinational, multiagency coordinated bat-monitoring program, was developed to better understand the status and trends of North American bats. Similar to other large-scale monitoring programs, the ultimate success of NABat relies on a unified web-based system to help ensure data are collected and managed in a consistent manner. The proposed project will advance current efforts to better share documentation and design of data-collection efforts that help organize, curate, and facilitate access to NABat data. NABat recognized the benefits of using a suite of web tools at Monitoring Resources (https://www.monitoringresources.org), which was developed to support sharing of documentation and design of monitoring. This project will expand on the current capacity of Monitoring Resources to enable support of NABat; however, these additions to Monitoring Resources will be extensible and replicable and therefore will play a critical role in the implementation of other large-scale monitoring programs in the future.
An Interactive Web-Based Application for Earthquake-Triggered Ground-Failure Inventories
By Robert Schmitt (USGS Geologic Hazards Science Center), Kate Allstadt (USGS Geologic Hazards Science Center), Eric Thompson (USGS Geologic Hazards Science Center), Anna Nowicki Jessee (Indiana University Bloomington, Department of Geological Sciences), Hakan Tanyas (Faculty of Geo-Information Science and Earth Observation, University of Twente), Eric Thompson (USGS Geologic Hazards Science Center), and Jing Zhu (Tufts University) [Science Support Framework category: Applications]
Ground-failure inventories are often created after major earthquakes and are a key research tool that can be used to develop, train, and test hazard models. However, pulling together the inventory datasets needed for research requires significant effort because there is no centralized database and many inventories have not been made openly available. To eliminate redundant efforts among scientists who study seismically triggered landsliding and liquefaction, and to encourage an attitude shift toward open-data in this community, our goal is to make inventories of earthquake-triggered ground-failures openly available and easily accessible. To accomplish this goal, we have created a ScienceBase community and are developing an interactive web application. To support this effort, we have formed a working group of researchers who have created inventories and given permission to share their inventories openly with the community. Currently, we have accumulated 41 inventories and have started to build the ScienceBase database and web application. The core of the database will be the ScienceBase community web page, where data will be available in consistent formats with complete metadata. Eventually, this database will be tied to an interactive, searchable Esri ArcGIS Online web application that will allow users to easily browse, interact with, and download the available datasets.

DataBlast 43
Secondary Validation of Geospatial Metadata
By Peter N. Schweitzer (USGS Eastern Mineral and Environmental Resources Science Center) [Science Support Framework category: Data Management]
The formal structure of geospatial metadata allows metadata records to be evaluated to determine how well they conform to the syntactical and semantic rules set forth in a standard. However, minimal conformance to a standard cannot ensure that the metadata will make the data easier to find, understand, and use. The effectiveness of a metadata record also is affected by characteristics that are not specified in the standard. Word choice and clarity of writing must be assessed by a human reviewer, but other features can be evaluated automatically using software procedures, a secondary validation process. Secondary validation checks network links and the terms attributed to specific controlled vocabularies. Controlled vocabularies certainly can be used for keywords but also may improve the consistency of other metadata fields such as data formats and publication series names. In addition, secondary validation may re-express sections of the metadata in useful ways, such as rendering the data dictionary as a table or as a thesaurus and replacing noncontrolled category keywords with terms from controlled vocabularies to help software carry out further processing of the metadata. Secondary validation is available in the online Geospatial Metadata Validation Service.
How Can Cloud Hosting Solutions Help You?
By Kimberly Scott (USGS Director’s Office), Nancy Hornewer (USGS Arizona Water Science Center), Jennifer Erxleben (USGS Cloud Hosting Solutions), Courtney Owens (USGS Office of Enterprise Information), and Harold House (USGS Office of the Director) [Science Support Framework category: Science Project Support]
In this session, participants learned about Cloud Hosting Solutions (CHS), the secure cloud offering for U.S. Geological Survey (USGS) science centers and mission areas. The presentations covered an overview of the CHS program, its strategic vision, and its current (and brand new) service offerings. Participants also learned about USGS programs that are currently operating in the CHS cloud environment.
A Framework for Managing, Sharing, and Visualizing Land-Use Scenario Data
By Jason T. Sherba and Benjamin M. Sleeter (both from USGS Western Geographic Science Center) [Science Support Framework category: Applications]
The adoption of land-change simulation models such as the Land-Use and Carbon Scenario Simulator (LUCAS) has led to the rapid development of multidimensional land-use-change datasets. These datasets are often distributed as large tabular and spatial files in formats that may not be ideal for interacting with and sharing data. Land-use researchers want to quickly compare land-use data over multiple scenarios, spatial and temporal scales, and model iterations. They also need tools for sharing land-use datasets with the public. We developed a framework for managing, sharing, and visualizing land-use-scenario datasets. This builds on an existing scenario-management framework called SyncroSim. SyncroSim relies on a database structure and naming convention to accommodate any land-use-scenario dataset within a SQLite database. We built three tools to improve accessibility to, and interaction with, this database: (1) a Python-based application programming interface to add data and query data within the Syncro-Sim database, (2) a Django-based setup console for connecting to a database and deploying a Representational State Transfer applica-tion programming interface, and (3) a web application for visualizing both tabular and spatially explicit land-use-scenario data. Together, these tools provide a workflow for efficient management, distribution, and visualization of land-use-scenario datasets.
Dynamic Workflows to Advance Data Interoperability
By Rich Signell (USGS Woods Hole Coastal and Marine Science Center) [Science Support Framework category: Science Data Lifecycle—Processing]
The growth of catalog services like Open Geospatial Consortium Catalog Service for the Web (CSW) and OpenSearch are enabling dynamic workflows that exercise the full stack of interoperability issues: search, access, and use. With these workflows, queries are constructed based on bounding box, time extent, and type of service desired (Web Mapping Services, Open-source Project for a Network Data Access Protocol [OPeNDAP], Esri REST [Representational State Transfer]), and data is then extracted from the service endpoints in the discovered records. There are a lot of moving parts to make these workflows function correctly, but when we fix a problem in a specific workflow, there are usually broad benefits. Thus, dynamic workflows offer a means to make tangible progress in a complex environment. We have developed examples using Jupyter Notebooks and creation of dynamic web portals with TerriaJS.

44 U.S. Geological Survey Community for Data Integration 2017 Workshop Proceedings
U.S. Geological Survey Near Real-Time Significant Earthquake and Earthquake Scenario Geographic Information System Feeds
By Greg Smoczyk, David Wald, Bruce Worden, Eric Thompson, Vince Quitoriano, and Mike Hearne (all from USGS Geologic Haz-ards Science Center) [Science Support Framework category: Web Services]
Many consumers have requested the ability to view and analyze data for earthquakes in a more flexible and systematic manner using Esri ArcGIS, web-based geographic information system (GIS) viewers, and web mapping services (WMS). Until recently, GIS accessibility to many U.S. Geological Survey (USGS) earthquake products has been limited to downloadable shapefiles for individual events. In response, the USGS Earthquake Hazards Program now provides GIS feeds that contain event, ShakeMap, and Did You Feel It? (DYFI) data for significant earthquakes that have occurred within the last month. These feeds are updated every 15 minutes in near realtime. These services are accompanied by an aggregated map in Esri ArcGIS Online, which allows all users to reference, query, and display feed data in customized formats using the browser. The event GIS service displays attributes associated with a given significant earthquake. The ShakeMap GIS service contains station and shaking data layers (intensity, peak acceleration, velocity, and spectral accelerations), as well as ShakeMap event metadata. The DYFI GIS service contains geocoded DYFI responses that are geographically aggregated into 1-kilometer and 10-kilometer boxes. The USGS has begun to create similar data for earthquake scenarios, so a GIS service feed is currently in development to support scenario users.
Second Generation Metadata Wizard
By Colin Talbert (USGS Fort Collins Science Center) [Science Support Framework category: Data Management]
The U.S. Geological Survey Metadata Wizard is a popular metadata-creation tool that adheres to the Federal Geographic Data Committee’s Content Standard for Digital Geospatial Metadata; it is intended for Esri users. It is based on design principles of autocapturing content from the dataset being documented, prepopulating a record with reasonable defaults, and lowering the expertise level needed to make a high-quality metadata record. In an effort to further extend this functionality and provide this interface to a larger audience, the U.S. Geological Survey Fort Collins Science Center is currently undertaking a major update to the tool. It is now possible to run the tool outside of ArcCatalog as a standalone desktop application. The semiautomated entity and attribute builder is now integrated directly into the main form in a more intuitive format and works directly from comma-separated-values or Microsoft Excel datasets. Additionally, we have added functionality to highlight schema errors directly on the application so that they are easy to find and correct. The bounding coordinates are visualized on a dynamic map that allows for intuitive editing, and the tool now integrates with the Integrated Taxonomic Information System (https://itis.gov/) to facilitate capture of taxonomic information. Finally, we have added the ability to easily copy and paste complete sections between records. We hope this update provides an efficient metadata experience for a wide range of scientists and data managers.
Bridging the Gap Between Water and Elevation—A U.S. Geological Survey Pilot Project
By Silvia Terziotti (USGS South Atlantic Water Science Center), Karen Adkins (ATA Services Contractor in support of USGS), Christy-Ann Archuleta (USGS National Geospatial Technical Operations Center), H. Karl Heidemann (USGS Earth Resources Observation and Science Center Data Center), Kristina Yamamoto (USGS National Geospatial Technical Operations Center), Robert Wheelwright, (USGS National Geospatial Technical Operations Center), and David Anderson (USGS National Geospatial Technical Operations Center) [Science Support Framework category: Science Data Lifecycle—Analysis]
With the advent of increased light detection and ranging (lidar) collection and the pressing need for better-matched elevation and hydrography data, the U.S. Geological Survey is investigating methods to improve the integration of these datasets. The vertical integration of elevation data with hydrographic data is important both for hydrographic analysis and cartographic depiction of data. Incorporating information from the breakline datasets delivered by the data providers for the 3D Elevation Program (3DEP) into the National Hydrography Dataset (NHD) would allow for more seamless spatial and temporal integration, especially when combined with attribution following a common data dictionary. Having common collection specifications for all breakline data, whether collected originally for 3DEP or NHD, reduces integration costs and allows immediate cross-project use of the data. This poster discussed the need for this breakline data dictionary and outlined what it entails, as well as presented preliminary findings from pilot studies to test the applicability and suitability of such methods.

DataBlast 45
A Semantic Architecture for Multidisciplinary Modeling
By Ferdinando Villa (Basque Centre for Climate Change), Stefano Balbi (Basque Centre for Climate Change), Ioannis Athanasiadis (Wageningen University), Caterina Caracciolo (Food and Agriculture Organization of the United Nations), and Ken Bagstad (USGS Geosciences and Environmental Change Science Center) [Science Support Framework category: Semantics]
We discussed the first results of an investigation into the conceptual and methodological aspects of semantic annotation of data and models, aimed to enable a high standard of interoperability of information. The results, operationalized in the context of a long-term, active, large-scale project on ecosystem-services assessment, include (1) a definition of interoperability based on semantics and scale; (2) a conceptual foundation for the phenomenology underlying scientific observations, aimed to guiding the practice of semantic annotation in domain communities; and (3) a dedicated language and software infrastructure that operationalizes the findings and allows practitioners to reap the benefits of data and model interoperability. The work presented is the first detailed description of almost a decade of work with communities active in socioecological system modeling. After defining the boundaries of possible interoperability based on the understanding of scale, we discussed examples of the practical use of the findings to obtain consistent, interoperable, and machine-ready semantic specifications that can integrate semantics across diverse domains and disciplines.
Extending ScienceCache to Accommodate Broader Use within the U.S. Geological Survey—Project Overview
By Mark Wiltermuth (USGS Northern Prairie Wildlife Research Center), Tim Kern (USGS Fort Collins Science Center), and Dell Long (USGS Fort Collins Science Center) [Science Support Framework category: Applications]
Our 2017 Community for Data Integration-funded project will extend the existing ScienceCache mobile application to become a more universal mobile data-collection framework that meets minimum needs for systematic or opportunistic data collection to support internal research studies as well as citizen science projects. A primary goal of this project is to keep creation and deployment of new data-collection surveys simple enough that research teams can independently manage surveys. We plan to continue development of a web interface to enable U.S. Geological Survey users to create and deploy data-collection surveys to mobile devices. In this poster presentation, we outlined the planned improvements to the technology behind ScienceCache, identified planned user interaction improvements, and requested input from potential users of what features will make this application more useful in the future.
Evaluation and Testing of Standardized Forest Vegetation Metrics Derived from Light Detection and Ranging (Lidar) Data—Informing Geospatial Data Products for 3D Elevation Program, LANDFIRE, and the National Park Service Vegetation Inventory Programs
By John Young (USGS Leetown Science Center), Jason Stoker (USGS National Geospatial Program), Nick Kruskamp (North Carolina State University), Birgit Peterson (USGS LANDFIRE Program), Cindy Thatcher (USGS 3D Elevation Program), Monica Palseanu-Lovejoy (USGS Eastern Geographic Science Center), Kurtis Nelson (USGS LANDFIRE Program), Jeff Danielson (USGS Earth Resources Observation and Science Center) Dean Gesch (USGS Earth Resources Observation and Science Cen-ter), Karl Heidemann (USGS Earth Resources Observation and Science Center), Dan Hurlbert (National Park Service, Shenandoah National Park), and Casey Teske (National Park Service, Grand Canyon National Park) [Science Support Framework category: Data]
The U.S. Geological Survey 3D Elevation Program is managing the acquisition of light detection and ranging (lidar) data across the Nation for high-resolution mapping of the land surface for multiple applications. Lidar data are initially collected as three-dimensional point clouds that map the interaction of the airborne laser with the Earth’s surface, including vegetation, buildings, and ground features. The product of interest is typically high-resolution digital elevation models generated by focusing only on the laser returns that come from the ground surface and removing returns from vegetation, buildings, powerlines, and other above-ground features. However, there is a wealth of information in the full point cloud that is currently being underutilized. Characterizing the three-dimensional nature of vegetation with lidar data enables mapping vegetation height, structure, and volume over large areas. These mapped attributes are useful for habitat studies, vegetation-biomass and biomass-change studies, and wildfire-behavior models. We are working to better utilize these data and to formalize procedures for automated generation of vegetation attributes from lidar data. This includes pre-processing of 3D Elevation Program lidar point clouds into a standardized set of vegetation products and development of real-time, on-the-fly processing of data stored in the cloud for individualized product delivery.
46 U.S. Geological Survey Community for Data Integration 2017 Workshop Proceedings
Core Science Analytics, Synthesis, and Library—Facilitating Lifecycle Management of U.S. Geological Survey Data and Information Assets
By Lisa Zolly, Cate Canevari, Vivian Hutchison, Drew Ignizio, Madison Langseth, Tamar Norkin, Brandon Serna, and Ben Wheeler (all from USGS Core Science Analytics, Synthesis, and Libraries) [Science Support Framework category: Data Management]
Planning for, managing, describing, exposing, and providing persistent and timely public access to U.S. Geological Survey (USGS) data and publications ensure that these resources are available to, and useable by, stakeholders when they are needed. The Core Science Analytics, Synthesis, and Libraries program brings decades of expertise in information, library, and geospatial sciences to the lifecycle management of scientific data and the resources that support and describe research outcomes. Through its Science Data Management Branch and the USGS Library, the Core Science Analytics, Synthesis, and Libraries program develops and supports a wide range of systems, services, tools, and best practices to facilitate data and information management across the USGS. These products include the USGS Data Management website, the Data-Management Planning Tool (DMPTool), the Data Release Workbench, myUSGS JIRA, myUSGS Confluence, the Metadata Wizard, the Online Metadata Editor, support for USGS author Open Researcher and Contributor ID (ORCID), the Digital Object Identifier (DOI) Creation Tool, ScienceBase, the USGS Science Data Catalog, and the USGS Publications Warehouse. These tools will be demonstrated at the 2017 USGS Community for Data Integration DataBlast. Questions and feedback regarding their utility and usability are welcome and encouraged.
Summary of Workshop OutcomesThe 2017 Community for Data Integration (CDI) workshop provided an opportunity for colleagues to meet together for
indepth planning on their shared areas of interest, and it also produced new connections for future collaborations. There were five major outcomes of the workshop. 1. A summary with recommendations from the Roadmap Discussions on Enabling Integrated Science was distributed to
the CDI’s executive sponsors. These proceedings outline the motivations and details of 34 thematic recommendations and 7 pilot projects for advancing integrated science that arose during the workshop discussions.
2. New projects, tools, and resources supported by the CDI were presented to the CDI community for feedback. An important role of the CDI is to communicate about relevant resources to its membership and facilitate discussions to improve projects and increase usage. A summary of this information is documented in these proceedings for those that were not able to attend the workshop.
3. Workshop attendees identified several topics and questions that they wished to follow up on and learn more about, including User Needs and Experience, discovery and knowledge transfer for scientific modeling, and data science. Other actions were identified in the topical sessions described in these proceedings. This outcome will guide future CDI activities, events, and funding opportunities.
4. New groups of people who met at the workshop decided to consider new CDI groups or resources around the topics of data science, software development, legacy data, science on a screen, and software development and information technology operations (DevOps). This brings a richer set of topics to the CDI.
5. Trainings were provided on topics of interest to the community, including R Workshop for Beginners and Introduction to Advanced Scientific Computing.

References 47
AcknowledgmentsThe authors would like to thank all of the members of the Community for Data Integration (CDI), who drive the direction
of the community. This includes the workshop attendees, who generated all of the ideas in this report; the CDI coordinators, who wisely advised about the workshop amid evolving agendas; and the executive sponsors of the CDI, Kevin T. Gallagher, Tim Quinn, and Cheryl Morris, for their support and guidance. The Roadmap Discussions on Enabling Integrated Science section had contributions from Rich Signell, Roland Viger, Mike Frame, Paul Exter, Jeff Falgout, Fran Lightsom, Rex Sanders, and John Faundeen. Thank you to Viv Hutchison and Daniel Wieferich for taking the photographs in this report. Finally, thank you to the two reviewers, Heather Henkel and Alan Allwardt, for comments that improved the text.
References
Chang, M.Y., Carlino, J., Barnes, C., Blodgett, D.L., Bock, A., Everette, A.L., Fernette, G.L., Flint, L.E., Gordon, J., Govoni, D.L., Hay, L.E., Henkel, H.S., Hines, M.K., Holl, S.L., Homer, C., Hutchison, V.B., Ignizio, D.A., Kern, T., Lightsom, F.L., Markstrom, S.L., O’Donnell, M., Schei, J.L., Schmid, L.A., Schoephoester, K.M., Schweitzer, P.N., Skagen, S.K., Sullivan, D.J., Talbert, C., and Warren, M.P., 2015, Community for Data Integration 2013 annual report: U.S. Geological Survey Open-File Report 2015–1005, 36 p., accessed March 07, 2018, at https://doi.org/10.3133/ofr20151005.
Faundeen, J.L., Burley, T.E., Carlino, J.A., Govoni, D.L., Henkel, H.S., Holl, S.L., Hutchison, V.B., Martín, E., Montgomery, E.T., Ladino, C.C., Tessler, S., and Zolly, L.S., 2013, The United States Geological Survey science data lifecycle model: U.S. Geological Survey Open-File Report 2013–1265, 4 p., accessed March 07, 2018, at https://doi.org/10.3133/ofr20131265.
Heflin, J. and Hendler, J., 2000, Semantic interoperability on the web, in Extreme Markup Language 2000, Montreal, Canada, August 13–18, 2000, Proceedings: Graphics Communications Association, 15 p., accessed March 13, 2018, at http://www.dtic.mil/dtic/tr/fulltext/u2/a440535.pdf.
Jenni, K.E., Goldhaber, M.B., Betancourt, J.L., Baron, J.S., Bristol, R.S., Cantrill, M., Exter, P.E., Focazio, M.J., Haines, J.W., Hay, L.E., Hsu, L., Labson, V.F., Lafferty, K.D., Ludwig, K.A., Milly, P.C., Morelli, T.L., Morman, S.A., Nassar, N.T., New-man, T.R., Ostroff, A.C., Read, J.S., Reed, S.C., Shapiro, C.D., Smith, R.A., Sanford, W.E., Sohl, T.L., Stets, E.G., Terando, A.J., Tillitt, D.E., Tischler, M.A., Toccalino, P.L., Wald, D.J., Waldrop, M.P., Wein, A., Weltzin, J.F., and Zimmerman, C.E., 2017, Grand challenges for integrated USGS science—A workshop report: U.S. Geological Survey Open-File Report 2017–1076, 94 p., accessed March 07, 2018, at https://doi.org/10.3133/ofr20171076.
Nardi, B.A. and O’Day, V., 1999, Information ecologies—Using technology with heart: Cambridge, Mass., MIT Press, 246 p.
U.S. Geological Survey, 2007, Facing tomorrow’s challenges—U.S. Geological Survey science in the decade 2007–2017: U.S. Geological Survey Circular 1309.
U.S. Geological Survey, 2016, Public access to results of federally funded research at the U.S. Geological Survey—Scholarly Publications and Digital Data: U.S. Geological Survey, 22 p., accessed March 18, 2018, at https://www2.usgs.gov/quality_integrity/open_access/downloads/USGS-PublicAccessPlan-APPROVED-v1.03.pdf.
U.S. Geological Survey, 2018, U.S. Geological Survey home page: U.S. Geological Survey web page, accessed March 19, 2018, at https://www.usgs.gov.
Young, S., 2001, Designing a DMZ: SANS Institute, 8 p., accessed March 13, 2018, at https://www.sans.org/reading-room/whitepapers/firewalls/designing-dmz-950.

48 U.S. Geological Survey Community for Data Integration 2017 Workshop Proceedings
Appendix 1. Interactive Session Questions and CommentsAt the workshop, audience feedback was collected and displayed in realtime using the sli.do application (app). Participants
used their mobile phones or laptops to submit questions or comments relevant to the current speaker or session. These questions and comments then were displayed on the user interface so that others using the app could upvote posts that they agreed with. In total, about 100 ideas were submitted through the sli.do app.
Themes from the Submissions
• There is need for support of U.S. Geological Survey (USGS) data-management activities (implementation teams, on-sitesupport, data management as a service), including acknowledgement of good data management and data release in theUSGS Research Grade Evaluation (RGE) process and making it easier to create useful data-management plans.
• There is need for enterprise support for adopting open-source software. It may be useful to create a team to evaluateopen-source solutions and work with the USGS Office of Enterprise Information.
• There is a desire to better track user needs and experience, such as having a way to poll our users and see how productsmeet user needs. When tracking user needs, we should make sure to include the scientists supplying data as users.
• Strategies for communication and delivery of USGS data products are important. Good strategies will improve the wayswe share information with decision makers, allow us to communicate digestible yet exciting information, and allow us toshare tools for collaborating across the USGS and with external partners.
• Both agency and interagency support is necessary for integrated science activities. We need strategies to address conflicting data-release standards across different agencies during partnerships and to incorporate partner-funded data into the USGS assets.
• Training opportunities and human resources are important, as they will help us prepare for the next generation of scien-tists and also help with effective hiring of personnel with necessary skills for integrated science at the USGS.
• We should clarify the role of the Community for Data Integration (CDI) in enabling USGS integrated science. It isimportant to know the breakdown of the CDI membership and their roles in the USGS.
• Governance for integrated science activities is needed. Integrated science happens at a level higher than the individualproject level, and thus coordination is needed. After the development of a roadmap, an implementation team is necessary.
• Standards and vocabularies are important for achieving integrated science. The following activities will help the USGSto work across disciplines: developing and using shared units, identifiers, and methods; using shared data dictionaries;automating data-dictionary creation; and developing data schemas and standards.
• Moving projects from research to operations remains challenging.
• USGS research will advance further if we improve connections between information technology and scientific research.
• We should consider following the Earth Science Information Partners model for idea sharing and virtual collaboration.
• There is opportunity to improve data collection and sample tracking.
List of Pilot Projects from sli.do
On the last day of the workshop, we held a plenary session where participants could suggest and discuss pilot project ideas that built on the “Enabling Integrated Science” theme (table 1).
Recommendation Polls from Roadmap Discussions on Enabling Integrated Science
Polls were administered using the sli.do app to gauge interest in recommendations drawn from the previous Roadmap Discus-sions on Enabling Integrated Science. Participants could choose their top two choices in each of the four categories: Data and Data Integration, Modeling, Computing Capacity—Training, Outreach, and Education, and Science Data Infrastructure (tables 2–5). Participants voted based on the question “Which two of the following recommendations do you think would have the most impact on enabling integrated science?”

Appendix 1 49
Table 1. Ideas for pilot projects that came out of the plenary session on the last day of the conference, listed in order of support expressed through upvotes on the sli.do application.
[DMP, data-management plan; 3DEP, 3D Elevation Program; CDI, Community for Data Integration; ESIP, Earth Science Information Partners; OEI, Office of Enterprise Information]
Pilot project Votes
Possible action: Data about USGS employees—crowdsource an inventory of our skillsets and active projects; would help us col-laborate and plan
25
Create a DMP format and content structure where content from the DMP can be used to populate metadata records 22Jupyter or R Markdown notebooks showing interoperability: accessing, analyzing and visualizing data from two or more web
services from different disciplines18
A data-management strategy development and DMP implementation team that evaluates use cases and designs an enterprise documentation management system
17
Pilot project: landslide risk forecasting from 3DEP and water data 13What if the CDI set aside $10,000 per year and evaluated data release per fiscal year and selected the 3 with the most ideal or
most complete data package for an award?7
Pilot ESIP model for idea sharing and virtual collaboration within the USGS 7A group to evaluate common open source software packages and works with OEI to integrate the most valued packages into our
supported software suite6
The CDI develops a catalog of data dictionaries that could be reused 6Flexible data collection and sample tracking platform utilizing tablets with bar codes and following throughout sample lifecycle
of analyses through publication5
Heavier investing of prioritizing digitizing, delivery, and preservation of legacy data 4Seed funding for grand challenge (pre-proposals) teams—include 3 or more mission areas scientists, 3 or more technologists,
knowledge-sharing plan4
One of the main aspects of data integration is understanding the data; that is done through a data dictionary. Automate the dic-tionary creation process
3
Mine spill location and prevention utilizing historical locations, water-quality sampling, biota, geochemistry, and topographic indices
3
Developing data schemas and standards; possible first steps: (1) inventory USGS datasets and prioritize best candidates (2) earn scientist participation and buy-in
3
Analyze a current integrated-science project in which challenges presented themselves and improve on those first 3Build out Monitoring Resources (https://www.monitoringresources.org) to handle new science themes, natural resources, stew-
ardship, prevention of human loss3
Table 2. Recommendations under the Data and Data Integration category, listed in order of the number of upvotes received.
Recommendation Votes
Establish expert cross-mission-area teams of scientists and data experts to address specific grand challenges 38Promote use of standards to advance interoperability and usability of data 24Increased training on exposing and using data services 19Be open to new advances in technology while still using what is proven 13Assess need for new or improved foundational datasets (national efforts that inform a good number of mission-area products) 11More robust registry or registries of information products (Science Data Catalog, among others) 10Increase use of semantic technologies to improve discovery and connectivity 9

50 U.S. Geological Survey Community for Data Integration 2017 Workshop Proceedings
Table 3. Recommendations under the Modeling category, listed in order of the number of upvotes received.
[THREDDS, Thematic Real-Time Environmental Distributed Data Service; ERDDAP, Environmental Research Division’s Data Access Program; API, application programming interface]
Recommendation Votes
Provide shared remote workspace (for example, cloud) for modelers to help analyze and distribute model results (JupyterHub, THREDDS, ERDDAP, and others)
37
Develop an enterprise model API or toolkit that takes advantage of standards for model output (enables interoperability) 33Support for the Advanced Computing Cooperative 24Git training for modelers 15Create modeling listserv or Slack channel 9
Table 4. Recommendations under the Computing Capacity—Training, Outreach, and Education category, listed in order of the number of upvotes received.
[HTC, high-throughput computing; HPC, high-performance computing; MOOC, massive open online course]
Recommendation Votes
Sharing, leveraging of training activities across the USGS (for example, “R Workshop for Beginners’ and “Introduction to Advanced Scientific Computing”)
46
Develop Advanced Computing Cooperative website—communications, decision tree for services, pilot projects, re-use of mod-els, possible single email—requires dedicated staffing for both coordination and facilitation.
31
USGS computing scientific challenge—prize competition related to cloud, HTC, HPC driven by executive challenge statements (such as, USGS grand challenges, internal improvement of myScience, among others)
21
Partnering with universities to offer training courses (online and in-person - MOOC) for USGS scientists (in advanced comput-ing, R, and so forth); offer things such as USGS data and use of USGS resources
18
Table 5. Recommendations under the Science Data Infrastructure category, listed in order of the number of upvotes received. Recommendation Votes
Incentivization for scientists to employ shared science infrastructure, including more innovative distribution methods, including a standard model or architecture (technology, database, sensor, lab)
36
Establish criteria so foundational data is maintained in such a way that they can be interoperable 24Executive support for cultural change (including the Center Director) 22Implement a tiger team to look at USGS enterprises systems and architecture and how they can more efficiently integrate and
(or) interoperate with the output of establishing integrated systems and support resources14
The USGS should establish a community of practice to provide consistency for how we are approaching data collection and movement with standardized processes, new technology, software development and information technology operations, and so forth
13
Extend enterprise data-handling and distribution capabilities to help with transparency requirements and increase collaboration tools
12
Need a more efficient funding mechanism and governance to lessen internal competition and decrease stovepipe infrastructure 10

Appendix 2 51
Appendix 2. Attendees
Table 6. List of conference attendees.—Continued
[Affiliations follow naming formats at the time of the conference and may have changed by time of publication. In some cases, the affiliations have been updated to follow naming formats used at time of publication, which might differ from former naming formats. USGS, U.S. Geological Survey; n.d., no data; USDA, U.S. Department of Agriculture; DOI, Department of the Interior]
First name Last name Email address Affiliation
Seth Ackerman [email protected] USGS Woods Hole Coastal and Marine Science Center
Joe Adams [email protected] USGS Geosciences and Environmental Change Science Center
Karen Adkins [email protected] Ata Services, Inc., and National Geospatial Technical Operations Center
Sanjay Advani [email protected] USGS Fort Collins Science Center
Stephen Aichele [email protected] USGS National Geospatial Program
Alan Allwardt [email protected] USGS Pacific Coastal and Marine Science Center
Phyllis Altheide [email protected] USGS National Geospatial Technical Operations Center
Steve Aulenbach [email protected] USGS Core Science Analytics, Synthesis, and Library
Vijay Barve [email protected] Florida Museum of Natural History
Jen Bayer [email protected] USGS Pacific Northwest Aquatic Monitoring Partner-ship
Tara Bell [email protected] USGS Great Lakes Science Center
Jesse Bellora [email protected] USGS
Abby Benson [email protected] USGS Core Science Analytics, Synthesis, and Library
Janelda Biagas [email protected] USGS Wetland and Aquatic Research Center
Douglas Binnie [email protected] USGS Earth Resources Observation and Science Center
Wade Bishop [email protected] University of Tennessee
Erin Boydston [email protected] USGS Western Ecological Research Center
John Brakebill [email protected] USGS Maryland, Delaware, and the District of Colum-bia Water Science Center
Jenny Briggs [email protected] USGS Geosciences and Environmental Change Science Center
Sky Bristol [email protected] USGS Core Science Analytics, Synthesis, and Library
Meredith Burger [email protected] USGS
Annie Burgess [email protected] Earth Science Information Partners
Thomas Burley [email protected] USGS Texas Water Science Center
Matt Cannister [email protected] USGS Wetland and Aquatic Research Center
Jennifer Carlino [email protected] USGS Federal Geographic Data Committee
Bruce Caron [email protected] Earth Science Information Partners
Lindsay Carr [email protected] USGS Office of Water Information
Joe Carroll [email protected] USGS St. Petersburg Coastal and Marine Science Center
Karen Courtot [email protected] USGS Pacific Island Ecosystems Research Center
VeeAnn Cross [email protected] USGS Woods Hole Coastal and Marine Science Center
Rose Cunningham [email protected] USGS Alaska Science Center
Tod Dabolt [email protected] DOI Office of the Chief Information Officer
Sofia Dabrowski [email protected] USGS Great Lakes Science Center
Bob Davis [email protected] USGS National Geospatial Technical Operations Center

52 U.S. Geological Survey Community for Data Integration 2017 Workshop Proceedings
Table 6. List of conference attendees.—Continued
[Affiliations follow naming formats at the time of the conference and may have changed by time of publication. In some cases, the affiliations have been updated to follow naming formats used at time of publication, which might differ from former naming formats. USGS, U.S. Geological Survey; n.d., no data; USDA, U.S. Department of Agriculture; DOI, Department of the Interior]
First name Last name Email address Affiliation
Cian Dawson [email protected] USGS Office of Groundwater
Linda Debrewer [email protected] USGS Office of Groundwater
Ivan DeLoatch [email protected] USGS Federal Geographic Data Committee
Connie Dicken [email protected] USGS Mineral Resources Science Center
Rhonda Dizol [email protected] DOI Office of Natural Resources Revenue
Rob Dollison [email protected] USGS National Geospatial Technical Operations Center
Ariel Doumbouya [email protected] USGS National Geospatial Technical Operations Center
Blake Draper [email protected] USGS Web Informatics and Mapping
Jessica Driscoll [email protected] USGS National Research Program
Steven Emmerson [email protected] University Corporation for Atmospheric Research
Richard Erickson [email protected] USGS Upper Midwest Environmental Sciences Center
Jennifer Erxleben [email protected] USGS Cloud Hosting Solutions
Max Ethridge [email protected] USGS
Lance Everette [email protected] USGS Fort Collins Science Center
Paul Exter [email protected] USGS Office of Enterprise Information
Jeff Falgout [email protected] USGS Core Science Analytics, Synthesis, and Library
Cristiana Falvo [email protected] USGS Fort Collins Science Center
John Faundeen [email protected] USGS Earth Resources Observation and Science Center
Jeremy Fee [email protected] USGS Geologic Hazards Science Center
Mike Fienen [email protected] USGS Wisconsin Water Science Center
Kristen Fishburn [email protected] USGS
Leon Foks [email protected] USGS Core Science Analytics, Synthesis, and Library
Emily Fort [email protected] National Climate Change and Wildlife Science Center
Brian Fox [email protected] USGS National Geospatial Technical Operations Center
Mike Frame [email protected] USGS Core Science Analytics, Synthesis, and Library
Eldrich Frazier [email protected] USGS Federal Geographic Data Committee
Aaron Freeman [email protected] USGS Fort Collins Science Center
Tracy Fuller [email protected] USGS
Kevin T. Gallagher [email protected] USGS Core Science Systems
Stu Giles [email protected] USGS Mineral Resources Science Center
Nadine Golden [email protected] USGS Pacific Coastal and Marine Science Center
Martin Goldhaber [email protected] USGS Geology, Geophysics, and Geochemistry Science Center
Maggie Goldman [email protected] USGS Crustal Geophysics and Geochemistry Science Center
Janice Gordon [email protected] USGS Core Science Analytics, Synthesis, and Library
Jeremiah Greif [email protected] USGS National Geospatial Technical Operations Center
Glenn Guempel [email protected] USGS
Gregory Gunther [email protected] USGS Central Energy Resources Science Center
Michelle Guy [email protected] USGS Geologic Hazards Science Center

Appendix 2 53
Table 6. List of conference attendees.—Continued
[Affiliations follow naming formats at the time of the conference and may have changed by time of publication. In some cases, the affiliations have been updated to follow naming formats used at time of publication, which might differ from former naming formats. USGS, U.S. Geological Survey; n.d., no data; USDA, U.S. Department of Agriculture; DOI, Department of the Interior]
First name Last name Email address Affiliation
Mark Hannon [email protected] USGS Fort Collins Science Center
Jessica Hausman [email protected] Jet Propulsion Laboratory and Physical Oceanographic Distributed Active Archive Center
Christine Hawkinson [email protected] Bureau of Land Management
Chris Henke [email protected] USGS Columbia Environmental Research Center
Kevin Henry [email protected] USGS Western Geographic Science Center
Enrika Hlavacek [email protected] USGS Upper Midwest Environmental Sciences Center
Dave Hockman-Wert [email protected] USGS Forest and Rangeland Ecosystem Science Center
Sophie Hou [email protected] National Center for Atmospheric Research
Harold House [email protected] USGS Office of The Director
Leslie Hsu [email protected] USGS Core Science Analytics, Synthesis, and Library
Viv Hutchison [email protected] USGS Core Science Analytics, Synthesis, and Library
Terry Idol [email protected] n.d.
Drew Ignizio [email protected] USGS Core Science Analytics, Synthesis, and Library
Melissa James [email protected] USGS National Geospatial Technical Operations Center
Michaela Johnson [email protected] USGS Crustal Image and Characterization Team
Tyler Johnson [email protected] USGS California Water Science Center
Eric Jones [email protected] USGS Geologic Hazards Science Center
Nicole Kaplan [email protected] USDA Agricultural Research Service
Alex Katz [email protected] USGS National Geospatial Technical Operations Center
Jeremy Kenyon [email protected] University of Idaho
Tim Kern [email protected] USGS Fort Collins Science Center
Keith Kirk [email protected] USGS Office of Science Quality and Integrity
Katharine Kolb [email protected] USGS South Atlantic Water Science Center
Cassandra Ladino [email protected] USGS Eastern Geographic Science Center
Andrew LaMotte [email protected] USGS Maryland, Delaware, and the District of Colum-bia Water Science Center
Madison Langseth [email protected] USGS Core Science Analytics, Synthesis, and Library
Lynda Lastowka [email protected] USGS Geologic Hazards Science Center
Natalie Latysh [email protected] USGS Data Preservation, Informatics, and Laboratory
Gary Latzke [email protected] USGS Wisconsin Water Science Center
Neda Ledoux [email protected] USGS Fort Collins Science Center
Chris Lett [email protected] U.S. Fish and Wildlife Service
Frances Lightsom [email protected] USGS Woods Hole Coastal and Marine Science Center
Sophia B. Liu [email protected] USGS Energy and Minerals Mission Area
Tim Mancuso [email protected] USGS Core Science Analytics, Synthesis, and Library
Heather Manley [email protected] Cherokee Nation Technologies, contractor to DOI and USGS
Kim Mantey [email protected] USGS National Geospatial Technical Operations Center
Eric Martinez [email protected] USGS Geologic Hazards Science Center

54 U.S. Geological Survey Community for Data Integration 2017 Workshop Proceedings
Table 6. List of conference attendees.—Continued
[Affiliations follow naming formats at the time of the conference and may have changed by time of publication. In some cases, the affiliations have been updated to follow naming formats used at time of publication, which might differ from former naming formats. USGS, U.S. Geological Survey; n.d., no data; USDA, U.S. Department of Agriculture; DOI, Department of the Interior]
First name Last name Email address Affiliation
Greg Matthews [email protected] USGS National Geospatial Program
Elizabeth McCartney [email protected] USGS National Geospatial Technical Operations Center
Kevin McKinney [email protected] USGS Core Research Center
Marcia McNiff [email protected] USGS Core Science Analytics, Synthesis, and Library
Larry Meinert [email protected] USGS Energy and Minerals Mission Area
Rob Miller [email protected] USGS Central Energy Resources Science Center
Ellyn Montgomery [email protected] USGS Coastal and Marine Geology Program
Cheryl Morris [email protected] USGS Core Science Analytics, Synthesis, and Library
James Nagode [email protected] Bureau of Reclamation
Sarah Nagorsen [email protected] USGS Science Publishing Network
JC Nelson [email protected] USGS Upper Midwest Environmental Sciences Center
Jeremy Newson [email protected] USGS Web Informatics and Mapping
Tamar Norkin [email protected] USGS Core Science Analytics, Synthesis, and Library
Raymond Obuch [email protected] USGS
Ed Olexa [email protected] USGS Northern Rocky Mountain Science Center
Shad O’Neel [email protected] USGS Alaska Science Center
Robert Osadetz [email protected] USGS National Geospatial Technical Operations Center
Andrea Ostroff [email protected] USGS Fisheries Program
Courtney Owens [email protected] USGS Office of Enterprise Information
Daniel Pearson [email protected] USGS Texas Water Science Center
Jeff Peters [email protected] USGS Western Geographic Science Center
Brian Pfeiffer [email protected] USGS The National Map, 3D Elevation Program
Lindsay Powers [email protected] USGS National Geological and Geophysical Data Pres-ervation Program
Julie Prior-Magee [email protected] USGS Core Science Systems and Core Science Analyt-ics, Synthesis, and Libraries
Tim Quinn [email protected] USGS Office of Enterprise Information
Cynthia Rachol [email protected] USGS Water Resources of Michigan Water Science Center
Al Rea [email protected] USGS National Geospatial Program
Brian Reichert [email protected] USGS Fort Collins Science Center
Carol Reiss [email protected] USGS Pacific Coastal and Marine Science Center
Erin Robinson [email protected] Earth Science Information Partners
Pete Ruhl [email protected] USGS Office of Water Quality
Carma San Juan [email protected] USGS Mineral Resources Science Center
Rex Sanders [email protected] USGS Pacific Coastal and Marine Science Center
Robert Schmitt [email protected] USGS Geologic Hazards Science Center
Heather Schreppel [email protected] USGS St. Petersburg Coastal and Marine Science Center
Peter Schweitzer [email protected] USGS Eastern Mineral and Environmental Resources Science Center

Appendix 2 55
Table 6. List of conference attendees.—Continued
[Affiliations follow naming formats at the time of the conference and may have changed by time of publication. In some cases, the affiliations have been updated to follow naming formats used at time of publication, which might differ from former naming formats. USGS, U.S. Geological Survey; n.d., no data; USDA, U.S. Department of Agriculture; DOI, Department of the Interior]
First name Last name Email address Affiliation
Rebecca Scully [email protected] USGS Pacific Northwest Aquatic Monitoring Partnership
Brandon Serna [email protected] USGS Core Science Analytics, Synthesis, and Library
Jason Sherba [email protected] USGS Western Geographic Science Center
Richard Signell [email protected] USGS Woods Hole Coastal and Marine Science Center
Chris Skinner [email protected] USGS Central Energy Resources Science Center
Jonathan Smith [email protected] USGS
Greg Smoczyk [email protected] USGS Geologic Hazards Science Center
Julie Stahli [email protected] U.S. Fish and Wildlife Services
Aaron Stephenson [email protected] USGS Wisconsin Water Science Center
Jason Stoker [email protected] USGS National Geospatial Program
Colin Talbert [email protected] USGS Fort Collins Science Center
Silvia Terziotti [email protected] USGS South Atlantic Water Science Center
Florence Thompson [email protected] USGS Texas Water Science Center
Robin Tillitt [email protected] USGS Columbia Environmental Research Center
Matt Tricomi [email protected] Xentity Corporation
Shayne Urbanowski [email protected] USGS Core Science Analytics, Synthesis, and Library
Tom Van Dreser [email protected] USGS
Bruce Vandenberg [email protected] USDA Agricultural Resources Research
Jamie Velkoverh [email protected] USGS Web Informatics and Mapping
Roland Viger [email protected] USGS National Research Program
Hans Vraga [email protected] USGS Web Informatics and Mapping
Dennis Walworth [email protected] USGS Alaska Integrated Science Center
Tristan Wellman [email protected] USGS Core Science Analytics, Synthesis, and Library
Jake Weltzin [email protected] USGS National Phenology Network
Bill Werkheiser [email protected] USGS
Rob Wertz [email protected] USGS St. Petersburg Coastal and Marine Science Center
Ben Wheeler [email protected] USGS Core Science Analytics, Synthesis, and Library
Michael Wieczorek [email protected] USGS Maryland, Delaware, and the District of Colum-bia Water Science Center
Daniel Wieferich [email protected] USGS Core Science Analytics, Synthesis, and Library
Paul Wiese [email protected] USGS National Geospatial Program
Emily Wild [email protected] USGS Denver Library
Lei Ann Wilson [email protected] USGS Fort Collins Science Center
Mark Wiltermuth [email protected] USGS Northern Prairie Wildlife Research Center
Justin Wright [email protected] USGS Core Science Analytics, Synthesis, and Libraries
John Young [email protected] USGS Leetown Science Center
Stephen Zahniser [email protected] Esri
Lin Zhang [email protected] DOI Office of the Chief Information Officer
Lisa Zolly [email protected] USGS Core Science Analytics, Synthesis, and Libraries

56 U.S. Geological Survey Community for Data Integration 2017 Workshop Proceedings
Appendix 3. Community for Data Integration Science Support Framework[First published in Chang and others, 2015. Minor edits were made to fit the format of this report.]
In order to provide an overarching context and vision for Community for Data Integration (CDI) goals and activities, the CDI coordinators, consisting of working group leads and facilitators, developed the Science Support Framework (SSF) in 2012. The SSF categorizes the activities and processes through which research data flow and upon which the CDI operates. It is these categories that provide the operational foundation and conceptual architecture that illustrates how CDI activities contribute to Bureau-level data integration efforts.
The vertical elements in the SSF (fig. 3) represents the “how” of the CDI—processes, implementation of standards and best practices, and interactions among people, data, and technology necessary to achieve data integration. The activities of monitor-ing, assessment, and research flow through the Science Data Lifecycle Model (Faundeen and others, 2013) processes, with the aid of applications, web services, and semantics (that is, common frameworks and ontologies for sharing data across applica-tions, communities, enterprises, and so forth). The assets are transformed into information products that increase knowledge and understanding of the Earth’s physical and biological systems.
The horizontal elements in the SSF (fig. 3) represent the “what” of the CDI: products and tools and the mechanisms that mediate and contribute to the discovery and effective use of scientific data in systematic research. Data assets are managed within the context of the individual science projects, flowing horizontally from science project support through the Science Data Lifecycle Model processes, applications, and ultimately to data and knowledge management. Continue to explore the CDI Science Support Framework at http://www.usgs.gov/cdi.
2015CDI Workshop
Information
Dat
a M
anag
emen
t
Know
ledg
e M
anag
emen
t
Data
Applications
Web Services
Semantics
Communities of Practice
Scie
nce
Proj
ect S
uppo
rt
Plan
ning
Acqu
isiti
on
Proc
essi
ng
Anal
ysis
Pres
erva
tion
Publ
ishi
ng a
nd S
harin
gKnowledge: Understanding of Earth Systems
Monitoring, Assessment, and Research
Science Data Lifecycle Model
Community for Data Integration (CDI)Science Support Framework (SSF)
Figure 3. The Community for Data Integration Science Support Framework.


Hsu and others—U
.S. Geological Survey Com
munity for D
ata Integration 2017 Workshop Proceedings—
Open-File Report 2018–1081
ISSN 2331-1258 (online)https://doi.org/10.3133/ofr20181081