Embed Size (px)
Citation preview

U.S. Census BureauSurvey of Business Owners
Black-Owned Businesses: 2007
Census Bureau Economic DataReleased on Feb. 8, 2011

2Feb. 8, 2011
PresentersHost Stan Rolark
Survey uses Marc H. MorialPresident and Chief Executive
OfficerNational Urban League
Survey findings Thomas L. Mesenbourg, Jr.Deputy Director and Chief
Operating OfficerU.S. Census Bureau
Survey uses Ivonne CunarroChief, Knowledge Management UnitMinority Business Development
Agency

3www.census.gov/econ/sbo Feb. 8, 2011
Resources for Today’s News Conference
Come to www.census.gov and click on the icon at the top left corner to obtain –• Today’s PowerPoint Presentation• News Release• Link to Survey of Business Owners Home Page• Link to Guidance on Accessing SBO Data in the
American FactFinder

Separate News Releases for theTen Metropolitan Areas Withthe Largest Black Population
• Atlanta• Chicago• Dallas• Detroit• Houston
• Los Angeles• Miami • New York• Philadelphia• Washington, DC
4www.census.gov/econ/sbo Feb. 8, 2011

5www.census.gov/econ/sbo Feb. 8, 2011
• Part of the Economic Census taken every 5 years for years ending in “2” and “7”
• The only comprehensive, regularly collected data for businesses and business owners by - Minority status Race Ethnicity (Hispanic origin of any race)
- Gender- Veteran status
About the Survey
6www.census.gov/econ/sbo Feb. 8, 2011
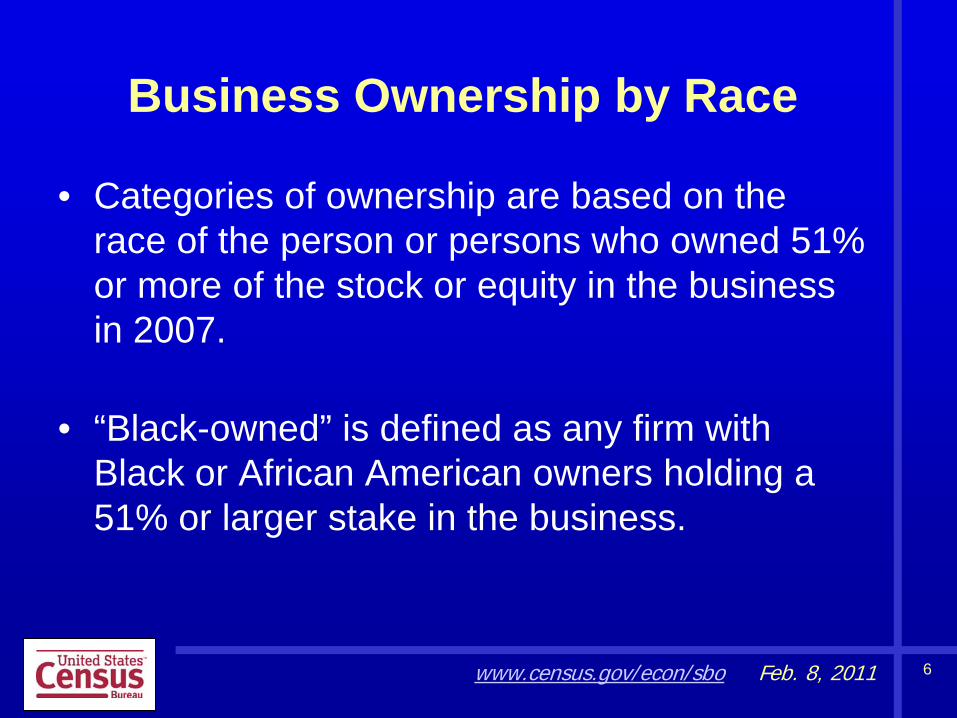
Business Ownership by Race
• Categories of ownership are based on the race of the person or persons who owned 51% or more of the stock or equity in the business in 2007.
• “Black-owned” is defined as any firm with Black or African American owners holding a 51% or larger stake in the business.
7www.census.gov/econ/sbo Feb. 8, 2011
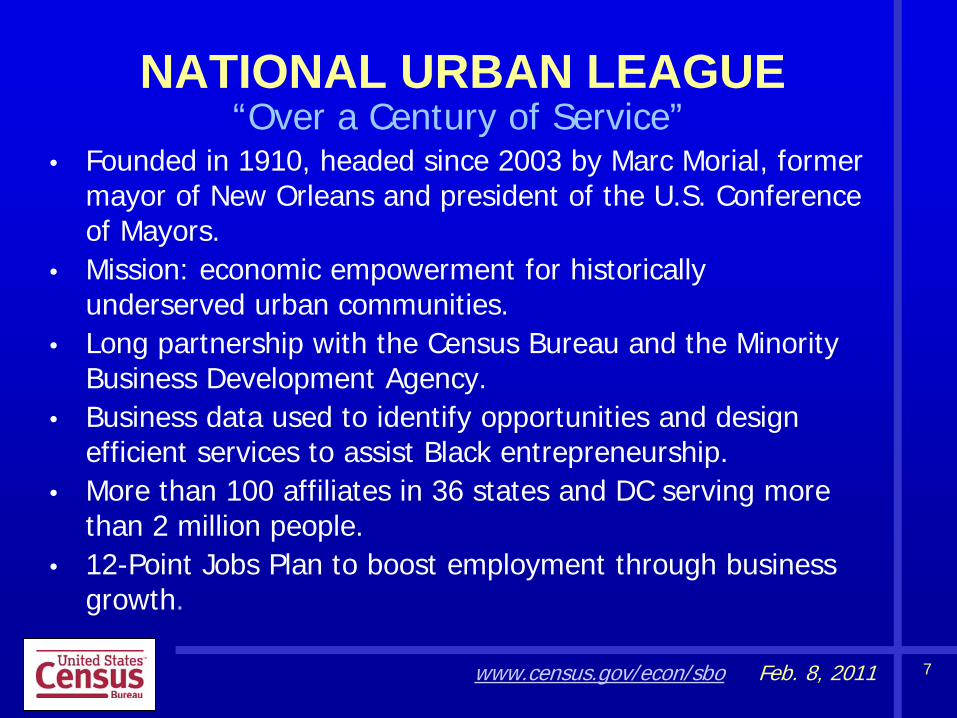
NATIONAL URBAN LEAGUE“Over a Century of Service”
• Founded in 1910, headed since 2003 by Marc Morial, former mayor of New Orleans and president of the U.S. Conference of Mayors.
• Mission: economic empowerment for historically underserved urban communities.
• Long partnership with the Census Bureau and the Minority Business Development Agency.
• Business data used to identify opportunities and design efficient services to assist Black entrepreneurship.
• More than 100 affiliates in 36 states and DC serving more than 2 million people.
• 12-Point Jobs Plan to boost employment through business growth.

8www.census.gov/econ/sbo Feb. 8, 2011
A Look at the 2007 Statisticsfor Black-Owned Businesses
in the United States

9www.census.gov/econ/sbo Feb. 8, 2011
Black-Owned BusinessesCompared to All U.S. Businesses
by Employer Status: 2007Black-owned businesses
All U.S. businesses
Firms(number)
Sales and receipts
($ billions)Firms
(number)
Sales and receipts
($ billions)All firms1 1,921,881 137 27,110,019 30,176
Employer firms 106,824 99 5,752,668 29,203Nonemployer firms 1,815,057 39 21,357,351 973
1 Includes firms with paid employees and firms with no paid employees.Note: Detail may not add to total because of rounding.

10www.census.gov/econ/sbo Feb. 8, 2011
Black Business OwnershipIncreased at Triple the National Rate:
2002 to 2007
Black-ownedfirms in 2007
(number)
% change for Black-owned
firms,2002 – 2007
% change for all
U.S. firms,2002 - 2007
All firms1 1,921,881 60 18Employer firms 106,824 13 4Nonemployerfirms 1,815,057 65 22
1 Includes firms with paid employees and firms with no paid employees.Note: Detail may not add to total because of rounding.

11www.census.gov/econ/sbo Feb. 8, 2011
Black Business RevenuesIncreased Faster than National Rates:
2002 to 2007Black-owned firms’ sales and receipts
in 2007($ billions)
% change for Black-owned
firms’ sales and receipts,
2002 –2007
% change for all U.S. firms’
sales and receipts,
2002 –2007
All firms1 137 55 34Employer firms 99 50 34Nonemployerfirms 39 69 27
1 Includes firms with paid employees and firms with no paid employees.Note: Detail may not add to total because of rounding.
12www.census.gov/econ/sbo Feb. 8, 2011
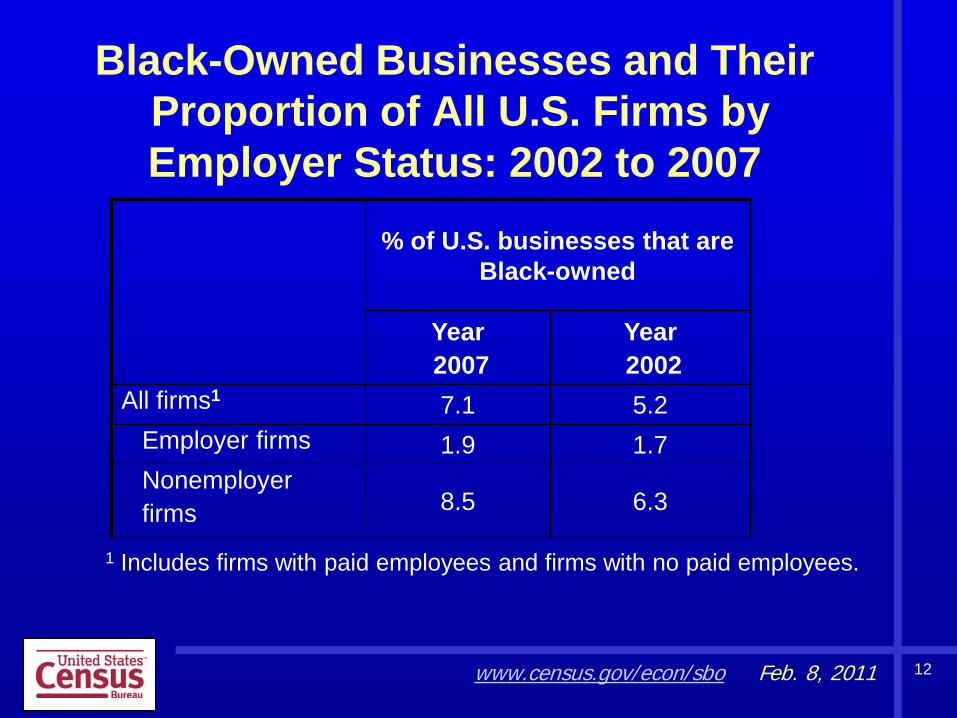
Black-Owned Businesses and TheirProportion of All U.S. Firms byEmployer Status: 2002 to 2007
% of U.S. businesses that are Black-owned
Year2007
Year2002
All firms1 7.1 5.2Employer firms 1.9 1.7Nonemployer firms 8.5 6.3
1 Includes firms with paid employees and firms with no paid employees.

13www.census.gov/econ/sbo Feb. 8, 2011
Distribution of Firms byReceipts Size of Firm: 2007
Receipts size% of Black-
owned firms% of all
U.S. firms
Less than $50,000 87 65
$50,000 to $99,999 6 10
$100,000 to $249,999 4 10
$250,000 to $499,999 1 5
$500,000 to $999,999 1 4
$1,000,000 or more 1 5
Note: Detail may not add to total because of rounding.

14www.census.gov/econ/sbo Feb. 8, 2011
Distribution of Employer Firmsby Employment Size of Firm: 2007
Employment size % of Black-owned firms
% of allU.S. firms
0 to 4 employees1 69 61
5 to 9 employees 16 18
10 to 19 employees 8 11
20 to 49 employees 5 7
50 employees or more 2 4
1 Includes firms with payroll at any time during 2007. Employment reflectsthe number of paid employees during the March 12 pay period.
Note: Detail may not add to total because of rounding.

15www.census.gov/econ/sbo Feb. 8, 2011
Industries With the Highest Numberof Black-Owned Firms: 2007
Business sectors Firms (number)
% of all Black-owned
firmsTotal for all sectors 1,921,881 100
Health care and social assistance 365,140 19Repair and maintenance and
personal and laundry services 358,332 19Administrative and support and
waste management andremediation services 216,742 11

16www.census.gov/econ/sbo Feb. 8, 2011
Industries With the Largest ReceiptsFor Black-Owned Firms: 2007
Business sectors Sales and receipts
($ billions)
% of all Blacksales and receipts
Total for all sectors 137 100Retail trade 21 15Health care and social assistance 17 12Wholesale trade 15 11Construction 13 10Professional, scientific, and technical
services 13 10

Black-Owned Firms by State: 2007
17www.census.gov/econ/sbo Feb. 8, 2011

Percent Change in the Number of Black-Owned Firms by State: 2002 to 2007
18www.census.gov/econ/sbo Feb. 8, 2011
19www.census.gov/econ/sbo Feb. 8, 2011
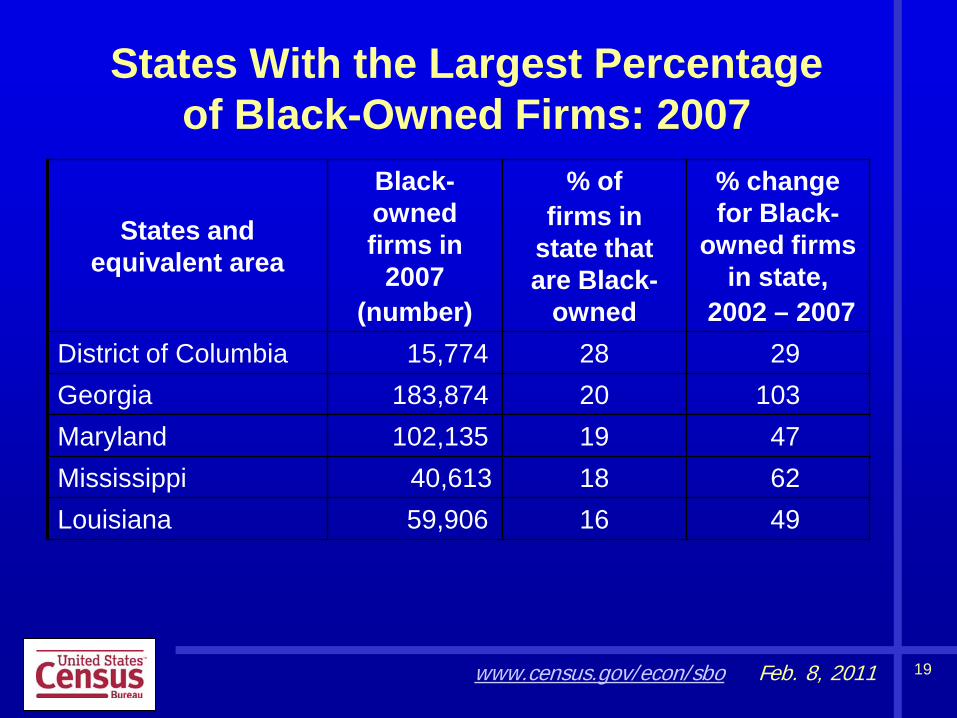
States With the Largest Percentageof Black-Owned Firms: 2007
States and equivalent area
Black-owned firms in
2007(number)
% offirms in
state that are Black-
owned
% change for Black-
owned firms in state,
2002 – 2007District of Columbia 15,774 28 29Georgia 183,874 20 103 Maryland 102,135 19 47Mississippi 40,613 18 62Louisiana 59,906 16 49

20www.census.gov/econ/sbo Feb. 8, 2011
Large Counties With the HighestPercentage of Black-Owned Firms: 2007
Counties and equivalent areas
with a population of at least 500,000
Black-owned firms in
2007(number)
% of firms in county that are Black-
owned
% change for Black-
owned firms in county,
2002 – 2007Prince George’s, MD 39,685 55 40DeKalb, GA 28,959 40 49Baltimore city, MD 14,644 35 50Bronx, NY 38,726 35 64

21www.census.gov/econ/sbo Feb. 8, 2011
Large Cities With the Highest Percentageof Black-Owned Firms: 2007
Cities with a population of at
least 500,000
Black-owned firms in
2007(number)
% of firms in city that are
Black-owned
% change for Black-
owned firms in city,2002 – 2007
Detroit, MI 32,490 64 66Memphis, TN 19,895 38 70Baltimore, MD 14,644 35 50Atlanta, GA 15,738 31 87Washington, DC 15,774 28 29

22www.census.gov/econ/sbo Feb. 8, 2011
Accessing SBO Results
• SBO Web site: www.census.gov/econ/sbo
• For access to prepackaged data products and the ability to build custom tables, visitAmerican FactFinder (AFF), the CensusBureau’s online, self-service data accesstool at www.factfinder.census.gov
23www.census.gov/econ/sbo Feb. 8, 2011
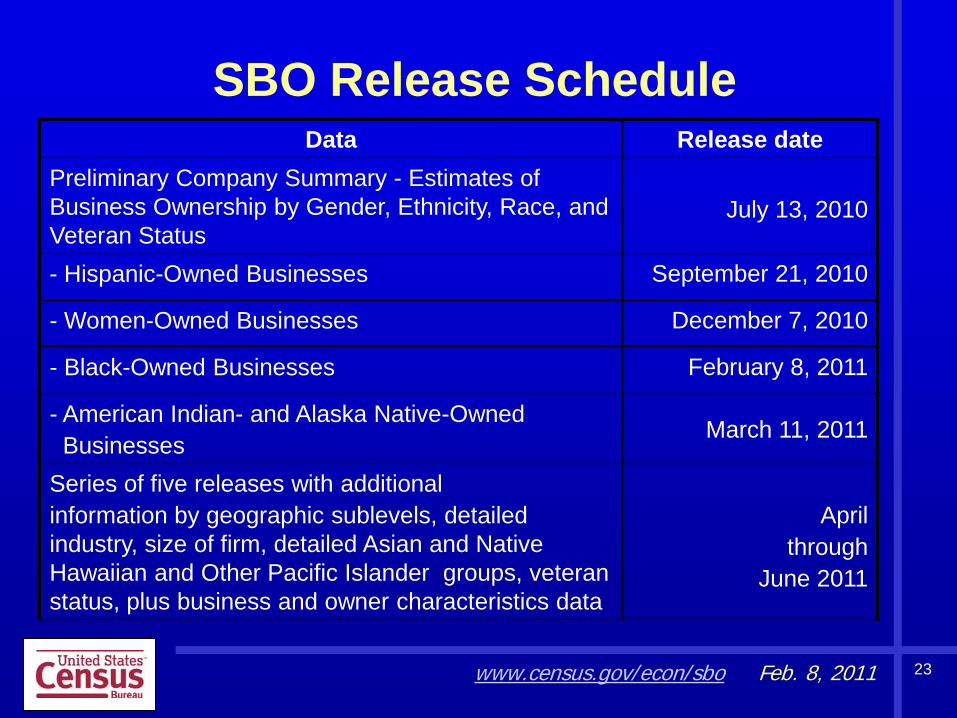
Data Release datePreliminary Company Summary - Estimates of Business Ownership by Gender, Ethnicity, Race, and Veteran Status
July 13, 2010
- Hispanic-Owned Businesses September 21, 2010
- Women-Owned Businesses December 7, 2010
- Black-Owned Businesses February 8, 2011
- American Indian- and Alaska Native-Owned Businesses
March 11, 2011
Series of five releases with additionalinformation by geographic sublevels, detailed industry, size of firm, detailed Asian and Native Hawaiian and Other Pacific Islander groups, veteran status, plus business and owner characteristics data
Aprilthrough
June 2011
SBO Release Schedule

African-American-Owned Firms Outpace Growth of Non-Minority-Owned Firms
U.S. Department of Commerce Minority Business Development Agency
Ivonne Cunarro, Chief Knowledge Management Officer
25
The Big PictureThe African-American business community continues to grow in number at a fast rate, yet their true economic potential is still unrealized.
The fast growing trend of African-American-owned firms continued into the most recent five year period outpacing once again the growth of non-minority-owned firms in gross receipts (55% African-American growth), employment (22%) and number of firms (61%), between 2002 and 2007.
African-American-owned firms are also an engine of job creation, with paid employment growing by 22% from 754,000 workers to 921,000 workers, compared to less than 1% growth for non-minority-owned firms.
Average employment per firm with employees also went up from 8 employees per African American firm with employees in 2002 to 9 employees per firm with employees in 2007.

26
African-American-Owned Firms Outpace Growth of Non-Minority-Owned Firms
55%
21% 22%
0.03%
61%
9%7%
1%
0%
10%
20%
30%
40%
50%
60%
70%
Gross Receipts Employees Number of Firms Population
African American Non-Minority

27
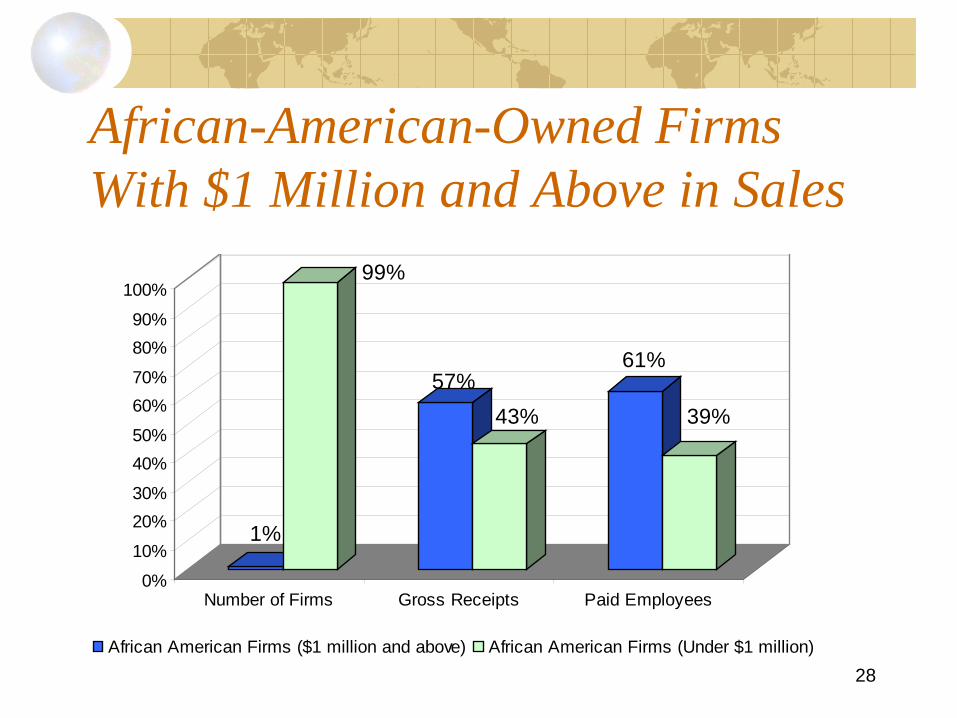
Upside of $1 Million Plus Firms While smaller in number, African American firms with receipts of $1 million or more generate a much larger percentage of all African American revenues and paid employment than firms with receipts under $1 million.
African American firms with receipts of $1 million or more represented 1 percent of all the African American firms but generated 57 percent of all African American firms’ gross receipts and 61 percent of all their paid employment.
There were 14,500 African American firms which generated gross receipts of $1 million or more in 2007. These firms generated combined gross receipts of $79 billion and employed 565,000 workers.
Average gross receipts of African American firms generating sales of $1 million or more grew by 19 percent from $4.6 million per firm in 2002 to $5.4 million in 2007.
28
African-American-Owned Firms With $1 Million and Above in Sales
1%
99%
57%43%
61%
39%
0%
10%
20%30%
40%50%
60%70%
80%90%
100%
Number of Firms Gross Receipts Paid Employees
African American Firms ($1 million and above) African American Firms (Under $1 million)

29
Entrepreneurial ParityAt MBDA, we measure entrepreneurial parity of minority-owned firms. Unfortunately, there is still an entrepreneurial parity gap between African American firms and the share of the African American adult population, which is 12 percent.
If African-American-owned firms would have reached parity with their share of the adult African American population in 2007, there would have been 3.3 million firms (instead of 1.9 million) generating $1.4 trillion in gross receipts (instead of $138 billion), and creating 7.1 million jobs (instead of 921,000).
The faster growing African-American population increased by 7% during this period, compared to only 1% growth for non-minorities. We have to encourage further the growth of African American firms to keep up with the growth of the population.
In addition, the African American population had an estimated purchasing power of about $910 billion, larger than the 2009 estimated purchasing power of all but 16 countries worldwide, including Australia ($824 billion), Taiwan ($717 billion) and the Netherlands ($654 billion).

30
Entrepreneurial Parity Remains Elusive for African American Businesses
$0.137
$1.4
$0.910
0
0.4
0.8
1.2
1.6
2007 Actual 2007 Parity 2009 AfricanAmerican
Buying Power
0.921
7.1
0
2
4
6
8
2007 Actual 2007 Parity
1.9
3.3
0
1
2
3
4
2007 Actual 2007 Parity
Gross Receipts (in $ trillions) Paid Employment (in millions) Number of Firms (in millions)
31
The DownsideWhile African-American-owned firms outpaced the growth of non-minority-owned firms in gross receipts (55% African-American growth), employment (22%) and number of firms (61%), only 6 percent of these firms (107,000) had paid employees and just 14,500 had revenues greater than $1 million.
In addition, the average gross receipts for African-American-owned firms decreased by 3 percent from $74,000 in 2002 to $72,000 in 2007, well below that of non-minority-owned firms ($490,000).
There are approximately 1.9 million sole proprietorships in the African-American business community. MBDAs goal is to help grow those in emerging industries and with the potential for size and scale, as well as encourage job creation among these firms.
As the African-American population increases in the U.S., the success of the African-American business community becomes critical for job creation.

32
Minority-Owned Firms Gross Receipts
Average Gross Receipts
African-American-owned businesses
Minority-owned businesses
Non-minority-owned businesses
$72,000 $179,000 $490,000

33
The FutureMBDA is committed to making sure the growth and competitiveness of the minority business community continues to be a national priority.
MBDA is creating the foundation for the next generation of $100 million minority-owned firms capable of employing the growing minority and U.S. population, expanding our tax base, and securing our position as a global leader.
In fiscal year 2010, MBDA assisted minority owned firms in accessing more than $3.8 billion in contracts and financings, and creating more than 6,200 jobs.
To grow more minority-owned firms to size and capacity, MBDA encourages minority businesses to consider growth by mergers and acquisition, joint ventures and strategic partnerships.

34
Contacting MBDA Public AffairsFor more information, please contact:
Email: [email protected]: 202.482.6272

36www.census.gov/econ/sbo Feb. 8, 2011
Key Upcoming Releases from the U.S. Census Bureau
• 2007 SBO for American Indian- and Alaska Native-Owned Businesses (March)
• 2010 Census Redistricting Files (February –March)

37www.census.gov/econ/sbo Feb. 8, 2011
Contact Information• U.S. Census Bureau
Public Information OfficePhone: 301.763.3030
• National Urban LeagueMedia RelationsPhone: 212.558.5433
• Minority Business Development AgencyPublic Affairs OfficePhone: 202.482.6272