Embed Size (px)
Citation preview

FCA – ORP – AEPT January 12, 2016 1
U.S. Agriculture Exports: Recent Trends and Commodity Exposure to International Trade1
1 This report was prepared by ORP Senior Economist Walt Gardiner. The author wishes to thank Senior Economist Dennis Shields and Chief Economist Stephen Gabriel for reviews and useful comments, and Susan Coleman for the U.S. cropland value map.
Economic Report Office of Regulatory Policy Agricultural and Economic Policy Team
January 12, 2016
Summary U.S. agricultural exports for fiscal year 2015 dropped $12.5 billion, or 8 percent, from the record $152 billion a year earlier. Soybeans, grains and dairy products had the largest declines in value. Lower commodity prices, the strong dollar, slower growth in key countries like China, and trade restrictions contributed to the decline.
In contrast, the strong dollar and the recovering U.S. economy have led to another record level of agricultural imports, resulting in the lowest trade balance (exports less imports) in a decade.
Soybeans account for the largest share of U.S. agricultural exports with around 16 percent, followed by red meats and products (10 percent), animal feeds and oil meals (9 percent), and corn (7 percent).
Commodities with a large share of production that is exported include cotton, walnuts and almonds, with two-thirds or more of production exported in recent years. Among the grains and oilseeds, wheat and soybeans have the largest trade exposure, each with around 47 percent of production exported, followed by rice with 35 percent and corn with just 11 percent.
Author: Walt Gardiner, Senior Economist (703) 883-4056
This is the sixth in a series of reports that looks at the effects of the strong U.S. dollar on international trade and its implications for the agricultural sector and the Farm Credit System. First we will look at the recent trade data for fiscal year 2015 to highlight important changes and identify those commodities most impacted. We then look at the extent to which certain commodities are dependent on foreign sales for a significant share of their production. This can pose both opportunities and risks for producers of trade- dependent commodities as well as for those System institutions which have significant loan concentrations in these commodities.
U.S. Agricultural Exports Fall, Imports Continue to Set Records After reaching a record $152.3 billion in fiscal 2014 (Oct. 2013-Sep. 2014), U.S. agricultural exports dropped $12.5 billion, or about 8 percent, in fiscal 2015 to $140 billion. This is the largest decline since fiscal 2009 at the height of the global recession when U.S. agricultural exports fell $18.6 billion, or 16 percent. The decline is attributed to lower commodity prices, erosion of U.S. competitiveness due to the strong dollar, diminishing foreign demand due to slower economic growth, especially in China, and trade restrictions. The U.S. commodities with the largest drop in export value in fiscal 2015 were soybeans (-$2.5 billion), wheat (-$2.4 billion), corn (-$2.3 billion), and dairy products (-$1.8 billion). On a volume basis, U.S. exports of feeds and fodders
FCA – ORP – AEPT January 12, 2016 2
for livestock consumption abroad were down 6.3 million metric tons, wheat was down 5.9 million metric tons, and corn was down 3.9 million tons. In contrast, soybean exports were up 5.2 million metric tons, indicating that the per unit value or export price of soybeans dropped by a greater percentage than the volume increase for the export value to have dropped. The strong dollar, as discussed in previous reports in this series, makes our farm products more expensive to foreign buyers when prices in dollars are converted to their currency, leading to reduced U.S. exports as foreign buyers switch to other cheaper suppliers like Brazil, Argentina and Ukraine. The outlook, according to USDA (Dec. 1), is for exports to fall again in fiscal 2016 to $131.5 billion, a decline of 6 percent from 2015’s level.
In contrast, the U.S. continues to set new records for imports of agricultural products, as the strong dollar makes foreign-produced commodities cheaper for American consumers, thus stimulating more imported products, some of which compete with American products. U.S. agricultural imports are estimated to have increased 4 percent to a record $114.1 billion in fiscal 2015, and are projected to rise another 7 percent to another record $122 billion in fiscal 2016. The net effect of these adjustments is a sharp drop in the U.S. agricultural trade balance (that is, exports minus imports), which is on track to fall to a surplus of just $9.5 billion for fiscal 2016, the lowest level in more than a decade.
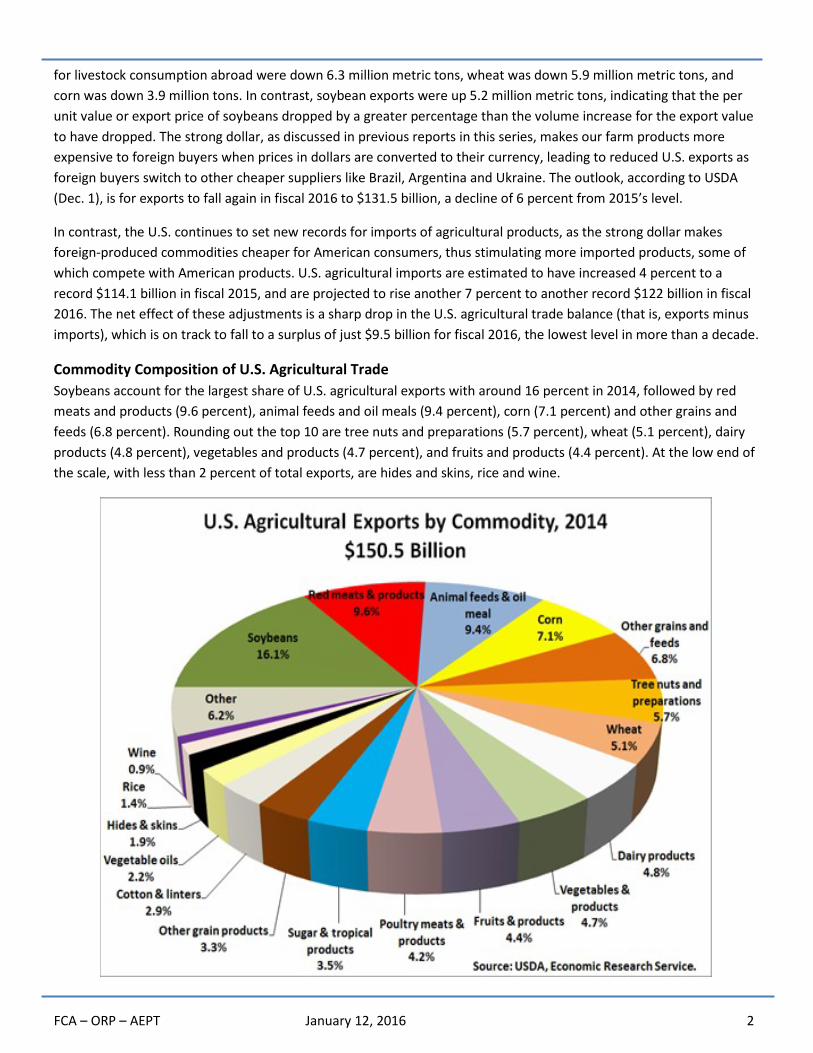
Commodity Composition of U.S. Agricultural Trade Soybeans account for the largest share of U.S. agricultural exports with around 16 percent in 2014, followed by red meats and products (9.6 percent), animal feeds and oil meals (9.4 percent), corn (7.1 percent) and other grains and feeds (6.8 percent). Rounding out the top 10 are tree nuts and preparations (5.7 percent), wheat (5.1 percent), dairy products (4.8 percent), vegetables and products (4.7 percent), and fruits and products (4.4 percent). At the low end of the scale, with less than 2 percent of total exports, are hides and skins, rice and wine.

FCA – ORP – AEPT January 12, 2016 3
U.S. Agriculture’s Exposure to the International Marketplace Export markets are an important source of income for many U.S. agricultural producers, as foreign destinations represent significant outlets for U.S. farm production. The following chart shows the average percent of production for crop and livestock products that was exported for the three year period 2012-2014. There were three commodities (cotton, walnuts and almonds) with at least two-thirds of their production exported and six commodities with a third to one-half or their production exported, ranging from rice with around 35 percent to nonfat dry milk with 52 percent. At the opposite end of the scale, exports of commodities such as butter, cheese, eggs and sugar account for less than 10 percent of production. Among the grains and oilseeds, wheat and soybeans have the largest trade exposure with around 47 percent of their respective production exported on average for the three marketing years 2012/2013 to 2014/15, followed by rice with 35 percent of production exported. The export share of corn production was the lowest among the major grains at just 11 percent today versus 20 percent for the 2006/07 marketing year.
U.S. Farmers’ Trade Exposure: Soybeans Rising, Corn Declining, Wheat Fluctuating, Rice Stable The most recent three-year period masks some years of even greater exposure for some commodities to the international market. The following chart shows annual trends in export’s share of production for major grains and soybeans from the 2000/2001 marketing year through the 2014/2015 marketing year. The share of U.S. wheat production that is exported has fluctuated widely since 2006/2007, ranging from a low of just under 40 percent to a high of slightly above 60 percent. U.S. wheat faces stiff competition on the world market from major exporters like the European Union (EU), Canada and Australia.2
2 Trade figures for foreign countries in this report from USDA’s Foreign Agricultural Service, Production, Supply and Distribution Data Sets.
For the 2014/2015 marketing year, the U.S. fell from the leading wheat

FCA – ORP – AEPT January 12, 2016 4
exporter to third place with 14 percent of world wheat trade, while the EU led with around 22 percent of the total followed by Canada with around 15 percent. Australia was in fourth place with 10 percent.
The share of U.S. soybean production that is exported has been trending up since the mid-2000s, rising from just under 31 percent in 2005/2006 to a high of nearly 49 percent for 2013/2014. Strong demand from China is largely responsible for this rising trend. Other major importers include the EU, Mexico and Japan where domestic consumption has been outstripping production for some time. Competing exporters include Brazil with 41 percent of world total (now slightly ahead of the U.S. with 40 percent) and Argentina with nearly 8 percent of the total.
The share of corn production that is exported has declined sharply since peaking at 20 percent for the 2006/2007 marketing year, dropping below 7 percent for 2012/2013. The downward trend is primarily due to the Renewable Fuels Standard which requires increasing quantities of ethanol (mostly made from corn) to be blended with unleaded gasoline to reduce U.S. dependence on imported oil (Gehlhar and others). This has resulted in less corn available for both export markets and the domestic livestock industry. The sharp drop in 2012/2013 was due mostly to the drought-reduced harvest in 2012; however, corn’s export share has rebounded somewhat in the past two years to around 13 percent, reflecting a recovery in export volume to more normal levels and a leveling out of ethanol production from corn.
The share of U.S. rice that is exported has remained fairly stable over the past 15 years, fluctuating between 30 and 40 percent, with about a third of the U.S. crop exported during the past two years. The U.S. accounts for only about 7 percent of the world rice trade, with Thailand and India trading positions as the top exporter, each with around a quarter of the trade. China is the world’s leading rice importer with around 11 percent of the total, followed by Nigeria with around 9 percent.

FCA – ORP – AEPT January 12, 2016 5
The U.S. Livestock Industry Expands International Presence Over the past 15 years, the U.S. livestock industry has been gaining increased access to the international market with a growing share of its production destined for foreign supermarkets and restaurants. Since 2000, the export share of production increased to as high as 23 percent for pork, nearly 20 percent for poultry, 14 percent for turkey, and nearly 11 percent for beef. Factors driving this expansion into foreign markets include: • Rising population and incomes in developing countries. • Reduced trade barriers from the bilateral and multilateral trade agreements (WTO). • A strong preference for high quality U.S. meat products. • A decline in the value of the U.S. dollar against the currencies of key trading partners, at least until mid-2014.
U.S. Pork Industry is the World Leader in Meat Trade Among the meat sectors, the U.S. pork industry has shown the sharpest expansion in the share of its production that is exported, starting from less than 7 percent in 2000 and growing to as high as 23 percent in 2011 and 2012. The U.S. is the world’s leading pork exporter with 2.4 million tons sold abroad, or nearly a third of the world’s total in 2014. Major competitors include the EU, which is closely behind the U.S. with 32 percent of the world pork trade and Canada with nearly 18 percent. Top importers include Japan which accounts for about 21 percent of world pork trade, followed by Mexico with 13 percent and China with 12 percent. Russia, once the world’s second largest importer of pork products, with nearly 16 percent of the world total as recently as 2012, has seen its share drop by half to just 8 percent for 2014 and is expected to drop further in 2015. Russia is beset with severe economic problems because of the sharp drop in oil prices, a major foreign exchange earner, and the high cost of its military campaigns in Ukraine and Syria. Russia currently has an import ban on U.S. and EU pork products in retaliation for those countries’ economic sanctions on Russia in response to its military interventions in Ukraine.

FCA – ORP – AEPT January 12, 2016 6
3 It's called “mad cow disease” because it affects a cow's nervous system, causing the brain to waste away resulting in the cow losing control of its ability to do normal things, like walking or standing up. There have only been four cases of BSE in the United States. A person who eats meat from a BSE-infected cow is at risk of getting a human form of the disease, called variant Creutzfeldt-Jakob disease, or vCJD. It is a serious disease that affects the brain and eventually leads to death, but is very rare in the United States. Only three people in the United States have ever gotten the disease.
U.S. Broiler Industry Faces Stiff Competition and Trade Restrictions Abroad The export market is also a significant source of income for the U.S. broiler industry. The broiler industry has the second largest exposure to foreign markets within the U.S. meat trade today with over 19 percent of production exported in recent years. However, this industry had already seen its exports reach 18 percent of its production in 2001, only to see this share erode to around 14 percent by 2004 and remain low as exports declined while domestic broiler production continued to boom. It wasn’t until 2008 that the broiler export share eclipsed its former high mark. Two major developments in the international poultry market led to the decline or sluggish growth in U.S. poultry exports from 2002 to 2007: the rapid increase in poultry production and meat exports from Brazil; and a sharp decrease in imports by Russia as it expanded its own production base and in turn reduced its tariff rate quota on imports.
The United States experienced a drop in poultry exports in 2015 as a result of bans on U.S. poultry products by most importers in response to the avian flu outbreaks that were first detected in U.S. domestic poultry operations beginning in December 2014 and continued into mid-June 2015 (CDC). During that time the avian flu was detected in 21 U.S. states (15 states with outbreaks in domestic poultry or captive birds and 6 states with H5 detections in wild birds only). It is possible that another round of bird flu could occur in the winter of 2016. Surveillance for bird flu is ongoing.
The U.S. ranks second to Brazil in world broiler meat trade, with 32 percent of world total for 2014 versus 34 percent for Brazil. The EU is the third largest exporter with just under 11 percent of the total. Top importers of broiler meat include Japan with 10 percent of the trade in 2014, followed by Saudi Arabia with nearly 9 percent, then Iraq, Mexico and the EU, each with around 8 percent of global imports.
U.S. Turkey Industry has Shown Slow but Steady Expansion into the Export Market The U.S. turkey meat industry has shown a relatively steady expansion into the international arena over the past 15 years, with exports as a share of production rising from less than 9 percent in 2000 to more than 14 percent in recent years. This is the result of exports rising faster than production due to successful marketing efforts by U.S. companies and strong foreign demand for U.S. turkey products.
Around 18 percent of the turkey meat produced worldwide is traded, according to industry analysts (USDA-FAS). The U.S. is the world’s leading producer and exporter of turkey meat, followed by Brazil and the EU, accounting for 53 percent, 22 percent and 21 percent of global export volume, respectively, for the 2012-2014 period. Principal importers of turkey meat include Mexico with around 47 percent of world total imports, followed by the EU with around 24 percent, and China with 11 percent.
U.S. Beef Sector Crawls Back from Major Import Ban from Single Case of “Mad Cow Disease” The U.S. beef sector, which once had the second largest export presence behind broilers, has dropped to fourth place among the major meat categories with 10.5 percent of production exported in 2014. This matches the 10.5 percent reached in 2011 and is only a percentage point above the 9.5 percent of production that was exported in 2003 before plummeting to just 1.9 percent in 2004. The sharp drop in U.S. beef exports in 2004 and the painfully slow recovery was the result of a near global ban on U.S. beef in response to the discovery of a single cow on a Washington State dairy farm in late December 2003 infected with bovine spongiform encephalopathy (BSE), commonly referred to as “Mad Cow Disease.”3 The infected cow was imported from Canada by a Washington dairy farmer. As a result of the ban on
FCA – ORP – AEPT January 12, 2016 7
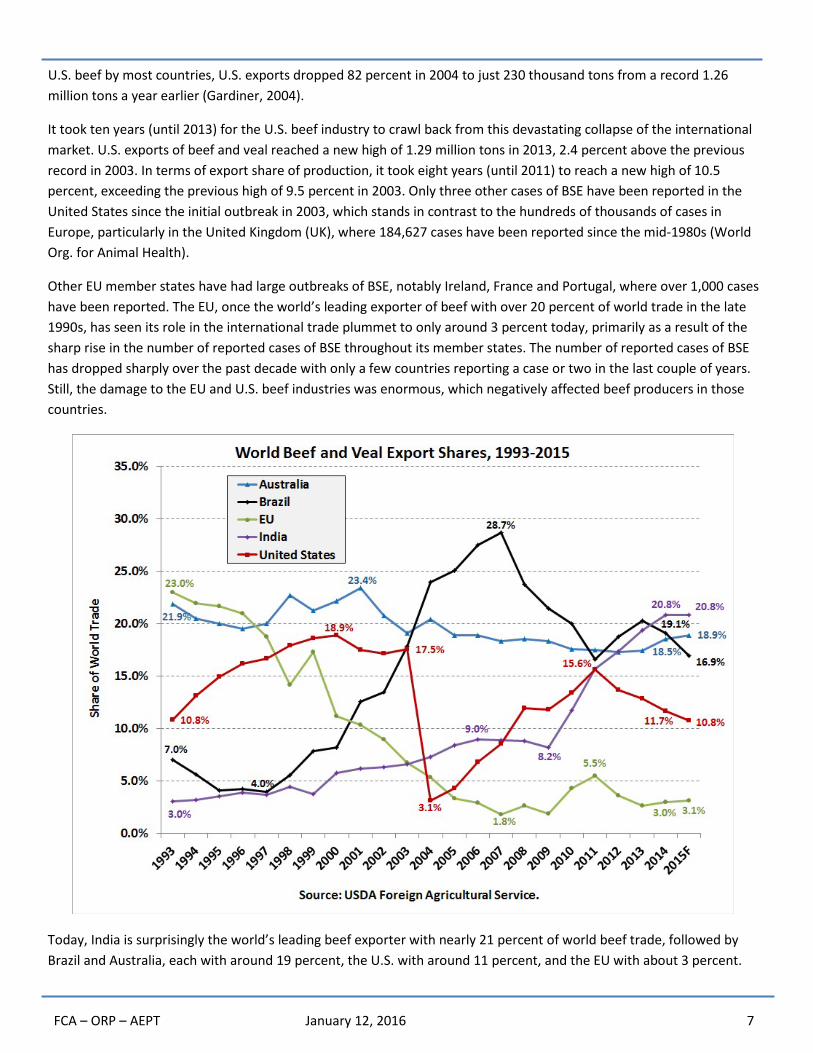
U.S. beef by most countries, U.S. exports dropped 82 percent in 2004 to just 230 thousand tons from a record 1.26 million tons a year earlier (Gardiner, 2004).
It took ten years (until 2013) for the U.S. beef industry to crawl back from this devastating collapse of the international market. U.S. exports of beef and veal reached a new high of 1.29 million tons in 2013, 2.4 percent above the previous record in 2003. In terms of export share of production, it took eight years (until 2011) to reach a new high of 10.5 percent, exceeding the previous high of 9.5 percent in 2003. Only three other cases of BSE have been reported in the United States since the initial outbreak in 2003, which stands in contrast to the hundreds of thousands of cases in Europe, particularly in the United Kingdom (UK), where 184,627 cases have been reported since the mid-1980s (World Org. for Animal Health).
Other EU member states have had large outbreaks of BSE, notably Ireland, France and Portugal, where over 1,000 cases have been reported. The EU, once the world’s leading exporter of beef with over 20 percent of world trade in the late 1990s, has seen its role in the international trade plummet to only around 3 percent today, primarily as a result of the sharp rise in the number of reported cases of BSE throughout its member states. The number of reported cases of BSE has dropped sharply over the past decade with only a few countries reporting a case or two in the last couple of years. Still, the damage to the EU and U.S. beef industries was enormous, which negatively affected beef producers in those countries.
Today, India is surprisingly the world’s leading beef exporter with nearly 21 percent of world beef trade, followed by Brazil and Australia, each with around 19 percent, the U.S. with around 11 percent, and the EU with about 3 percent.
FCA – ORP – AEPT January 12, 2016 8
Most of India’s beef exports come from water buffalo, a member of the bovine family classified as beef by the USDA (CNN).
The U.S. continues to be the world’s largest beef importer, accounting for 15 percent of global trade for the 2012-2014 period, which is projected to reach 21 percent for 2015. The U.S. share has been as high as 27 percent back in 2004 and has been as low as 13.6 percent as recently as 2013. Russia is the second largest beef importer with a little less than 14 percent of the world total for 2012-2014, followed by Japan with around 10 percent. China’s share of imports averaged 4.1 percent of the world total for 2012-2014 but is projected to reach nearly 8 percent for 2015 (FAS).
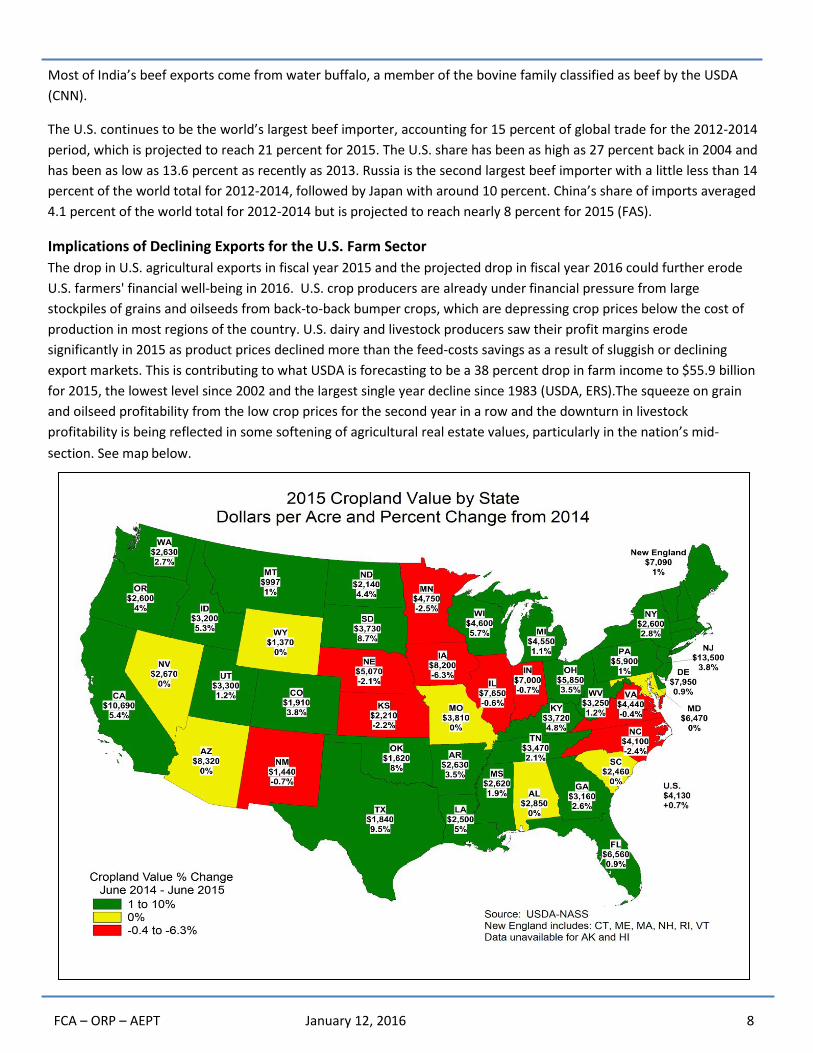
Implications of Declining Exports for the U.S. Farm Sector The drop in U.S. agricultural exports in fiscal year 2015 and the projected drop in fiscal year 2016 could further erode U.S. farmers' financial well-being in 2016. U.S. crop producers are already under financial pressure from large stockpiles of grains and oilseeds from back-to-back bumper crops, which are depressing crop prices below the cost of production in most regions of the country. U.S. dairy and livestock producers saw their profit margins erode significantly in 2015 as product prices declined more than the feed-costs savings as a result of sluggish or declining export markets. This is contributing to what USDA is forecasting to be a 38 percent drop in farm income to $55.9 billion for 2015, the lowest level since 2002 and the largest single year decline since 1983 (USDA, ERS).The squeeze on grain and oilseed profitability from the low crop prices for the second year in a row and the downturn in livestock profitability is being reflected in some softening of agricultural real estate values, particularly in the nation’s mid- s ection. See map below.
FCA – ORP – AEPT January 12, 2016 9
Using data from USDA’s August 2015 Land Values report, overall, U.S. cropland values on average increased by just 0.7 percent for 2015, compared with increases of 13.7 percent for 2013 and 7.6 percent for 2014. However, in the Corn Belt region, cropland values decreased on average by 2.3 percent for 2015, with Iowa cropland values dropping 6.3 percent. This compares with increases of 8.2 percent and 9.4 percent, respectively, for 2014 (USDA, NASS).
References Cable News Network (CNN). “Holy cow! India is the world's largest beef exporter,” CNN Money, Aug. 5, 2015. Link
Centers for Disease Control (CDC). “Avian Influenza: H5 Viruses in the United States.” Link
Gardiner, Walter. “BSE in the United States, Board Briefing,” Feb. 10, 2004.
Gardiner, Walter. “The Importance of Agriculture Exports to U.S. Trade and the Farm Economy,” FCA Economic Briefing, ORP-AEPT, Sept. 9, 2015. Link
Gardiner, Walter. “U.S. Agricultural Exports: Key Destinations and Country Concentration Risk,” FCA Economic Briefing, ORP-AEPT, Sept. 29, 2015. Link
Gardiner, Walter. “U.S. Agricultural Trade: Recent Developments and Outlook,” FCA Economic Briefing, ORP-AEPT, Sept. 25, 2015. Link
Gehlhar, Mark, Ashley R Winston, and Agapi Somwaru. “Effects of Increased Biofuels on the U.S. Economy in 2022." U.S. Dept. of Agriculture, Economic Research Service,” Economic Research Report No. (ERR-102), October 2010. Link
U.S. Dept. of Agriculture (USDA), Economic Research Service (ERS). “Farm Sector Profitability Expected To Weaken in 2015.”
U.S. Dept. of Agriculture (USDA), Economic Research Service (ERS). “Outlook for U.S. Agricultural Trade,” Dec. 1, 2015. Link
U.S. Dept. of Agriculture (USDA), Foreign Agricultural Service (FAS). “Commodities & Products, Poultry and Eggs.” Link
U.S. Dept. of Agriculture (USDA), Foreign Agricultural Service (FAS). “Production, Supply and Distribution Data.” Link
U.S. Dept. of Agriculture (USDA), National Agricultural Statistics Service (NASS). “Land Values 2015 Summary,” Aug. 5, 2015.
World Organization for Animal Health (OIE for original Office International des Epizooties). “Number of Reported Cases of Bovine Spongiform Encephalopathy (BSE) in Farmed Cattle Worldwide.” Link
World Trade Organization (WTO). “Understanding The WTO: The Uruguay Round.” Link