Embed Size (px)
Citation preview

0
U.S. Agricultural Supply Chains and Trade with Mexico
CNAS Report 2017-2
December 2017
Luis A. Ribera, Texas A&M AgriLife Extension Service Flynn J. Adcock, Texas A&M AgriLife Research
C. Parr Rosson, III, Texas A&M University
Author Contact: Luis A. Ribera, [email protected], 979-845-3070.
USDA Contact: Delmy L. Salin, [email protected], 202-720-0833. Recommended Citation: Ribera, Luis A., Adcock, Flynn J., and C. Parr Rosson, III. U.S. Agricultural Supply Chains and Trade with Mexico. Publication Number CNAS Report 2017-2. December 2017. Posted at http://cnas.tamu.edu. Acknowledgements: This work was supported by Cooperative Agreement Number No. 15-TMXXX-TEXAS-0007 with the Agricultural Marketing Service of the U.S. Department of Agriculture. Disclaimer: The opinions and conclusions expressed do not necessarily represent the views of the U.S. Department of Agriculture or the Agricultural Marketing Service.

i
TABLE OF CONTENTS
Executive Summary ........................................................................................................................ ii
Introduction ..................................................................................................................................... 1
U.S. Supply Chains for Corn, Rice, Grain Sorghum and Cotton.................................................... 2
Corn ............................................................................................................................................ 2
Rice ............................................................................................................................................. 5
Grain Sorghum ........................................................................................................................... 9
Cotton ....................................................................................................................................... 12
Major Crossings and Trade Flows at the U.S.-Mexico Border ..................................................... 15
Recent U.S.-Mexico Trade Patterns .............................................................................................. 17
U.S. Exports of Corn, Rice and Grain Sorghum to Mexico ..................................................... 17
U.S. Exports of Cotton to Mexico ............................................................................................ 21
U.S. Exports of Fresh Produce to Mexico ................................................................................ 22
U.S. Imports of Fresh Produce from Mexico ........................................................................... 23
Trade Simulation Results by Border State and Major Land Port ................................................. 26
Corn Exports ............................................................................................................................. 27
Rice Exports ............................................................................................................................. 32
Grain Sorghum Exports ............................................................................................................ 34
Cotton Exports .......................................................................................................................... 35
Fresh Produce Exports .............................................................................................................. 36
Fresh Produce Imports .............................................................................................................. 38
Summary and Conclusions ........................................................................................................... 39
References ..................................................................................................................................... 40
Appendix: Simulation Results for Estimated Trade Flows with Mexico of Selected
Commodities by State and by Port ........................................................................................... 41

ii
U.S. Agricultural Supply Chains and Trade with Mexico
Executive Summary What Is the Issue? Historically, the United States and Mexico have had a strong trading relationship in most sectors, including agricultural and food products. The 1994 implementation of the North American Free Trade Agreement (NAFTA) served to increase trade flows. Presently, Mexico is a major market for U.S. agricultural and food products; including corn, rice, grain sorghum and cotton. There is also significant two-way trade between the two countries in fresh fruits and vegetables. In 2016, corn exports to Mexico and produce imports from Mexico were at record highs, while rice and cotton exports were lower than recent annual averages. Grain sorghum exports were also beginning to rebound after two years of low volume. Nearly all fresh fruit and vegetable trade with Mexico and cotton exports to Mexico occur over land borders by truck. About 58 percent of corn, 31 percent of rice, and all grain sorghum exports are shipped via rail or truck. Given this high volume of trade occurring over the U.S.-Mexico border, it is important to ensure that land-border transportation systems function efficiently and consistently. This study investigated the supply chains for selected U.S. agricultural products and the trade of these products with Mexico. The results of the study are discussed as follows:
U.S. supply chains for corn, rice, grain sorghum and cotton, which are included in an effort to better identify methods of improving product flows; and
U.S.-Mexico trade patterns and analysis for corn, rice, grain sorghum, cotton, and fresh produce, including forecast ranges for future trade trends.
What Did the Study Find? Midwestern states produced the majority of U.S. corn, led by Iowa, Illinois, Nebraska, Minnesota, and Indiana. In 2016, U.S. corn production was 385 million metric tons (MMT), or about 15.1 billion bushels (bu). A little less than half was used for food, seed, or industrial (FSI) uses, with slightly more than a third used for animal feeding. About 14 percent of U.S. corn production was exported each year. In 2016, the top markets for U.S. corn exports were Mexico and Japan, at 13.8 MMT and 11.9 MMT, respectively. Most U.S. corn exports to Mexico were shipped via land (58 percent in 2016). Laredo, Texas, was the most important land port for these corn exports (4.0 MMT in 2016), followed by Eagle Pass, Texas (2.83 MMT) and El Paso, Texas (703.6 thousand metric tons (TMT)). For land

iii
routes, most corn exports were transported by rail. Simulation results indicated that corn exports to Mexico through Texas and California will likely grow, but decrease through Arizona. Presently, the major U.S. rice producing states are Arkansas, California, Louisiana, Texas, Missouri, and Mississippi. From 2014 to 2016, these states produced an average of 9.7 MMT of rice per year, or 213.2 million hundredweight (cwt). A little more than half of U.S. rice production was consumed domestically and the remainder was exported. Mexico, Haiti, and Japan were the three largest markets for U.S. rice exports. U.S. rice exports to Mexico grew from 261.3 TMT in 1994, to a peak of 908.2 TMT in 2011 before declining to 854.0 TMT in 2016. While most of these rice exports were transported via sea, slightly more than 20 percent were shipped via truck and about ten percent moved by rail. Laredo accounted for about 75 percent of paddy rice exports to Mexico. Laredo (34.1 TMT), Otay Mesa, California (20.5 TMT), and Eagle Pass (16.8 TMT) were important for milled rice exports as well. Simulation results indicated that rice exports had a high probability of increasing through California and Arizona, but will likely decrease through Texas. From 2014 to 2016, Kansas and Texas produced the vast majority of U.S. grain sorghum; combining for an average of 76.4 percent of total U.S. production. In 2016, total U.S. grain sorghum production was 12.2 MMT, or 480.3 million bu. About one-half of grain sorghum production was used domestically; split closely between feed and FSI uses. The other half was exported, mostly to China in recent years, followed by Mexico. Grain sorghum exports to Mexico grew from 3.5 MMT in 1994 to 5.1 MMT in 2011, before falling continuously—and then sharply in 2014—to 74.3 TMT, due to increased purchases from China. In 2016, grain sorghum exports to Mexico rebounded somewhat to 666.3 TMT. All shipments now travel by land, with the border crossing in Progreso, Texas, capturing nearly 70 percent of these truck shipments. Grain sorghum exports will likely drop slightly relative to the 2006–2016 trend based on simulation results. Cotton is a southern U.S. crop. Texas often produces 45 percent or more of the crop. When combined with Georgia and Mississippi, the three states produce two-thirds of all U.S. cotton. Depending on the year, 70 percent or more of U.S. cotton production is exported. Vietnam, Turkey, China, Indonesia and Mexico are the leading foreign markets for U.S. cotton. Cotton exports to Mexico are shipped primarily via land ports. Almost all exports have been shipped via truck in recent years. Since 2009, the Texas ports of Pharr and Laredo have accounted for more than 90 percent of cotton exports to Mexico. In recent years, they accounted for 99 percent of such exports. Simulation results show that cotton exports to Mexico are forecast to slightly increase through 2021.

iv
In 2016, U.S. fresh produce exports to Mexico were 644.9 TMT and valued at $602.2 million. Slightly more than one-third of both export volume and value consisted of apples. Other important fresh produce exports to Mexico included potatoes, pears, onions, grapes, citrus, peaches, melons and strawberries. The Otay Mesa and the Nogales, Arizona, crossings accounted for most of these fresh produce exports to Mexico. The Calexico East, California, crossing has also maintained a significant share. Fresh fruit and vegetable exports are forecast to increase across all states and most major ports based on simulation results. During 2016, U.S. imports of produce and products from Mexico (including fresh, frozen and processed fruits, vegetables and nuts) totaled $12.0 billion. About 98 percent of these imports entered the United States by land ports in Texas, New Mexico, Arizona, and California. Nearly all of these imports were via truck. When considering only fresh fruits and vegetables, which are nearly 90 percent of the total, imports totaled $10.7 billion, or about 8.4 MMT. Imports are also forecast to increase across all states and most major ports. How Was the Study Conducted?
The main objective of this project was to identify infrastructure needs at the U.S.-Mexico border in order to enhance the competitiveness of U.S. agricultural exporters in the region. To accomplish this goal, several approaches were used:
we described U.S. supply chains for corn, rice, grain sorghum and cotton, including growing regions, domestic uses and export destinations;
our study identified recent land border flows in U.S. corn, rice, grain sorghum, cotton and fresh produce trade with Mexico; and
we developed a risk-based simulation model for each commodity based on 2006–2016 data to forecast export scenarios for 2017–2021.
The data were gathered from several sources, including government agencies databases and reports, trade organizations, and private sector firms. Data collected were from:
Global Agricultural Trading System (GATS), USDA/Foreign Agricultural Service (FAS);
USDA Agricultural Marketing Service Specialty Crop Reports; USDA Animal and Plant Health Inspection Service; WISERTrade; and USDA National Agricultural Statistical Service. These data validated trade volumes and
entry points for exports from the United States into Mexico.

1
U.S. Agricultural Supply Chains and Trade with Mexico
Introduction The United States and Mexico have a historically strong trading relationship in most
product sectors, including agricultural and food products. In fact, bilateral agricultural trade between the United States and Mexico continues to increase, reaching $40.8 billion in 2016; a 255 percent increase since 2000. Within this total were U.S. agricultural and food exports to Mexico of $17.8 billion, and imports from Mexico into the United States of $23.05 billion (Figure 1).
Figure 1.
Among the important U.S. agricultural exports to Mexico were corn, rice, grain sorghum,
cotton, and fruits and fresh vegetables, such as apples, pears, grapes, potatoes and onions. Important U.S. imports from Mexico included a wide variety fresh fruits and vegetables, such as tomatoes, peppers, avocados, watermelons, cucumbers and limes. While about 40 percent of U.S. corn exports and two-thirds of U.S. rice exports to Mexico used sea transportation, the remainder of corn and rice exports, virtually all grain sorghum exports, and a vast majority of fruit and vegetable exports and imports utilized land ports in Texas, New Mexico, Arizona and California.
U.S. Agricultural and Food Trade with Mexico, Billion Dollars
$6.4 $7
.4
$7.2 $7
.9 $8.5 $ 9
.4 $ 10.
9 $12.
7
$15 .
5
$12.
9 $14 .
6
$18.
4
$18.
9
$18.
1
$19.
4
$ 17.
7
$17.
8
$5.1
$5.3
$5.5 $6
.3 $7.3 $8
.3 $9.4 $1
0.2
$10.
9
$11.
4 $13.
6 $ 15.
8
$16.
4
$17.
7 $19 .
3 $21 .
0 $23.
0
2000 2004 2008 2012 2016$0.0
$5.0
$10.0
$15.0
$20.0
$25.0
Billion Dollars
U.S. Exports to Mexico
U.S. Imports from Me xico
Source: GATS, FAS/USDA

2
U.S. Supply Chains for Corn, Rice, Grain Sorghum and Cotton
This section provides descriptions of the supply chains for corn, rice, grain sorghum and cotton so that improved areas of efficiency can be identified. The supply chains developed focus on states with significant production and major U.S. and export markets. Some products will have more links in the supply chain than others. Corn Midwestern states produce the vast majority of U.S. corn. Iowa, Illinois, Nebraska, Minnesota, and Indiana are the five-leading corn producing states and account for about 61 percent of production each year. Furthermore, South Dakota, Kansas, Wisconsin, Missouri, and Ohio account for another 21 percent annually. The top-ten corn producing states account for 82 percent of U.S. corn production, which amounted to about 385 million metric tons (MMT) in 2016, or about 15.1 billion bushels (bu).1 While Figure 2 shows the top-15 corn producing states, another 24 states have commercial corn production of between 100 thousand metric tons (TMT) and 3.2 MMT.
Figure 2.
1 A metric ton (MT) of corn is equal to 39.37 56-pound bushels of corn.

3
In 2016, about half of U.S. corn production was used for food, seed, or industrial (FSI) use. The vast majority was utilized in the production of fuel ethanol. Most ethanol production occurred in the same general areas as corn production. For instance, the top-five corn-producing states of Iowa, Illinois, Nebraska, Minnesota and Indiana accounted for 64 percent of U.S. ethanol production. Furthermore, the top-10 corn producing states accounted for about 82 percent of corn production and 81 percent of ethanol production. Most of the corn used for ethanol remains relatively close to the producing farm before being processed; typically, within 100 miles. In recent years, another 36–38 percent of U.S. corn production was used for animal feeding. This corn was mainly fed to cattle, but also used as ingredients in feed for other animals such as swine and poultry. Texas, Nebraska, Kansas, Colorado and Iowa were the five largest cattle feeding states in the United States; accounting for a monthly average of 8.4 million head on feed, or 82 percent of the U.S. monthly average number of cattle on feed. Nebraska, Kansas, and Iowa are each in the top-ten corn producing states and so corn used for cattle feeding in those states likely does not have to travel very far. While both Texas and Colorado produce corn, neither produce enough to meet their cattle feeding needs and, as a result, must ship corn in from other corn producing states. California, Arizona, Idaho, and Washington also feed significant numbers of beef cattle but have relatively little in-state corn production. Feedlots in those states must bring in corn from further distances. Finally, about 13–15 percent of U.S. corn production was exported each year (55.8 MMT in 2016). In 2016, the major markets for U.S. corn exports were Mexico at 13.8 MMT and Japan at 11.9 MMT (Figure 3). Other markets included South Korea (4.8 MMT), Colombia (4.6 MMT), Peru (2.7 MMT), and Taiwan (2.7 MMT). Together, these six markets account for 72.5 percent of U.S. corn exports. Figure 3.
U.S. Exports of Corn, 2013-2016
23.9
49.5
44.5
55.8
20132014
20152016
0.0
10.0
20.0
30.0
40.0
50.0
60.0
70.0
Million Metric Tons Mexico Japan S. Korea
Colombia Peru Taiwan
Saudi Arabia Venezue la O ther
Source: USDA Global Agricultural Trade System, FAS/USDA

4
Significant quantities of corn were also exported by ocean transport. In 2016, the New Orleans, Louisiana, customs district was the U.S. port of exit for slightly more than half of U.S. corn exports to Japan. This varied depending on the year. The Port of Grammercy was the primary New Orleans district port for Japanese corn exports followed closely by the Port of New Orleans. The Port of Baton Rouge was a distant third. At this time, most corn was shipped via barge from Midwest production regions down the Mississippi River and its feeder rivers such as the Illinois and Ohio Rivers.
Occasionally, the Portland, Oregon, customs district and the Seattle, Washington,
customs district were significant ports for corn exports to Japan. For the Portland district, in 2014–2106, the combined exports to Japan from the Ports of Kalama, Vancouver, and Longview (all on the Washington side of the Columbia River) increased from 2.2 MMT to 4.3 MMT. Fewer, although increasing, quantities of corn were shipped from the Seattle district ports of Seattle and Tacoma, Washington. These exports totaled 600 TMT to 1.5 MMT for the same time period. Since the Pacific Northwest does not produce significant amounts of corn, most of these corn exports were likely shipped via rail from the Midwest.
Portland and Seattle were the most important customs districts for corn exports to South Korea and Taiwan. Kalama, Vancouver, and Longview, in the Portland district, were most important ports for export to South Korea, followed by the Seattle district ports. New Orleans was also important for corn exports to South Korea, but significantly less than to Japan. Most corn exports to Taiwan exit the United States via the Seattle district ports followed by the Portland district ports. Some lesser amounts are shipped from Los Angeles/Long Beach. As with corn exports to Japan, most of the product was shipped via rail from the Midwest.
U.S. corn exports to Colombia and Peru primarily used the Port of New Orleans,
followed by the ports of Grammercy and Baton Rouge. The Port of Norfolk, Virginia, was also important for Colombia while the ports of Galveston and Houston, both in Texas, were important for Peru. Most of the corn exports leaving the New Orleans area were barged down the Mississippi River; while most of the exports through Norfolk, Galveston, and Houston used rail to reach the port.
From 2013–2016, U.S. corn shipments to Mexico averaged 10.6 MMT. Exports increased
each year to a high of 13.8 MMT in 2016. About 41 percent of these exports, or 5.7 MMT, were exported via ship with New Orleans being the most important port of export at 3.4 MMT. Additional corn exports to Mexico used Grammercy at 1.0 MMT, Baton Rouge at 612 TMT, and Houston at 317 TMT. Shipments using the former three ports originated up the Mississippi River, while those using Houston were shipped to the port mainly by rail.

5
The other 59 percent of U.S. corn exports to Mexico were shipped primarily by rail. The Laredo, Texas, customs district accounted for 7.1 MMT of these shipments, or 88 percent of the total. The Port of Laredo totaled 4.0 MMT. Eagle Pass, Texas, was next at 2.8 MMT; with some smaller amounts through Progreso, Texas, and Pharr, Texas, by truck and Brownsville, Texas, by rail. El Paso, Texas, was the next largest port for corn exports to Mexico, accounting for 604.0 TMT, followed by the San Diego, California, district ports of Calexico, California, and Otay Mesa, California, combining for 245.2 TMT and the Port of Nogales, Arizona, at 132.8 TMT. Nearly all of these corn exports relied on rail transportation.
According to data provided by USDA’s Animal and Plant Health Inspection Service
(APHIS), origins for corn exports to Mexico over land borders were predominantly from the Midwest. In 2016, Iowa was the leading origin of corn exports through Laredo at 33.4 percent; this was up from 25.0 percent in 2015. That same year, Kansas provided 26.9 percent compared with 30.6 percent in 2015. In 2016, Missouri supplied 24.9 percent up from 20.0 percent in 2015. Finally, in 2016, Illinois was the source of 13.7 percent, down from 23.6 percent in 2015. While the top-four origins remained the same, the year-to-year importance of each varied.2
There was greater variation for corn exports through Eagle Pass with five main states of
origin and greater fluctuation within these states. In 2016, Nebraska was the leading origin for corn exports through Eagle Pass, accounting for 36.1 percent after being second behind Illinois in 2015 with 32.8 percent. During 2016, Nebraska was followed by Iowa at 26.8 percent (7.0 percent in 2015), Kansas at 14.9 percent (1.8 percent in 2015), Minnesota at 9.1 percent (13.8 percent in 2015), and Illinois at 8.2 percent (33.6 percent in 2015).
The APHIS data accounted for only a portion of exports through El Paso, Nogales, and
California. While not much can be cited for El Paso; year 2015 data indicated that Illinois, Nebraska, and Missouri were significant origins for corn exports through Nogales. Missouri, Nebraska and Iowa were significant sources for corn shipments through California. For U.S. corn shipments to Mexico via sea, the origin was listed simply as the United States. No further information was available regarding the state of origin. Rice
In the United States, rice is produced in Arkansas, California, Louisiana, Texas, Missouri, and Mississippi. During 2014–2016, these states produced an average of 9.7 MMT of rice per year, or 213.2 million hundredweight (cwt).3 In 2016, total U.S. rough (or paddy) rice production
2 One may notice the slight differences in percentages from the APHIS data and the other reported percentages. This is due to two different sources, the former being U.S. Census Bureau trade data and the other being APHIS phytosanitary certification data. However, the raw data are typically within 3 or 4 percent of each other indicating that differences are insignificant for the purposes of this research. 3 Rice is traditionally measured in hundred pound units (cwt). 1 MT of rice equals 22.0462 cwt.

6
was 10.2 MMT. Arkansas ranked first and produced 4.8 MMT, or almost 47 percent of total production (Figure 4). California, which primarily produces medium grain rice as opposed to the long grain rice produced in other states, was the next largest rice producer with 2.1 MMT (21.2 percent). Third was Louisiana with 1.6 MMT (12.7 percent). In 2016, U.S. rice production was rounded out by Missouri, Mississippi and Texas, each producing six to seven percent of the total.
Figure 4.
Rice is produced for human consumption. It is eaten in a milled state in which the outer husk of the rough rice is removed and the rice is cleaned and cooked. About 50–60 percent of the U.S. rice supply was consumed domestically. The remainder was either exported as rough or milled rice. During 2016, 3.9 MMT of rice was exported (Figure 5). Of this, about 47 percent was milled white whole rice and 46 percent was rough rice. The remaining 7 percent was milled brown rice or broken rice. The focus here will be on exports of milled white whole rice and rough rice. During 2016, U.S. exports of milled white whole rice (milled rice) totaled 1.84 MMT. In descending order, the top-four foreign markets for U.S. milled rice were: Haiti at 418.6 TMT, Japan at 335.3 TMT, Canada at 134.2 TMT, and Saudi Arabia at 122.5 TMT. The top-ten markets, which included Mexico, accounted for about 80 percent of U.S. milled rice exports. In the preceding years, Mexico was typically among the top-five foreign purchasers of U.S. milled rice before dropping to number seven in 2016.

7
Figure 5.
The vast majority of U.S. milled rice shipped to Haiti moved out of the New Orleans customs district, led by the Port of Baton Rouge and followed by the Port of New Orleans and the Port of Grammercy. In 2014–2015, the Port of Freeport, Texas, was a port of export for rice to Haiti. Most U.S. milled rice exported to Japan used the San Francisco, California, customs district with the leader being the inland Port of Stockton, California, which is served by a deep-water channel. The Port of Oakland, California, was also important for exports to Japan. U.S. milled rice exports to Canada moved mainly across land borders, with the Port of Detroit and the Port of Port Huron, both in Michigan, and the Port of Blaine, Washington, combining to account for 75 percent of these shipments. U.S. milled rice shipments to Saudi Arabia used the most geographically diverse ports, including the Port of Oakland, the Port of Freeport, Texas, the Port of New Orleans, the Port of Houston, and the Port of Charleston, South Carolina.
During 2016, U.S. exports of rough (paddy) whole rice totaled 1.8 MMT. Rough rice was
milled in the destination country before preparation for consumption. Mexico was the largest market for U.S. rough rice exports at 753.5 TMT. After Mexico, additional markets for U.S. rough rice were: Venezuela with 289.2 TMT of purchases, Honduras at 238.6 TMT, Guatemala at 125.0 TMT, and Costa Rica at 114.1 TMT. Together, these five countries accounted for 84.4 percent of U.S. rough rice exports.
U.S. rough rice exports to Venezuela, Honduras, Guatemala, and Costa Rica relied on the
New Orleans customs district for shipping. During 2016, the Port of New Orleans was used to ship 58.5 percent of rough rice exports to Venezuela, 82.0 percent of exports to Honduras, 62.4 percent of exports to Guatemala, and 89.5 percent of exports to Costa Rica. The Port of Baton Rouge was used to ship the remaining exports to each of these countries except for Honduras, which had 1.3 percent of their rice shipment through the Port of Grammercy. This port hierarchy
U.S. Exports of Rice, 2013-2016
3.8
3.3
3 .9
3.9
20132014
20152016
0.0
1.0
2.0
3.0
4.0
5.0
Million Metric TonsMexico Haiti Japan
Venezuela Honduras Canada
S. Korea Colombia Guatemala
Saudi Arabia Costa Rica Other
Note: This represents rough and milled rice exports combined.Source: USDA Global Agricultural Trade System, FAS/USDA

8
for rice exports to these four countries was consistent in recent years though there were some shifts in proportion from year to year.
During 2013–2016, U.S. rice exports to Mexico averaged 819.4 TMT with relatively minor fluctuation from year to year. In 2016, rough rice exports to Mexico averaged 673.2 TMT and milled white rice averaged 117.8 TMT. The remaining 28.4 TMT was split between brown and broken rice. That same year, about 78.4 percent of rough rice exports to Mexico were shipped via sea out of the New Orleans customs district, including 433.7 TMT out of the Port of New Orleans, 135.0 TMT through the Port of Lake Charles, Louisiana and 22.0 TMT through the Port of Baton Rouge. This has been the recent trend for U.S. rough rice exports to Mexico by sea with the only change being the growth of Lake Charles as a port for export. The other 21.6 percent of rough rice exports to Mexico traveled mostly through the Laredo customs district. However, small amounts move through the El Paso and Nogales customs districts. The Port of Laredo was used for the vast majority of U.S. rough rice exports through the Laredo district with a small amount going through the Port of Eagle Pass.
Almost all U.S. milled white rice exports to Mexico were shipped via land. The Laredo
customs district captured 60 to 75 percent of these exports while the San Diego district provided 16 to 32 percent, depending on the year. The El Paso district accounted for around five to seven percent while the Nogales district was used for about one percent. In 2016, the Port of Laredo was the main port in that district, accounting for 34.0 TMT of milled rice exports to Mexico while Eagle Pass accounted for 16.8 TMT. The Port of Otay Mesa in the San Diego district accounted for 20.7 TMT of milled rice exports to Mexico. The nearby Port of Calexico accounted for 5.7 TMT. The Port of El Paso was used to ship 4.0 TMT to Mexico and the Port of Nogales was used for 1.4 TMT.
According to data provided by the APHIS, origins for rough rice exports to Mexico via
sea listed “USA” as the origin, but as most of those shipments used the New Orleans customs district, it is likely that this rice originated in Louisiana or their border states of Arkansas, Mississippi or Texas. The data set did not allow for a definitive discussion the origins of rice exports to Mexico through the Laredo customs district, but the data available showed Arkansas, Louisiana, Mississippi, and Texas as sources for about 12.4 TMT in 2016, or about six percent of the known total exports through the Laredo district. Rail was the primary mode of transportation shown and about 90 percent was rough rice.
The data for milled rice exports through the San Diego customs district revealed that 99
percent of U.S. rice exports to Mexico through the Port of Otay Mesa and the Port of Calexico originated in California. About 87 percent was shipped via truck. Calexico was the only port which used rail in California. Arkansas and Louisiana were the source of the remaining one percent of exports. The data further showed that most exports through the Ports of El Paso and

9
Nogales were via truck, and originated in Arkansas and California for the Port of El Paso and in California and Texas for the Port of Nogales. Grain Sorghum Kansas and Texas produced the majority of U.S. grain sorghum, combining for an average of 76.4 percent of total U.S. production from 2014–2016. In 2016, total U.S. grain sorghum production was 12.2 MMT, or 480.3 million bu.4 During 2016 Kansas ranked first and produced 6.8 MMT (55.9 percent of the total). Texas produced 2.9 MMT or 24.0 percent of the total production (Figure 6). In 2016, other important states were Colorado, Oklahoma, Nebraska, and South Dakota. Arkansas produced significant amounts of grain sorghum in 2014, and 2015, before dropping significantly in 2016.
Figure 6.
About 40–50 percent of U.S. grain sorghum production was used domestically. About half of that was used for feed while the remainder went to FSI uses, such as ethanol production and in food products as a gluten free alternative. In recent years, feed use was higher than FSI and vice versa.
4 A metric ton of grain sorghum is equal to 39.37 56-pound bushels.

10
Presently, roughly half of U.S. grain sorghum production is exported. In 2016, U.S. grain sorghum exports totaled 6.8 MMT, down from 9.8 MMT in 2015, but on par with 2014 exports of 7.2 MMT. For these three years, China was the largest market for U.S. grain sorghum and accounted for 87 percent U.S. grain sorghum exports (Figure 7). Prior to 2013, China purchased little grain sorghum from the United States. That year, China began purchasing U.S. grain sorghum for multiple reasons: the need for inexpensive feed, a cost advantage over Australian grain sorghum, and grain sorghum was not subject to Chinese tariffs and quotas while U.S. corn and wheat were subject to these barriers.
Other major foreign markets for U.S. grain sorghum included Mexico and Japan. During
2009–2013, these two countries led by Mexico accounted for 80 percent of U.S. grain sorghum exports. In 2013, this dropped to 58 percent once China began bidding away U.S. grain sorghum from Mexico and Japan. For 2014–2016, Mexico and Japan composed only 5.4 percent of the U.S. grain sorghum export market though they are both began to purchase larger quantities.
Figure 7.
U.S. exports to China are primarily shipped from the Houston customs district, namely the Ports of Houston, Galveston and Corpus Christi, Texas. Together, these three ports were the port of departure for 77.7 percent of U.S. grain sorghum exports to China, or 5.4 MMT per year. In 2014 and 2016, the Port of Corpus Christi led while the Port of Houston led in 2015. Additional ports of origin for U.S. grain sorghum exports were the New Orleans customs district ports of New Orleans, Grammercy, and, to a lesser extent, Baton Rouge. These three ports combined to average 16.5 percent of U.S. grain sorghum exports to Japan, although this was in
U.S. Exports of Sorghum, 2013-2016
2.1
7.2
9.8
6.8
20132014
20152016
0.0
2.0
4.0
6.0
8.0
10.0
12.0
Million Metric Tons C hina Mexico Pakistan
Sudan Japan O ther
Source: USDA Global Agricultural Trade System, FAS/USDA

11
large part due to 2.2 MMT of exports during China’s all-time high in grain sorghum purchases in 2015.
Within the Portland customs district, the Port of Kalama and the Port of Vancouver
combined to account for about four percent of grain sorghum exports to China. Depending on the year, the Ports of Los Angeles and Long Beach, both in California, and Tacoma, Washington, accounted for a small share of grain sorghum exports to China. About half of grain sorghum exports to China reach the port via truck, while about a third use rail and the remainder use barge, particularly those exports that depart from the New Orleans customs district.
For Japan, the New Orleans customs district historically accounted for 75 to 95 percent of
U.S. grain sorghum exports, though some years were a bit outside this range. For 2014 and previous years, the ports of New Orleans and Grammercy were primary. However, during 2015 and 2016, when grain sorghum exports were at their lowest, those two ports did not ship any grain sorghum to Japan. Instead, exports to Japan were provided by the Port of Baton Rouge and the Port of Avondale, Louisiana. Aside from the New Orleans customs district, the customs district of Portland, led by the Port of Kalama, and the Seattle customs district led by the ports of Seattle and Tacoma, are the next most important.
During 2013–2016, U.S. grain sorghum exports to Mexico averaged 442.1 TMT. The
total varied from a high of 920.8 TMT in 2013, to a low of 50.7 TMT in 2014, before increasing to 646.2 TMT in 2016. These drastic swings were due to China’s decision to purchase the vast majority of U.S. grain sorghum exports. All U.S. grain sorghum shipments to Mexico currently use truck (72.4 percent) or rail (27.6 percent), and most use the Laredo customs district, led by the ports of Progreso, Laredo, Eagle Pass and Pharr. Together, these four ports account for 90 to 95 percent of U.S. grain sorghum exports to Mexico. Shipments through Progreso, the leader, and Pharr are via truck while shipments Laredo and Eagle Pass are almost exclusively via rail. The Port of El Paso accounts for most of the remainder of U.S. exports to Mexico and uses rail.
Prior to 2013, U.S. grain sorghum shipments to Mexico were much higher, averaging 2.2
MMT for 2003–2012. Furthermore, these exports were split fairly evenly between land shipments via the Laredo customs district and the Port of El Paso, and sea shipments led by the Houston customs district followed by the New Orleans district. Once China entered the grain sorghum market, however, U.S. grain sorghum volumes to Mexico were not large enough to require bulk vessels and instead started exclusively using land transport.
According to data provided by APHIS, origins for grain sorghum exports over land
borders to Mexico were predominantly Texas and Kansas with smaller amounts originating in Nebraska and Missouri. Texas was the origin for 77.8 percent of grain sorghum exports to Mexico, and about 93 percent of that portion was shipped via truck through the ports of Progreso

12
and Pharr. The other seven percent of Texas grain sorghum shipments to Mexico were shipped by rail through Eagle Pass and El Paso. Kansas accounted for 20 percent of grain sorghum shipments to Mexico, all shipped by rail through Eagle Pass and Laredo. Nebraska and Missouri accounted for 1.9 percent and 0.3 percent, respectively, of shipments to Mexico, both using rail and entering Mexico through Laredo and Eagle Pass. Less than 200 MT of U.S. grain sorghum entered Mexico through the California port of San Ysidro. Cotton
While cotton is produced throughout the southern states, Texas usually produces 45 percent or more of the cotton crop. The top-three states, Texas, Georgia and Mississippi, often produce two-thirds of U.S. cotton. In 2016, Texas produced 1.77 MMT, or 8.1 million bales, of cotton out of 3.78 MMT (17.2 million bales), or 47.4 percent of domestic production (Figure 8). That same year, Georgia produced 474.6 TMT (2.2 million bales) and Mississippi produced 235.4 TMT (1.1 million bales). In 2016, other major cotton producing states included California, Arkansas, Alabama, Oklahoma, Tennessee, and Missouri, each producing 120–200 TMT (550,000–850,000 bales). North Carolina and South Carolina were previously among the leading producers; however, they have decreased their cotton production in recent years due to inclement weather near harvest time and crop substitution.
Figure 8.
After harvest, cotton is first processed at gins located near the growing areas. The cotton seed and plant matter are separated from the lint. The lint is compacted into 480-pound bales.

13
The cotton seed is crushed into oil for food use, such as cooking oils, or industrial use. The meal is fed to livestock. The following discussion will focus only on uses and transportation of baled cotton fiber. In recent years, no more than 30 percent of annual cotton production was used domestically. It was processed into various consumer products such as apparel and home products, industrial products such as medical supplies, or held in stocks. Further processing of cotton in the United States typically occurs in southeastern states
Depending on the year, 70 percent or more of U.S. cotton production is exported. In 2016, U.S. cotton exports totaled 2.5 MMT5 on par with the 2013–2016 average annual cotton exports (Figure 9). In 2016, the leading market for U.S. cotton exports was Vietnam, which grew from 214.7 TMT in 2013 to 537.9 TMT three years later. The reason for this growth was new foreign investment in the Vietnamese textile industry; which created demand for additional quantities of cotton. In 2016, Turkey was the second largest market for U.S. cotton exports, purchasing 331.8 TMT. This was down about 22 percent from 2013 and 2014. China, which was the largest market for U.S. cotton exports in 2013 at 1.1 MMT, slipped to third in 2016 during which China purchased 305.9 TMT. This decline occurred due to China’s policy decision to use cotton already in storage and other policy changes. Indonesia grew from the fifth to fourth leading market for U.S. cotton exports, reaching 219.7 TMT in 2016. Presently, Mexico is now fifth as their purchases of U.S. cotton have remained fairly consistent in recent years, e.g., 216.6 TMT in 2016.
Figure 9.
5 1 MT of cotton is equal to 4.59 480-pound bales.
U.S. Exports of Cotton, 2013-2016
2.8
2.2
2.4 2.5
20132014
20152016
0.0
0.5
1.0
1.5
2.0
2.5
3.0
3.5
Million Metric Tons Vie tnam Turkey China
Indonesia Mexico Pakistan
India S. Korea O the r
Source: USDA Global Agricultural Trade System, FAS/USDA

14
U.S. exports to Vietnam, China, and Indonesia are primarily shipped from the Los Angeles customs district, namely the Port of Los Angeles and the Port of Long Beach. These two ports were the points of departure for 78.2 percent of U.S. cotton exports to Vietnam, 77.0 percent of cotton exports to China, and 44.7 percent of exports to Indonesia. While some of these cotton exports may originate in California, most of these cotton exports were shipped via rail from Texas or the southeastern United States to the Los Angeles area before loading on to ships bound for their destination. The ports of Savanna and Houston were used to export most of the remaining shipments to Vietnam and China. The ports of Savannah, Charleston and Norfolk combined to ship most of the remaining exports to Indonesia. Those ports are all closer to the major production region and cotton destined for export travels to the port either by truck or rail.
U.S. cotton exports to Turkey used the Port of Houston for most shipments; increasing
from 41 percent of shipments in 2014, to 60 percent of shipments in 2016. Following the Port of Houston for shipments to Turkey was the Port of Savannah at 27 percent, decreasing from 42 percent in 2014, followed by the ports of Norfolk and Charleston.
From 2013–2016, U.S. cotton exports to Mexico, averaged 215.4 TMT with a range of
only 9.0 TMT, or about four percent. Historically, U.S. cotton exports to Mexico have relied on land transportation with an occasional shipment via sea. Currently, all U.S. cotton exports to Mexico use truck. In 2016, most shipments used the Laredo customs district, led by the Port of Pharr with 56.4 percent of exports and the Port of Laredo with 42.5 percent of exports. Together, these ports accounted for account for 97 to 99 percent of U.S. cotton exports to Mexico since 2011. In 2014, the Port of Pharr surpassed the Port of Laredo for the first time. When rail transportation increased, the Port of Laredo picked up a greater share due to the availability of rail in Laredo, but not at Pharr. The ports of Nogales and El Paso captured the remaining balance of cotton exports to Mexico.
According to data provided by APHIS, cotton exports to Mexico over land borders were
shipped exclusively via truck. The Port of Pharr was used to ship the majority of cotton to Mexico; about 56 percent of the total. About 71.6 percent of cotton shipped through Pharr originated in Texas. Another 27.8 percent of this cotton originated in Tennessee and very small amounts originating in Arizona and California. During 2016, another 43.3 percent of exports shipped through the Port of Laredo. The states of origin for these cotton exports were Texas at 45.5 percent, followed by Tennessee at 7.0 percent, and Arizona and California, at just under one percent each.
The remaining 45.5 percent of U.S. cotton exports to Mexico through Laredo were listed
as originating from a combination of Louisiana, Tennessee and Texas. At least two of the three – often all three states – were indicated as the origin. In fact, all three states provided 42.6 percent of the shipments through Laredo, while 2.9 percent listed a combination of Tennessee and Texas.

15
This indicates a consolidation process where rail or truck brought cotton from Memphis, Tennessee (a gathering point for the mid-south production region) and Louisiana into transit warehouses in Texas, where Texas produced cotton was already stored. Shipments were then repacked using cotton from more than one origin into trailers for truck shipment across the border at Laredo.
Major Crossings and Trade Flows at the U.S.-Mexico Border A major goal of this research was to focus on U.S.-Mexico border infrastructure needs. To that end, it is important to understand the current status of trade flows at the U.S.-Mexico border. This section provides a brief overview of important ports and commerce along the border. California has two major land border ports with Mexico: Otay Mesa entering at Tijuana and Calexico East entering at Mexicali. The San Ysidro crossing is near Otay Mesa and also enters at Tijuana, while the Calexico West (previously referred to simply as Calexico) crossing is near Calexico East and enters at Mexicali. Together, these four ports accounted for exports of $21.8 billion and imports of $36.4 billion during 2016. For the products considered in this study, the four ports accounted for about $54.3 million in corn exports, $18.6 million in rice exports, $232.1 million in produce exports, and $1.8 billion in produce imports. Over time, trade has consistently increased. During 2016, the last year for which data were available, Otay Mesa and Calexico East combined for 874,980 loaded truck entries into the United States.
Arizona has three land border ports with Mexico. A major port is at Nogales, Arizona, opposite Nogales, Mexico. A lesser used port is in San Luis, Arizona, across from San Luis Rio Colorado, Mexico. Another port at Douglas, Arizona, has very little participation in agricultural products trade with the exception of live animals, cotton, feed, and small amounts of fresh vegetables. Together, in 2016, Nogales and San Luis accounted for exports of $10.9 billion and imports of $17.0 billion. For the products considered in this study, the ports accounted for about $30.0 million in corn exports, $1.7 million in rice exports, $1.8 million in grain sorghum exports, $335.0 million in produce exports, and $3.2 billion in produce imports. This trade has consistently increased almost every year. Nogales and San Luis combined for 309,275 loaded truck entries into the United States in 2016, with 93 percent of those entering through Nogales.
New Mexico was the least used state for trade of agricultural products with Mexico. New Mexico has two land border ports with Mexico: Santa Teresa and Columbus. Neither port used much for agricultural products; with the exception of inbound and outbound live animals and some fresh produce imports. Together, in 2016, these ports accounted for exports of $10.8 billion and imports of $12.0 billion. Most of this two-way trade was in industrial machinery due to maquiladoras located in Mexico across from Santa Teresa. For the products considered in this

16
study; the ports accounted for almost no grain exports, less than $100,000 in produce exports, and $50.4 million in produce imports. Imports, although low, have consistently increased almost every year. In 2016, New Mexico had 80,191 loaded truck entries into the United States; mostly through Santa Teresa.
Texas has eight major port areas for products crossing into and out of Mexico. From east to west, these ports are located in Brownsville, Progreso, Pharr, Rio Grande City, Laredo, Eagle Pass, Del Rio, and El Paso. Near El Paso is the port at Presidio, which is increasing in importance. Laredo and El Paso each account for multiple crossings. Together, in 2016, Texas land ports, led by Laredo, El Paso, and Pharr, accounted for exports of $148.4 billion and imports of $195.1 billion.
For the products considered in this study, the Texas ports accounted for about $1.5 billion
in corn exports, $80.6 million in rice exports, $151.3 million in grain sorghum exports, $33.7 million in produce exports, and $5.5 billion in produce imports. Since 2002, this trade has consistently increased most years and is currently at historical highs. In 2016, Texas ports combined for 2,764,887 loaded truck entries into the United States, with 56.4 percent of those entering through Laredo, about 15.3 percent through El Paso, and 14.9 percent through Pharr.
Figure 10. U.S.-Mexico Border Crossings Important to Agricultural Trade
Source: https://www.bing.com/maps and Center for North American Studies

17
Recent U.S.-Mexico Trade Patterns
U.S.-Mexico agricultural and food trade has grown significantly over the last two decades. Much of this trade occurred over land borders. Thus, it is important to analyze the flow of product across the border. For the purposes of this study, we examined more closely U.S. exports of corn, rice, grain sorghum, and produce, as well as U.S. imports of fresh fruits and vegetables. The report discusses each product group in turn. U.S. Exports of Corn, Rice and Grain Sorghum to Mexico
Mexico has been a long-time purchaser of U.S. grains; particularly since the 1994
implementation of the North American Free Trade Agreement (NAFTA). U.S. corn exports to Mexico have increased from 3.1 million metric tons (MMT) to an all-time high of 14.0 MMT in 2016. U.S. rice exports increased from 261.3 thousand metric tons (TMT) to a peak of 908.2 TMT in 2011, before slipping to 854.0 TMT in 2016. Grain sorghum, however, grew from 3.5 MMT in 1994 to 5.1 MMT in 2011, before falling continuously, and then sharply declining to 74.3 TMT in 2014. U.S. grain sorghum exports to Mexico rebounded somewhat in 2016, to 666.3 TMT.
Corn: Since 2003, between 55 to 72 percent of U.S. corn exports to Mexico were shipped via land ports. During 2016, this amounted to 8.2 MMT (58.4 percent) of U.S. corn entering Mexico at land points of entry (Figure 11). Earlier research tracking the modes of transportation for U.S. grain exports to Mexico as well as APHIS inspection data show that more than 95 percent of corn shipped to Mexico via land was shipped by rail. Furthermore, in 2016, most of these rail shipments of corn occurred through three border crossings in Texas: Laredo (4.0 MMT), Eagle Pass (2.83 MMT), and El Paso (616.9 TMT).
Figure 11.
U.S. Corn Exports to Mexico by Port Type
2004 2006 2008 2010 2012 2014 20160.0
2.0
4.0
6.0
8.0
10.0
Million Metric Tons
Corn by Land
Corn by Sea
Source: WISERTrade and GATS, FAS/USDA

18
The border crossing at Laredo, Texas, has long been a major port for corn shipments to Mexico. Eagle Pass has increased from just over 500 TMT in 2012 to just under 3.0 MMT in 2016. The El Paso crossing fell from 2.4 MMT to 617 TMT during the same period. Industry sources indicated one reason for this change was that Eagle Pass is operational 24 hours per day, while El Paso only operates 15 hours per day. Furthermore, Eagle Pass has rail infrastructure that better mitigates intermittent bottlenecks and other unexpected cargo delays. As with other transportation modes, railways respond to consumer demand based on timeliness and the availability of infrastructure and equipment. Eagle Pass, at least with respect to grains, has proven to be more efficient for rail in recent years.
The Progreso crossing has been the only significant port for truck shipments of corn into
Mexico, accounting for an average of 212 TMT from 2013–2016. However, in 2016, about 86.4 TMT of corn were shipped via truck through the Pharr, Texas, crossing. This followed years when the high was only 251 MT. Only time will tell whether Progreso will sustain its corn shipments into Mexico or if Pharr corn shipments will increase. Data for U.S. grain shipments to Mexico indicates that land transportation continues to be the primary means for the export of corn to Mexico, but that percentage has dropped since 2011. While the volume of corn moving to Mexico via rail during 2016 (7.9 MMT) was higher than corn shipments by rail in 2011 (6.2 MMT), the share fell from 72 percent to 58.2 percent (Figure 12). This was due to the near tripling of corn shipments via sea: from 2.2 MMT in 2011, to 6.0 MMT in 2016. Truck shipments dropped from three percent of shipments in 2011, to 0.2 percent of shipments in 2016.
Figure 12.
Modes of Transporation for U.S. Corn Exports to Mexico, 2011 vs. 2016
Rail72.0%
Sea25.0%
Truck3.0%
Rail58.2%
Sea41.6%
Truck0.2%
2016 Total: 13.9 MMT2011 Total : 8.6 MMT
Source: USDA Global Agricultural Trade System, FAS/USDA, and APHIS/USDA

19
Rice: For rice, shipments to Mexico were typically more by land than sea during 2004–2008, but shifted to mostly sea transport thereafter (Figure 13). One reason cited by industry sources for this shift was that rail companies do not prioritize rice and, therefore, rice shipments to Mexico via rail have not always arrived in a timely manner.
Figure 13.
Recently, there have been discrepancies between rice shippers and Mexican officials
regarding volume and other differences regarding the cleanliness of rough rice shipments across the U.S.-Mexico land border. These disagreements are costly to U.S. rice exporters. As a result, many rice shippers, particularly those in southwest Louisiana, chose to switch their rough rice exports to sea transport. They have not experienced these types of issues at Mexican seaports. Still, some rice shippers continued to use rail for shipments of rough rice. In addition, milled rice continues to travel into Mexico primarily via land. Because milled rice is consumer ready and shipped in different packaging, there less of a chance for the issues that were cited for rough rice to occur. Furthermore, partial data show that U.S. milled rice land exports to Mexico primarily use rail while rough rice exports by land primarily use trucks.
In 2016, U.S. exports of rice to Mexico totaled 854.0 TMT, worth $271.4 million. Paddy
rice was 80 percent of the volume, or 680.4 TMT. It was valued at $190.4 million or 70 percent of total value of rice exports. Of these paddy rice exports to Mexico, 538 TMT (79 percent) of the volume and $141.8 million of the value (74 percent) used Louisiana seaports. Most of the remainder used Laredo. Reported data showed 75 percent of paddy rice shipments through Laredo were via truck.
U.S. Rice and Sorghum Exports to Mexico by Port Type
2004 2006 2008 2010 2012 2014 20160.0
500.0
1,000.0
1,500.0
2,000.0
Thousand Metric Tons
Rice by Land
Rice by Sea
Sorghum by Land
Sorghum by Sea
Source: WISERTrade and GATS, FAS/USDA

20
Milled rice accounts for another 83.3 TMT (9.8 percent) of U.S. rice exports to Mexico, valued at $48.4 million (17.8 percent). Nearly all of these exports traveled through land ports. Laredo (34.1 TMT), Otay Mesa (20.5 TMT), and Eagle Pass (16.8 TMT) accounted for the majority of these milled rice exports to Mexico. Data indicate that most of these milled rice exports enter Mexico via rail.
Brown rice exports to Mexico comprised 74.4 TMT; with 90 percent moving out of New
Orleans. Broken rice accounted for the final 15.9 TMT, and most of this moved through land ports. Finally, comparing 2016 to 2011, a greater percentage of rice exports in 2016, moved through seaports. Likewise, rail transport significantly decreased as a percentage of rice exports, while truck transportation greatly increased (Figure 14).
Figure 14.
Grain Sorghum: Concurrent with the steep decrease in grain sorghum exports to Mexico was a significant shift in the method of transportation. During 2003–2006, when grain sorghum exports to Mexico averaged about 2.9 MMT annually, shipments were split about evenly between sea and land. After two down years, average grain sorghum exports returned to 2.3 MMT for 2009–2011. Exports were primarily shipped by sea, although land shipments were still significant. After 2011, grain sorghum exports to Mexico declined as China bid away much of the U.S. crop. Since 2014, grain sorghum shipments to Mexico traveled almost exclusively via land, with the vast majority of that by truck through Progreso (451.3 TMT in 2016). There were some grain sorghum shipments via rail through Eagle Pass (100.6 TMT) and Laredo (59.2 TMT), with a noticeable increase in 2016. El Paso accounted for about 34.3 TMT of mostly rail shipments and Pharr accounted for 30.6 TMT of truck shipments of grain sorghum to Mexico. While total volumes have significantly decreased since 2011, all grain sorghum exports now travel into Mexico by land with trucks accounting for nearly three-quarters of those exports (Figure 15). Total grain sorghum exports to Mexico, and exports by sea, have yet to recover.
Modes of Transporation for U.S. Rice Exports to Mexico, 2011 vs. 2016
Rail38.5%
Sea60.6%
Truck1.0%
Rail10.1%
Sea68.8%
Truck21.1%
2016 Total: 854.0 TMT2011 Total: 908.2 TMT
Source: USDA Global Agricultural Trade System, FAS/USDA, and APHIS/USDA

21
Figure 15.
U.S. Exports of Cotton to Mexico
Presently, Mexico continues to be a leading importer of U.S. cotton. Following the
implementation of NAFTA, U.S. cotton exports to Mexico reached a high of 402.3 TMT in 1998. Since then, U.S. cotton shipments to Mexico have experienced a consistent decline, reaching a low of 193.4 TMT in 2012 before rebounding to 216.6 TMT in 2016 (Figure 16). Ninety-nine to one hundred percent of these exports have been shipped via land ports. In recent years, almost all exports have been shipped via truck. The Port of Pharr is now the leading port for cotton exports to Mexico, with Laredo a close second.
Figure 16.
Modes of Transporation for U.S. Sorghum Exports to Mexico, 2011 vs. 2016
Source: USDA Global Agricultural Trade System, FAS/USDA, and APHIS/USDA
Rail22.4%
Sea57.6%
Truck20.0%
Rail27.0%
Truck73.0%
2016 Total: 666.3 TMT2011 Total: 2.3 MMT
U.S. Cotton Exports to Mexico by Port Type
2004 2006 2008 2010 2012 2014 20160.0
0.1
0.2
0.3
0.4
Million Metric Tons
Cotton by Land
Cotton by Sea
Source: WISERTrade and GATS, FAS/USDA
Note: Nearly All U.S. cotton exports to Mexico have been shipped via truck in recent years.

22
U.S. Exports of Fresh Produce to Mexico The United States also supplies a wide variety of fruits and vegetables to Mexico. During 2016, U.S. exports of fresh fruits and vegetables totaled 644.9 TMT, at a value of $602.2 million (Figure 17). Slightly more than a third of both export volume and value consisted of apples. Potato exports to Mexico accounted for about 14 percent of the volume, but only about six percent of the value. Pears accounted for 10 percent of the volume and 13 percent of the value. Other measurable fresh U.S. produce exported to Mexico included onions, grapes, citrus, peaches, melons and strawberries.
Figure 17.
In 2016, nearly all U.S. fresh fruit and vegetable exports to Mexico crossed in trucks via land borders. The San Diego customs district slightly outpaced the Nogales customs district for exports of fresh product to Mexico. Consisting of Otay Mesa and Calexico crossings, the San Diego district accounted for about 284.1 TMT of U.S. fresh produce entering Mexico, or approximately 15,660 forty-thousand-pound truckloads (Figure 18). The number of truckloads reported here provides perspective of the impact on highways. These exports are valued at $232 million.
During 2016, the Nogales border crossing, the key port in the Nogales district, accounted for 272.0 TMT (14,992 truckloads). However, because the product mix has much higher valued apples, grapes, and stone fruit and fewer potatoes; fresh produce exports through Nogales are valued at $335.0 million. The El Paso district accounted for 36.5 TMT (2,012 truckloads) valued at $22.7 million, while the Laredo district accounted for 19.3 TMT (1,066 truckloads) valued at $9.5 million.
U.S. Exports of Fresh Produce to Mexico, 2007-2016
$468.8
$601.1
$464.5
$538.8 $551.0
$680.3
$762.4$727.2
$683.8
$603.0
530.4
655.1
556.0599.5 581.6
658.8716.9 692.9
734.9
615.1
20072008
20092010
20112012
20132014
20152016
0.0
200.0
400.0
600.0
800.0
1,000.0
1,200.0
Thousand Metric Tons
$0.0
$200.0
$400.0
$600.0
$800.0
$1000.0Million Dollars
Volume Value
Source: Agricultural Marketing Service, USDA and Department of Agricultural Economics, Texas A&M University

23
Figure 18.
U.S. Imports of Fresh Produce from Mexico Presently, the United States imports an increasing quantity and a wide variety of fresh
fruits and vegetables from Mexico. In 2016, research conducted for the Texas International Produce Association (TIPA), indicated that U.S. imports of produce and products from Mexico totaled $12.04 billion; including fresh, frozen and processed fruits, vegetables, and nuts. About 98 percent of these imports entered the United States via land ports between Mexico and Texas, New Mexico, Arizona, and California.
In 2016, fresh fruits and vegetables, nearly 90 percent of the total imports, were valued at
$10.67 billion. These imports were 8.99 MMT, or the equivalent of 463,755 forty-thousand pound truckloads. Because of the relative magnitude, imports for produce obviously have a much larger impact on border area roadways than exports. Consequently, they are an important part of the picture for understanding border infrastructure issues. About 48 percent (4.02 MMT) of U.S. fresh fruit and vegetable imports from Mexico entered through Texas land ports, arriving in 221,662 truckloads (Figure 19). Another 35 percent, or 2.91 MMT, of these shipments entered through Arizona via 160,602 truckloads. California accounted for 15 percent, with 1.24 MMT entering by 68,237 truckloads. New Mexico accounted for the remaining 3 percent.
Tomatoes were the leading fresh produce import from Mexico at 1.62 MMT and valued at $1.96 billion. The next six imports were: peppers at 913.8 TMT ($1.07 billion), avocadoes at 785.1 TMT ($1.77 billion), cucumbers at 688.3 TMT (482.4 million), watermelons at 649.2 TMT (263.3 million), and limes at 575.5 TMT (369.1 million). Other important vegetable imports from Mexico were squash, onions, asparagus and broccoli. Additional significant fruit imports were strawberries, other berries, grapes, mangoes and bananas.
U.S. Exports of Fresh Produce to Mexico by Truck by Customs District, 2007-2016
29.2
36.1
30.6 33
.0
32.1
36.3 39
.5
38.2 40
.5
33.9
20072008
20092010
20112012
20132014
20152016
0.0
10.0
20.0
30.0
40.0
50.0
1,000 40,000 Lb. TruckloadsSan Diego Nogale s
El Paso Laredo
Source: Agricultural Marketing Service, USDA and Department of Agricultural Economics, Texas A&M University

24
Figure 19.
Recent trends demonstrate that fresh produce imports have increased from 4.7 MMT in 2007 (260,992 truckloads) to 9.0 MMT in 2016 (463,662 truckloads). This was a total increase of 77.7 percent or an average annual growth of 8.6 percent per year. Texas was the number one import state, surpassing Arizona in 2011. Much of the reason for this increase in Texas produce imports was the development of the Pharr Bridge in the lower Rio Grande valley (LRGV) of Texas into a major import route for fresh produce and to a lesser extent the growth of Laredo.
Nogales, Arizona, with 154,935 truckloads in 2016, continues to be the leading individual port of entry for fresh produce from Mexico on an annual basis though the vast majority of these imports enter during November through June (Figure 20). Pharr accounted for 149,169 truckloads in 2016, and together with Nogales accounts for 65.6 percent of fresh produce imports from Mexico. Otay Mesa, at 50,386 truckloads, and Laredo with 46,167 truckloads, were the other major ports of import for fresh produce. It should be noted that produce imports through Nogales are highly cyclical throughout the year depending on the month. Imports through other ports, including Pharr, are much more consistent by month. As a result, Nogales was the leading monthly port for about half of the year while Pharr was the leading monthly port for the other half of the year.
The 2016 research for TIPA also developed a forecast to 2025 with a baseline and a
shock to the baseline, which included industry input. Results indicated that if the 2007–2016 trends continued, imports of fresh produce would increase to 634,400 truckloads (11.5 MMT) by 2025, an increase of about 37 percent (Figure 21). If recent growth rates continued for the next couple of years, as industry input indicated, then imports would increase to 688,400 truckloads, or 12.5 MMT (Figure 22). Texas would continue being the leading state of entry with Pharr possibly surpassing Nogales as the number one port of entry. This assumes that these ports could handle the additional inflow, so expansion in services and/or facilities at Pharr and Nogales would likely be required.
U.S. Imports of Fresh Produce from Mexico by Truck, 2007-2016
101.
0
105.
5 123.
8
133 .
0 148.
3
159.
0
171.
1
172.
6
209.
8
221.
7
112.
3
115 .
6
1 13.
5 136.
0
118.
4
1 30.
0
134.
2
130.
5 147.
2 160.
6
4 3.3
45.7
49.4 53.8
54.5 60.0
58.6
58.0 64
.9
68.2
4.4
4.3 6.9
6.5
6.5 10
.2
10.4
9.6
9.5 13
. 3
20072008
20092010
20112012
20132014
20152016
0.0
50.0
100.0
150.0
200.0
250.0
1,000 40,000 Lb. Truckloads
Te xas Arizona
California New Mexico
Source: Agricultural Marketing Service, USDA and Department of Agricultural Economics, Texas A&M University

25
Figure 20.
Figure 21.
U.S. Imports of Fresh Produce from Mexico by Truck, Monthly, 2013-2016
37.1
3 5.0
40.1
41.5 43
.530
.52 1
.419
.517
.626
.6 29.6 31
.839
.835
.142
.6 45.4
35.9
23.6
1 8.3
1 6.5 19
.929
.330
.4 33.9
42.5
39.9 44
.9 48.0
48.9
34.2
25.3
22.0
23.6
30.1
35.2 36
.949
.350
.049
.6 52.2
40.8
3 5.1
2 5.4
24.2 26
.133
.6 36.7 40
.7
Jan-13
Jul-13
Jan-14
Jul-14
Jan-15
Jul-15
Jan-16
Jul-16
0.0
10.0
20.0
30.0
40.0
50.0
60.0
1,000 40,000 Lb. TruckloadsNogale s Pharr O tay Mesa
Laredo All O thers
Source: Agricultural Marketing Service, USDA and Department of Agricultural Economics, Texas A&M University
U.S. Imports of Fresh Produce from Mexico by Truck Baseline, 2007-2025F
261.
0
271 .
1
2 93.
6
329.
4
327.
7
359.
1
374.
2
370.
8 431.
4
463.
8
464 .
8
4 86.
0
507.
2
528.
4
549.
6
570 .
8
592.
0
613.
2
634.
4
20072009
20112013
20152017F
2019F
2021F
2023F
2025F
0.0
100.0
200.0
300.0
400.0
500.0
600.0
700.0
1,000 40,000 Lb. Truckloads
Texas Arizona
California New Mexico
Source: Agricultural Marketing Service, USDA and Department of Agricultural Economics, Texas A&M University 2016-2023 Forecast based on 2007-2015 Model

26
Figure 22.
Trade Simulation Results by Border State and Major Land Port In order to analyze trade trends of agricultural products through the U.S.-Mexico border, a risk-based simulation model for each commodity was developed based on 2006–2016 data. The model defined, parameterized, simulated, and validated relevant risky variables; in this case import and export trends, and commodity prices. These stochastic (random) values were then used to forecast future volumes traded, as well commodity prices and their values. First the stochastic variables were de-trended and a multivariate empirical (MVE) distribution was used to estimate the parameters. A MVE distribution has been shown to appropriately correlate random variables based on their historical correlation. The results were probability distributions of forecasted variables that were used as stochastic baselines of future trade volumes and values.
The results were summarized in stoplight charts for each commodity by state and also the main ports on entry. The red portion of the chart shows the probability of the value of the traded commodity to be below a lower target value. The yellow portion of the chart is the probability of being between a lower and upper target value. Finally, the green portion is the probability of being above an upper target value. In general, the lower and upper target values are set as the average and maximum commodity traded values, respectively, during 2012–2016.
These analyses were performed for each commodity shipped through each state and by
major port. Included are exports of corn, rice, grain sorghum, cotton, and fresh produce as well as imports of fresh produce. The result was seven or more graphics per commodity with the potential for a tedious and repetitive discussion. For simplicity, only a thorough discussion of the
261.
0
271.
1
293.
6
329.
4
327.
7
359.
1
374.
2
370.
8 4 31.
4
463.
8
499.
7
539.
9
561.
1
582.
3
603.
5
624.
7
645.
9
667.
1
688 .
4
20072009
20112013
20152017F
2019F
2021F
2023F
2025F
0.0
100.0
200.0
300.0
400.0
500.0
600.0
700.0
800.0
1,000 40,000 Lb. Truckloads
Texas Arizona
Calif ornia New Mexico
U.S. Imports of Fresh Produce from Mexico following Industry Input, 2007-2025F
Source: Agricultural Marketing Service, USDA and Department of Agricultural Economics, Texas A&M University 2016-2023 Forecast based on 2007-2015 Model and Industry Input

27
results for U.S. corn exports to Mexico is presented, including all pertinent figures. Discussion of the other commodities focuses primarily on the results using tables instead of figures. Pertinent figures not included in this section are in Appendix A.
Corn Exports
In the study, Texas ports accounted for the vast majority of corn exports to Mexico. This trend was predicted to continue increasing as seen in Figure 23. The probability of the value of corn exports to be lower than the average of the last five years was 11 percent in 2017 and just one percent in 2021. Moreover, the probability of Texas exports being higher than $1.8 billion (maximum value of the last five years) was 56 percent in 2017. This estimate rises to 93 percent in 2021. California also has experienced a positive trend in corn export values to Mexico to a smaller degree than Texas. The probability of corn exports to Mexico through California being less than $34.7 million goes from 20 percent in 2017 to 13 percent in 2021 (Figure 24). Furthermore, the probability of corn exports through California being higher than the maximum value over the last five years ($54.3 million) increased from 60 percent in 2017 to 78 percent for 2021.
Figure 23. Probabilities of Corn Exports through Texas being < $1.4 Billion and > $1.8 Billion

28
Figure 24. Probabilities of Corn Exports through California being < $34.7 Million and > $54.3 Million
Even though the value range of corn exports through Arizona is similar to that of California, Arizona’s forecast was flat as a result of large fluctuations in corn exports through that state since 2003 (Figure 25). Furthermore, there was about the same probability of corn exports through Arizona being lower than the minimum value as there was of corn exports being greater than the minimum value. There was a very small probability of corn exports being greater than the maximum value. Figure 25. Probabilities of Corn Exports through Arizona being < $31.4 Million and > $58.5 Million
Exports through New Mexico are sporadic and fairly low as compared to those of the
other states. As a result, a flat forecast was estimated with 60 percent probability of corn exports

29
through New Mexico remaining between the lower target value of $861,000 and the higher target value of $4.3 million through the forecast period (Figure 26).
Figure 26. Probabilities of Corn Exports through New Mexico being < $861,000 and > $4.3 Million
Table 1 summarizes Figures 23–26 in a more concise format. This format will be used in
state discussions for the other commodities with associated figures located in the appendix to this paper.
Table 1. Simulation Results for Corn Exports to Mexico by Border State
Texas Arizona California New Mexico
Million Dollars Max Target Value (2012–16 High) $1,789 $58.5 $54.3 $4.3 Min Target Value (2012–16 Avg) $1,417 $31.4 $34.7 $0.86 Variation between Max and Min 20.8% 46.3% 36.1% N/A
2017 Probability (%) Above Maximum 56% 10% 60% 1%
Between Minimum and Maximum 33% 44% 19% 60% Below Minimum 11% 46% 20% 40%
2021 Above Maximum 93% 6% 78% 3%
Between Minimum and Maximum 5% 46% 8% 61% Below Minimum 1% 48% 13% 36%

30
Top Ports for Corn Exports: The top ports of entry for corn exports to Mexico are in Texas. Laredo and Eagle Pass are currently the largest followed by El Paso and Progreso. Laredo is expected to experience the largest growth over the next five years with a 99 percent probability of corn exports exceeding the maximum target value of $800 million by 2021 (Figure 27). An interesting aspect for Laredo is that the minimum target value of $737 is only about eight percent less than the maximum value. The relatively tight range between the maximum and minimum target values indicates fairly consistent flows of corn shipment of U.S. corn to Mexico through Laredo. Figure 27. Probabilities of Corn Exports through Laredo, TX being < $737 Million and > $800 Million
Eagle Pass was also expected to grow as a port for corn exports over the next five years
with a 63 percent probability of corn exports exceeding the maximum target level of $545 million (Figure 28). When compared to Laredo, the difference between the minimum and maximum target values for Eagle Pass was 43 percent, much higher than the eight percent noted for Laredo. However, Eagle Pass has been growing significantly during the past five years and should continue to increase.
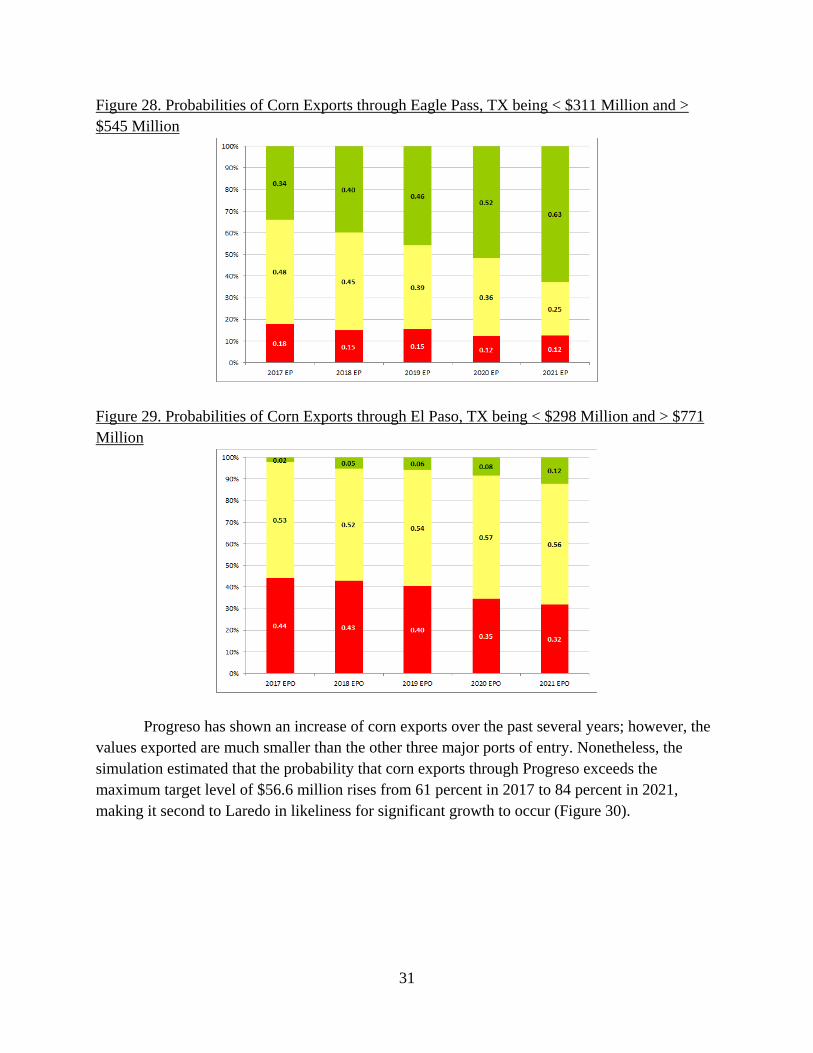
Although El Paso is currently the number three land port for exports to Mexico, it was the
second largest as recently as 2013. The maximum target level of $771 million occurred in 2012, before dropping in recent years. The model indicates that there was a 53–57 percent probability that corn exports through El Paso remain between the minimum and maximum target levels each year from 2017 to 2021 (Figure 29). Furthermore, the difference between the minimum and maximum target values for El Paso was 61 percent indicating significant variation.
31
Figure 28. Probabilities of Corn Exports through Eagle Pass, TX being < $311 Million and > $545 Million
Figure 29. Probabilities of Corn Exports through El Paso, TX being < $298 Million and > $771 Million
Progreso has shown an increase of corn exports over the past several years; however, the
values exported are much smaller than the other three major ports of entry. Nonetheless, the simulation estimated that the probability that corn exports through Progreso exceeds the maximum target level of $56.6 million rises from 61 percent in 2017 to 84 percent in 2021, making it second to Laredo in likeliness for significant growth to occur (Figure 30).

32
Figure 30. Probabilities of Corn Exports through Progreso, TX being < $44.5 Million and > $56.6 Million
Table 2 summarizes Figures 27–30 in a more concise format. This format will be used in
port discussions for the other commodities with associated figures located in the appendix.
Table 2. Simulation Results for Corn Exports to Mexico by Major Port
Laredo, TX Eagle Pass, TX El Paso, TX Progreso, TX
Million Dollars Max Target Value (2012–16 High) $800 $545 $771 $56.6 Min Target Value (2012–16 Avg) $737 $311 $298 $44.5 Variation between Max and Min 7.9% 42.9% 61.3% 21.4%
2017 Probability (%) Above Maximum 82% 34% 2% 61%
Between Minimum and Maximum 8% 48% 53% 17% Below Minimum 10% 18% 44% 22%
2021 Above Maximum 99% 63% 12% 84%
Between Minimum and Maximum 11% 25% 56% 6% Below Minimum --- 12% 32% 10%
Rice Exports
The value of rice exports through Texas has recently experienced a negative trend and the simulation forecasts show continued reductions over the next five years. The probability of rice exports through Texas to be below the minimum target value of $118.3 million over the next five years goes from 42 percent to 46 percent, while the probability of rice exports exceeding $145.5

33
million drops from 33 to 23 percent (Table 3). Rice exports through Arizona and California ports have been fairly consistent and are expected to increase over the next five years, with California having a 100 percent probability of exceeding the maximum target level of $35.5 million by 2021 and Arizona having a 68 percent probability of surpassing their 2012–2016 maximum, up from 40 percent in 2017.
Table 3. Simulation Results for Rice Exports to Mexico by Border State
Texas California Arizona
Million Dollars Max Target Value (2012–16 High) $145.5 $34.5 $2.45 Min Target Value (2012–16 Avg) $118.3 $31.8 $1.68 Variation between Max and Min 18.7% 7.8% 31.4%
2017 Probability (%) Above Maximum 33% 82% 40%
Between Minimum and Maximum 25% 10% 26% Below Minimum 42% 8% 34%
2021 Above Maximum 23% 100% 68%
Between Minimum and Maximum 31% --- 28% Below Minimum 46% --- 4%
Top Ports for Rice Exports: The main reason rice exports through Texas have dropped is because rice export values through Laredo, the largest single land port for shipments to Mexico, have been falling. They are forecast to continue declining over the next five years. The probability of rice exports through Laredo falling below their 2012–2016 average rises from 48 percent in 2017 to 85 percent in 2021 (Table 4). While rice exports through Eagle Pass declined in 2016, they remained relatively stable in the previous four years so the forecast shows they have a 70 percent probability of exceeding their previous 5-year high by 2021. Exports through both California rice ports, Otay Mesa and Calexico, are forecast to increase over the next five years with the probabilities of exports exceeding the maximum values reaching 76 percent and 66 percent, respectively, by 2021.
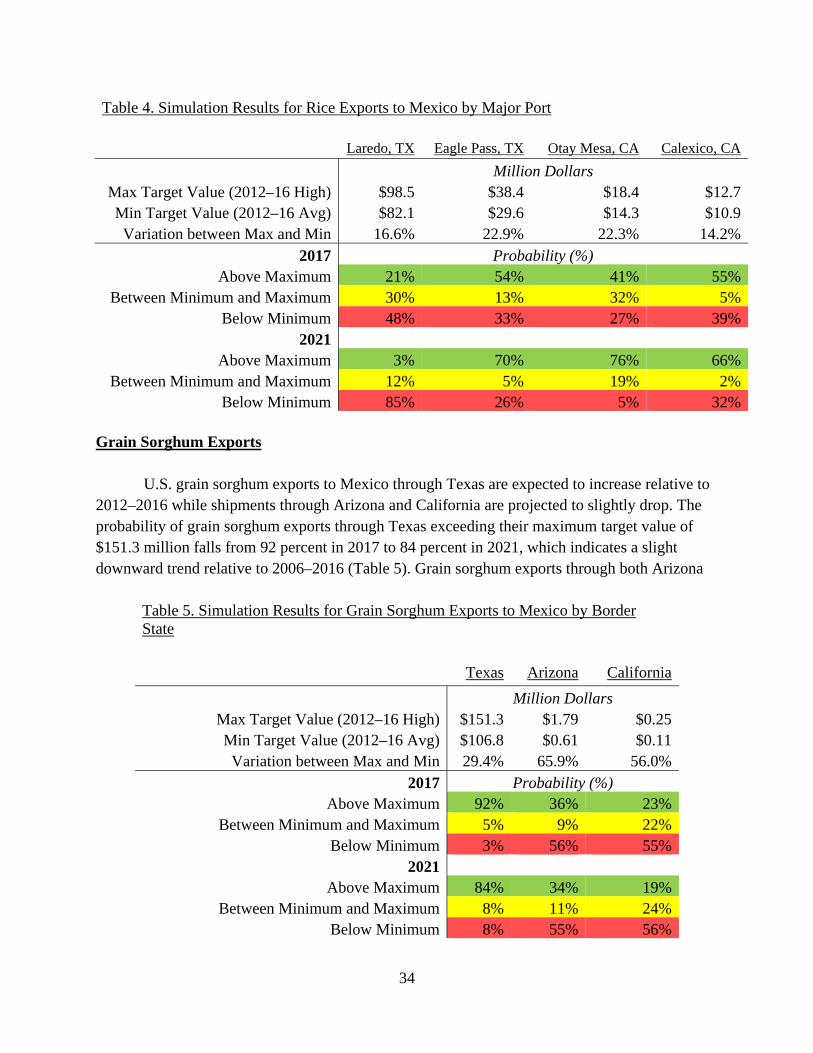
34
Table 4. Simulation Results for Rice Exports to Mexico by Major Port
Laredo, TX Eagle Pass, TX Otay Mesa, CA Calexico, CA
Million Dollars Max Target Value (2012–16 High) $98.5 $38.4 $18.4 $12.7 Min Target Value (2012–16 Avg) $82.1 $29.6 $14.3 $10.9 Variation between Max and Min 16.6% 22.9% 22.3% 14.2%
2017 Probability (%) Above Maximum 21% 54% 41% 55%
Between Minimum and Maximum 30% 13% 32% 5% Below Minimum 48% 33% 27% 39%
2021 Above Maximum 3% 70% 76% 66%
Between Minimum and Maximum 12% 5% 19% 2% Below Minimum 85% 26% 5% 32%
Grain Sorghum Exports
U.S. grain sorghum exports to Mexico through Texas are expected to increase relative to 2012–2016 while shipments through Arizona and California are projected to slightly drop. The probability of grain sorghum exports through Texas exceeding their maximum target value of $151.3 million falls from 92 percent in 2017 to 84 percent in 2021, which indicates a slight downward trend relative to 2006–2016 (Table 5). Grain sorghum exports through both Arizona
Table 5. Simulation Results for Grain Sorghum Exports to Mexico by Border State
Texas Arizona California
Million Dollars Max Target Value (2012–16 High) $151.3 $1.79 $0.25 Min Target Value (2012–16 Avg) $106.8 $0.61 $0.11 Variation between Max and Min 29.4% 65.9% 56.0%
2017 Probability (%) Above Maximum 92% 36% 23%
Between Minimum and Maximum 5% 9% 22% Below Minimum 3% 56% 55%
2021 Above Maximum 84% 34% 19%
Between Minimum and Maximum 8% 11% 24% Below Minimum 8% 55% 56%

35
and California have about a 55 percent probability of falling below the minimum target. It should be noted that recent large purchases of grain sorghum by China added further difficulty when simulating grain sorghum exports to Mexico. Top Ports for Grain Sorghum Exports: All major land ports for exporting grain sorghum to Mexico are in Texas, and they show a very flat forecast of grain sorghum exports to Mexico, mainly due to China purchases. However, it is important to point out that all three ports have a greater than 50 percent probability of grain sorghum exports to Mexico to be exceeding their respective maximum values for each of the next five years (Table 6).
Table 6. Simulation Results for Grain Sorghum Exports to Mexico by Major Port
Progreso, TX Laredo, TX Eagle Pass, TX
Million Dollars Max Target Value (2012–16 High) $115.7 $31.2 $20.2 Min Target Value (2012–16 Avg) $62.2 $20.2 $8.7 Variation between Max and Min 46.2% 35.3% 56.9%
2017 Probability (%) Above Maximum 71% 77% 58%
Between Minimum and Maximum 13% 13% 16% Below Minimum 16% 11% 26%
2021 Above Maximum 72% 78% 57%
Between Minimum and Maximum 13% 11% 17% Below Minimum 15% 11% 26%
Cotton Exports
Both Arizona and Texas have experienced a slight positive cotton export trends to Mexico. The probabilities of being below the 2012–2016 average and above the last five year’s maximum values have been inversely related through the forecasted period, supporting the positive trend seen over the last few years (Table 7). Even though both experience a positive trend, it is important to point out the cotton exports through Texas are much higher than Arizona. Top Ports for Cotton Exports: The main ports of entry for cotton exports to Mexico are in Texas. Over the past ten years, Laredo experienced a large drop in cotton exports while Pharr has picked up most the decrease. By 2021, the probability of cotton exports through Laredo to be below $185.5 million in 100 percent, while the probability of cotton exports through Pharr to be above $207.2 million in consistently over 60 percent through the five-year forecast (Table 8). Nogales was the third leading port and is expected to increase over the next five years.

36
Table 7. Simulation Results for Cotton Exports to Mexico by Border State
Texas Arizona
Million Dollars Max Target Value (2012–16 High) $416.3 $5.5 Min Target Value (2012–16 Avg) $384.0 $3.1 Variation between Max and Min 7.8% 43.6%
2017 Probability (%) Above Maximum 45% 35%
Between Minimum and Maximum 8% 25% Below Minimum 47% 40%
2021 Above Maximum 52% 46%
Between Minimum and Maximum 5% 28% Below Minimum 43% 26%
Table 8. Simulation Results for Cotton Exports to Mexico by Major Port
Pharr, TX Laredo, TX Nogales, AZ
Million Dollars Max Target Value (2012–16 High) $207.2 $209.9 $5.5 Min Target Value (2012–16 Avg) $197.4 $176.4 $3.1 Variation between Max and Min 4.7% 16.0% 43.6%
2017 Probability (%) Above Maximum 62% 8% 35%
Between Minimum and Maximum 1% 9% 25% Below Minimum 38% 84% 40%
2021 Above Maximum 64% --- 46%
Between Minimum and Maximum --- --- 28% Below Minimum 35% 100% 26%
Fresh Produce Exports
The simulation results indicated a significant positive trend for produce exports to Mexico through Arizona, California, and Texas. However, exports through Texas are of a lower magnitude. Produce exports through Arizona and California are projected to remain about the same; but California shows a higher growth potential over the forecasted period (Table 9). California was forecast to have a 100 percent probability of exceeding the maximum target value
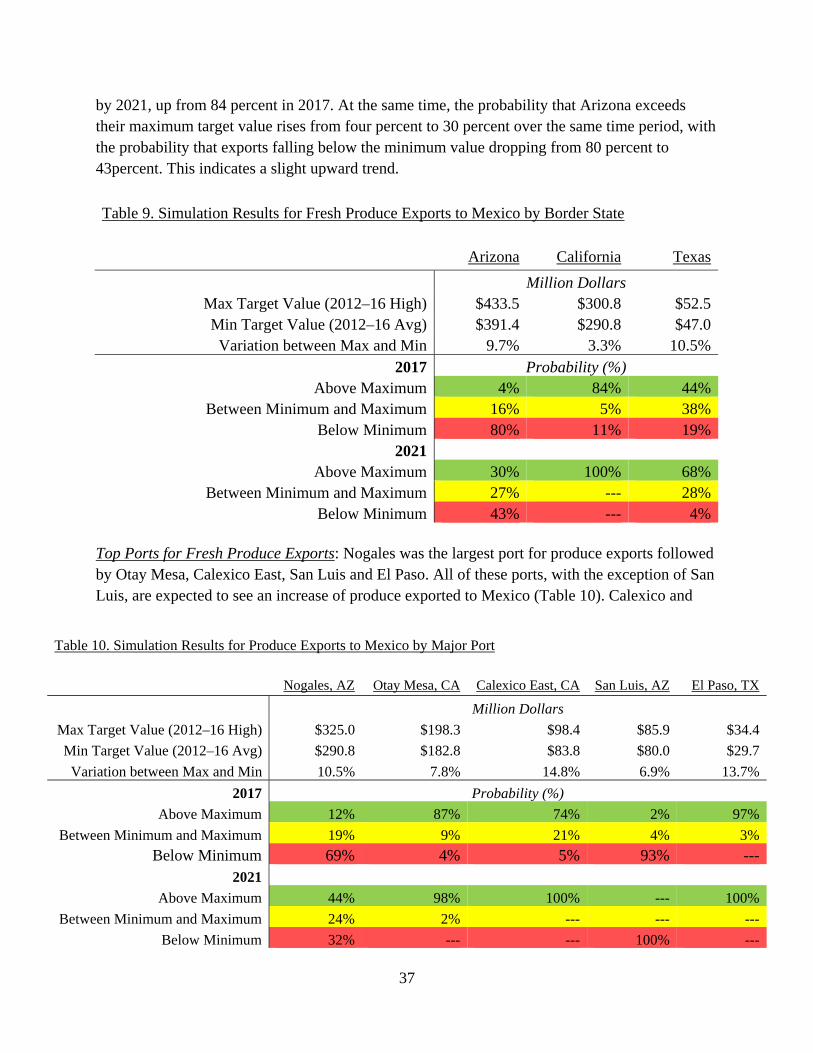
37
by 2021, up from 84 percent in 2017. At the same time, the probability that Arizona exceeds their maximum target value rises from four percent to 30 percent over the same time period, with the probability that exports falling below the minimum value dropping from 80 percent to 43percent. This indicates a slight upward trend.
Table 9. Simulation Results for Fresh Produce Exports to Mexico by Border State
Arizona California Texas
Million Dollars Max Target Value (2012–16 High) $433.5 $300.8 $52.5 Min Target Value (2012–16 Avg) $391.4 $290.8 $47.0 Variation between Max and Min 9.7% 3.3% 10.5%
2017 Probability (%) Above Maximum 4% 84% 44%
Between Minimum and Maximum 16% 5% 38% Below Minimum 80% 11% 19%
2021 Above Maximum 30% 100% 68%
Between Minimum and Maximum 27% --- 28% Below Minimum 43% --- 4%
Top Ports for Fresh Produce Exports: Nogales was the largest port for produce exports followed by Otay Mesa, Calexico East, San Luis and El Paso. All of these ports, with the exception of San Luis, are expected to see an increase of produce exported to Mexico (Table 10). Calexico and
Table 10. Simulation Results for Produce Exports to Mexico by Major Port
Nogales, AZ Otay Mesa, CA Calexico East, CA San Luis, AZ El Paso, TX
Million Dollars
Max Target Value (2012–16 High) $325.0 $198.3 $98.4 $85.9 $34.4
Min Target Value (2012–16 Avg) $290.8 $182.8 $83.8 $80.0 $29.7
Variation between Max and Min 10.5% 7.8% 14.8% 6.9% 13.7%
2017 Probability (%)
Above Maximum 12% 87% 74% 2% 97%
Between Minimum and Maximum 19% 9% 21% 4% 3%
Below Minimum 69% 4% 5% 93% --- 2021
Above Maximum 44% 98% 100% --- 100%
Between Minimum and Maximum 24% 2% --- --- ---
Below Minimum 32% --- --- 100% ---

38
Otay Mesa show the highest probability of growth with over 98 percent probability of increasing beyond the maximum five-year average by 2021 Nogales was also expected to see continued growth but at a much lower rate. El Paso was expected to grow, but at much lower value levels relative to the other four major ports. In 2017, San Luis is was expected to immediately fall below the minimum target value in 2017 and remain below that level throughout the time period. Fresh Produce Imports
Produce imports from Mexico are expected to significantly increase over the next five years. Texas and Arizona are the largest states of entry for Mexican produce and California closely follows. None of the three states are expected to see produce import values below their last five-year average (Figure 11). Moreover, all of them show that by year 2019 the probability of being above the maximum values of the last five years is at least 99 percent.
Table 11. Simulation Results for Fresh Produce Imports to Mexico by Border State
Texas Arizona California
Billion Dollars Max Target Value (2012–16 High) $5.3 $3.1 $1.8 Min Target Value (2012–16 Avg) $3.9 $2.9 $1.5 Variation between Max and Min 26.4% 6.5% 16.7%
2017 Probability (%) Above Maximum 35% 100% 6%
Between Minimum and Maximum 65% --- 94% Below Minimum --- --- ---
2021 Above Maximum 100% 100% 100%
Between Minimum and Maximum --- --- --- Below Minimum --- --- ---
Top Ports for Fresh Produce Imports: Nogales and Pharr are the largest ports of entry of Mexican produce followed by Otay Mesa and Laredo. Each was forecast to have a very high probability for growth over the next five years as seen by the lack of percentages in the yellow and red regions of each port in 2021 (Table 12).

39
Table 12. Simulation Results for Fresh Produce Imports to Mexico by Major Port
Nogales, AZ Pharr, TX Laredo, TX Otay Mesa, CA
Billion Dollars Max Target Value (2012–16 High) $2.9 $3.3 $1.8 $1.2 Min Target Value (2012–16 Avg) $2.7 $2.4 $1.3 $1.0 Variation between Max and Min 6.9% 27.3% 27.8% 16.7%
2017 Probability (%) Above Maximum 100% 17% 51% 19%
Between Minimum and Maximum --- 83% 49% 81% Below Minimum --- --- --- ---
2021 Above Maximum 100% 100% 100% 100%
Between Minimum and Maximum --- --- --- --- Below Minimum --- --- --- ---
Summary and Conclusions
Mexico is a major market for U.S. corn, rice, grain sorghum and cotton as well as the primary supplier of fresh fruits and vegetables. Presently, corn exports to Mexico and produce imports from Mexico are at all-time highs, while rice exports are down and grain sorghum exports are only now beginning to rebound after two very low years. Cotton exports to Mexico have also rebounded following recent low volumes. In general, exports to Mexico are expected to continue to increase in most cases absent any unforeseen disruptions.
Much U.S.-Mexico trade occurs over land borders. This includes nearly all fresh produce
trade, all grain sorghum and cotton exports, nearly sixty percent of corn exports, and thirty percent of rice trade. Furthermore, much of the trade in these products was likely to increase during the next five years. When agricultural supply chains are better understood and the flows of products across the U.S.-Mexico border are examined, the importance of pursuing efficiencies in both physical and administrative border infrastructure becomes evident.
The increasing cross-border traffic and use of land crossings, whether via road or rail, indicates the need for increased focus on infrastructure at the U.S.-Mexico border. Crossings in Texas, where the majority of new import traffic has occurred, may be especially important to maintain trade efficiency and accommodate projected growth in cargo volumes in both directions. While sea cargo is relatively less important in some cases, the use of ocean vessels for U.S.-Mexico trade has increased. Examination of infrastructure stresses on port systems should be undertaken to assess needs in the future.

40
References Adcock, Flynn J., Juan Villa, Mark Welch, Jose Antonio Perez-Vidalez, and C. Parr Rosson, III.
Tracking U.S. Grain, Oilseed, and Related Product Exports in Mexico. CNAS Publication Number 2013-01. Research Report for Cooperative Agreement between Agricultural Marketing Service, USDA and Texas A&M AgriLife Research, November 2013. Posted at http://cnas.tamu.edu.
Adcock, Flynn, Luis Ribera and Daniel Hanselka, Economic Impacts of Increased U.S. Imports
of Fresh Produce from Mexico by 2025. Department of Agricultural Economics, Texas A&M University/Texas A&M AgriLife Extension Service/Texas A&M AgriLife Research. CNAS Report 2017-1, February 2017. Posted at http://cnas.tamu.edu.
Agricultural Marketing Service, USDA. “A Look at the Production, Use, and Transportation of
U.S. Grain Sorghum.” Grain Transportation Report, pp 2-3. Accessed at www.ams.usda.gov. August 24, 2017.
Agricultural Marketing Service, USDA. Specialty Crops Market News Portal. Accessed
numerous times August 2015-April 2017. Animal and Plant Health Inspection Service, USDA. U.S. Grain Inspection Data for Exports to
Mexico by Mode and Port of Entry. Excel Spreadsheets. 2014-2016, monthly. Foreign Agricultural Service, USDA. Global Agricultural Trade Statistics. Online database
accessed various times August 2015-April 2017. http://apps.fas.usda.gov/gats/default.aspx
Richardson, J.W. Simulation for Applied Risk Management. Department of Agricultural
Economics, Texas A&M University.
Secretaría de Agricultura, Ganadería, Desarrollo Rural, Pesca y Alimentación (SAGARPA). Mexico Imports of Grains and Soybeans from the United States by Port of Entry. Excel Spreadsheets. 2012-June 2016, monthly.
U.S. Department of Transportation. Bureau of Transportation Studies Border Crossing/Entry
Data. Last accessed September 2016. https://transborder.bts.gov/ World Institute for Strategic Economic Research. WISERTrade. Online subscription-based
database accessed various times August 2015-April 2017. www.wisertrade.org

41
APENDIX A
Simulation Results for Estimated Trade Flows with Mexico of Selected
Commodities by State and by Port

42
Rice Exports by Border State: Figures A-1–A-3 correspond to Table 3 on page 33. Figure A-1. Probabilities of Rice Exports through Texas being < $118.3 Million and > $145.5 Million
Figure A-2. Probabilities of Rice Exports through California being < $31.8 Million and > $34.5 Million

43
Figure A-3. Probabilities of Rice Exports through Arizona being < $1.68 Million and > $2.45 Million
Rice Exports by Major Port: Figures A-4–A-7 correspond to Table 4 on page 34. Figure A-4. Probabilities of Rice Exports through Laredo, TX being < $82.1 Million and > $98.5 Million

44
Figure A-5. Probabilities of Rice Exports through Eagle Pass, TX being < $29.6 Million and > $38.4 Million
Figure A-6. Probabilities of Rice Exports through Otay Mesa, CA being < $14.3 Million and > $18.4 Million

45
Figure A-7. Probabilities of Rice Exports through Calexico, CA being < $10.7 Million and > $12.7 Million
Grain Sorghum Exports by Border State: Figures A-8–A-10 correspond to Table 5 on page 34. Figure A-8. Probabilities of Grain Sorghum Exports through Texas being < $106.8 Million and > $151.3 Million

46
Figure A-9. Probabilities of Grain Sorghum Exports through Arizona being < $611,000 and > $1.8 Million
Figure A-10. Probabilities of Grain Sorghum Exports through California being < $113,000 and > $246,000

47
Grain Sorghum Exports by Major Port: Figures A-11–A-13 correspond to Table 6 on page 35. Figure A-11. Probabilities of Grain Sorghum Exports through Progreso, TX being < $62.2 Million and > $115.7 Million
Figure A-12. Probabilities of Grain Sorghum Exports through Laredo, TX being < $20.2 Million and > $31.2 Million

48
Figure A-13. Probabilities of Grain Sorghum Exports through Eagle Pass, TX being < $8.7 Million and > $20.2 Million
Cotton Exports by Border State: Figures A-14–A-15 correspond to Table 7 on page 36. Figure A-14. Probabilities of Cotton Exports through Texas being < $384 Million and > $416.3 Million

49
Figure A-15. Probabilities of Cotton Exports through Arizona being < $3.1 Million and > $5.5 Million
Cotton Exports by Major Port: Figures A-16–A-18 correspond to Table 8 on page 36. Figure A-16. Probabilities of Cotton Exports through Pharr, TX being < $197.4 Million and > $207.2 Million

50
Figure A-17. Probabilities of Cotton Exports through Laredo, TX being < $176.4 Million and > $209.9 Million
Figure A-18. Probabilities of Cotton Exports through Nogales, AZ being < $3.1 Million and > $5.5 Million

51
Fresh Produce Exports by Border State: Figures A-19–A-21 correspond to Table 9 on page 37. Figure A-19. Probabilities of Fresh Produce Exports through Arizona being < $391.4 Million and > $433.5 Million
Figure A-20. Probabilities of Fresh Produce Exports through California being < $290.8 Million and > $300.8 Million

52
Figure A-21. Probabilities of Fresh Produce Exports through Texas being < $47.0 Million and > $52.5 Million
Fresh Produce Exports by Major Port: Figures A-22–A-26 correspond to Table 10 on page 37. Figure A-22. Probabilities of Fresh Produce Exports through Nogales, AZ being < $290.8 Million and > $325.0 Million

53
Figure A-23. Probabilities of Fresh Produce Exports through Otay Mesa, CA being < $182.8 Million and > $198.3 Million
Figure A-24. Probabilities of Fresh Produce Exports through Calexico East, CA being < $83.9 Million and > $98.4 Million

54
Figure A-25. Probabilities of Fresh Produce Exports through San Luis, AZ being < $80.0 Million and > $85.9 Million
Figure A-26. Probabilities of Fresh Produce Exports through El Paso, TX being < $29.7 Million and > $34.4 Million

55
Fresh Produce Imports by Border State: Figures A-27–A-29 correspond to Table 11 on page 38. Figure A-27. Probabilities of Fresh Produce Imports through Texas being < $3.9 Billion and > $5.3 Billion
Figure A-28. Probabilities of Fresh Produce Imports through Arizona being < $2.9 Billion and > $3.1 Billion

56
Figure A-29. Probabilities of Fresh Produce Imports through California being < $1.5 Billion and > $1.8 Billion
Fresh Produce Imports by Major Port: Figures A-30–A-33 correspond to Table 12 on page 39. Figure A-30. Probabilities of Fresh Produce Imports through Nogales, AZ being < $2.7 Billion and > $2.9 Billion

57
Figure A-31. Probabilities of Fresh Produce Imports through Pharr, TX being < $2.4 Billion and > $3.3 Billion
Figure A-32. Probabilities of Fresh Produce Imports through Laredo, TX being < $1.3 Billion and > $1.8 Billion

58
Figure A-33. Probabilities of Fresh Produce Imports through Otay Mesa, CA being < $1.0 Billion and > $1.2 Billion