Embed Size (px)
Citation preview

AURORA LPG
Second quarter 2016
presentation
August 26, 2016
CEO Børge Johansen
&
CFO Nikolai Jebsen

© Aurora LPG2
DISCLAIMER
THE PRESENTATION AND ITS APPENDICES (JOINTLY THE “PRESENTATION”) HAVE BEEN PREPARED BY AURORA LPG HOLDING ASA (THE “COMPANY”) FOR INFORMATION PURPOSES ONLY. THE RECEIPT OF THIS PRESENTATION IS PERSONAL, AND THE PRESENTATION MAY NOT REPRODUCED, REDISTRIBUTED OR PASSED ON, IN WHOLE OR IN PART, TO ANY OTHER PERSON.
THE PRESENTATION DOES NOT CONSTITUTE OR FORM PART OF AN OFFER TO SELL OR A SOLICITATION OF AN OFFER TO PURCHASE OR ACQUIRE ANY SHARES OR OTHER SECURITIES OR FINANCIAL INSTRUMENTS. THE PRESENTATION HAS NOT BEEN REVIEWED OR REGISTERED WITH, OR APPROVED BY, ANY PUBLIC AUTHORITY, STOCK EXCHANGE OR REGULATED MARKET PLACE.
THE CONTENTS OF THE PRESENTATION ARE NOT TO BE CONSTRUED AS LEGAL, BUSINESS, INVESTMENT OR TAX ADVICE. EACH RECIPIENT SHOULD CONSULT WITH ITS OWN PROFESSIONAL ADVISORS FOR ANY SUCH MATTERS AND ADVICE.
THE PRESENTATION DOES NOT GIVE A COMPLETE ACCOUNT OF THE COMPANY, ITS AFFAIRS, FINANCIAL STATUS OR OTHERWISE, OR THE SECURITIES ISSUED BY THE COMPANY. THE COMPANY IS NOT MAKING ANY REPRESENTATION OR WARRANTY, EXPRESSED OR IMPLIED, AS TO THE ACCURACY, RELIABILITY OR COMPLETENESS OF THE PRESENTATION, AND NEITHER THE COMPANY, NOR ANY OF ITS DIRECTORS, OFFICERS OR EMPLOYEES, WILL HAVE ANY LIABILITY TO YOU OR ANY OTHER PERSONS RESULTING FROM YOUR USE OF THE INFORMATION IN THE PRESENTATION. NO PART OF THIS PRESENTATION SHOULD FORM THE BASIS OF OR BE RELIED UPON IN CONNECTION WITH ANY INVESTMENT DECISION OR ANY CONTRACT OR COMMITMENT TO PURCHASE OR SUBSCRIBE FOR ANY SECURITIES.
THERE MAY HAVE BEEN CHANGES IN MATTERS THAT AFFECT THE COMPANY SUBSEQUENT OR PRIOR TO THE DATE OF THE PRESENTATION. NEITHER THE ISSUE NOR DELIVERY OF THE PRESENTATION SHALL UNDER ANY CIRCUMSTANCE CREATE ANY IMPLICATION THAT THE INFORMATION CONTAINED HEREIN IS CORRECT AS OF ANY TIME SUBSEQUENT OR PRIOR TO THE DATE HEREOF OR THAT THE AFFAIRS OF THE COMPANY HAVE NOT SINCE OR PRIOR CHANGED. THE COMPANY DOES NOT INTEND, AND DOES NOT ASSUME ANY OBLIGATION, TO UPDATE OR CORRECT ANY INFORMATION INCLUDED HEREIN.
AN INVESTMENT IN THE COMPANY INVOLVES RISK, AND SEVERAL FACTORS COULD CAUSE THE ACTUAL RESULTS, PERFORMANCE OR ACHIEVEMENTS OF THE COMPANY TO BE MATERIALLY DIFFERENT FROM ANY FUTURE RESULTS, PERFORMANCE OR ACHIEVEMENTS THAT MAY BE EXPRESSED OR IMPLIED BY STATEMENTS AND INFORMATION IN THIS PRESENTATION. FURTHERMORE, THE PRESENTATION INCLUDES AND IS BASED ON, AMONG OTHER THINGS, FORWARD-LOOKING INFORMATION AND STATEMENTS. SUCH FORWARD-LOOKING INFORMATION AND STATEMENTS ARE BASED ON THE CURRENT EXPECTATIONS, ESTIMATES AND PROJECTIONS OF THE COMPANY OR ASSUMPTIONS BASED ON INFORMATION AVAILABLE TO THE COMPANY. SUCH FORWARD-LOOKING INFORMATION AND STATEMENTS REFLECT CURRENT VIEWS WITH RESPECT TO FUTURE EVENTS AND ARE SUBJECT TO RISKS, UNCERTAINTIES AND ASSUMPTIONS. THE COMPANY CANNOT GIVE ANY ASSURANCE AS TO THE CORRECTNESS OF SUCH INFORMATION AND STATEMENTS.
THE DISTRIBUTION OF THE PRESENTATION, AS WELL AS ANY PURCHASE, SALE OR TRANSFER OF SECURITIES ISSUED BY THE COMPANY, MAY IN CERTAIN JURISDICTIONS BE RESTRICTED BY LAW, INCLUDING BUT NOT LIMITED TO THE UNITED STATES, CANADA, JAPAN, UNITED KINGDM AND AUSTRALIA. PERSONS INTO WHOSE POSSESSION THIS PRESENTATION MAY COME ARE REQUIRED TO INFORM THEMSELVES ABOUT AND TO COMPLY WITH ALL APPLICABLE LAWS AND REGULATIONS IN FORCE IN ANY JURISDICTION IN OR FROM WHICH IT INVESTS OR RECEIVES OR POSSESSES THIS PRESENTATION. THE PRESENTATION IS NOT DIRECTED TO, OR INTENDED FOR DISTRIBUTION TO OR USE BY, ANY PERSON OR ENTITY THAT IS A CITIZEN, RESIDENT OR LOCATED IN ANY JURISDICTION WHERE SUCH DISTRIBUTION, PUBLICATION OR USE WOULD BE CONTRARY TO LAW OR REGULATION OR WHICH WOULD REQUIRE ANY REGISTRATION OR LICENSING WITHIN SUCH JURISDICTION. IN PARTICULAR, NEITHER THIS PRESENTATION NOR ANY COPY OF IT MAY BE TRANSMITTED OR DISTRIBUTED, DIRECTLY OR INDIRECTLY, INTO UNITED STATES, CANADA, JAPAN OR AUSTRALIA.
THE PRESENTATION IS SUBJECT TO NORWEGIAN LAW, AND ANY DISPUTE ARISING IN RESPECT OF THIS PRESENTATION IS SUBJECT TO THE EXCLUSIVE JURISDICTION OF NORWEGIAN COURTS.

© Aurora LPG3
Time charter equivalent income of USD 14.2 million
Time charter equivalent per day of USD 23,500
EBITDA 9.8 million
Ship opex per day of USD 6,300, SGA per day USD 795
Operating profit of USD 5.3 million
Net profit USD 1.7 million
EPS 6 cents
Delivery of the Aurora Brage – 50M drawn of debt
Subsequent:
Secured USD 21 million new debt
Final two new builds delivered by HHI
Refinancing of Taurus, Leo and Capricorn
Financing of Frigg concluded - she was subsequently delivered to the group on
the morning of August 26, 2016
Company working on the long financial structure with various stakeholders
SUMMARY

© Aurora LPG4
P&L impacted by lower rates and more vessels
Cost are coming even further down per vessel day with at USD 6,300
Finance expenses up on less capitalization due to fewer vessels under construction and agio movement
The company will continue cutting costs and management believes the current cost structure is sustainable
PROFIT & LOSS
Note Q2 2016 Q2-16 YTD Q2 2015 Q2-15 YTD 2015
Voyage revenue - - - 9 721 9 721
Time Charter revenue - - - 6 140 6 140
Pool revenue 14 195 33 193 23 675 29 475 69 137
Total revenue 14 195 33 193 23 675 45 336 84 998
Voyage expenses - - - -3 200 -3 200
Ship Operating expenses -3 821 -5 711 -1 977 -3 918 -7 808
Commercial management expenses -124 -172 -204 -415 -624
Loss on receivables - - - - -2 556
Administrative expenses -480 -974 -574 -1 075 -2 910
Depreciation -4 461 -6 846 -2 197 -4 392 -8 790
Total operating expenses -8 886 13 703 -4 953 -13 000 -25 887
Other gain - - - 784 784
Operating profit 5 309 19 490 18 722 33 120 59 894
Finance income 101 367 88 228 1 219
Finance expenses 7 -3 746 -4 041 -202 -815 -1 935
Profit before income tax expense 1 664 15 816 18 609 32 533 59 178
Tax expense - - - - -
Net income 1 664 15 816 18 609 32 533 59 178
Earnings per share (basic) 0.06 0.55 0.63 1.10 2.02
Earnings per share (diluted) 0.06 0.55 0.63 1.10 2.02

© Aurora LPG5
Operating cash flow at EBITDA –working capital management
still focus
Investments as per previous guidance
Restricted cash reversed against new build account in July
Repayments include cash flows to mortgage debt and holdcounsecured bond loan
Cash ultimo USD 23.2 million
CASH FLOW
Q2 2016 Q2-16
YTD Q2 2015 Q2-15 YTD 2015
Operating activities
Profit before income tax expense 1 664 15 816 18 609 32 534 59 178
Other gain - - - -784 -784
Depreciation 4 461 6 846 2 197 4 392 8 790
Other non-cash 337 478 104 179 301
Other - 80 - -80 -80
Amortization fees 337 398 104 259 381
Change in working capital 3 301 2 103 -3 274 -5 227 6 862
Inventories -167 -369 979 1 886 1 966
Voyage in progress - - 6 479 397 397
Receivables and other current assets 2 299 283 -13 200 -6 237 8 459
Accounts payable -886 -108 -296 -1 796 -802
Deferred revenue - - - -1 774 -1 774
Other current liabilities 2 055 2 297 2 763 2 296 -1 384
Net cash from operating activities 9 763 25 243 17 637 31 095 74 427
Investing activities
Proceeds from available-for-sale financial assets
- - - 5 235 5 235
Investment in restricted cash -46 835 -46 835 - - -
Purchase of vessels and equipment -83 561 -323 850 -18 -43 -41
Additions to newbuildings 24 283 103 679 -24 083 -25 009 -60 019
Net cash from investing activities -106 113 -267 005 -24 101 -19 816 -54 825
Financing activities
Dividends - -2 869 - - -8 780
Purchase of treasury shares - -1 197 -2 100 -2 100 -6 233
Repayment of long term debt -6 577 -9 319 -3 580 -6 222 -11 506
Issuance of debt 100 024 247 035 - - 27 987
Net cash from financing activities 93 447 233 651 -5 680 -8 321 1 468
Net increase (decrease) in cash and cash equivalents
-2 903 -8 111 -12 144 2 959 21 701
Cash and cash equivalents at beginning of period
26 060 31 269 25 301 10 198 10 198
Cash and cash equivalents at the end of period
23 158 23 158 13 157 13 157 31 269

© Aurora LPG6
Assets
New buildings carrying the pre-delivery elements on the Freyja and Frigg
Vessels and equipment impacted by delivery of the Brage and depreciation
Restricted cash related to the Freyja
Equity and liabilities
44% equity ratio
Book equity USD 295 million
Borrowings impacted by debt drawn down and scheduled repayments
In compliance with debt covenants
BALANCE SHEET
Notes Q2 2016 Q2 2015 2015
ASSETS
Newbuildings 3 51 006 119 675 154 685
Vessels and equipment 3 540 498 227 887 223 501
Restricted cash 3,8 46 835 - -
Other non-current assets 168 164 161
Total non-current assets 638 507 347 725 378 347
Cash and cash equivalents 23 158 13 157 31 269
Derivative financial asset - 80 80
Inventories 609 323 246
Accounts receivable - 2 713 -
Pool receivable 3 969 17 029 4 589
Other current assets 1 623 829 1 286
Total current assets 29 358 34 131 37 469
Total assets 667 865 381 856 415 816
EQUITY AND LIABILITIES
Share capital 4 482 482 482
Share premium 4 183 274 191 955 186 142
Treasury shares 5 -7 430 -2 100 -6 233
Retained earnings 118 748 76 285 102 932
Total equity 295 074 266 622 283 323
Borrowings 6 318 631 97 468 107 012
Total non-current liabilities 318 631 97 468 107 012
Borrowings, current portion 6 50 258 10 568 23 928
Accounts payable 1 047 2 996
Dividends - 2 968 -
Other current liabilities 2 855 4 229 558
Total current liabilities 54 160 17 767 25 481
Total equity and liabilities 667 865 381 856 415 816
© Aurora LPG7
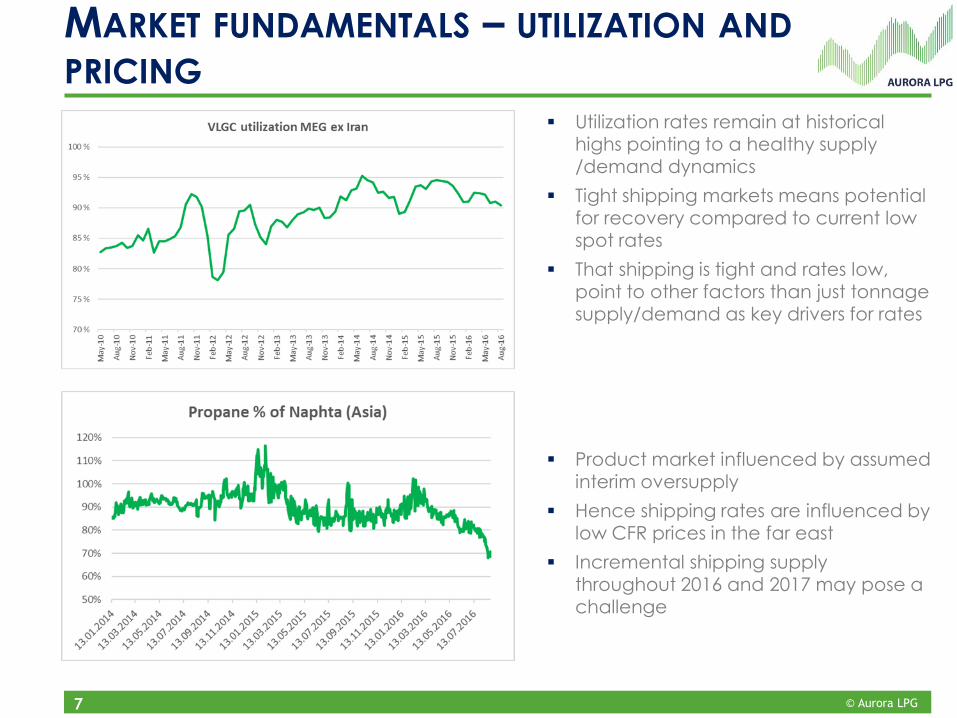
Utilization rates remain at historical highs pointing to a healthy supply /demand dynamics
Tight shipping markets means potential for recovery compared to current low spot rates
That shipping is tight and rates low, point to other factors than just tonnage supply/demand as key drivers for rates
Product market influenced by assumed interim oversupply
Hence shipping rates are influenced by low CFR prices in the far east
Incremental shipping supply throughout 2016 and 2017 may pose a challenge
MARKET FUNDAMENTALS – UTILIZATION AND
PRICING
© Aurora LPG8
US LPG MARKET DYNAMICS
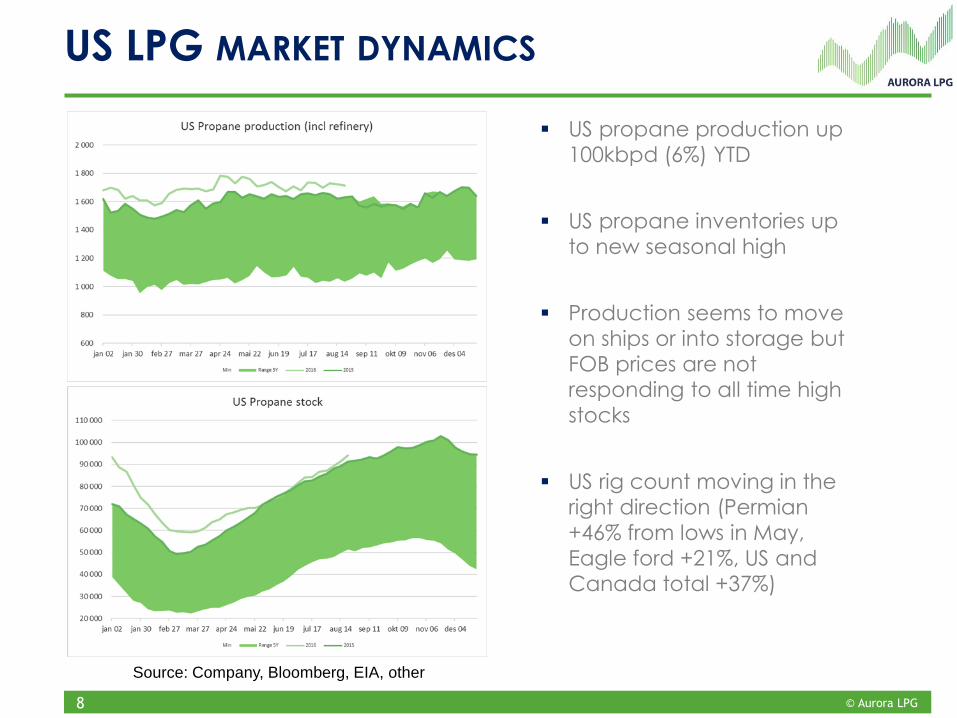
US propane production up
100kbpd (6%) YTD
US propane inventories up
to new seasonal high
Production seems to move
on ships or into storage but
FOB prices are not
responding to all time high
stocks
US rig count moving in the
right direction (Permian
+46% from lows in May,
Eagle ford +21%, US and
Canada total +37%)
Source: Company, Bloomberg, EIA, other

© Aurora LPG9
EAST OF SUEZ LPG PRODUCT MARKET
Strong growth in cargo volumes into eastern
markets underpins long term demand picture
and enables undertsanding of short term
assumed oversupply
Current supply is likely 5-7 cargos too high – at
historical underlying demand growth the
market can balance out if in the short to
medium term
Short term potential triggers:• Seasonal upturn (winter season) could
balance product market quickly• India YTD behind on imports, catch up effect
in 2nd half?• Pricing mechanisms may impact demand
growth positively and shorten time to balanced market
Source: Company, Bloomberg, EIA, other

© Aurora LPG10
Address
Aurora LPG Holding ASA
Dronningen 1
0287 Oslo
Norway
Contact
CEO: Børge F. Johansen mobile +47 41 41 44 44 [email protected]
CFO: Nikolai C.H. Jebsen mobile +47 46 28 22 22 [email protected]
COO: Sujoy K. Seal mobile +47 94 81 66 76 [email protected]
AURORA LPG HOLDING ASA