Embed Size (px)
Citation preview

Urmia LakeAssessing the portions of each parameter on
decline of the Lake’s water level in different years
Ra’na KoushkiBerlin-Nov 2013
You created this PDF from an application that is not licensed to print to novaPDF printer (http://www.novapdf.com)

UrmiaUrmia LakeLake
You created this PDF from an application that is not licensed to print to novaPDF printer (http://www.novapdf.com)
3737°° 4242′′ 00″″ NN4545°° 1919′′ 00″″ EE
You created this PDF from an application that is not licensed to print to novaPDF printer (http://www.novapdf.com)

You created this PDF from an application that is not licensed to print to novaPDF printer (http://www.novapdf.com)
You created this PDF from an application that is not licensed to print to novaPDF printer (http://www.novapdf.com)
You created this PDF from an application that is not licensed to print to novaPDF printer (http://www.novapdf.com)

A shallow water & high level lake without any outlet.
Urmia lake basin area: about 52000 Km²
Lake Volume: 32000MCM
Lake Area: about 5300 km2
Lake Depth: about 4.5 m
Normal TDS: about 240 gram/lit
Present TDS: More than 400 gram/lit
National Park National Park (since (since 19711971))
RamsarRamsar Site Site (since (since 19751975))
UNESCO Biosphere Reserve UNESCO Biosphere Reserve (since (since 19761976))
You created this PDF from an application that is not licensed to print to novaPDF printer (http://www.novapdf.com)

Variation of the Surface of Urmia Lake (1984-2011)
You created this PDF from an application that is not licensed to print to novaPDF printer (http://www.novapdf.com)

1270.5
1270.7
1270.9
1271.1
1271.3
1271.5
1271.7
1271.9
1272.1
1272.3
›Íôù‡û
≈
ôvôûó
ôvôû⁄ ûÂ⁄ ùõj ›€Âz
›Íôù‡û
≈
ôvôûó
ôvôû⁄ ûÂ⁄ ùõj ›€Âz
›Íôù‡û
≈
ôvôûó
ôvôû⁄ ûÂ⁄ ùõj ›€Âz
›Íôù‡û
≈
ôvôûó
ôvôû⁄ ûÂ⁄ ùõj ›€Âz
›Íôù‡û
≈
ôvôûó
ôvôû⁄
,. 33 ,. 34 ,. 4+ ,. 4, ,. 4-
xj í∂
•
Åwfiw• ∙fix j í ∂•„èwÍùô„Î⁄ ‡ùv ‘ w• › Íôù‡û≈ üv, . 33 Ç Íw¬÷, 1 ôvôû⁄, . 4-
h= 1.33m
You created this PDF from an application that is not licensed to print to novaPDF printer (http://www.novapdf.com)

Eastern Azerbaijan:34 cities
290 villages
Western Azerbaijan:21 cities
1784 Villages
Kurdistan:2 cities
294 villages
57 cities & 3028 occupied
villages
You created this PDF from an application that is not licensed to print to novaPDF printer (http://www.novapdf.com)

Population and its distribution in Urmia lake basin
populationareaProvince
percentpersonpercentKm ²
49.1293938842.720117.7East Azar
47.0280964146.121701.6West Azar
3.923436811.25284.9Kurdistan
100598339710047104.2sum
You created this PDF from an application that is not licensed to print to novaPDF printer (http://www.novapdf.com)

Portion of rivers, seasonal rivers and floodways end to the lake
Zarine river
41%
simine river 11%
nazloochay
6%
Barandozchay
6%
Godarchay
8%
mahabadchay
5%
Shahr
chay
3%
Zoola
chay
1%
North of
basin
2%
floodways
5%
Ajichay 10%
Ghale chay
1%
Sofichay
2%
No of last hygrometry stations in main rivers ending to the lake: 18 with
37752 km² area (82% of basin area without lake)
•The volume of water discharged into the lake by these rivers varies considerably
during the year: during the spring, Talkheh River and Simineh River may each
discharge about 57 (cms), while the rate drops to only 3.7 or 1.7 (cms) in the dry
summer.You created this PDF from an application that is not licensed to print to novaPDF printer (http://www.novapdf.com)

Domestic, Industrial & Agricultural Water Consumption (MCM)
•56% from Surface Water & 44% From the Aquifer
•More than 87% of Water Consumption is in Agricultural Sector
You created this PDF from an application that is not licensed to print to novaPDF printer (http://www.novapdf.com)

yearArea of Irrigated lands
(ha)1979 158523
1991 306131
1998 381751
2002 3877052006 4156022011 450000 1979 1991 1998 2002 2006 2011
Area of Irrigated lands in Urmia lake basin (ha)
Agricultural Water Demand in the Basin(BMC)
1979 1991 1998 2002 2006 2011You created this PDF from an application that is not licensed to print to novaPDF printer (http://www.novapdf.com)

Significant drawdown on the lake’s water level
Increase in the lake water salinity
Appearance of salty released lands and dispersion of salts by wind
Considerable reduction in ecological sustainability of the lake
Impacts on the local (micro) climate
Main problems and hazards threatening the sustainability of Urmia Lake :
You created this PDF from an application that is not licensed to print to novaPDF printer (http://www.novapdf.com)

Methodologies We are formulating and developing an integrated water resources model in
order to analyze the impacts of different parameters (climate change and
water resources development projects) on Lake Urmia.
The main steps we undertook to investigate the solutions for our statement
as below:
Rainfall analysis according to data from 34 stations
Completing and analyzing runoff from 14 stations
Calculating and analyzing the lake water inflow
Evaluating impacts of upstream developments on downstream water supply
Evaluating impacts of drought on the rate of discharge of the rivers
You created this PDF from an application that is not licensed to print to novaPDF printer (http://www.novapdf.com)

Variation of Precipitation in a 60-Year Period (mm)
Total statistical period: 60 yearsDecreasing precipitation period: 16 years
You created this PDF from an application that is not licensed to print to novaPDF printer (http://www.novapdf.com)

Average of Precipitation in a 60-Year Period (mm)
Statistical period without trend: First 44 years
You created this PDF from an application that is not licensed to print to novaPDF printer (http://www.novapdf.com)

Variation of Precipitation(Average: In a 59-Year Period, A period without trend, Drought period) (mm)
381364
315
0
100
200
300
400
500
600
700
1952
1954
1956
1958
1960
1962
1964
1966
1968
1970
1972
1974
1976
1978
1980
1982
1984
1986
1988
1990
1992
1994
1996
1998
2000
2002
2004
2006
2008
2010
Precipitation during resting period: 381 mm Precipitation during last 16 years: 315 mm Average of decreased precipitation: 66 mmYou created this PDF from an application that is not licensed to print to novaPDF printer (http://www.novapdf.com)

Variation of Urmia Lake Water Level in a 47-Year Period
1278.40
1271.25
1275.16
1270
1271
1272
1273
1274
1275
1276
1277
1278
1279
1965
1966
1967
1968
1969
1970
1971
1972
1973
1974
1975
1976
1977
1978
1979
1980
1981
1982
1983
1984
1985
1986
1987
1988
1989
1990
1991
1992
1993
1994
1995
1996
1997
1998
1999
2000
2001
2002
2003
2004
2005
2006
2007
2008
2009
2009
2010
Time (Year)
Wat
er L
eve
(m)
You created this PDF from an application that is not licensed to print to novaPDF printer (http://www.novapdf.com)

Inflow to the Lake In order to estimate the volume of water inflow to the lake, the recorded
information of 14 hydrometric stations is used. Since none of these stations are closed to the lake, the discharge values to the
lake have been calculated according hydrological methods. Then removing the trend and adding the values of new consumption at the
upstream, the volume of water entering the lake in the absence of additionalupstream consumption was calculated.
In another scenario with the assumption that none of the four major dam hasbeen constructed, discharge values in the stations affected by the dams, for theyears after dam construction was estimated using hydrological methods.
According to calculations, the average volume of water entering the lake duringthe static period in natural circumstances that there is no dam and no overdraft atthe upstream is estimated about 6565.8 (MCM) and the mean of inflow over thestatic period assumption that there is no dam is 5946.4 (MCM) and over the totalperiod (59-year), the average of natural inflow (without any dam and excessiveconsumption at the upstream) is 6244.7 and the average of inflow to the lakewhile there is no dam is 5404.9 (MCM).
Volumes of water entering the lake during the statistical basis period, in each ofthe above scenarios are shown in the next figure.
You created this PDF from an application that is not licensed to print to novaPDF printer (http://www.novapdf.com)

Variation of Inflow to Urmia Lake in a 59-Year Period
4835.1
0
2000
4000
6000
8000
10000
12000
14000
16000
1952
1954
1956
1958
1960
1962
1964
1966
1968
1970
1972
1974
1976
1978
1980
1982
1984
1986
1988
1990
1992
1994
1996
1998
2000
2002
2004
2006
2008
2010
Year
MC
M
You created this PDF from an application that is not licensed to print to novaPDF printer (http://www.novapdf.com)

Summary of hydrological calculations(MCM)
You created this PDF from an application that is not licensed to print to novaPDF printer (http://www.novapdf.com)

Assessing the portions of each parameter on decline of water level of the lake
You created this PDF from an application that is not licensed to print to novaPDF printer (http://www.novapdf.com)

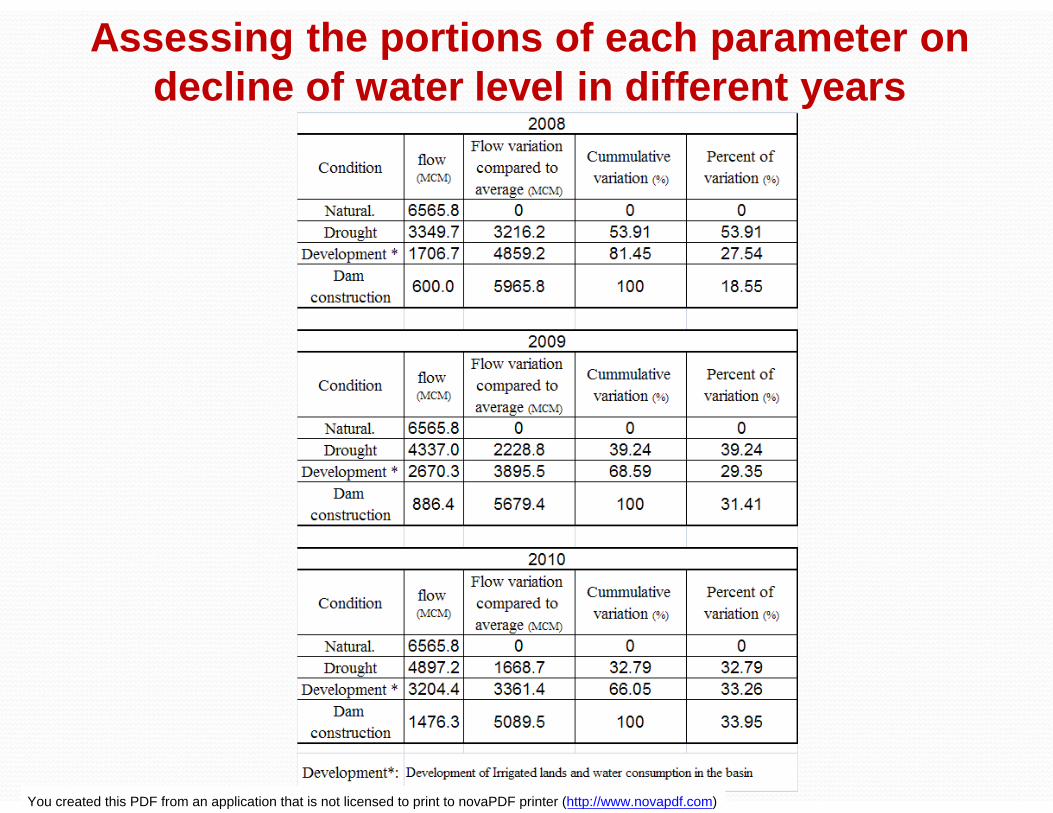
Assessing the portions of each parameter on decline of water level in different years
You created this PDF from an application that is not licensed to print to novaPDF printer (http://www.novapdf.com)

Assessing the portions of each parameter on decline of water level in different years
You created this PDF from an application that is not licensed to print to novaPDF printer (http://www.novapdf.com)
Assessing the portions of each parameter on decline of water level in different years
You created this PDF from an application that is not licensed to print to novaPDF printer (http://www.novapdf.com)

As is shown in a bow tables, the effect of drought is more than theother parameters.
Assessing the portions of each parameter on decline of water level in different years
Average of effect of each parameter on decline of water level of the lake between the years 1999-2010
You created this PDF from an application that is not licensed to print to novaPDF printer (http://www.novapdf.com)

Conclusion
You created this PDF from an application that is not licensed to print to novaPDF printer (http://www.novapdf.com)

Main Affective Factors on Drying Up the Lake Urmia:
Decrease in precipitation: Also the times ofprecipitation less than 10 mm, has increased.
Increase in temperature: an increased of about2C will lead to an increase in evaporation of about11.2% from the lake surface and about 4.8% fromthe whole surface area of the basin; thus, resultingin an increase in water consumption foragriculture.
Increase in overdraft from the aquifers and theincrease in number of illegal wells .
You created this PDF from an application that is not licensed to print to novaPDF printer (http://www.novapdf.com)

Average Eastern Level
30 Km
Average Western Level
Lake’s Water Level
1275 m
Lake’s Width
1430 m
WaterLevel
WaterLevel
1365 m
Evaporation Rain
Infiltration
River
You created this PDF from an application that is not licensed to print to novaPDF printer (http://www.novapdf.com)

Poor level of efficiency in water consumption forirrigation and industrial use.
Changing in crop pattern: From crops requiring low-to high-water consumption.
Change in land use: Pastures to orchards ,…
Expansion in areas of irrigated lands.
Construction of hydraulic structures(dams,..)
Increase in population: Leading to an increase in water consumption, Specially in Agricultural Sector.
Main Affective Factors on Drying Up the Lake Urmia:
You created this PDF from an application that is not licensed to print to novaPDF printer (http://www.novapdf.com)

Conclusion: The growth in population leads to an increase in water
consumption in different sectors, thereby necessity thedevelopment of the water resources
Uneven distribution of precipitation in the country in termsof time and location results in the inability to respond to waterneeds in different sectors; so, it is necessary to construct waterreservoirs to ensure water supply during times of lowprecipitation or lack of.
Dams may damage the environment, but when there is a lackof a proper hardware and software management of dams withinan integrated water resources management that has theparticipation of all stakeholders, the damage would beexponential.
You created this PDF from an application that is not licensed to print to novaPDF printer (http://www.novapdf.com)

Conclusion: Dams are useful not unless they are constructed not for a
purpose but as a result of pressures from different sectors in
the country.
The most damage to the lake is a result of the cumulative
effect of droughts in the past recent years.
Water consumption in the basin is more than 90% of the total
potential of water resources and if mismanaged, the lake
would still dry up even in normal conditions.
You created this PDF from an application that is not licensed to print to novaPDF printer (http://www.novapdf.com)

Conclusion: With the consideration of demand on one side and the
consequential damage to the natural and social environment
on the other with the drying up of the lake, it is critical that
stakeholders and all pertinent parties agree on the
necessary measures to undertake so that the lake be
preserved and the needs of the stakeholders are met.
So what we need to save the lake is an Integrated
Watershed Management (IWM).
You created this PDF from an application that is not licensed to print to novaPDF printer (http://www.novapdf.com)
Thanks for your kind attention
You created this PDF from an application that is not licensed to print to novaPDF printer (http://www.novapdf.com)