Embed Size (px)
Citation preview

Data Mining: Research, Development, and Consultancies
Ole Møller NielsenComputer Sciences Laboratories,
Research School of Information Science and EngineeringAustralian National University, Canberra
10 October, 2000
URL: discus.anu.edu.au/ml/dm
1
Accreditations
CollaboratorsCommonwealth Science and Industrial Research Organisation (CSIRO),
Centre for Mathematics and Information Science,Enterprise Data Mining Group
FundingDanish Research Council (SNF)
andCooperative Research Centre for Advanced Computational Systems (ACSys)
2

Outline
What is Data Mining ?
Technology Development
Consultancies
Research example
3
What is Data Mining anyway?
DefinitionAutomatic extraction of new and useful knowledge from large datasets.
Challenges- Extremely large and complex datasets- Useful information is implicit and hidden- Privacy and sensitivity issues exist- Errors and missing values are common
Catchy phrases
We are drowning in information but starving for knowledge!
Let the data speak for itself !
4

Typical Approaches to Data Mining
� Predictive ModellingTree induction, Neural nets, Regression
� SegmentationClustering, Classification
� Link AnalysisAssociations, Sequential patterns
� Deviation DetectionVisualisation, Outlier Detection
Usually no sampling !
5
CRISP Data Mining Model
EvaluateModel
BuildModel(s)
PrepareData
UnderstandCustomer
AnalyseData
TakeAction
Modelling takes typically only 10% of the time!
CRISP-DM: Cross Industry Standard Process for Data Mining, http://www.crisp-dm.org
6

Recent Consultancies
� Australian Health Insurance Commission.Medicare transaction data (MBS) from NSW 1997, 1998.37 mill. records, 44 attributes.Objective: Characterise different behaviour patterns of pathology labs.
� Australian Department for Health and Age Care.Medicare (MBS) and Pharmaceutical (PBS) data from WA, 1994 to 1998.MBS: 85 mill. records, 15 attributes. PBS: 52 mill. records, 10 attributes.Objective: Just find something interesting !
HardwareCPU: 12 processor Sun Enterprise 4500 shared memory multiprocessorRAM: 4.75 GigabytesDISK: 256 Gigabytes (RAID disk array)
7
Data model
Data Mining Tools: Python, C, Matlab, MPI
Variable width,comma separated format
Python, C, MPI MySQL, Python
Perl
Binary flat files SQL database
Fixed width format
8

Technology Development - DMTools
With Peter Christen, Australian National University
Markus Hegland, Australian National University
� Need for fast, easy, and flexible access to large amounts of data
� Based on the Python scripting language and MySQL
� A collection of library routines for convenient data- access- analysis- visualisation and report generation
� Core technologies: Caching, Compression, Parallel Data Base Access
9
Definition of Cohorts - Example
Verbal definitionAll individuals who have seen a psychiatrist in 1998
Operational definitionPatient IDs appearing in the MBS 1998 database withitem numbers
�����–�����
,��
–�����
, or� �������
DMTools definitionPSYCHIATRIC = [[’00134’,’00159’], [’00300’, ’00352’], ’14224’]cohort = get cohort(’mbs’,PSYCHIATRIC,1998)
10

General Supervised Caching Tool
Properties- Trades space for speed- Supervised caching of general function results- Persistence
Applications- Core utility used extensively throughout DMTools- User function used in code development for quick retrieval of pre-computed data- Shared use of cached results
Examplecohort = get cohort(’mbs’,PSYCHIATRIC,1998)
cohort = cache(get cohort,(’mbs’,PSYCHIATRIC,1998))
11
Time savings using caching
Based on 16646 hits by five users in the period 10/8/2000 to 5/10/2000.
Function Name Hits CPU Time Gain(%) Size (MB)simplequery 6580 26 1 90.47 2.28execquery 8185 138 7 91.68 4.39get mbs patients 303 1298 69 94.56 40.07
get cohort 532 338 0 97.30 0.20get selected transactions 815 1560 4 99.55 4.04multiquery 46 133 0 99.69 0.76get drug usage 167 1389 0 99.99 0.01gen latex section 18 635 0 100.00 0.00
The five users saved 918 CPU hours – about a week each!
————————————-
12

High Dimensional Surface FittingWith Zuowei Shen, National University of Singapore
Markus Hegland, Australian National University
Regression- Model data by computing an approximating smooth surface.
Regression, Predictive models, Classification, Visualisation, etc- Alternative to Neural nets and Tree induction- Curse of dimensionality - full surface is prohibitive in dimensions � �
Breaking the curse of dimensionality
- Additive models, Wavelets (this work !)- Matlab Demonstrator: HISURF
13
Multiresolution analysis
� ���� ������� ��� � ���� ���� ������� ������������ �� � � � � �!� � �#" � �%$ &�%' () � ��*+-, �/. +102
Simplifying notation:
� $ �*+3, ��4 + 4 + $ 5 &� 6 $
. + �� 6 �
14

A priori compression in high dimensions
� � $ ��� , � � $ ��
� , ��*��� , � 4 � � $ �*������� � � , �
��� , ��4 � �
Some spaces are less important than others�������� ���� ����� � � ������ � � ���� ��� "! " � �#"
Approximation idea
$ � $ *�&% ���'�(�� � �'% ���� "! " � � % ���
� , � 4 � �
15
2D example
Projection errors Active spaces)+*-,/.1000000�2436587�9�365;:=< 000000 >�? 7A@ >B? :DC EGFIH E .KJ L
01
23
4
0
1
2
3
4
j2
j1 MONQPSRSTVUXWZYPSR[Y R \ ]^
]\^R
_
P ^_
^ R ^ ] `
MONQP ^ TVUXW^ R^]`
16

3D example
17
Density and Accuracy (� � �
)
Density of� ��� � � �
Density of$ ������� � � �� � � ��� � �#" � � ���
1 2 3 4 5 6 710
1
102
103
104
105
106
107
j
UncompressedCompressed
Accuracy:��� ��� � � � ��� � � ��� � � ���� � � �� � � � �
� �
18

The smoothing problem
Data set:� � � + " ��� � + " � � 6 $ � ����������� � � + " � � � ��� � + " � �
Minimise the functional
� ��� � $ �+-, � � � � � � + " � � � � + " � � ����� ����� � � � � � � � �Linear system (from Galerkin projection on
���or
$ �)
��� � � ��� ��� $ � ���
19
Coefficient matrix in different bases and spaces
� ��� H � � ( "! L C E ! # )
20

Floating point operations,� � �
1 2 3 4 5 6 7 810
0
105
1010
1015
1020
1025
1030
Floating point operations
d
UncompressedCompressed
21
Smoothed magnetic field
Based on 735,500 measurements.
TPSFEM: 16641 vars HISURF: 833 vars ADDFIT: 388 vars
22
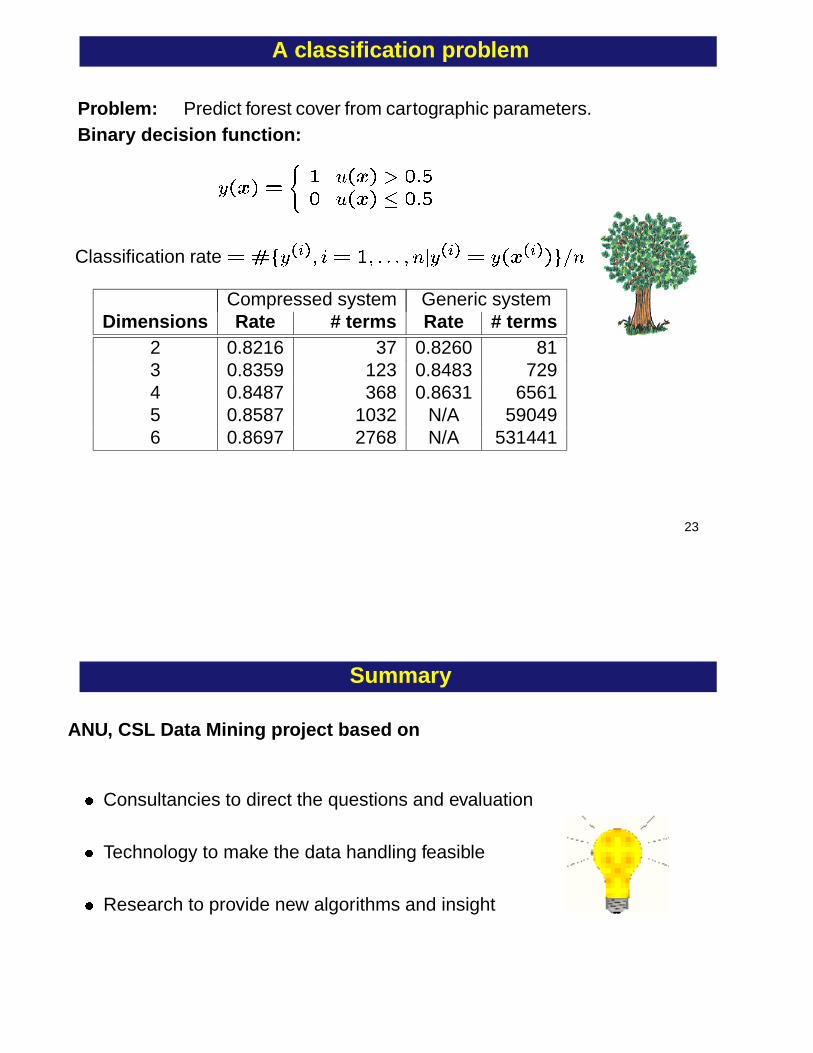
A classification problem
Problem: Predict forest cover from cartographic parameters.Binary decision function:
� � � � $ 5 � � � � � � � � � � � � � � �
Classification rate$ � � � � + " � 6 $ � ��������� � � � � + " $ � � � � + " � ��� �Compressed system Generic system
Dimensions Rate # terms Rate # terms2 0.8216 37 0.8260 813 0.8359 123 0.8483 7294 0.8487 368 0.8631 65615 0.8587 1032 N/A 590496 0.8697 2768 N/A 531441
23
Summary
ANU, CSL Data Mining project based on
� Consultancies to direct the questions and evaluation
� Technology to make the data handling feasible
� Research to provide new algorithms and insight
24