Embed Size (px)
Citation preview
F
Urban stormwater—Queensland best practice
environmental management guidelines 2009
Technical Note: Derivation of Design Objectives
Prepared for Environmental Protection Agency
Prepared by EDAW Ecological Engineering Practice Area January 2009
DESIGN, ENVIRONMENTS AND PLANNING WORLDWIDE

Urban stormwater—Queensland BPEM guidelines 2009 – Technical Note i
This document has been prepared solely for the benefit of the Environmental Protection Agency and is
issued in confidence for the purposes only for which it is supplied. Unauthorised use of this document in
any form whatsoever is prohibited. No liability is accepted by EDAW Australia Pty Ltd or any employee,
contractor, or sub-consultant of this company with respect to its use by any other person.
This disclaimer shall apply notwithstanding that the document may be made available to other persons
for an application for permission or approval to fulfill a legal obligation.
Document Control Sheet
Report title: Urban stormwater—Qld BPEM guidelines 2009 Technical Note: Derivation of Design Objectives
Version: V002
Author(s): Malcolm Eadie
Approved by: Malcolm Eadie
Signed:
Date: January 2009
Distribution: Environmental Protection Agency
EDAW is accredited as a 100% Climate Neutral business in the Australian Region.
We are committed to reducing our energy consumption and ecological footprint and have neutralised our emissions from travel and

Urban stormwater—Queensland BPEM guidelines 2009 – Technical Note ii
Table of Contents
1 Introduction ...................................................................................................... 1 2 Stormwater Quality Management Design Objectives .................................... 2
2.1 Stormwater Quality Management Design Objective ............................... 2
2.1.1 Targets ....................................................................................2
2.1.2 Application...............................................................................2
2.1.3 Compliance ..............................................................................3 3 Water Quantity Design Objectives.................................................................. 5
3.1 Frequent Flow Management Design Objective ....................................... 5
3.1.1 Target ......................................................................................5
3.1.2 Application...............................................................................6
3.1.3 Demonstrating Compliance ......................................................6
3.2 Waterway Stability Management Design Objective ................................ 8
3.2.1 Target ......................................................................................8
3.2.2 Application...............................................................................8
3.2.3 Demonstrating Compliance ......................................................8 4 Summary........................................................................................................... 9 5 References...................................................................................................... 11 Appendix A: Derivation of Water Quality Design Objectives ............................. 12 Appendix B: Derivation of Water Quantity Design Objectives........................... 38

Urban stormwater—Queensland BPEM guidelines 2009 – Technical Note 1
EDAW EDAW EDAW EDAW DESIGN, PLANNING AND ENVIRONMENTS WORLDWIDE 1
1 Introduction
This Technical Note describes technical studies undertaken to derive stormwater management design objectives for the operational phase of development as described in Chapter 2 of the “Urban stormwater—best practice environmental management guidelines 2009” (Queensland EPA 2009). The stormwater management design objectives are intended for application within urban developments throughout Queensland and focus on stormwater management requirements for the protection of waterway health. Other stormwater management design objectives relating to drainage and flooding are not covered here but are nonetheless still important and intended to apply in concert with the design objectives for waterway health described herein.
The stormwater management design objectives for waterway health have been derived using the methods employed in “WSUD: Developing Design Objectives for Water Sensitive Developments in South East Queensland – Version 2, 8th November 2007” (SEQ HWP 2007). The HWP work included extensive testing of the proposed WSUD design objectives on a broad range of urban developments to assess feasibility in terms of cost and ease of compliance. The findings from the SEQ HWP work suggests the stormwater management design objectives described in Chapter 2 of the “Urban stormwater—best practice environmental management guidelines 2009–” (Queensland EPA 2009) will be applicable to most urban developments in Queensland.

Urban stormwater—Qld BPEM guidelines 2009 – Technical Note 2
EDAW EDAW EDAW EDAW DESIGN, PLANNING AND ENVIRONMENTS WORLDWIDE 2
2 Stormwater Quality Management Design Objectives
The urban stormwater quality management design objectives for Queensland as described in Chapter 2 of the “Urban stormwater—best practice environmental management guidelines 2009” (Queensland EPA 2009) adopt a pollutant load reduction approach. This is consistent with the approach employed in other parts of Australia and as recommended in Australian Runoff Quality (Engineers Australia 2005, p1-7) and ANZECC (2000, p 3.3.2). A discussion on the benefits of adopting a load reduction approach as compared to a discharge concentration approach is provided in (SEQ HWP 2007, Ch 2.1).
2.1 Stormwater Quality Management Design Objective
The load reduction targets for Queensland were derived from predictive computer modeling using MUSIC (Model for Urban Stormwater Improvement Conceptualisation) as detailed in Appendix A. The load reduction targets are based on achievable load reductions from current “best practice” stormwater management infrastructure operating in Queensland climatic and pollutant export conditions. “Best Practice” in this instance refers to stormwater management infrastructure designed and constructed to
1contemporary design standards and sized to operate at the
technology’s reasonable limit of economic performance as defined by the “point of diminishing return” on treatment performance curves derived from the predictive modeling (refer to Appendix A).
Currently, bioretention treatment systems employing surface vegetation and soil filtration are widely considered to be the most efficient stormwater treatment technology for reducing loads of typical urban stormwater pollutants, namely: suspended sediments; particulate and soluble nutrients; metals and hydrocarbons. If gross pollutants (>5mm diameter) are present, or are likely to be present, then a “treatment train” approach is typically required with a gross pollutant capture device placed at the head (i.e. upstream) of other downstream treatment devices.
To ensure the best possible stormwater treatment outcome is achieved, the load reduction targets for Queensland have been established from the predicted performance of bioretention treatment sized at the technologies “point of diminishing return”. For all regions of Queensland, this was found (refer to Appendix A) to be bioretention treatment area equivalent to 1.5% of the contributing catchment area (e.g. a 10ha residential or industrial development would require a 0.15ha bioretention treatment area to comply with the local areas load reduction targets).
2.1.1 Targets
The load reduction targets for Queensland are outlined in Table 2.1 with the regions within which the targets apply shown on Figure 2.1.
2.1.2 Application
Applicable to all urban development, excluding development that is less than 25% impervious and that complies with the frequent flow management design objective (refer Section 3.1).
1 Contemporary design standards for stormwater management infrastructure can be found in the most
recent revision of WSUD Technical Design Guidelines in SEQ (SEQ HWP) or a locally relevant
equivalent.

Urban stormwater—Qld BPEM guidelines 2009 – Technical Note 3
EDAW EDAW EDAW EDAW DESIGN, PLANNING AND ENVIRONMENTS WORLDWIDE 3
2.1.3 Compliance
To ensure practical compliance with the load reduction targets in Table 2.1, quantitative model testing was undertaken to confirm that other stormwater treatment technologies (i.e. other than bioretention) can also be used to comply with the targets. This testing, which included stormwater treatment technologies such as gross pollutant capture devices, swales and constructed stormwater wetlands, configured to form “treatment trains”, showed the targets can be attained by a range of “treatment train” solutions. This allows for solution flexibility.
Compliance with the load reduction targets will typically be demonstrated using an accepted quantitative model (such as MUSIC) with all model inputs and outputs provided to the approval authority to enable review and verification of the model results.
Table 2.1 Summary of design objectives for stormwater quality management – operational (post construction) phase of development. (From Chapter 2 of the “Urban stormwater—best practice environmental management guidelines 2009”)
[12]Minimum reduction in developed site pollutant loads (%) Region
Suspended solids (TSS)
Total phosphorus (TP)
Total nitrogen (TN)
Gross Pollutants > 5mm
Eastern Cape York
75 60 35 90
Central and Western Cape York (north)
75 60 40 90
Central and Western Cape York (south)
80 65 40 90
Wet Tropics 80 65 40 90
Dry Tropics 80 65 40 90
Central Coast (north)
75 60 35 90
Central Coast (south)
85 70 45 90
South East Queensland
80 60 45 90
Western Districts 85 70 45 90
2 It is expected that application of best practice designed stormwater treatment technologies configured in an appropriately sequenced ‘treatment train’ will exceed the design objectives presented in Table 2.1

Urban stormwater—Qld BPEM guidelines 2009 – Technical Note 4
EDAW EDAW EDAW EDAW DESIGN, PLANNING AND ENVIRONMENTS WORLDWIDE 4
Figure 2.1 Figure 2.1 Figure 2.1 Figure 2.1 –––– Delineation of regions for applicat Delineation of regions for applicat Delineation of regions for applicat Delineation of regions for application of operational phase stormwater quality management ion of operational phase stormwater quality management ion of operational phase stormwater quality management ion of operational phase stormwater quality management
design objectivesdesign objectivesdesign objectivesdesign objectives.

Urban stormwater—Qld BPEM guidelines 2009 – Technical Note 5
EDAW EDAW EDAW EDAW DESIGN, PLANNING AND ENVIRONMENTS WORLDWIDE 5
3 Water Quantity Design Objectives
Stormwater quantity management for waterway health enhancement focuses on the management of frequent urban stormwater flows that cause disturbance to aquatic habitats and aquatic ecosystem health. This is distinct from urban stormwater quantity management for flood management purposes which is concerned with the management of less frequent, more extreme stormwater flows that cause nuisance flooding and potential flood damages. The later is an important part of integrated stormwater management and should in no way be compromised in pursuit of the management of more frequent flows for waterway health enhancement.
Two stormwater quantity management design (performance) objectives have been proposed in Chapter 2 of the “Best Practice Environmental Management Guidelines – Urban Stormwater” (EPA 2008). These are:
• A Frequent Flow Management Design Objective.
• A Waterway Stability Management Design Objective.
These are discussed in more detail in the following sections.
3.1 Frequent Flow Management Design Objective
This objective aims to protect in-stream ecosystems from the significant effects of increased runoff frequency by capturing the initial portion of runoff (referred hereafter as the design runoff capture depth) from impervious areas. This approach ensures that the frequency of hydraulic disturbance to in-stream ecosystems in developed catchments is similar to fully pervious pre-developed catchment conditions.
3.1.1 Target
Numerical modeling studies (refer to Appendix B) were undertaken to define an appropriate design runoff capture depth for the Frequent Flow Management design objective based on the modeling undertaken for the objectives determined for SEQ. The design runoff capture depth was selected to provide a similar frequency of surface runoff for small rainfall events and to achieve a similar overall annual volume of runoff (AVR) to an un-developed catchment.
The resultant design objective is to capture and manage the following design runoff capture depth (mm/day) from all impervious surfaces:
• Developments with a total fraction impervious <40%: design runoff capture depth > 10mm/day
• Developments with a total fraction impervious >40%: design runoff capture depth > 15mm/day
Table 3.1 shows the result summary of annual volume of runoff (AVR) calculations which helped to determine the recommended design runoff capture depths. Results presented in this table as well as the flow duration curves in Appendix B indicate that these daily runoff capture depths do not achieve 100% replication of 3pre-development hydrology, but they do significantly reduce the frequency of surface runoff events and overall volumetric runoff coefficients. This is especially evident when comparing the AVR and flow duration curves calculated for impervious areas with no runoff capture and management.
Capturing and managing the first 20mm of surface runoff from impervious surfaces would achieve close to “pre-developed” catchment hydrology and where practical this should be pursued by development proponents.
Urban stormwater—Qld BPEM guidelines 2009 – Technical Note 6
EDAW EDAW EDAW EDAW DESIGN, PLANNING AND ENVIRONMENTS WORLDWIDE 6
3.1.2 Application
This objective is expected to be only applied in catchments to waterways and wetlands that are classified as High Environmental Value (HEV) systems or if the local Council intends to rehabilitate a modified system.
3.1.3 Demonstrating Compliance
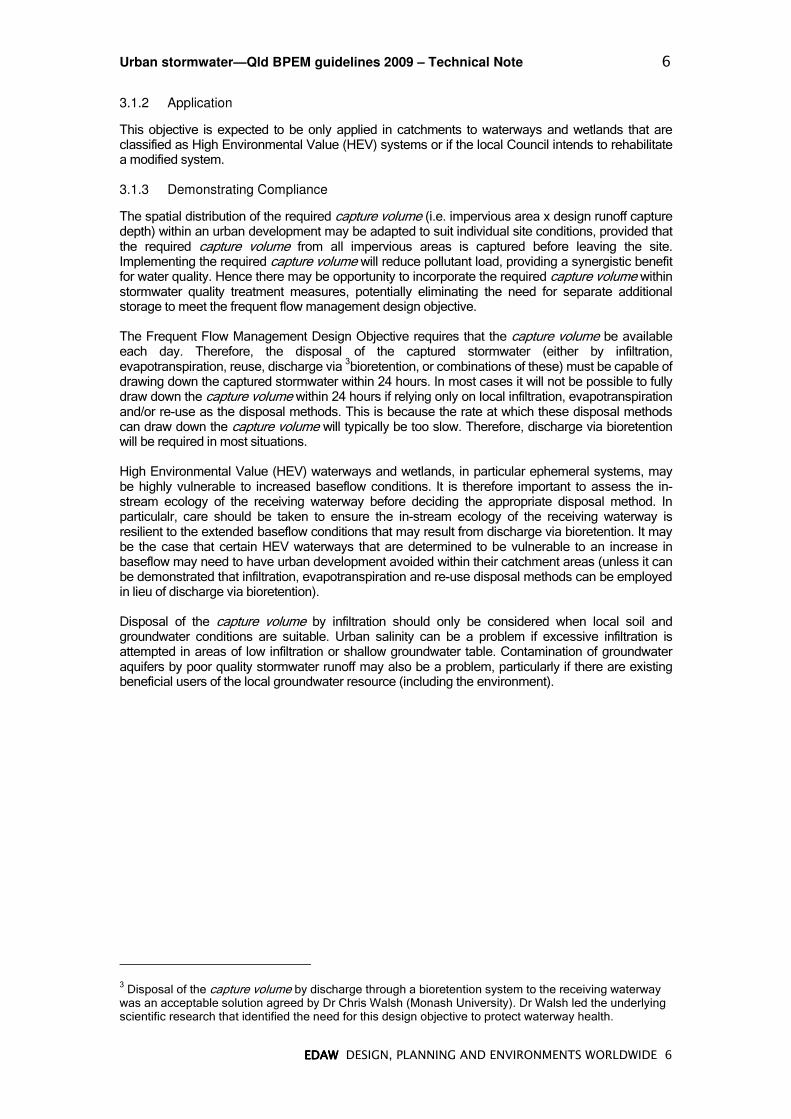
The spatial distribution of the required capture volume (i.e. impervious area x design runoff capture depth) within an urban development may be adapted to suit individual site conditions, provided that the required capture volume from all impervious areas is captured before leaving the site. Implementing the required capture volume will reduce pollutant load, providing a synergistic benefit for water quality. Hence there may be opportunity to incorporate the required capture volume within stormwater quality treatment measures, potentially eliminating the need for separate additional storage to meet the frequent flow management design objective.
The Frequent Flow Management Design Objective requires that the capture volume be available each day. Therefore, the disposal of the captured stormwater (either by infiltration, evapotranspiration, reuse, discharge via
3bioretention, or combinations of these) must be capable of
drawing down the captured stormwater within 24 hours. In most cases it will not be possible to fully draw down the capture volume within 24 hours if relying only on local infiltration, evapotranspiration and/or re-use as the disposal methods. This is because the rate at which these disposal methods can draw down the capture volume will typically be too slow. Therefore, discharge via bioretention will be required in most situations.
High Environmental Value (HEV) waterways and wetlands, in particular ephemeral systems, may be highly vulnerable to increased baseflow conditions. It is therefore important to assess the in-stream ecology of the receiving waterway before deciding the appropriate disposal method. In particulalr, care should be taken to ensure the in-stream ecology of the receiving waterway is resilient to the extended baseflow conditions that may result from discharge via bioretention. It may be the case that certain HEV waterways that are determined to be vulnerable to an increase in baseflow may need to have urban development avoided within their catchment areas (unless it can be demonstrated that infiltration, evapotranspiration and re-use disposal methods can be employed in lieu of discharge via bioretention).
Disposal of the capture volume by infiltration should only be considered when local soil and groundwater conditions are suitable. Urban salinity can be a problem if excessive infiltration is attempted in areas of low infiltration or shallow groundwater table. Contamination of groundwater aquifers by poor quality stormwater runoff may also be a problem, particularly if there are existing beneficial users of the local groundwater resource (including the environment).
3 Disposal of the capture volume by discharge through a bioretention system to the receiving waterway was an acceptable solution agreed by Dr Chris Walsh (Monash University). Dr Walsh led the underlying scientific research that identified the need for this design objective to protect waterway health.

Urban stormwater—Qld BPEM guidelines 2009 – Technical Note 7
EDAW EDAW EDAW EDAW DESIGN, PLANNING AND ENVIRONMENTS WORLDWIDE 7
Table 3.1 Summary of design objectives for management of stormwater quantity. Frequent flow management objectives for developments with differing proportions of impervious area are shown as bold, italicised values.

Urban stormwater—Qld BPEM guidelines 2009 – Technical Note 8
EDAW DESIGN, PLANNING AND ENVIRONMENTS WORLDWIDE
3.2 Waterway Stability Management Design Objective
Urban development typically increases the duration of sediment-transporting flow in urban streams, often leading to increased rates of bed and bank erosion and damage to key benthic habitat (i.e. scouring of sand/gravel beds and displacement of larger structural habitats such as pool riffle sequences). The purpose of this design objective is therefore to limit changes in downstream sediment transport potential by attenuating flows of intermediate magnitude (i.e. up to 1 yr ARI). These events are responsible for a large proportion of total sediment movement in streams.
Details of the technical studies undertaken to develop the waterway stability management design objective for South East Queensland are provided in Appendix B and C of the “WSUD: Developing Design Objectives for Water Sensitive Developments in South East Queensland – Version 2, 8th November 2007” (SEQ HWP 2007). These same technical studies have not been undertaken for other parts of Queensland. Local Council’s are therefore encouraged to undertake similar technical studies to those undertaken in SEQ to confirm the appropriateness of the SEQ waterway management design objective for their local area. In the interim, the SEQ waterway stability management design objective will apply to all parts of Queensland
3.2.1 Target
Limit the post-development peak 1 year Average Recurrence Interval (ARI) event discharge within the receiving waterway to the pre-development peak 1 year Average Recurrence Interval (ARI) event discharge.
3.2.2 Application
The Waterway Stability Design Objective is expected to be applied only within catchments contributing to un-lined waterways or if the local Council intends to decommission a lined waterway and re-instate a natural channel system.
3.2.3 Demonstrating Compliance
Appendix C in “WSUD: Developing Design Objectives for Water Sensitive Developments in South East Queensland – Version 2, 8th November 2007” (SEQ HWP 2007) describes two methods that can be used to demonstrate compliance with the Waterways Stability Management Design Objective.
Method A is a quick look-up curve derived from simplistic triangulated hydrographs (climatic region specific) and is considered suitable for application to all development scales across Queensland (despite the 10ha upper limit placed on use of Method A in SEQ). Independent testing of Method A by consultant DesignFlow (as part of a peer review of this Technical Note) showed Method A can be used for both small and large (>10ha) scale developments. The testing undertaken by Designflow showed Method A conservatively over-estimates, for all development scales, the required on-site detention storage required to comply with the design objective. If an individual developer wants to further refine the required on-site detention storage then the more detailed Method B, which involves catchment scale runoff routing modeling, can be adopted.
Local Council’s with access to capable catchment hydrology and hydraulics practitioners may decide to apply Method B to selected catchments and then prescribe in local planning schemes the required on-site detention and permissible 1yr ARI site discharge to be complied with by prospective developments.

Urban stormwater—Qld BPEM guidelines 2009 – Technical Note 9
EDAW DESIGN, PLANNING AND ENVIRONMENTS WORLDWIDE
4 Summary
This technical note summarises the technical studies completed to derive state-wide WSUD design objectives as presented in Chapter 2 of the “Best Practice Environmental Management Guidelines – Urban Stormwater” (EPA 2008). The proposed design objectives were derived using the same technical methods employed for derivation of WSUD design objectives for urban developments in South East Queensland as described in “WSUD: Developing Design Objectives for Water Sensitive Developments in South East Queensland – Version 2, 8th November 2007” (SEQ HWP 2007).
The three proposed WSUD design objectives are:
• A Stormwater Quality Design Objective. This objective aims to protect receiving water quality by limiting the quantity of key pollutants discharged in stormwater from urban development.
• Stormwater Quantity Design Objectives being:
- A Frequent Flow Management Design Objective. This objective aims to protect in-stream ecosystems from the significant effects of increased runoff frequency by capturing the initial portion of runoff from impervious areas. This approach ensures that the frequency of hydraulic disturbance to in-stream ecosystems in developed catchments is similar to predevelopment conditions.
- A Waterway Stability Management Design Objective. This objective aims to prevent exacerbated in-stream erosion downstream of urban areas by controlling the magnitude and duration of sediment-transporting flows
The performance measures/targets for each of these objectives are presented in Table 4.1 and have been derived to reflect the different climatic regions throughout Queensland

Urban stormwater—Qld BPEM guidelines 2009 – Technical Note 10
EDAW DESIGN, PLANNING AND ENVIRONMENTS WORLDWIDE
Table Table Table Table 4.14.14.14.1 –––– Summary of Summary of Summary of Summary of WSUD ObjectivesWSUD ObjectivesWSUD ObjectivesWSUD Objectives
Design Objective Performance Measure/Target
Stormwater Quality Stormwater discharged from development areas to be treated in accordance with best practice for each climatic region (refer Table 2.1 and Figure 2.1).
Waterway Stability Limit the post-development peak one-year Average Recurrence Interval (ARI) event discharge within the receiving waterway to the pre-development peak one-year Average Recurrence Interval (ARI) event discharge
Frequent Flow
Capture and manage the following design runoff capture depth (mm/day) from all impervious areas such that the frequency of surface runoff is the same as pre-development conditions:
- Developments with a total fraction impervious <40%: Design runoff capture depth = 10mm/day
- Developments with a total fraction impervious >40%: Design runoff capture depth = 15mm/day
Note, Runoff capture capacity needs to be replenished within 24 hours of the runoff event.

Urban stormwater—Qld BPEM guidelines 2009 – Technical Note 11
EDAW DESIGN, PLANNING AND ENVIRONMENTS WORLDWIDE
5 References
Australian and New Zealand Environment and Conservation Council (ANZECC 2000), Australian and New Zealand Guidelines for Fresh and Marine Water Quality Australian Water Association and New Zealand Ministry for the Environment.
Engineers Australia (2005), “Australian Runoff Quality”, Wong, T.H.F. (ed).
South East Queensland Healthy Waterways Partnership (SEQ HWP 2006), “WSUD Technical Design Guidelines for South East Queensland”.
South East Queensland Healthy Waterways Partnership (SEQ HWP 2007), WSUD: “Developing Design Objectives for Water Sensitive Developments in South East Queensland – Version 2, 8th November 2007”
Victorian Stormwater Committee 1999, Urban Stormwater - Best Practice Environmental Management Guidelines.

Urban stormwater—Qld BPEM guidelines 2009 – Technical Note 12
EDAW DESIGN, PLANNING AND ENVIRONMENTS WORLDWIDE
Appendix A: Derivation of Water Quality Design
Objectives
The derivation of “best practice” load-based reduction targets for each climatic region in Queensland used predictive modeling techniques employing continuous simulation based on a continuous period of typical climatic conditions for each area.
Australian Runoff Quality (2005, p.7-5) states that the ANZECC Guidelines propose the application of physico-chemical conceptual time series models as a means of summarising our best understanding of the pathways and transformation processes of key stressors such as TSS, TP and TN. The computer model MUSIC (Model for Urban Stormwater Improvement Conceptualisation – Version 3.01) developed by the Cooperative Research Centre for Catchment Hydrology (CRCCH) is one such conceptual model.
The MUSIC model represents our current best understanding of the transformation of rainfall to runoff (surface and baseflow) in urban environments, the generation of key stormwater pollutants (stressors) in surface flows and base flows from various land surfaces, and the removal of key pollutants (stressors) from urban stormwater runoff by contemporary best practice stormwater treatment technologies. For this reason the MUSIC model was used to derive the “best practice” load-based reduction targets for Queensland.
The MUSIC models were configured as follows:
o 1ha residential catchment and 1ha industrial catchment. The following disaggregation of surfaces (including % impervious) was employed:
Residential
- 0.4ha roof area (100% impervious)
- 0.08ha ground level impervious (100% impervious)
- 0.32ha ground level pervious (0% impervious)
- 0.2ha road reserve (60% impervious)
Industrial
- 0.5ha roof area (100% impervious)
- 0.2ha ground level impervious (100% impervious)
- 0.1ha ground level pervious (0% impervious)
- 0.2ha road reserve (60% impervious)
o Climatic time series at six minute time steps for each climatic region. The data used from the Bureau of Meteorology is shown below in Table A1.

Urban stormwater—Qld BPEM guidelines 2009 – Technical Note 13
EDAW DESIGN, PLANNING AND ENVIRONMENTS WORLDWIDE
Table A1: Summary of rainfall data used for each climatic region
Rainfall station Period of rainfall data
Eastern Cape York LOCKHART RIVER 16/6/2001 - 31/8/2006
(Five years two months)
Central and Western Cape York (north)
WEIPA 1/1/1980 - 31/12/1989
(Ten years)
Central and Western Cape York (south)
PALMERVILLE 1/1/1990 - 31/12/1999
(Ten years)
Wet Tropics CAIRNS 1/1/1975 - 31/12/1984
(Ten years)
Dry Tropics TOWNSVILLE 1/1/1970- 31/12/1983
(Fourteen years)
Central Coast (north) MACKAY 1/1/1990- 21/12/1999 (Ten years)
Central Coast (south) ROCKHAMPTON 1/1/1980 - 31/12/1989 (Ten years)
South East Queensland NAMBOUR 1/1/1985 - 31/12/1998
(Fourteen years)
Western Districts MOUNT ISA
CHARLEVILLE
1/1/1990 - 31/12/1999
(Ten years)
1/1/1990 - 31/12/1999
(Ten years)
o Pervious area soil moisture store parameters based on the MUSIC model default values. The MUSIC model default values are the values calibrated by the CRCCH for Brisbane. Insufficient information on the hydrology of local soils was available to allow locally specific pervious area moisture store parameters to be used. The contribution of pervious areas to urban stormwater runoff volume and pollutant loads is typically only small compared to impervious surfaces and therefore it was not deemed necessary to pursue in any further detail derivation of locally relevant soil moisture store parameters.
o The storm flow pollution generation parameters for each surface type were derived from Gold Coast City Council’s Stormwater Quality Management Guidelines, April 2006 (GCCC 2006) as reproduced in Table A2. The baseflow pollution generation parameters were based on Guidelines for Pollutant Export Modelling in Brisbane Version 8, April 2006 (BCC 2006).
o Stormwater quality treatment performance parameters for bioretention derived from performance monitoring data collected from across Australia and Internationally by the CRCCH (refer to MUSIC Version 3.01 User Manual, Appendix F). Insufficient local stormwater treatment performance data was available for bioretention treatment systems to allow for specific local performance data sets to be used for the derivation of the guideline values for each climatic region.

Urban stormwater—Qld BPEM guidelines 2009 – Technical Note 14
EDAW DESIGN, PLANNING AND ENVIRONMENTS WORLDWIDE
o The following design layout for bioretention systems:
• 0.3m extended detention;
• 200mm/hr hydraulic conductivity; and
• 0.8m filter media depth.
• Surface storage (extended detention) surface area equal to underlying bioretention filter media area.
Table A3 summarises the “best practice” load reduction results obtained from the MUSIC model generated performance curves for bioretention. The actual performance curves for each region and scenario are provided following Table A3.

Urban stormwater—Qld BPEM guidelines 2009 – Technical Note 15
EDAW DESIGN, PLANNING AND ENVIRONMENTS WORLDWIDE
TableTableTableTable A A A A2222: Su: Su: Su: Summary of storm flmmary of storm flmmary of storm flmmary of storm flow mean pollutant concentrationow mean pollutant concentrationow mean pollutant concentrationow mean pollutant concentration

Urban stormwater—Qld BPEM guidelines 2009 – Technical Note 16
EDAW DESIGN, PLANNING AND ENVIRONMENTS WORLDWIDE
Table ATable ATable ATable A3333:::: Load reduction targets for Queensland Load reduction targets for Queensland Load reduction targets for Queensland Load reduction targets for Queensland
TSS TP TN TSS TP TN TSS TP TN
Eastern Cape York Lockart River 75 59 34 75 60 33 75 60 35
Central and Western Cape York (north) Weipa 77 63 39 76 62 37 75 60 40
Central and Western Cape York (south) Palmerville 81 65 41 80 64 39 80 65 40
Wet Tropics Cairns 79 64 40 80 65 40 80 65 40
Dry Tropics Townsville 81 66 42 80 66 40 80 65 40
Central Coast (north) Mackay 77 61 37 78 62 36 76 60 35
Central Coast (south) Rockhampton 88 72 49 86 71 46 85 70 45
*South East Queensland Nambour 83 66 41 84 68 41 80 60 45
Western Districts Mt Isa 85 70 45 84 69 42 85 70 45
Charleville 90 73 49 89 73 47
*SEQ targets selected to be consistent with SEQ HWP (2007)
% Pollutant Load Reduction
Bioretention @ 1.5% Region Rainfall Station
Bioretention @ 1.5% Selected Target Values
Industrial - no rainwater tanksResidential - no rainwater tanks

Urban stormwater—Qld BPEM guidelines 2009 – Technical Note 17
EDAW DESIGN, PLANNING AND ENVIRONMENTS WORLDWIDE
Treatment Performance curves for QuTreatment Performance curves for QuTreatment Performance curves for QuTreatment Performance curves for Queensland Climatic Regionseensland Climatic Regionseensland Climatic Regionseensland Climatic Regions
Eastern Cape York: Eastern Cape York: Eastern Cape York: Eastern Cape York: Lockhart River
Residential
Bioretention
0%
10%
20%
30%
40%
50%
60%
70%
80%
90%
100%
0.0% 1.0% 2.0% 3.0% 4.0% 5.0% 6.0% 7.0% 8.0% 9.0%
Treatment surface area (% of catchment area)
TS
S R
em
oval
(%)
0.3m
Bioretention 0.3m ED + Raintank
Bioretention
0%
10%
20%
30%
40%
50%
60%
70%
80%
90%
100%
0.0% 1.0% 2.0% 3.0% 4.0% 5.0% 6.0% 7.0% 8.0% 9.0%
Treatment surface area (% of catchment area)
TP
Rem
oval
(%)
0.3m
Bioretention 0.3m ED + Raintank
Bioretention
0%
10%
20%
30%
40%
50%
60%
70%
80%
90%
100%
0.0% 1.0% 2.0% 3.0% 4.0% 5.0% 6.0% 7.0% 8.0% 9.0%
Treatment surface area (% of catchment area)
TN
Rem
oval
(%)
0.3m
Bioretention 0.3m ED + Raintank

Urban stormwater—Qld BPEM guidelines 2009 – Technical Note 18
EDAW DESIGN, PLANNING AND ENVIRONMENTS WORLDWIDE
Industrial
Bioretention
0%
10%
20%
30%
40%
50%
60%
70%
80%
90%
100%
0.0% 1.0% 2.0% 3.0% 4.0% 5.0% 6.0% 7.0% 8.0% 9.0%
Treatment surface area (% of catchment area)
TS
S R
em
ova
l (%
)
0.3m
Bioretention
0%
10%
20%
30%
40%
50%
60%
70%
80%
90%
100%
0.0% 1.0% 2.0% 3.0% 4.0% 5.0% 6.0% 7.0% 8.0% 9.0%
Treatment surface area (% of catchment area)
TP
Rem
oval
(%)
0.3m
Bioretention
0%
10%
20%
30%
40%
50%
60%
70%
80%
90%
100%
0.0% 1.0% 2.0% 3.0% 4.0% 5.0% 6.0% 7.0% 8.0% 9.0%
Treatment surface area (% of catchment area)
TN
Rem
ova
l (%
)
0.3m

Urban stormwater—Qld BPEM guidelines 2009 – Technical Note 19
EDAW DESIGN, PLANNING AND ENVIRONMENTS WORLDWIDE
Central and Western Cape York: Central and Western Cape York: Central and Western Cape York: Central and Western Cape York: Weipa
Residential
Bioretention
0%
10%
20%
30%
40%
50%
60%
70%
80%
90%
100%
0.0% 1.0% 2.0% 3.0% 4.0% 5.0% 6.0% 7.0% 8.0% 9.0%
Treatment surface area (% of catchment area)
TS
S R
em
oval
(%)
0.3m
0.3m + Raintank
Bioretention
0%
10%
20%
30%
40%
50%
60%
70%
80%
90%
100%
0.0% 1.0% 2.0% 3.0% 4.0% 5.0% 6.0% 7.0% 8.0% 9.0%
Treatment surface area (% of catchment area)
TP
Rem
oval
(%)
0.3m
0.3m + Raintank
Bioretention
0%
10%
20%
30%
40%
50%
60%
70%
80%
90%
100%
0.0% 1.0% 2.0% 3.0% 4.0% 5.0% 6.0% 7.0% 8.0% 9.0%
Treatment surface area (% of catchment area)
TN
Re
mo
val
(%)
0.3m
0.3m + Raintank

Urban stormwater—Qld BPEM guidelines 2009 – Technical Note 20
EDAW DESIGN, PLANNING AND ENVIRONMENTS WORLDWIDE
Industrial
Bioretention
0%
10%
20%
30%
40%
50%
60%
70%
80%
90%
100%
0.0% 1.0% 2.0% 3.0% 4.0% 5.0% 6.0% 7.0% 8.0% 9.0%
Treatment surface area (% of catchment area)
TS
S R
em
oval (%
)
0.3m ED
Bioretention
0%
10%
20%
30%
40%
50%
60%
70%
80%
90%
100%
0.0% 1.0% 2.0% 3.0% 4.0% 5.0% 6.0% 7.0% 8.0% 9.0%
Treatment surface area (% of catchment area)
TP
Rem
oval
(%)
0.3m ED
Bioretention
0%
10%
20%
30%
40%
50%
60%
70%
80%
90%
100%
0.0% 1.0% 2.0% 3.0% 4.0% 5.0% 6.0% 7.0% 8.0% 9.0%
Treatment surface area (% of catchment area)
TN
Rem
oval
(%)
0.3m ED

Urban stormwater—Qld BPEM guidelines 2009 – Technical Note 21
EDAW DESIGN, PLANNING AND ENVIRONMENTS WORLDWIDE
Central and Western Cape York: Central and Western Cape York: Central and Western Cape York: Central and Western Cape York: Palmerville
Residential
Bioretention
0%
10%
20%
30%
40%
50%
60%
70%
80%
90%
100%
0.0% 1.0% 2.0% 3.0% 4.0% 5.0% 6.0% 7.0% 8.0% 9.0%
Treatment surface area (% of catchment area)
TS
S R
em
ov
al
(%)
0.3m
0.3m ED + Raintank
Bioretention
0%
10%
20%
30%
40%
50%
60%
70%
80%
90%
100%
0.0% 1.0% 2.0% 3.0% 4.0% 5.0% 6.0% 7.0% 8.0% 9.0%
Treatment surface area (% of catchment area)
TP
Rem
oval (%
)
0.3m
0.3m ED + Raintank
Bioretention
0%
10%
20%
30%
40%
50%
60%
70%
80%
90%
100%
0.0% 1.0% 2.0% 3.0% 4.0% 5.0% 6.0% 7.0% 8.0% 9.0%
Treatment surface area (% of catchment area)
TN
Rem
oval
(%)
0.3m
0.3m ED + Raintank

Urban stormwater—Qld BPEM guidelines 2009 – Technical Note 22
EDAW DESIGN, PLANNING AND ENVIRONMENTS WORLDWIDE
Industrial
Bioretention
0%
10%
20%
30%
40%
50%
60%
70%
80%
90%
100%
0.0% 1.0% 2.0% 3.0% 4.0% 5.0% 6.0% 7.0% 8.0% 9.0%
Treatment surface area (% of catchment area)
TS
S R
em
oval
(%)
0.3m ED
Bioretention
0%
10%
20%
30%
40%
50%
60%
70%
80%
90%
100%
0.0% 1.0% 2.0% 3.0% 4.0% 5.0% 6.0% 7.0% 8.0% 9.0%
Treatment surface area (% of catchment area)
TP
Rem
oval
(%)
0.3m ED
Bioretention
0%
10%
20%
30%
40%
50%
60%
70%
80%
90%
100%
0.0% 1.0% 2.0% 3.0% 4.0% 5.0% 6.0% 7.0% 8.0% 9.0%
Treatment surface area (% of catchment area)
TN
Rem
oval
(%)
0.3m ED

Urban stormwater—Qld BPEM guidelines 2009 – Technical Note 23
EDAW DESIGN, PLANNING AND ENVIRONMENTS WORLDWIDE
“Wet” Tr“Wet” Tr“Wet” Tr“Wet” Tropics: opics: opics: opics: Cairns
Residential
Bioretention
0%
10%
20%
30%
40%
50%
60%
70%
80%
90%
100%
0.0% 1.0% 2.0% 3.0% 4.0% 5.0% 6.0% 7.0% 8.0% 9.0%
Treatment surface area (% of catchment area)
TS
S R
em
oval
(%)
0.3m ED
Bioretention 0.3m ED + Raintank
Bioretention
0%
10%
20%
30%
40%
50%
60%
70%
80%
90%
100%
0.0% 1.0% 2.0% 3.0% 4.0% 5.0% 6.0% 7.0% 8.0% 9.0%
Treatment surface area (% of catchment area)
TP
Rem
oval
(%)
0.3m ED
Bioretention 0.3m ED + Raintank
Bioretention
0%
10%
20%
30%
40%
50%
60%
70%
80%
90%
100%
0.0% 1.0% 2.0% 3.0% 4.0% 5.0% 6.0% 7.0% 8.0% 9.0%
Treatment surface area (% of catchment area)
TN
Rem
oval
(%)
0.3m ED
Bioretention 0.3m ED + Raintank

Urban stormwater—Qld BPEM guidelines 2009 – Technical Note 24
EDAW DESIGN, PLANNING AND ENVIRONMENTS WORLDWIDE
Industrial
Bioretention
0%
10%
20%
30%
40%
50%
60%
70%
80%
90%
100%
0.0% 1.0% 2.0% 3.0% 4.0% 5.0% 6.0% 7.0% 8.0% 9.0%
Treatment surface area (% of catchment area)
TS
S R
em
oval
(%)
0.3m ED
Bioretention
0%
10%
20%
30%
40%
50%
60%
70%
80%
90%
100%
0.0% 1.0% 2.0% 3.0% 4.0% 5.0% 6.0% 7.0% 8.0% 9.0%
Treatment surface area (% of catchment area)
TP
Rem
oval
(%)
0.3m ED
Bioretention
0%
10%
20%
30%
40%
50%
60%
70%
80%
90%
100%
0.0% 1.0% 2.0% 3.0% 4.0% 5.0% 6.0% 7.0% 8.0% 9.0%
Treatment surface area (% of catchment area)
TN
Rem
oval
(%)
0.3m ED

Urban stormwater—Qld BPEM guidelines 2009 – Technical Note 25
EDAW DESIGN, PLANNING AND ENVIRONMENTS WORLDWIDE
“Dry” Tropics: “Dry” Tropics: “Dry” Tropics: “Dry” Tropics: Townsville
Residential
Bioretention
0%
10%
20%
30%
40%
50%
60%
70%
80%
90%
100%
0.0% 1.0% 2.0% 3.0% 4.0% 5.0% 6.0% 7.0% 8.0% 9.0%
Treatment surface area (% of catchment area)
TS
S R
em
oval
(%)
0.3m ED
0.3m ED + Raintank
Bioretention
0%
10%
20%
30%
40%
50%
60%
70%
80%
90%
100%
0.0% 1.0% 2.0% 3.0% 4.0% 5.0% 6.0% 7.0% 8.0% 9.0%
Treatment surface area (% of catchment area)
TP
Rem
oval
(%)
0.3m ED
0.3m ED + Raintank
Bioretention
0%
10%
20%
30%
40%
50%
60%
70%
80%
90%
100%
0.0% 1.0% 2.0% 3.0% 4.0% 5.0% 6.0% 7.0% 8.0% 9.0%
Treatment surface area (% of catchment area)
TN
Rem
ova
l (%
)
0.3m ED
0.3m ED + Raintank
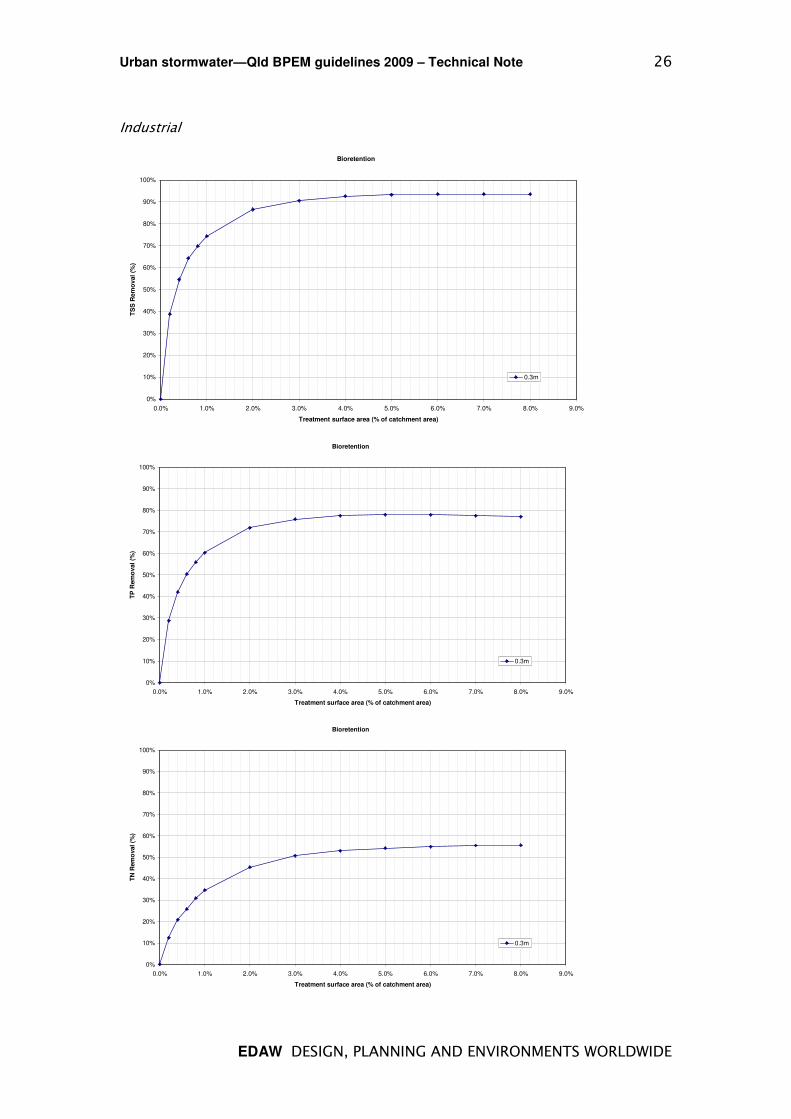
Urban stormwater—Qld BPEM guidelines 2009 – Technical Note 26
EDAW DESIGN, PLANNING AND ENVIRONMENTS WORLDWIDE
Industrial
Bioretention
0%
10%
20%
30%
40%
50%
60%
70%
80%
90%
100%
0.0% 1.0% 2.0% 3.0% 4.0% 5.0% 6.0% 7.0% 8.0% 9.0%
Treatment surface area (% of catchment area)
TS
S R
em
oval
(%)
0.3m
Bioretention
0%
10%
20%
30%
40%
50%
60%
70%
80%
90%
100%
0.0% 1.0% 2.0% 3.0% 4.0% 5.0% 6.0% 7.0% 8.0% 9.0%
Treatment surface area (% of catchment area)
TP
Rem
oval
(%)
0.3m
Bioretention
0%
10%
20%
30%
40%
50%
60%
70%
80%
90%
100%
0.0% 1.0% 2.0% 3.0% 4.0% 5.0% 6.0% 7.0% 8.0% 9.0%
Treatment surface area (% of catchment area)
TN
Rem
oval (%
)
0.3m

Urban stormwater—Qld BPEM guidelines 2009 – Technical Note 27
EDAW DESIGN, PLANNING AND ENVIRONMENTS WORLDWIDE
Central Coast North: Central Coast North: Central Coast North: Central Coast North: Mackay
Residential
Bioretention
0%
10%
20%
30%
40%
50%
60%
70%
80%
90%
100%
0.0% 1.0% 2.0% 3.0% 4.0% 5.0% 6.0% 7.0% 8.0% 9.0%
Treatment surface area (% of catchment area)
TS
S R
em
oval
(%)
0.3m ED
0.3m ED with Raintank
Bioretention
0%
10%
20%
30%
40%
50%
60%
70%
80%
90%
100%
0.0% 1.0% 2.0% 3.0% 4.0% 5.0% 6.0% 7.0% 8.0% 9.0%
Treatment surface area (% of catchment area)
TP
Rem
oval (%
)
0.3m ED
0.3m ED with Raintank
Bioretention
0%
10%
20%
30%
40%
50%
60%
70%
80%
90%
100%
0.0% 1.0% 2.0% 3.0% 4.0% 5.0% 6.0% 7.0% 8.0% 9.0%
Treatment surface area (% of catchment area)
TN
Rem
oval
(%)
0.3m ED
0.3m ED with Raintank

Urban stormwater—Qld BPEM guidelines 2009 – Technical Note 28
EDAW DESIGN, PLANNING AND ENVIRONMENTS WORLDWIDE
Industrial
Bioretention
0%
10%
20%
30%
40%
50%
60%
70%
80%
90%
100%
0.0% 1.0% 2.0% 3.0% 4.0% 5.0% 6.0% 7.0% 8.0% 9.0%
Treatment surface area (% of catchment area)
TS
S R
em
oval
(%)
0.3m
Bioretention
0%
10%
20%
30%
40%
50%
60%
70%
80%
90%
100%
0.0% 1.0% 2.0% 3.0% 4.0% 5.0% 6.0% 7.0% 8.0% 9.0%
Treatment surface area (% of catchment area)
TP
Rem
oval
(%)
0.3m
Bioretention
0%
10%
20%
30%
40%
50%
60%
70%
80%
90%
100%
0.0% 1.0% 2.0% 3.0% 4.0% 5.0% 6.0% 7.0% 8.0% 9.0%
Treatment surface area (% of catchment area)
TN
Rem
oval
(%)
0.3m

Urban stormwater—Qld BPEM guidelines 2009 – Technical Note 29
EDAW DESIGN, PLANNING AND ENVIRONMENTS WORLDWIDE
Central Coast South: Central Coast South: Central Coast South: Central Coast South: Rockhampton
Residential
Bioretention
0%
10%
20%
30%
40%
50%
60%
70%
80%
90%
100%
0.0% 1.0% 2.0% 3.0% 4.0% 5.0% 6.0% 7.0% 8.0% 9.0%
Treatment surface area (% of catchment area)
TS
S R
em
oval
(%)
0.3m ED
0.3m ED + Raintank
Bioretention
0%
10%
20%
30%
40%
50%
60%
70%
80%
90%
100%
0.0% 1.0% 2.0% 3.0% 4.0% 5.0% 6.0% 7.0% 8.0% 9.0%
Treatment surface area (% of catchment area)
TP
Rem
ova
l (%
)
0.3m ED
0.3m ED + Raintank
Bioretention
0%
10%
20%
30%
40%
50%
60%
70%
80%
90%
100%
0.0% 1.0% 2.0% 3.0% 4.0% 5.0% 6.0% 7.0% 8.0% 9.0%
Treatment surface area (% of catchment area)
TN
Re
mo
va
l (%
)
0.3m ED
0.3m ED + Raintank

Urban stormwater—Qld BPEM guidelines 2009 – Technical Note 30
EDAW DESIGN, PLANNING AND ENVIRONMENTS WORLDWIDE
Industrial
Bioretention
0%
10%
20%
30%
40%
50%
60%
70%
80%
90%
100%
0.0% 1.0% 2.0% 3.0% 4.0% 5.0% 6.0% 7.0% 8.0% 9.0%
Treatment surface area (% of catchment area)
TS
S R
em
oval (%
)
0.3m ED
Bioretention
0%
10%
20%
30%
40%
50%
60%
70%
80%
90%
100%
0.0% 1.0% 2.0% 3.0% 4.0% 5.0% 6.0% 7.0% 8.0% 9.0%
Treatment surface area (% of catchment area)
TP
Rem
oval
(%)
0.3m ED
Bioretention
0%
10%
20%
30%
40%
50%
60%
70%
80%
90%
100%
0.0% 1.0% 2.0% 3.0% 4.0% 5.0% 6.0% 7.0% 8.0% 9.0%
Treatment surface area (% of catchment area)
TN
Rem
oval
(%)
0.3m ED

Urban stormwater—Qld BPEM guidelines 2009 – Technical Note 31
EDAW DESIGN, PLANNING AND ENVIRONMENTS WORLDWIDE
South East QueensSouth East QueensSouth East QueensSouth East Queensland: land: land: land: Nambour
Residential
Bioretention
0%
10%
20%
30%
40%
50%
60%
70%
80%
90%
100%
0.0% 1.0% 2.0% 3.0% 4.0% 5.0% 6.0% 7.0% 8.0% 9.0%
Treatment surface area (% of catchment area)
TS
S R
em
oval (%
)
0.3m ED
0.3m ED + Raintank
Bioretention
0%
10%
20%
30%
40%
50%
60%
70%
80%
90%
100%
0.0% 1.0% 2.0% 3.0% 4.0% 5.0% 6.0% 7.0% 8.0% 9.0%
Treatment surface area (% of catchment area)
TP
Rem
oval (%
)
0.3m ED
0.3m ED + Raintank
Bioretention
0%
10%
20%
30%
40%
50%
60%
70%
80%
90%
100%
0.0% 1.0% 2.0% 3.0% 4.0% 5.0% 6.0% 7.0% 8.0% 9.0%
Treatment surface area (% of catchment area)
TN
Rem
ov
al
(%)
0.3m ED
0.3m ED + Raintank

Urban stormwater—Qld BPEM guidelines 2009 – Technical Note 32
EDAW DESIGN, PLANNING AND ENVIRONMENTS WORLDWIDE
Industrial
Bioretention
0%
10%
20%
30%
40%
50%
60%
70%
80%
90%
100%
0.0% 1.0% 2.0% 3.0% 4.0% 5.0% 6.0% 7.0% 8.0% 9.0%
Treatment surface area (% of catchment area)
TS
S R
em
oval (%
)
0.3m
Bioretention
0%
10%
20%
30%
40%
50%
60%
70%
80%
90%
100%
0.0% 1.0% 2.0% 3.0% 4.0% 5.0% 6.0% 7.0% 8.0% 9.0%
Treatment surface area (% of catchment area)
TP
Rem
oval
(%)
0.3m
Bioretention
0%
10%
20%
30%
40%
50%
60%
70%
80%
90%
100%
0.0% 1.0% 2.0% 3.0% 4.0% 5.0% 6.0% 7.0% 8.0% 9.0%
Treatment surface area (% of catchment area)
TN
Rem
oval
(%)
0.3m

Urban stormwater—Qld BPEM guidelines 2009 – Technical Note 33
EDAW DESIGN, PLANNING AND ENVIRONMENTS WORLDWIDE
Western Districts: Western Districts: Western Districts: Western Districts: Mt Isa
Residential
Bioretention
0%
10%
20%
30%
40%
50%
60%
70%
80%
90%
100%
0.0% 1.0% 2.0% 3.0% 4.0% 5.0% 6.0% 7.0% 8.0% 9.0%
Treatment surface area (% of catchment area)
TS
S R
em
oval
(%)
0.3m ED
0.3m ED + Raintank
Bioretention
0%
10%
20%
30%
40%
50%
60%
70%
80%
90%
100%
0.0% 1.0% 2.0% 3.0% 4.0% 5.0% 6.0% 7.0% 8.0% 9.0%
Treatment surface area (% of catchment area)
TP
Rem
oval
(%)
0.3m ED
0.3m ED + Raintank
Bioretention
0%
10%
20%
30%
40%
50%
60%
70%
80%
90%
100%
0.0% 1.0% 2.0% 3.0% 4.0% 5.0% 6.0% 7.0% 8.0% 9.0%
Treatment surface area (% of catchment area)
TN
Rem
oval
(%)
0.3m ED
0.3m ED + Raintank

Urban stormwater—Qld BPEM guidelines 2009 – Technical Note 34
EDAW DESIGN, PLANNING AND ENVIRONMENTS WORLDWIDE
Industrial
Bioretention
0%
10%
20%
30%
40%
50%
60%
70%
80%
90%
100%
0.0% 1.0% 2.0% 3.0% 4.0% 5.0% 6.0% 7.0% 8.0% 9.0%
Treatment surface area (% of catchment area)
TS
S R
em
oval (%
)
0.3m ED
Bioretention
0%
10%
20%
30%
40%
50%
60%
70%
80%
90%
100%
0.0% 1.0% 2.0% 3.0% 4.0% 5.0% 6.0% 7.0% 8.0% 9.0%
Treatment surface area (% of catchment area)
TP
Rem
oval
(%)
0.3m ED
Bioretention
0%
10%
20%
30%
40%
50%
60%
70%
80%
90%
100%
0.0% 1.0% 2.0% 3.0% 4.0% 5.0% 6.0% 7.0% 8.0% 9.0%
Treatment surface area (% of catchment area)
TN
Rem
oval
(%)
0.3m ED

Urban stormwater—Qld BPEM guidelines 2009 – Technical Note 35
EDAW DESIGN, PLANNING AND ENVIRONMENTS WORLDWIDE
Western Districts: Western Districts: Western Districts: Western Districts: Charleville
Residential
Bioretention
0%
10%
20%
30%
40%
50%
60%
70%
80%
90%
100%
0.0% 1.0% 2.0% 3.0% 4.0% 5.0% 6.0% 7.0% 8.0% 9.0%
Treatment surface area (% of catchment area)
TS
S R
em
oval
(%)
0.3m ED
0.3m ED + Raintank
Bioretention
0%
10%
20%
30%
40%
50%
60%
70%
80%
90%
100%
0.0% 1.0% 2.0% 3.0% 4.0% 5.0% 6.0% 7.0% 8.0% 9.0%
Treatment surface area (% of catchment area)
TP
Rem
oval
(%)
0.3m ED
0.3m ED + Raintank
Bioretention
0%
10%
20%
30%
40%
50%
60%
70%
80%
90%
100%
0.0% 1.0% 2.0% 3.0% 4.0% 5.0% 6.0% 7.0% 8.0% 9.0%
Treatment surface area (% of catchment area)
TN
Rem
oval (%
)
0.3m ED
0.3m ED + Raintank

Urban stormwater—Qld BPEM guidelines 2009 – Technical Note 36
EDAW DESIGN, PLANNING AND ENVIRONMENTS WORLDWIDE
Industrial
Bioretention
0%
10%
20%
30%
40%
50%
60%
70%
80%
90%
100%
0.0% 1.0% 2.0% 3.0% 4.0% 5.0% 6.0% 7.0% 8.0% 9.0%
Treatment surface area (% of catchment area)
TS
S R
em
oval
(%)
0.3m
Bioretention
0%
10%
20%
30%
40%
50%
60%
70%
80%
90%
100%
0.0% 1.0% 2.0% 3.0% 4.0% 5.0% 6.0% 7.0% 8.0% 9.0%
Treatment surface area (% of catchment area)
TP
Rem
oval
(%)
0.3m
Bioretention
0%
10%
20%
30%
40%
50%
60%
70%
80%
90%
100%
0.0% 1.0% 2.0% 3.0% 4.0% 5.0% 6.0% 7.0% 8.0% 9.0%
Treatment surface area (% of catchment area)
TN
Rem
oval
(%)
0.3m

Urban stormwater—Qld BPEM guidelines 2009 – Technical Note 37
EDAW DESIGN, PLANNING AND ENVIRONMENTS WORLDWIDE
Wetland
0%
10%
20%
30%
40%
50%
60%
70%
80%
90%
100%
0.0% 1.0% 2.0% 3.0% 4.0% 5.0% 6.0% 7.0% 8.0% 9.0% 10.0%
Treatment surface area (% of catchment area)
TS
S R
em
oval
(%)
0.3m PP
0.6m PP
Wetland
0%
10%
20%
30%
40%
50%
60%
70%
80%
90%
100%
0.0% 1.0% 2.0% 3.0% 4.0% 5.0% 6.0% 7.0% 8.0% 9.0% 10.0%
Treatment surface area (% of catchment area)
TP
Rem
oval
(%)
0.3m PP
0.6m PP
Wetland
0%
10%
20%
30%
40%
50%
60%
70%
80%
90%
100%
0.0% 1.0% 2.0% 3.0% 4.0% 5.0% 6.0% 7.0% 8.0% 9.0% 10.0%
Treatment surface area (% of catchment area)
TN
Rem
oval
(%)
0.3m PP
0.6m PP

Urban stormwater—Qld BPEM guidelines 2009 – Technical Note 38
EDAW DESIGN, PLANNING AND ENVIRONMENTS WORLDWIDE
Appendix B: Derivation of Water Quantity Design Objectives –
frequent flow management objective
Numerical modelling studies were undertaken to establish appropriate design capture volumes to achieve the proposed frequent flow objective for Queensland. The capture volume was selected to provide a similar frequency of surface runoff form small rainfall events and to achieve a similar overall volumetric runoff coefficient to an undeveloped site.
Preliminary analysis was undertaken using MUSIC and the River Analysis Package (RAP) to determine:
• Surface runoff characteristics under “pre-development” catchment conditions
• Surface runoff characteristics under different “post-development” conditions with differing initial capture and management rates
The analysis was undertaken using 6 minute rainfall data from each climatic region. The data used from the Bureau of Meteorology is shown below.
Rainfall station Period of rainfall data
Eastern Cape York LOCKHART RIVER 16/6/2001 - 31/8/2006
(Five years two months)
Central and Western Cape York (north)
WEIPA 1/1/1980 - 31/12/1989
(Ten years)
Central and Western Cape York (south)
PALMERVILLE 1/1/1990 - 31/12/1999
(Ten years)
Wet Tropics CAIRNS 1/1/1975 - 31/12/1984
(Ten years)
Dry Tropics TOWNSVILLE 1/1/1970- 31/12/1983
(Fourteen years)
Central Coast (north) MACKAY 1/1/1990- 21/12/1999
(Ten years)
Central Coast (south) ROCKHAMPTON 1/1/1980 - 31/12/1989 (Ten years)
South East Queensland NAMBOUR 1/1/1985 - 31/12/1998
(Fourteen years)
Western Districts MOUNT ISA
CHARLEVILLE
1/1/1990 - 31/12/1999
(Ten years)
1/1/1990 - 31/12/1999
(Ten years)
The soil moisture parameters were based on the MUSIC model defaults and pollutant generation parameters were taken from Gold Coast City Council’s MUSIC Guidelines.
Pre-development The pre-developed catchment was modelled as an urban catchment with 0% impervious areas.

Urban stormwater—Qld BPEM guidelines 2009 – Technical Note 39
EDAW DESIGN, PLANNING AND ENVIRONMENTS WORLDWIDE
Post-development The post development catchment was modelled as urban catchments with the following proportiion of impervious area:
• 20%
• 40%
• 60%
• 80%
Each of these scenarios was run with capture and management of the first 0, 5, 10, 15 and 25mm of daily runoff from impervious areas. The AVR calculations for each of these based on the different climatic regions are shown below.
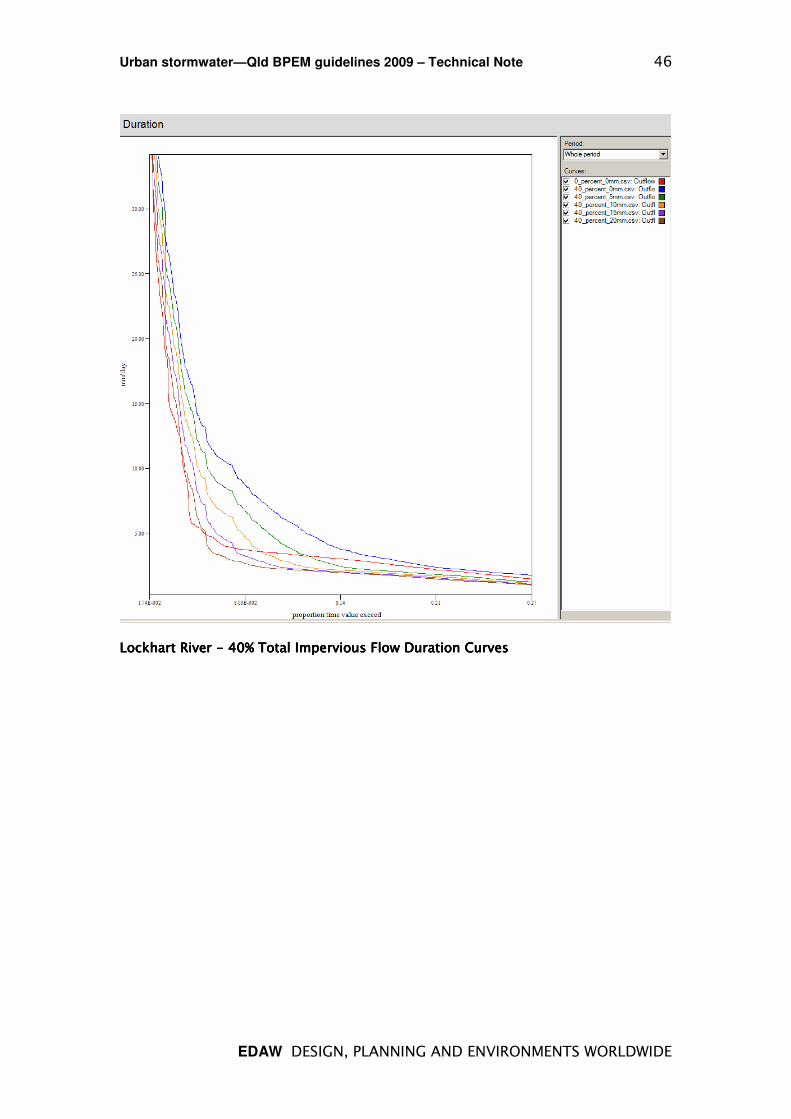
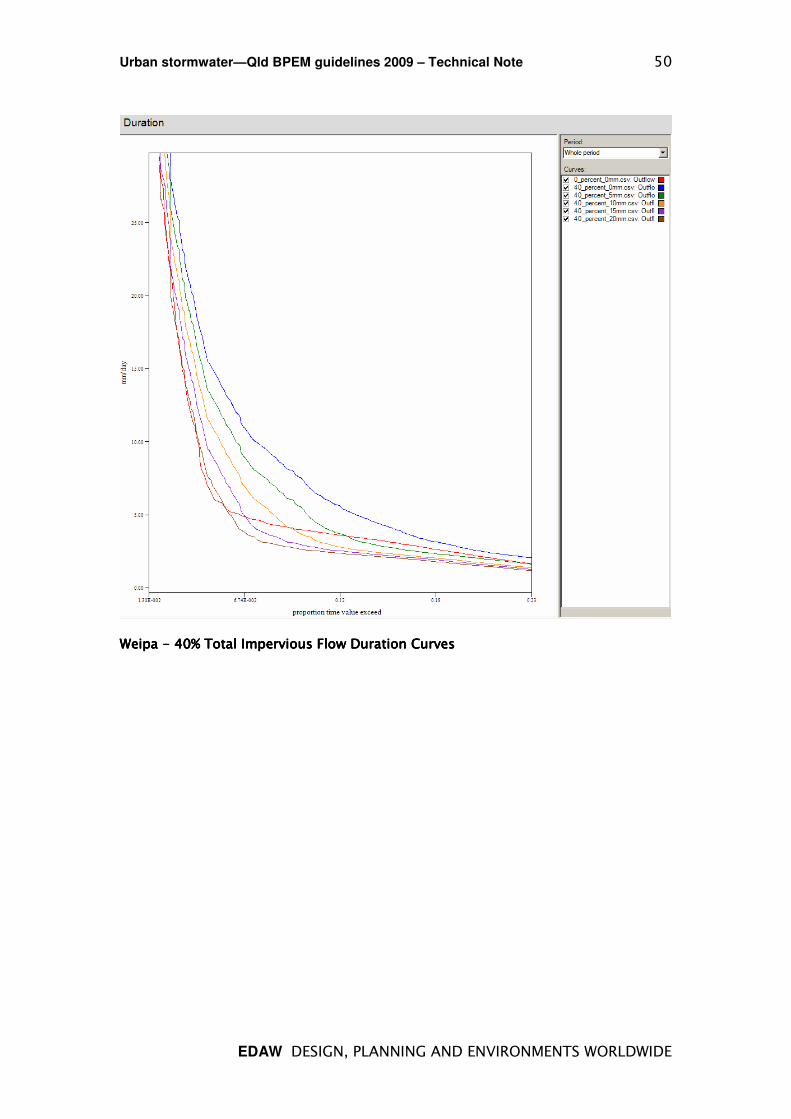
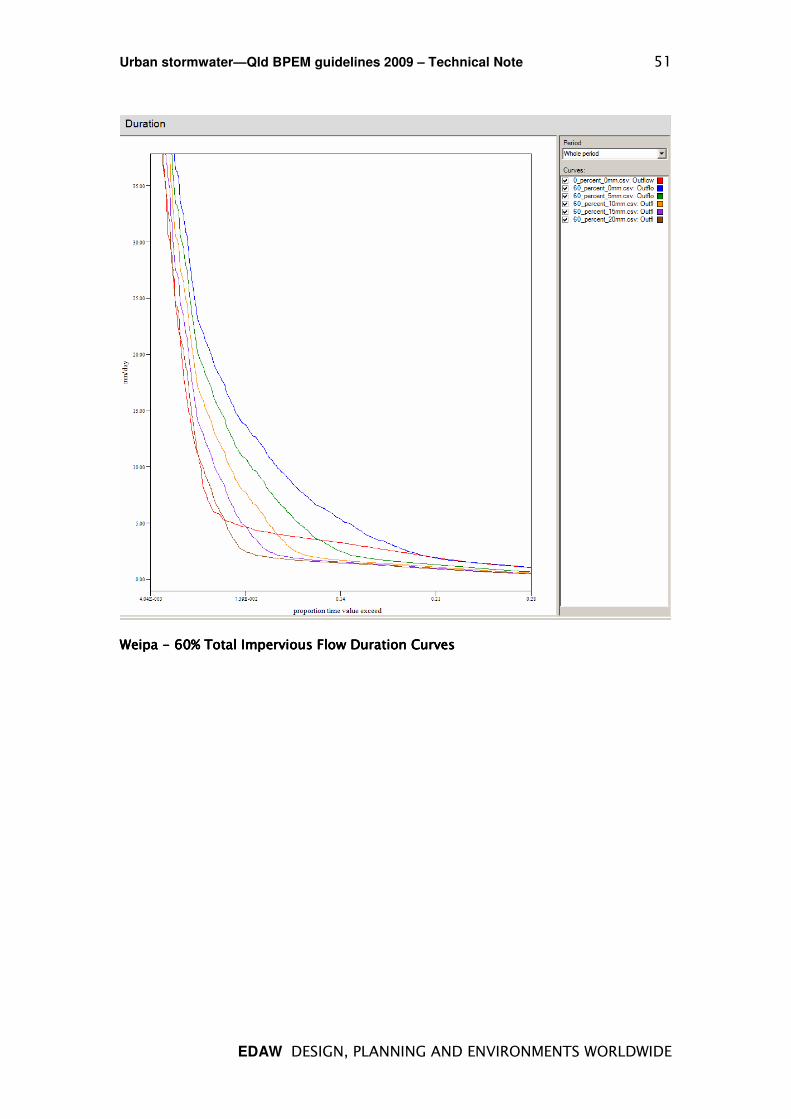
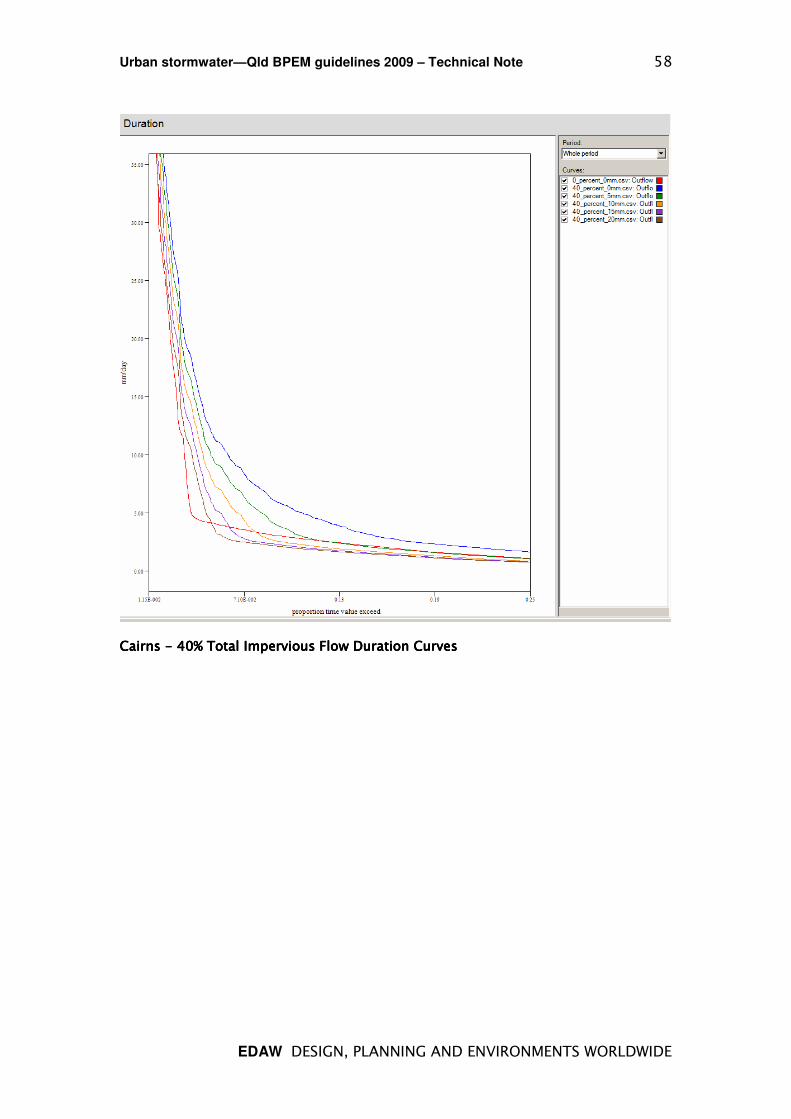
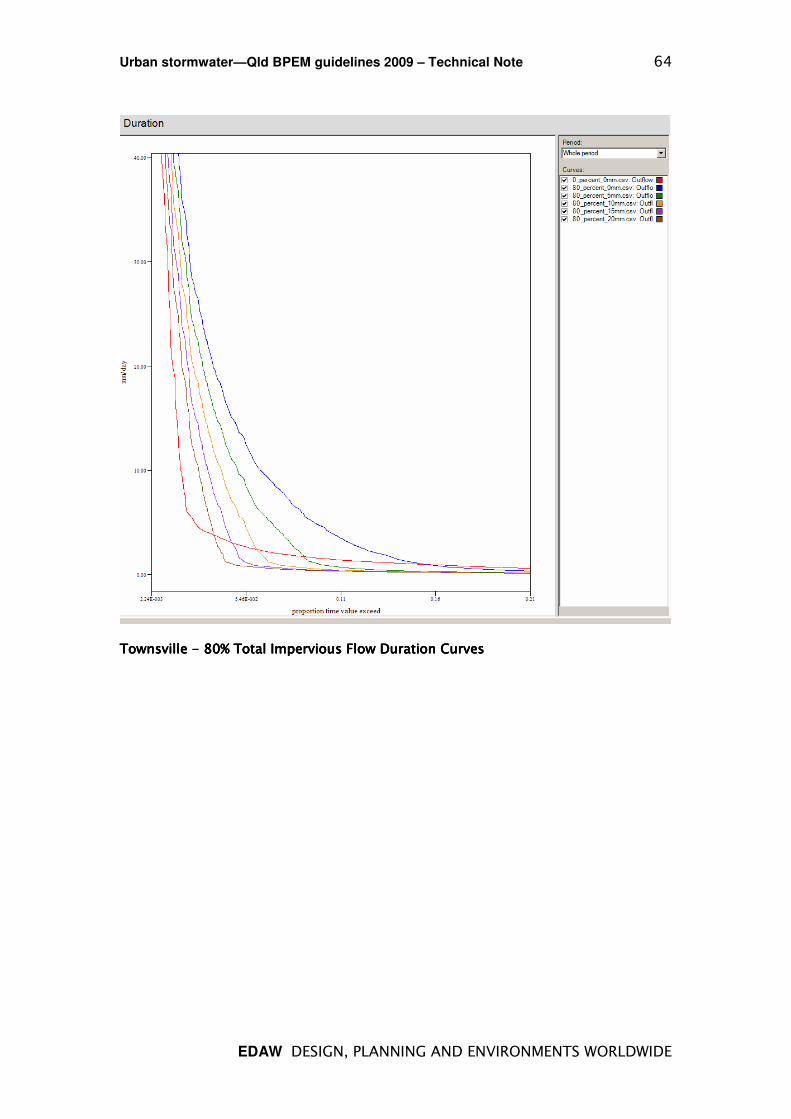
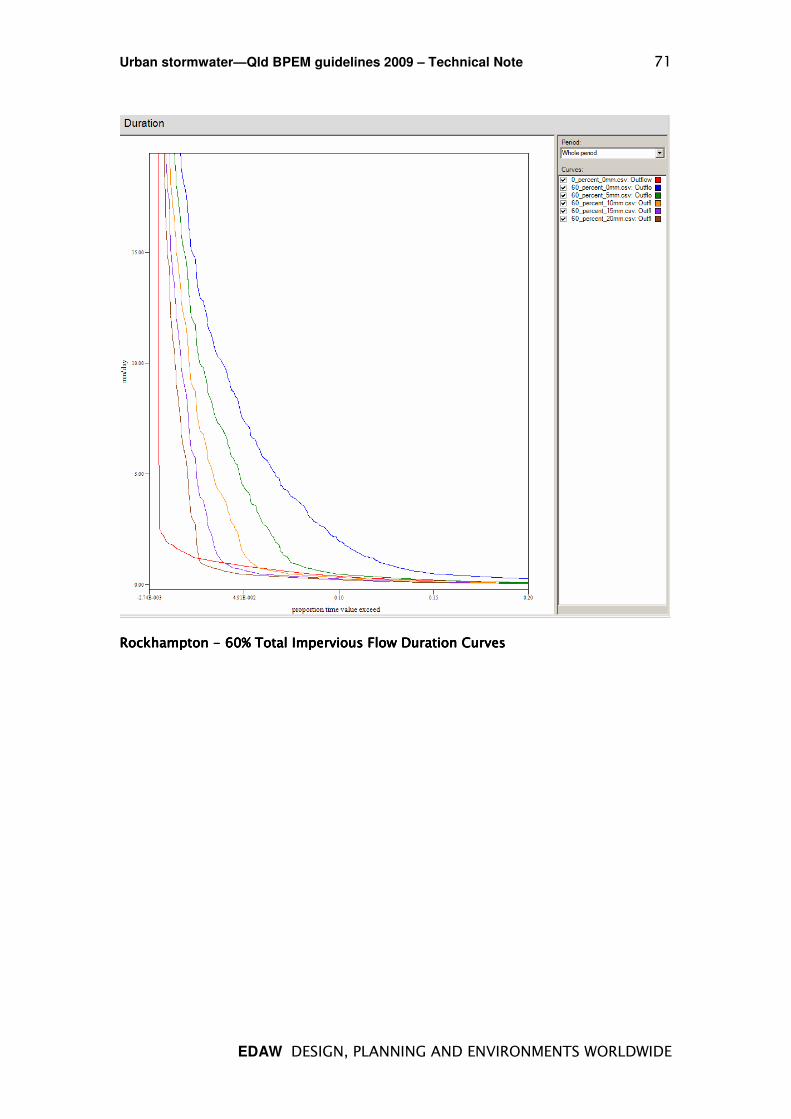
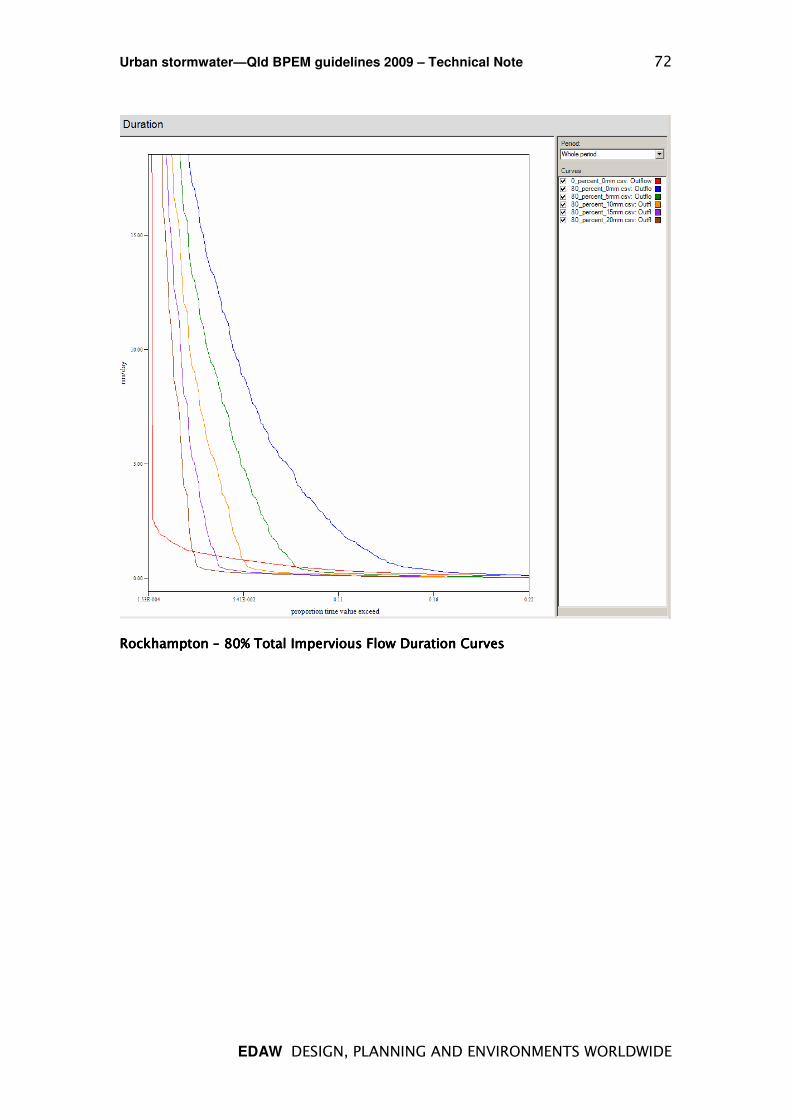
Flow duration curves are also attached showing the “pre-development” condition (0% impervious), impervious runoff with no capture as well as with 5mm, 10mm, 15mm and 20mm daily runoff capture rates for each climatic region. The X-axis is the percentage of time exceeded (expressed as a proportion, not as percentage). Where the flow duration curves depart from the “pre-development” condition reveals the frequency of occurrence of surface runoff events.
The results presented in this section demonstrate that the required capture volume increases with the proportion of impervious area.

Urban stormwater—Qld BPEM guidelines 2009 – Technical Note 40
EDAW DESIGN, PLANNING AND ENVIRONMENTS WORLDWIDE
AVR CalculationsAVR CalculationsAVR CalculationsAVR Calculations for each climatic region for each climatic region for each climatic region for each climatic region
(a summary of these results in presented in section 3 of this report)
Eastern Cape York:Eastern Cape York:Eastern Cape York:Eastern Cape York: Lockhart River
Total Fraction Impervious
Daily Capture and
Management
Target AVR (pre-
development) Actual AVR
% mm/day ML/day ML/year
20 0 10.2 11.8
5 10.2 11
10 10.2 10.5
15 10.2 10.1
20 10.2 9.84
40 0 10.2 13.5
5 10.2 11.9
10 10.2 10.9
15 10.2 10.1
20 10.2 9.48
60 0 10.2 15.1
5 10.2 12.7
10 10.2 11.2
15 10.2 10
20 10.2 9.12
80 0 10.2 16.6
5 10.2 13.5
10 10.2 11.5
15 10.2 10
20 10.2 8.76
Central and Western Cape York (north)Central and Western Cape York (north)Central and Western Cape York (north)Central and Western Cape York (north):::: Weipa
Total Fraction Impervious
Daily Capture and
Management
Target AVR (pre-
development) Actual AVR
% mm/day ML/day ML/year
20 0 8.35 9.91
5 8.35 9.17
10 8.35 8.65
15 8.35 8.25
20 8.35 7.94
40 0 8.35 11.5
5 8.35 10
10 8.35 8.95
15 8.35 8.15
20 8.35 7.52
60 0 8.35 13
5 8.35 10.8
10 8.35 9.25
15 8.35 8.05
20 8.35 7.11
80 0 8.35 14.6
5 8.35 11.6
10 8.35 9.55
15 8.35 7.95
20 8.35 6.7

Urban stormwater—Qld BPEM guidelines 2009 – Technical Note 41
EDAW DESIGN, PLANNING AND ENVIRONMENTS WORLDWIDE
Central and Western Cape York (south)Central and Western Cape York (south)Central and Western Cape York (south)Central and Western Cape York (south):::: Palmerville
Total Fraction Impervious
Daily Capture and
Management
Target AVR (pre-
development) Actual AVR
% mm/day ML/day ML/year
20 0 3.55 4.72
5 3.55 4.2
10 3.55 3.85
15 3.55 3.61
20 3.55 3.41
40 0 3.55 5.89
5 3.55 4.84
10 3.55 4.15
15 3.55 3.66
20 3.55 3.28
60 0 3.55 7.05
5 3.55 5.48
10 3.55 4.45
15 3.55 3.71
20 3.55 3.14
80 0 3.55 8.22
5 3.55 6.12
10 3.55 4.75
15 3.55 3.77
20 3.55 3
“Wet” Tropics“Wet” Tropics“Wet” Tropics“Wet” Tropics:::: Cairns
Total Fraction Impervious
Daily Capture and
Management
Target AVR (pre-
development) Actual AVR
% mm/day ML/day ML/year
20 0 9.23 11
5 9.23 10.2
10 9.23 9.66
15 9.23 9.31
20 9.23 9.05
40 0 9.23 12.7
5 9.23 11.1
10 9.23 10.1
15 9.23 9.4
20 9.23 8.87
60 0 9.23 14.5
5 9.23 12
10 9.23 10.5
15 9.23 9.49
20 9.23 8.69
80 0 9.23 16.3
5 9.23 12.9
10 9.23 11
15 9.23 9.58
20 9.23 8.52

Urban stormwater—Qld BPEM guidelines 2009 – Technical Note 42
EDAW DESIGN, PLANNING AND ENVIRONMENTS WORLDWIDE
“Dry” Tropics“Dry” Tropics“Dry” Tropics“Dry” Tropics:::: Townsville
Total Fraction Impervious
Daily Capture and
Management
Target AVR (pre-
development) Actual AVR
% mm/day ML/day ML/year
20 0 4.64 5.88
5 4.64 5.4
10 4.64 5.09
15 4.64 4.86
20 4.64 4.68
40 0 4.64 7.12
5 4.64 6.16
10 4.64 5.54
15 4.64 5.08
20 4.64 4.72
60 0 4.64 8.35
5 4.64 6.92
10 4.64 5.99
15 4.64 5.31
20 4.64 4.76
80 0 4.64 9.59
5 4.64 7.69
10 4.64 6.45
15 4.64 5.53
20 4.64 4.81
Central Coast (north)Central Coast (north)Central Coast (north)Central Coast (north):::: Mackay
Total Fraction Impervious
Daily Capture and
Management
Target AVR (pre-
development) Actual AVR
% mm/day ML/day ML/year
20 0 6.12 7.8
5 6.12 7.15
10 6.12 6.76
15 6.12 6.49
20 6.12 6.3
40 0 6.12 9.48
5 6.12 8.17
10 6.12 7.41
15 6.12 6.87
20 6.12 6.48
60 0 6.12 11.2
5 6.12 9.2
10 6.12 8.05
15 6.12 7.25
20 6.12 6.66
80 0 6.12 12.8
5 6.12 10.2
10 6.12 8.69
15 6.12 7.63
20 6.12 6.84

Urban stormwater—Qld BPEM guidelines 2009 – Technical Note 43
EDAW DESIGN, PLANNING AND ENVIRONMENTS WORLDWIDE
Central Coast (south)Central Coast (south)Central Coast (south)Central Coast (south):::: Rockhampton
Total Fraction Impervious
Daily Capture and
Management
Target AVR (pre-
development) Actual AVR
% mm/day ML/day ML/year
20 0 0.85 2.06
5 0.85 1.64
10 0.85 1.38
15 0.85 1.2
20 0.85 1.07
40 0 0.85 3.26
5 0.85 2.43
10 0.85 1.91
15 0.85 1.55
20 0.85 1.3
60 0 0.85 4.47
5 0.85 3.22
10 0.85 2.44
15 0.85 1.9
20 0.85 1.52
80 0 0.85 5.68
5 0.85 4.01
10 0.85 2.98
15 0.85 2.25
20 0.85 1.75
South EasSouth EasSouth EasSouth East Queensland:t Queensland:t Queensland:t Queensland: Nambour
Total Fraction Impervious
Daily Capture and
Management
Target AVR (pre-
development) Actual AVR
% mm/day ML/day ML/year
20 0 4.78 6.64
5 4.78 5.87
10 4.78 5.4
15 4.78 5.07
20 4.78 4.84
40 0 4.78 8.5
5 4.78 6.96
10 4.78 6.02
15 4.78 5.36
20 4.78 4.9
60 0 4.78 10.4
5 4.78 8.05
10 4.78 6.64
15 4.78 5.65
20 4.78 4.96
80 0 4.78 12.2
5 4.78 9.14
10 4.78 7.27
15 4.78 5.94
20 4.78 5.02

Urban stormwater—Qld BPEM guidelines 2009 – Technical Note 44
EDAW DESIGN, PLANNING AND ENVIRONMENTS WORLDWIDE
Western Districts:Western Districts:Western Districts:Western Districts: Mount Isa
Total Fraction Impervious
Daily Capture and
Management
Target AVR (pre-
development) Actual AVR
% mm/day ML/day ML/year
20 0 0.67 1.39
5 0.67 1.12
10 0.67 0.95
15 0.67 0.84
20 0.67 0.76
40 0 0.67 2.11
5 0.67 1.57
10 0.67 1.23
15 0.67 1
20 0.67 0.86
60 0 0.67 2.83
5 0.67 2.02
10 0.67 1.51
15 0.67 1.17
20 0.67 0.95
80 0 0.67 3.55
5 0.67 2.47
10 0.67 1.79
15 0.67 1.34
20 0.67 1.05
Western Districts:Western Districts:Western Districts:Western Districts: Charleville
Total Fraction Impervious
Daily Capture and
Management
Target AVR (pre-
development) Actual AVR
% mm/day ML/day ML/year
20 0 0.381 1.14
5 0.381 0.82
10 0.381 0.68
15 0.381 0.56
20 0.381 0.48
40 0 0.381 1.9
5 0.381 1.31
10 0.381 0.97
15 0.381 0.74
20 0.381 0.57
60 0 0.381 2.66
5 0.381 1.77
10 0.381 1.26
15 0.381 0.92
20 0.381 0.67
80 0 0.381 3.42
5 0.381 2.23
10 0.381 1.55
15 0.381 1.1
20 0.381 0.76

Urban stormwater—Qld BPEM guidelines 2009 – Technical Note 45
EDAW DESIGN, PLANNING AND ENVIRONMENTS WORLDWIDE
Flow Duration Curves for each climatic regionFlow Duration Curves for each climatic regionFlow Duration Curves for each climatic regionFlow Duration Curves for each climatic region
Eastern Cape York:Eastern Cape York:Eastern Cape York:Eastern Cape York: Lockhart River
Lockhart RiverLockhart RiverLockhart RiverLockhart River ---- 20% Total Impervious Flow Duration Curves20% Total Impervious Flow Duration Curves20% Total Impervious Flow Duration Curves20% Total Impervious Flow Duration Curves
Urban stormwater—Qld BPEM guidelines 2009 – Technical Note 46
EDAW DESIGN, PLANNING AND ENVIRONMENTS WORLDWIDE
LockhaLockhaLockhaLockhart Riverrt Riverrt Riverrt River ---- 40% Total Impervious Flow Duration Curves40% Total Impervious Flow Duration Curves40% Total Impervious Flow Duration Curves40% Total Impervious Flow Duration Curves

Urban stormwater—Qld BPEM guidelines 2009 – Technical Note 47
EDAW DESIGN, PLANNING AND ENVIRONMENTS WORLDWIDE
Lockhart RiverLockhart RiverLockhart RiverLockhart River ---- 60% Total Impervious Flow Duration Curves60% Total Impervious Flow Duration Curves60% Total Impervious Flow Duration Curves60% Total Impervious Flow Duration Curves

Urban stormwater—Qld BPEM guidelines 2009 – Technical Note 48
EDAW DESIGN, PLANNING AND ENVIRONMENTS WORLDWIDE
Lockhart RiverLockhart RiverLockhart RiverLockhart River ---- 80% Total Impervious Flow Duration Curves80% Total Impervious Flow Duration Curves80% Total Impervious Flow Duration Curves80% Total Impervious Flow Duration Curves

Urban stormwater—Qld BPEM guidelines 2009 – Technical Note 49
EDAW DESIGN, PLANNING AND ENVIRONMENTS WORLDWIDE
Central and Western Cape YorkCentral and Western Cape YorkCentral and Western Cape YorkCentral and Western Cape York (north) (north) (north) (north):::: Weipa
Weipa Weipa Weipa Weipa ---- 20% Total I20% Total I20% Total I20% Total Impervious Flow Duration Curvesmpervious Flow Duration Curvesmpervious Flow Duration Curvesmpervious Flow Duration Curves
Urban stormwater—Qld BPEM guidelines 2009 – Technical Note 50
EDAW DESIGN, PLANNING AND ENVIRONMENTS WORLDWIDE
Weipa Weipa Weipa Weipa ---- 44440% Total Impervious Flow Duration Curves0% Total Impervious Flow Duration Curves0% Total Impervious Flow Duration Curves0% Total Impervious Flow Duration Curves
Urban stormwater—Qld BPEM guidelines 2009 – Technical Note 51
EDAW DESIGN, PLANNING AND ENVIRONMENTS WORLDWIDE
Weipa Weipa Weipa Weipa ---- 60% Total Impervious Flow Duration Curves60% Total Impervious Flow Duration Curves60% Total Impervious Flow Duration Curves60% Total Impervious Flow Duration Curves

Urban stormwater—Qld BPEM guidelines 2009 – Technical Note 52
EDAW DESIGN, PLANNING AND ENVIRONMENTS WORLDWIDE
Weipa Weipa Weipa Weipa ---- 80% Total Impervious Flow Duration Curves80% Total Impervious Flow Duration Curves80% Total Impervious Flow Duration Curves80% Total Impervious Flow Duration Curves

Urban stormwater—Qld BPEM guidelines 2009 – Technical Note 53
EDAW DESIGN, PLANNING AND ENVIRONMENTS WORLDWIDE
Central and Western Cape York (south)Central and Western Cape York (south)Central and Western Cape York (south)Central and Western Cape York (south):::: Palmerville
PPPPalmerville almerville almerville almerville ---- 20% Total Impervious Flow Duration Curves20% Total Impervious Flow Duration Curves20% Total Impervious Flow Duration Curves20% Total Impervious Flow Duration Curves

Urban stormwater—Qld BPEM guidelines 2009 – Technical Note 54
EDAW DESIGN, PLANNING AND ENVIRONMENTS WORLDWIDE
Palmerville Palmerville Palmerville Palmerville ---- 40% Total Impervious Flow Duration Curves40% Total Impervious Flow Duration Curves40% Total Impervious Flow Duration Curves40% Total Impervious Flow Duration Curves

Urban stormwater—Qld BPEM guidelines 2009 – Technical Note 55
EDAW DESIGN, PLANNING AND ENVIRONMENTS WORLDWIDE
Palmerville Palmerville Palmerville Palmerville ---- 60% Total Impervious Flow Duration Curves60% Total Impervious Flow Duration Curves60% Total Impervious Flow Duration Curves60% Total Impervious Flow Duration Curves

Urban stormwater—Qld BPEM guidelines 2009 – Technical Note 56
EDAW DESIGN, PLANNING AND ENVIRONMENTS WORLDWIDE
Palmerville Palmerville Palmerville Palmerville ---- 80% Total Impervious Flow Duration Curves80% Total Impervious Flow Duration Curves80% Total Impervious Flow Duration Curves80% Total Impervious Flow Duration Curves

Urban stormwater—Qld BPEM guidelines 2009 – Technical Note 57
EDAW DESIGN, PLANNING AND ENVIRONMENTS WORLDWIDE
“Wet” Tropics“Wet” Tropics“Wet” Tropics“Wet” Tropics:::: Cairns
Cairns Cairns Cairns Cairns ---- 20% Total Impervious Flow Duration Curves 20% Total Impervious Flow Duration Curves 20% Total Impervious Flow Duration Curves 20% Total Impervious Flow Duration Curves
Urban stormwater—Qld BPEM guidelines 2009 – Technical Note 58
EDAW DESIGN, PLANNING AND ENVIRONMENTS WORLDWIDE
Cairns Cairns Cairns Cairns ---- 40% Total Impervious Flow Duration Curves 40% Total Impervious Flow Duration Curves 40% Total Impervious Flow Duration Curves 40% Total Impervious Flow Duration Curves

Urban stormwater—Qld BPEM guidelines 2009 – Technical Note 59
EDAW DESIGN, PLANNING AND ENVIRONMENTS WORLDWIDE
Cairns Cairns Cairns Cairns ---- 60% Total Impervious Flow Duration Curves 60% Total Impervious Flow Duration Curves 60% Total Impervious Flow Duration Curves 60% Total Impervious Flow Duration Curves

Urban stormwater—Qld BPEM guidelines 2009 – Technical Note 60
EDAW DESIGN, PLANNING AND ENVIRONMENTS WORLDWIDE
Cairns Cairns Cairns Cairns ---- 80% Total Impervious Flow Duration Curves 80% Total Impervious Flow Duration Curves 80% Total Impervious Flow Duration Curves 80% Total Impervious Flow Duration Curves

Urban stormwater—Qld BPEM guidelines 2009 – Technical Note 61
EDAW DESIGN, PLANNING AND ENVIRONMENTS WORLDWIDE
“Dry” Tropics“Dry” Tropics“Dry” Tropics“Dry” Tropics:::: Townsville
TownsviTownsviTownsviTownsville lle lle lle ---- 20% Total Impervious Flow Duration Curves 20% Total Impervious Flow Duration Curves 20% Total Impervious Flow Duration Curves 20% Total Impervious Flow Duration Curves

Urban stormwater—Qld BPEM guidelines 2009 – Technical Note 62
EDAW DESIGN, PLANNING AND ENVIRONMENTS WORLDWIDE
Townsville Townsville Townsville Townsville ---- 40% Total Impervious Flow Duration Curves 40% Total Impervious Flow Duration Curves 40% Total Impervious Flow Duration Curves 40% Total Impervious Flow Duration Curves

Urban stormwater—Qld BPEM guidelines 2009 – Technical Note 63
EDAW DESIGN, PLANNING AND ENVIRONMENTS WORLDWIDE
Townsville Townsville Townsville Townsville ---- 60% Total Impervious Flow Duration Curves 60% Total Impervious Flow Duration Curves 60% Total Impervious Flow Duration Curves 60% Total Impervious Flow Duration Curves
Urban stormwater—Qld BPEM guidelines 2009 – Technical Note 64
EDAW DESIGN, PLANNING AND ENVIRONMENTS WORLDWIDE
Townsville Townsville Townsville Townsville ---- 80% Total Impervious Flow Duration Curves 80% Total Impervious Flow Duration Curves 80% Total Impervious Flow Duration Curves 80% Total Impervious Flow Duration Curves

Urban stormwater—Qld BPEM guidelines 2009 – Technical Note 65
EDAW DESIGN, PLANNING AND ENVIRONMENTS WORLDWIDE
Central Coast (north): Central Coast (north): Central Coast (north): Central Coast (north): Mackay
Mackay Mackay Mackay Mackay –––– 20% Total Impervious Flow Duration Curves 20% Total Impervious Flow Duration Curves 20% Total Impervious Flow Duration Curves 20% Total Impervious Flow Duration Curves

Urban stormwater—Qld BPEM guidelines 2009 – Technical Note 66
EDAW DESIGN, PLANNING AND ENVIRONMENTS WORLDWIDE
Mackay Mackay Mackay Mackay –––– 40% Total Impervious Flow Duration Curves 40% Total Impervious Flow Duration Curves 40% Total Impervious Flow Duration Curves 40% Total Impervious Flow Duration Curves

Urban stormwater—Qld BPEM guidelines 2009 – Technical Note 67
EDAW DESIGN, PLANNING AND ENVIRONMENTS WORLDWIDE
Mackay Mackay Mackay Mackay –––– 60% Total Impervious Flow Duration Curves 60% Total Impervious Flow Duration Curves 60% Total Impervious Flow Duration Curves 60% Total Impervious Flow Duration Curves

Urban stormwater—Qld BPEM guidelines 2009 – Technical Note 68
EDAW DESIGN, PLANNING AND ENVIRONMENTS WORLDWIDE
Mackay Mackay Mackay Mackay –––– 80% Total Impervious Flow Duration Curves 80% Total Impervious Flow Duration Curves 80% Total Impervious Flow Duration Curves 80% Total Impervious Flow Duration Curves

Urban stormwater—Qld BPEM guidelines 2009 – Technical Note 69
EDAW DESIGN, PLANNING AND ENVIRONMENTS WORLDWIDE
Central Central Central Central Coast (southCoast (southCoast (southCoast (south): ): ): ): Rockhampton
RocRocRocRockhampton khampton khampton khampton –––– 20% Total Impervious Flow Duration Curves 20% Total Impervious Flow Duration Curves 20% Total Impervious Flow Duration Curves 20% Total Impervious Flow Duration Curves

Urban stormwater—Qld BPEM guidelines 2009 – Technical Note 70
EDAW DESIGN, PLANNING AND ENVIRONMENTS WORLDWIDE
Rockhampton Rockhampton Rockhampton Rockhampton –––– 40% Total Impervious Flow Duration Curves 40% Total Impervious Flow Duration Curves 40% Total Impervious Flow Duration Curves 40% Total Impervious Flow Duration Curves
Urban stormwater—Qld BPEM guidelines 2009 – Technical Note 71
EDAW DESIGN, PLANNING AND ENVIRONMENTS WORLDWIDE
Rockhampton Rockhampton Rockhampton Rockhampton ---- 60% Total Impervious Flow Duration Curves 60% Total Impervious Flow Duration Curves 60% Total Impervious Flow Duration Curves 60% Total Impervious Flow Duration Curves
Urban stormwater—Qld BPEM guidelines 2009 – Technical Note 72
EDAW DESIGN, PLANNING AND ENVIRONMENTS WORLDWIDE
Rockhampton Rockhampton Rockhampton Rockhampton –––– 80% Total Impervious Flow Duration Curves 80% Total Impervious Flow Duration Curves 80% Total Impervious Flow Duration Curves 80% Total Impervious Flow Duration Curves

Urban stormwater—Qld BPEM guidelines 2009 – Technical Note 73
EDAW DESIGN, PLANNING AND ENVIRONMENTS WORLDWIDE
South East Queensland: South East Queensland: South East Queensland: South East Queensland: Nambour
Nambour Nambour Nambour Nambour –––– 20% Total Impervious Flow Duration Curves 20% Total Impervious Flow Duration Curves 20% Total Impervious Flow Duration Curves 20% Total Impervious Flow Duration Curves

Urban stormwater—Qld BPEM guidelines 2009 – Technical Note 74
EDAW DESIGN, PLANNING AND ENVIRONMENTS WORLDWIDE
Nambour Nambour Nambour Nambour –––– 40% Total Impervious Flow Duration Curves 40% Total Impervious Flow Duration Curves 40% Total Impervious Flow Duration Curves 40% Total Impervious Flow Duration Curves

Urban stormwater—Qld BPEM guidelines 2009 – Technical Note 75
EDAW DESIGN, PLANNING AND ENVIRONMENTS WORLDWIDE
Nambour Nambour Nambour Nambour –––– 60% Total Impervious Flow Duration Curves 60% Total Impervious Flow Duration Curves 60% Total Impervious Flow Duration Curves 60% Total Impervious Flow Duration Curves

Urban stormwater—Qld BPEM guidelines 2009 – Technical Note 76
EDAW DESIGN, PLANNING AND ENVIRONMENTS WORLDWIDE
Nambour Nambour Nambour Nambour –––– 80% Total Impervious Flow Duration Curves 80% Total Impervious Flow Duration Curves 80% Total Impervious Flow Duration Curves 80% Total Impervious Flow Duration Curves

Urban stormwater—Qld BPEM guidelines 2009 – Technical Note 77
EDAW DESIGN, PLANNING AND ENVIRONMENTS WORLDWIDE
Western DistrictsWestern DistrictsWestern DistrictsWestern Districts: : : : Mount Isa
Mt Isa Mt Isa Mt Isa Mt Isa –––– 20% Total Impervious Flow Duration Curves 20% Total Impervious Flow Duration Curves 20% Total Impervious Flow Duration Curves 20% Total Impervious Flow Duration Curves

Urban stormwater—Qld BPEM guidelines 2009 – Technical Note 78
EDAW DESIGN, PLANNING AND ENVIRONMENTS WORLDWIDE
Mt Isa Mt Isa Mt Isa Mt Isa –––– 40% Total Impervious Flow Duration Curves 40% Total Impervious Flow Duration Curves 40% Total Impervious Flow Duration Curves 40% Total Impervious Flow Duration Curves

Urban stormwater—Qld BPEM guidelines 2009 – Technical Note 79
EDAW DESIGN, PLANNING AND ENVIRONMENTS WORLDWIDE
Mt Isa Mt Isa Mt Isa Mt Isa ---- 60% Total Impervious Flow Duration Curves 60% Total Impervious Flow Duration Curves 60% Total Impervious Flow Duration Curves 60% Total Impervious Flow Duration Curves

Urban stormwater—Qld BPEM guidelines 2009 – Technical Note 80
EDAW DESIGN, PLANNING AND ENVIRONMENTS WORLDWIDE
Mt Isa Mt Isa Mt Isa Mt Isa ---- 80% Total Impervious Flow Duration Curves 80% Total Impervious Flow Duration Curves 80% Total Impervious Flow Duration Curves 80% Total Impervious Flow Duration Curves
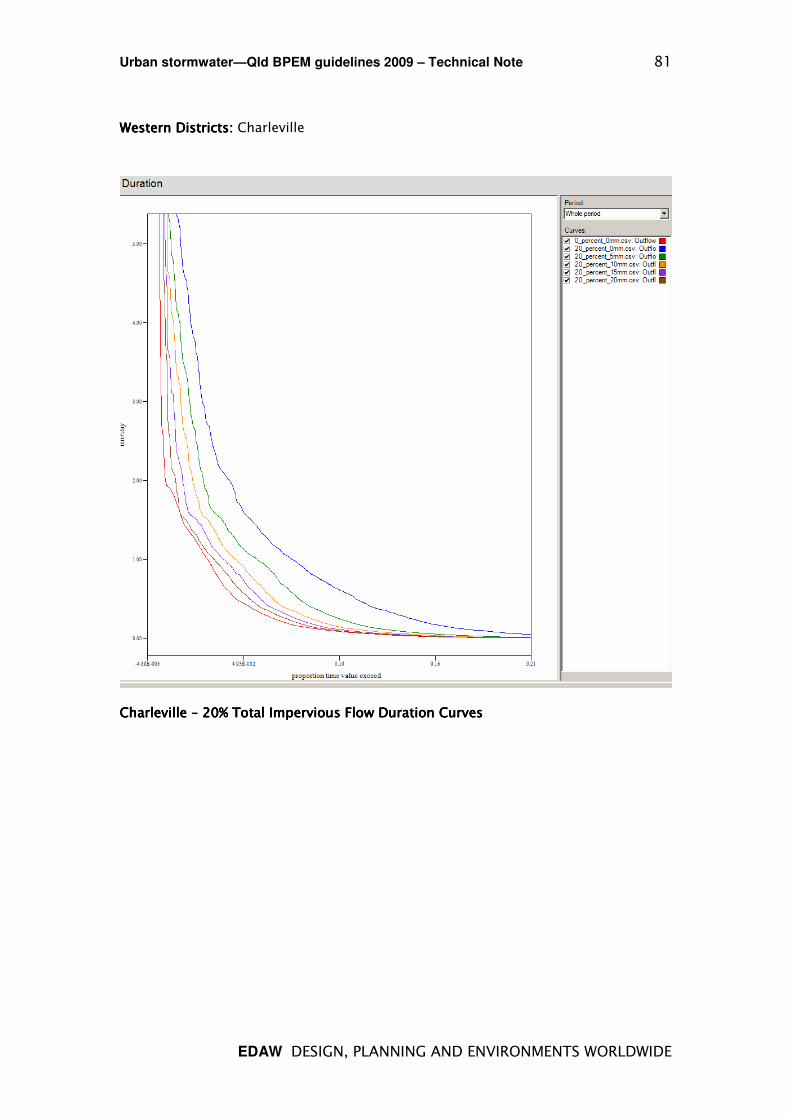
Urban stormwater—Qld BPEM guidelines 2009 – Technical Note 81
EDAW DESIGN, PLANNING AND ENVIRONMENTS WORLDWIDE
Western DistrictsWestern DistrictsWestern DistrictsWestern Districts: : : : Charleville
ChChChCharleville arleville arleville arleville –––– 20% Total Impervious Flow Duration Curves 20% Total Impervious Flow Duration Curves 20% Total Impervious Flow Duration Curves 20% Total Impervious Flow Duration Curves

Urban stormwater—Qld BPEM guidelines 2009 – Technical Note 82
EDAW DESIGN, PLANNING AND ENVIRONMENTS WORLDWIDE
Charleville Charleville Charleville Charleville –––– 40% Total Impervious Flow Duration Curves 40% Total Impervious Flow Duration Curves 40% Total Impervious Flow Duration Curves 40% Total Impervious Flow Duration Curves

Urban stormwater—Qld BPEM guidelines 2009 – Technical Note 83
EDAW DESIGN, PLANNING AND ENVIRONMENTS WORLDWIDE
Charleville Charleville Charleville Charleville –––– 60% Total Impervious Flow Duration Curves 60% Total Impervious Flow Duration Curves 60% Total Impervious Flow Duration Curves 60% Total Impervious Flow Duration Curves
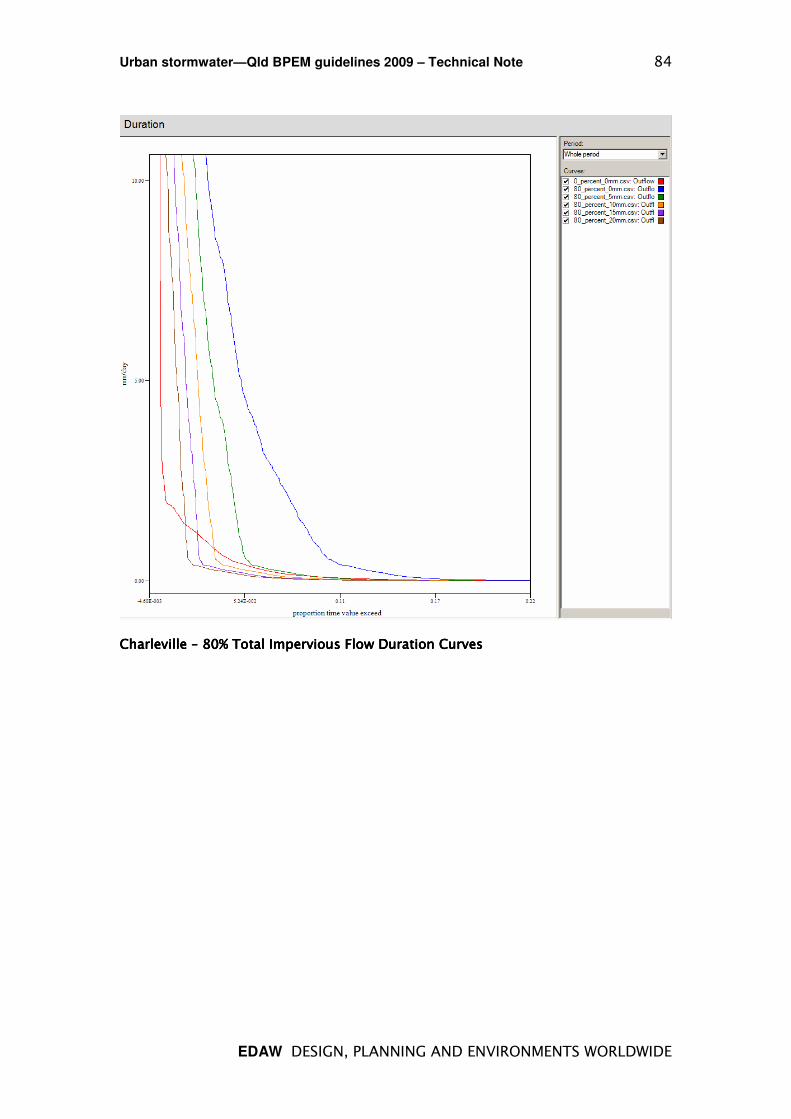
Urban stormwater—Qld BPEM guidelines 2009 – Technical Note 84
EDAW DESIGN, PLANNING AND ENVIRONMENTS WORLDWIDE
Charleville Charleville Charleville Charleville –––– 80% Total Impervious Flow Duration Curves 80% Total Impervious Flow Duration Curves 80% Total Impervious Flow Duration Curves 80% Total Impervious Flow Duration Curves