Embed Size (px)
Citation preview
INTERNATIONAL JOURNAL OF GEOMATICS AND GEOSCIENCES
Volume 7, No 1, 2016
© Copyright by the authors - Licensee IPA- Under Creative Commons license 3.0
Research article ISSN 0976 – 4380
Submitted on May 2016 published on August 2016 82
Urban sprawl and urban growth detection analysis: A comparative study
of Kolkata municipal corporation and Haora municipal corporation Tusi Das, Sarbari Chakraborty, Kaberi Samanta
School of Oceanographic Studies, Jadavpur University, Jadavpur, Raja S.C. Mallick Road,
Kolkata – 700032, West Bengal, India
ABSTRACT
The present paper highlights a comparative study between Kolkata and Haora Municipal
Corporation on the basis of urban issues urban growth and urban sprawl. This study aims to
quantify the urban sprawl and growth using some statistical techniques and GIS and Remote
Sensing techniques. In this study built-up area of Kolkata and Haora is derived from three
temporal satellite imageries on which several statistical techniques like Shannon Entropy,
Weights of Evidence and Pearson’s Chi-Square Method are applied to analyze the urban
growth and sprawl. The result shows overall increasing urban sprawl for the city of Kolkata
and Howrah with time.
Keywords: Urban growth, urban sprawl, shannon entropy, weights evidence, chi-square
method
1. Introduction
This study takes into account a comparative study between Kolkata and Haora Municipal
Corporation on the basis of some urban issues like urban growth and urban sprawl. Urban
growth is a spatial and demographic process and refers to the increased importance of towns
and cities as a concentration of population within a particular economy and society. Analysis
of urban growth by using the historical and present data is an essentially performed operation
in the urban geographic studies and for future planning. Urban growth can be mapped,
measured and modelled by using remote sensing data and GIS techniques along with several
statistical measures (Bhatta.B). Urban sprawl is defined as low density residential and
commercial development on undeveloped land. Most of the time, people will move from
these areas to try to find better areas to live. This has been the way of the world since the
beginning. Cities and their suburbs are now becoming overcrowded because of this, but now
it is time to look at the causes and the effects of the urban sprawl.
Urban sprawl can be caused by a variety of different things like lower land rates, improved
infrastructure, rise in standard of living, lack of urban planning, lower house tax rates, rise in
population growth etc. As a result some effects can be occurred like increase in public
expenditure, increased traffic, and health issues, environmental issues etc. In this study three
temporal satellite images of 15 years interval (1975, 1990 and 2012) have been classified to
determine the urban extent and growth of Kolkata-Howrah (West Bengal, India) in eight
different directions within a circular region. Pearson's chi-square test and Shannon's entropy
method have been applied to calculate the degree-of-freedom and degree-of-sprawl towards
the analysis of urban growth. A new measure, degree-of-freedom, has also been proposed for
the analysis of urban growth. The result shows that the city of Kolkata has a high degree-of-
freedom, high sprawl, and less growth in Howrah than Kolkata. Apart from the derived
results, this study also shows the potentials of remote sensing data and effectiveness of
Urban sprawl and urban growth detection analysis: A comparative study of Kolkata municipal corporation
and Haora municipal corporation
Tusi Das et al.,
International Journal of Geomatics and Geosciences
Volume 7 Issue 1, 2016 83
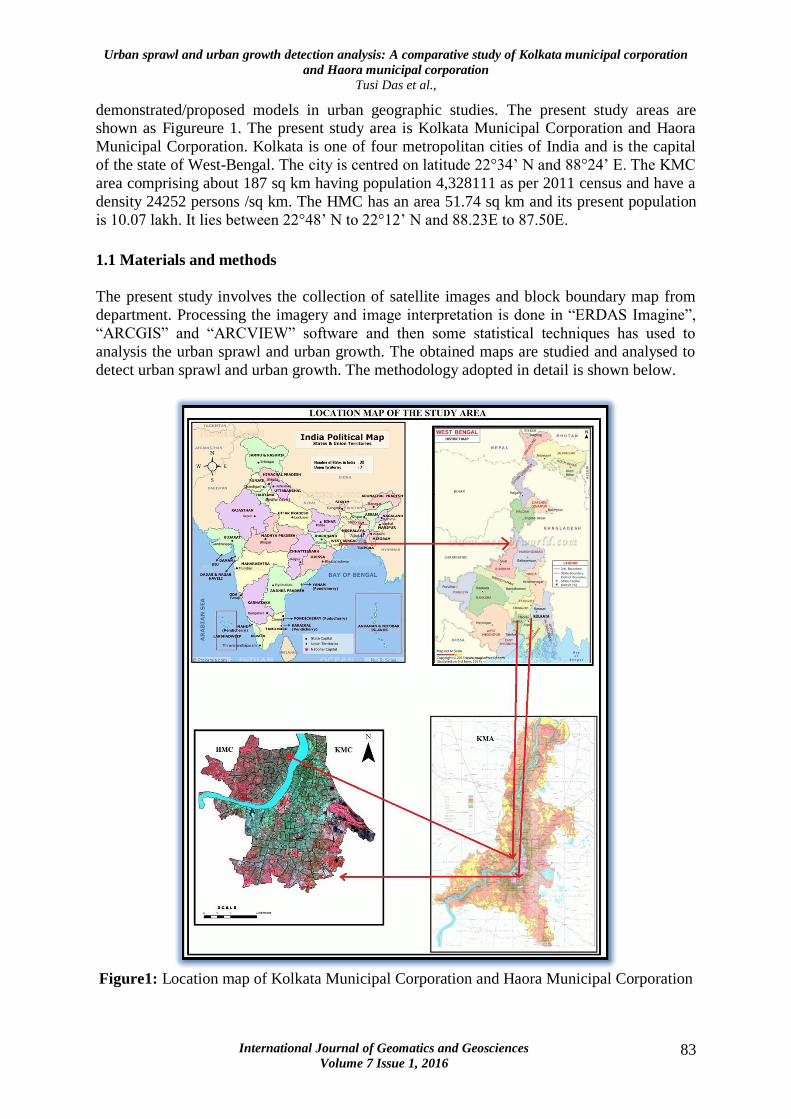
demonstrated/proposed models in urban geographic studies. The present study areas are shown as Figureure 1. The present study area is Kolkata Municipal Corporation and Haora
Municipal Corporation. Kolkata is one of four metropolitan cities of India and is the capital
of the state of West-Bengal. The city is centred on latitude 22°34’ N and 88°24’ E. The KMC
area comprising about 187 sq km having population 4,328111 as per 2011 census and have a
density 24252 persons /sq km. The HMC has an area 51.74 sq km and its present population
is 10.07 lakh. It lies between 22°48’ N to 22°12’ N and 88.23E to 87.50E.
1.1 Materials and methods
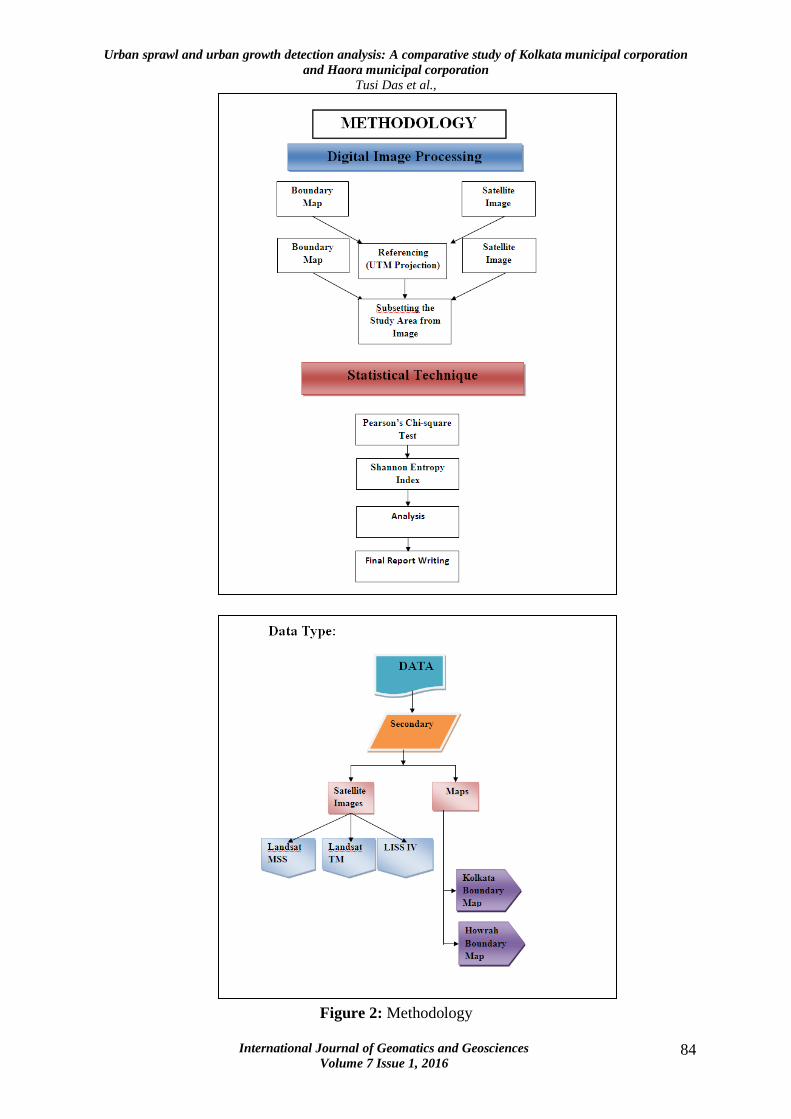
The present study involves the collection of satellite images and block boundary map from
department. Processing the imagery and image interpretation is done in “ERDAS Imagine”,
“ARCGIS” and “ARCVIEW” software and then some statistical techniques has used to
analysis the urban sprawl and urban growth. The obtained maps are studied and analysed to
detect urban sprawl and urban growth. The methodology adopted in detail is shown below.
Figure1: Location map of Kolkata Municipal Corporation and Haora Municipal Corporation
Urban sprawl and urban growth detection analysis: A comparative study of Kolkata municipal corporation
and Haora municipal corporation
Tusi Das et al.,
International Journal of Geomatics and Geosciences
Volume 7 Issue 1, 2016 84
Figure 2: Methodology
Urban sprawl and urban growth detection analysis: A comparative study of Kolkata municipal corporation
and Haora municipal corporation
Tusi Das et al.,
International Journal of Geomatics and Geosciences
Volume 7 Issue 1, 2016 85
2. Literature review
Literature review of the study is related with various national and international journals,
books and articles. The international journal like “International Journal of Advance Scientific
Research and Technology”, “International Journal of Geomatics and Geoscience”, “Journal
of Theoretical and Applied Information Technology” and the book like “Changes in land use
and land cover: A Global perspective” – William B.Neyer are related with this study. “Land
use/Land cover changes detection and urban sprawl analysis” article of “International Journal
of Advance Scientific Research and Technology” is helpful for our methodology purpose.
“Remote Sensing and GIS Application in Change Detection Study in Urban Zone Using
Multi Temporal Satellite” article of “International Journal of Geomatics and Geoscience”
deals with Information on land use/land cover in the form of maps and statistical data is very
vital for spatial planning, management and utilization of land. In the study, Remote Sensing
and geographic information system (GIS) were used in order to study land use/land cover
changes. An article like “Spatio –temporal analysis to detect urban sprawl using
Geoinformatics: A case study of Kolkata” is very much related with our study. In this article
urban sprawl and urban growth analysis has been discussed. The book “Analysis of urban
growth and urban sprawl from remote sensing data”- Basudeb Bhatta is related for urban
growth and urban sprawl analysis.
3. Results and discussion
3.1 Urban growth and urban sprawl analysis and comparisons of KMC and HMC
a) Urban growth analysis
For urban growth analysis of KMC & HMC, we have used here some statistical
techniques like weights of evidence method and Pearson’s Chi-square method.
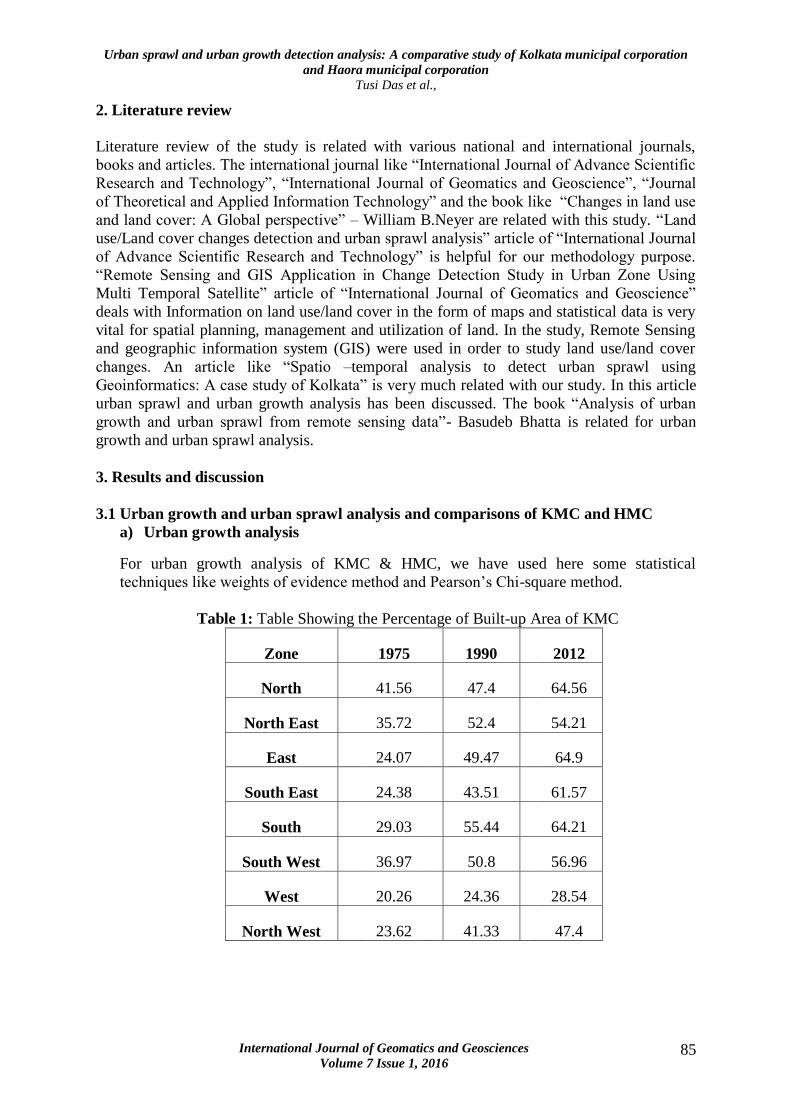
Table 1: Table Showing the Percentage of Built-up Area of KMC
Zone 1975
1990 2012
North 41.56
47.4 64.56
North East 35.72
52.4 54.21
East 24.07
49.47 64.9
South East 24.38
43.51 61.57
South 29.03
55.44 64.21
South West 36.97
50.8 56.96
West 20.26
24.36 28.54
North West 23.62
41.33 47.4
Urban sprawl and urban growth detection analysis: A comparative study of Kolkata municipal corporation
and Haora municipal corporation
Tusi Das et al.,
International Journal of Geomatics and Geosciences
Volume 7 Issue 1, 2016 86
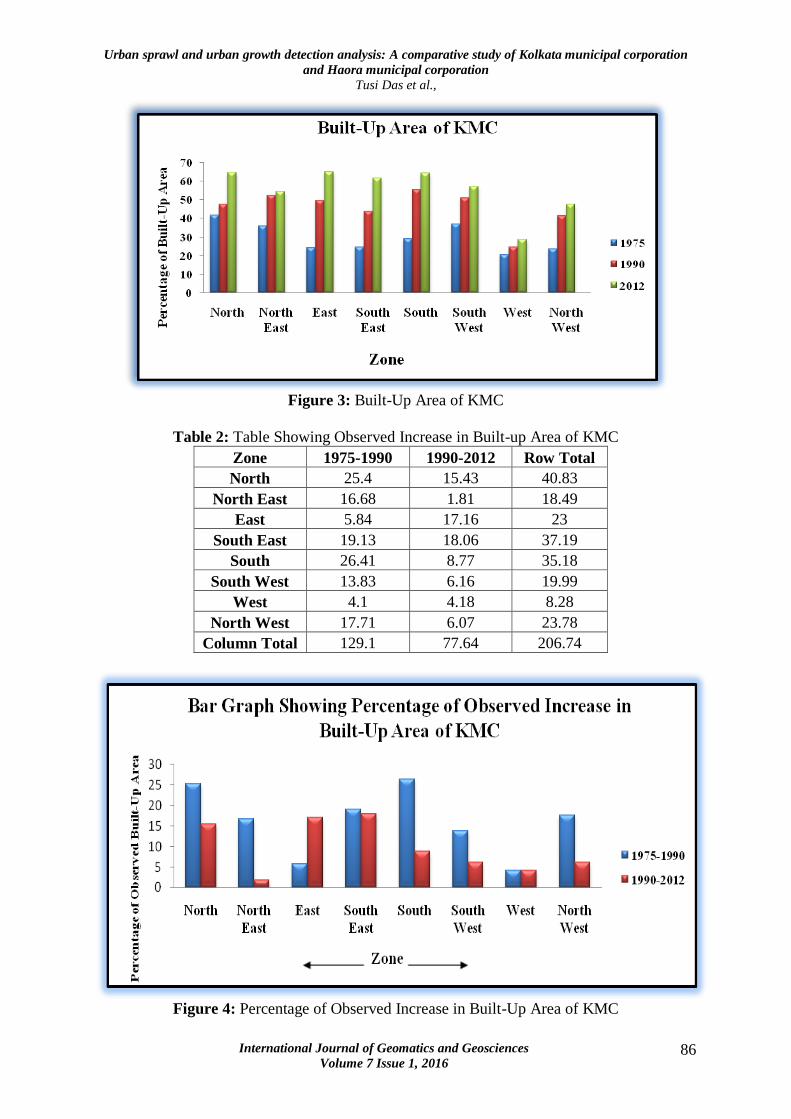
Figure 3: Built-Up Area of KMC
Table 2: Table Showing Observed Increase in Built-up Area of KMC
Zone 1975-1990 1990-2012 Row Total
North 25.4 15.43 40.83
North East 16.68 1.81 18.49
East 5.84 17.16 23
South East 19.13 18.06 37.19
South 26.41 8.77 35.18
South West 13.83 6.16 19.99
West 4.1 4.18 8.28
North West 17.71 6.07 23.78
Column Total 129.1 77.64 206.74
Figure 4: Percentage of Observed Increase in Built-Up Area of KMC
Urban sprawl and urban growth detection analysis: A comparative study of Kolkata municipal corporation
and Haora municipal corporation
Tusi Das et al.,
International Journal of Geomatics and Geosciences
Volume 7 Issue 1, 2016 87
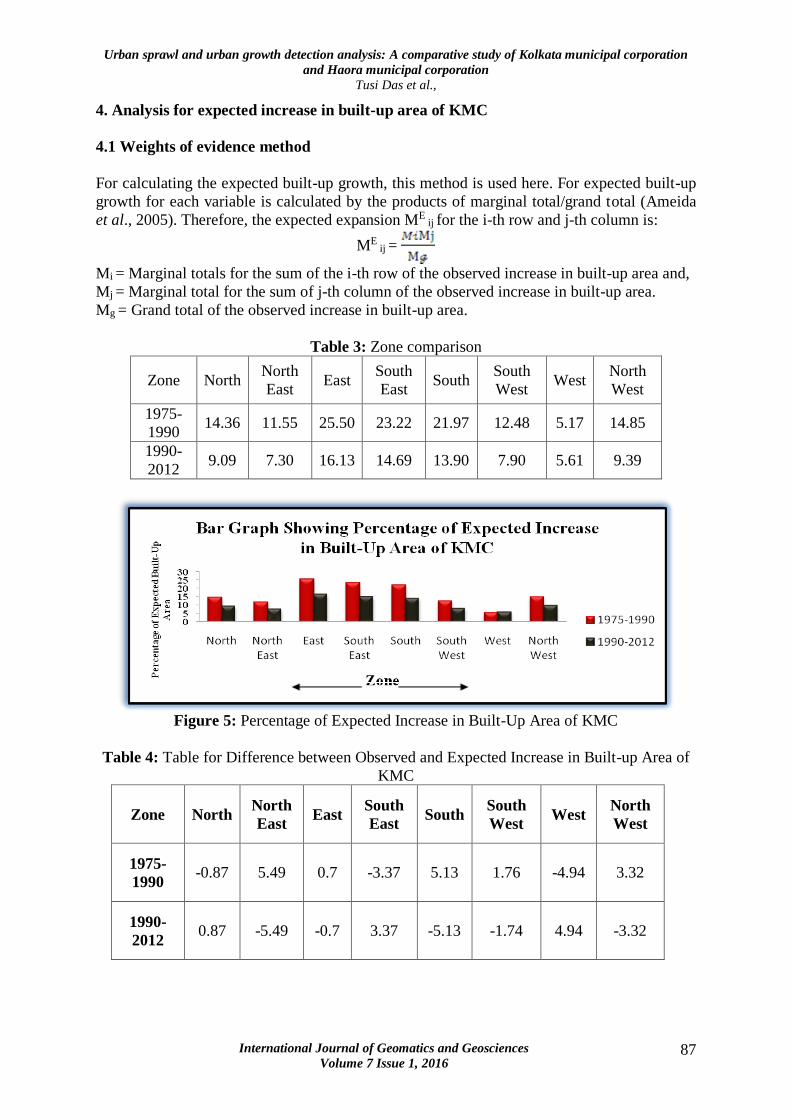
4. Analysis for expected increase in built-up area of KMC
4.1 Weights of evidence method
For calculating the expected built-up growth, this method is used here. For expected built-up
growth for each variable is calculated by the products of marginal total/grand total (Ameida
et al., 2005). Therefore, the expected expansion ME ij for the i-th row and j-th column is:
ME ij =
Mi = Marginal totals for the sum of the i-th row of the observed increase in built-up area and,
Mj = Marginal total for the sum of j-th column of the observed increase in built-up area.
Mg = Grand total of the observed increase in built-up area.
Table 3: Zone comparison
Zone North North
East East
South
East South
South
West West
North
West
1975-
1990 14.36 11.55 25.50 23.22 21.97 12.48 5.17 14.85
1990-
2012 9.09 7.30 16.13 14.69 13.90 7.90 5.61 9.39
Figure 5: Percentage of Expected Increase in Built-Up Area of KMC
Table 4: Table for Difference between Observed and Expected Increase in Built-up Area of
KMC
Zone North
North
East East
South
East South
South
West West
North
West
1975-
1990 -0.87 5.49 0.7 -3.37 5.13 1.76 -4.94 3.32
1990-
2012 0.87 -5.49 -0.7 3.37 -5.13 -1.74 4.94 -3.32
Urban sprawl and urban growth detection analysis: A comparative study of Kolkata municipal corporation
and Haora municipal corporation
Tusi Das et al.,
International Journal of Geomatics and Geosciences
Volume 7 Issue 1, 2016 88
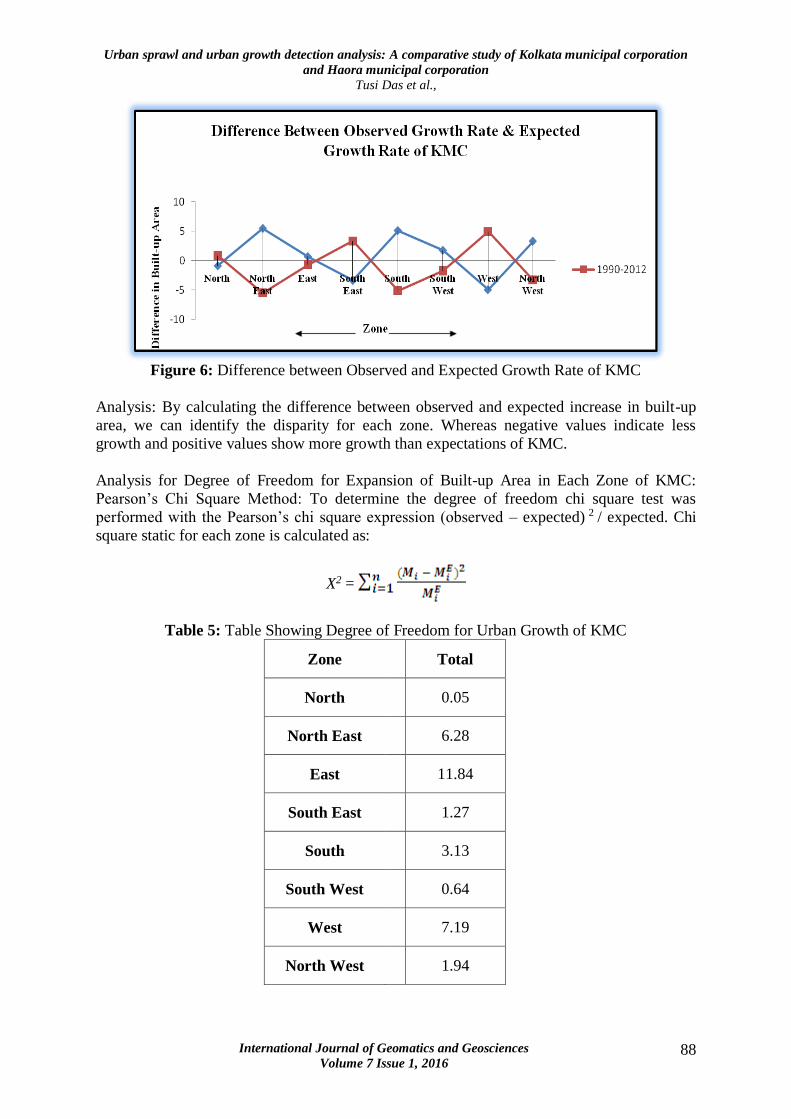
Figure 6: Difference between Observed and Expected Growth Rate of KMC
Analysis: By calculating the difference between observed and expected increase in built-up
area, we can identify the disparity for each zone. Whereas negative values indicate less
growth and positive values show more growth than expectations of KMC.
Analysis for Degree of Freedom for Expansion of Built-up Area in Each Zone of KMC:
Pearson’s Chi Square Method: To determine the degree of freedom chi square test was
performed with the Pearson’s chi square expression (observed – expected) 2 / expected. Chi
square static for each zone is calculated as:
X2 =
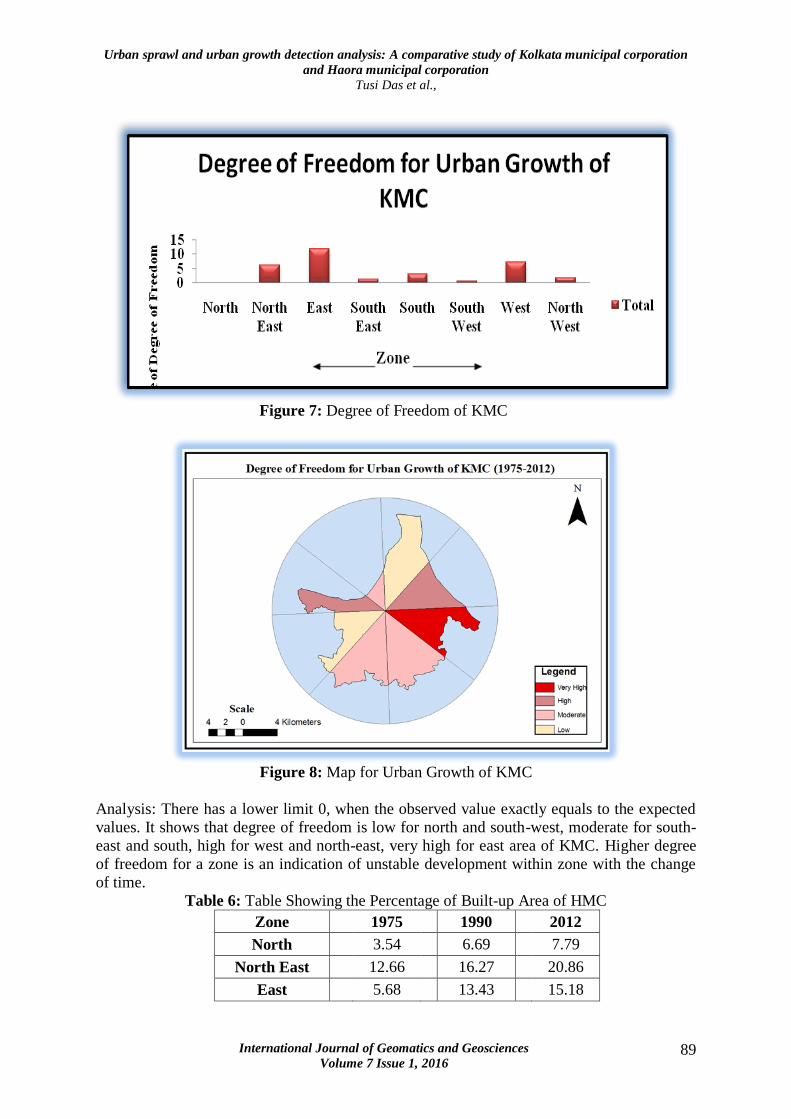
Table 5: Table Showing Degree of Freedom for Urban Growth of KMC
Zone
Total
North
0.05
North East
6.28
East
11.84
South East
1.27
South
3.13
South West
0.64
West
7.19
North West
1.94
Urban sprawl and urban growth detection analysis: A comparative study of Kolkata municipal corporation
and Haora municipal corporation
Tusi Das et al.,
International Journal of Geomatics and Geosciences
Volume 7 Issue 1, 2016 89
Figure 7: Degree of Freedom of KMC
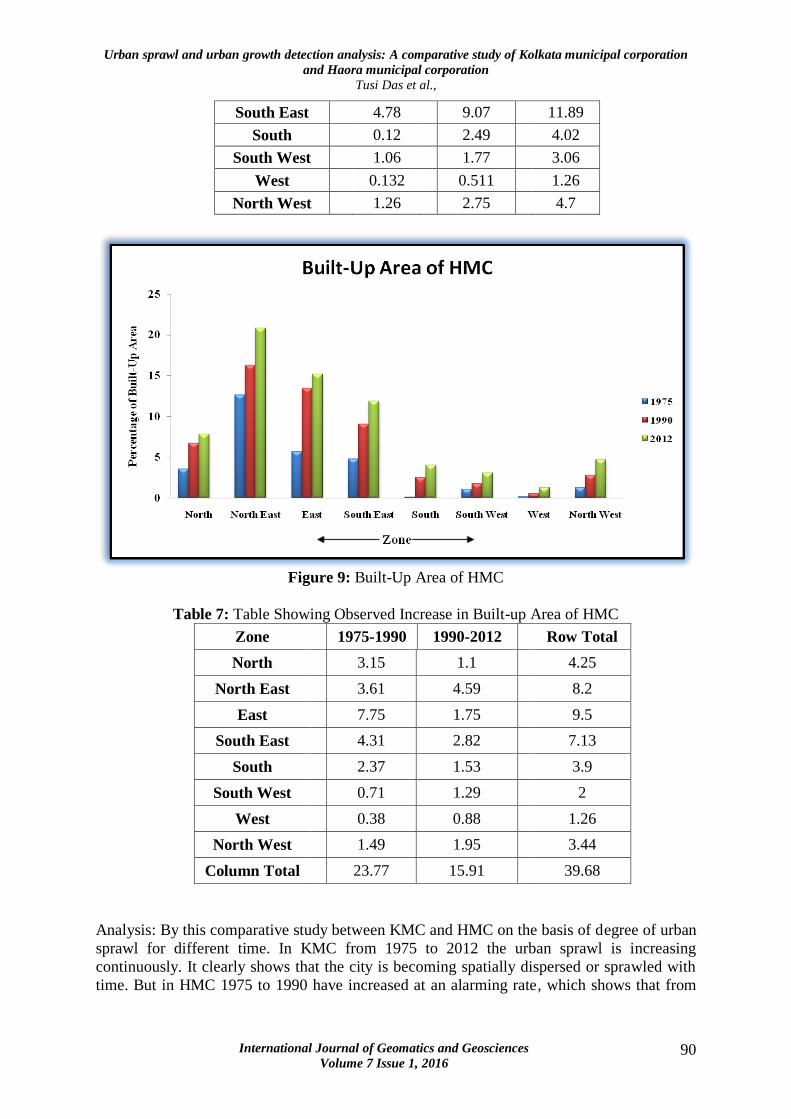
Figure 8: Map for Urban Growth of KMC
Analysis: There has a lower limit 0, when the observed value exactly equals to the expected
values. It shows that degree of freedom is low for north and south-west, moderate for south-
east and south, high for west and north-east, very high for east area of KMC. Higher degree
of freedom for a zone is an indication of unstable development within zone with the change
of time.
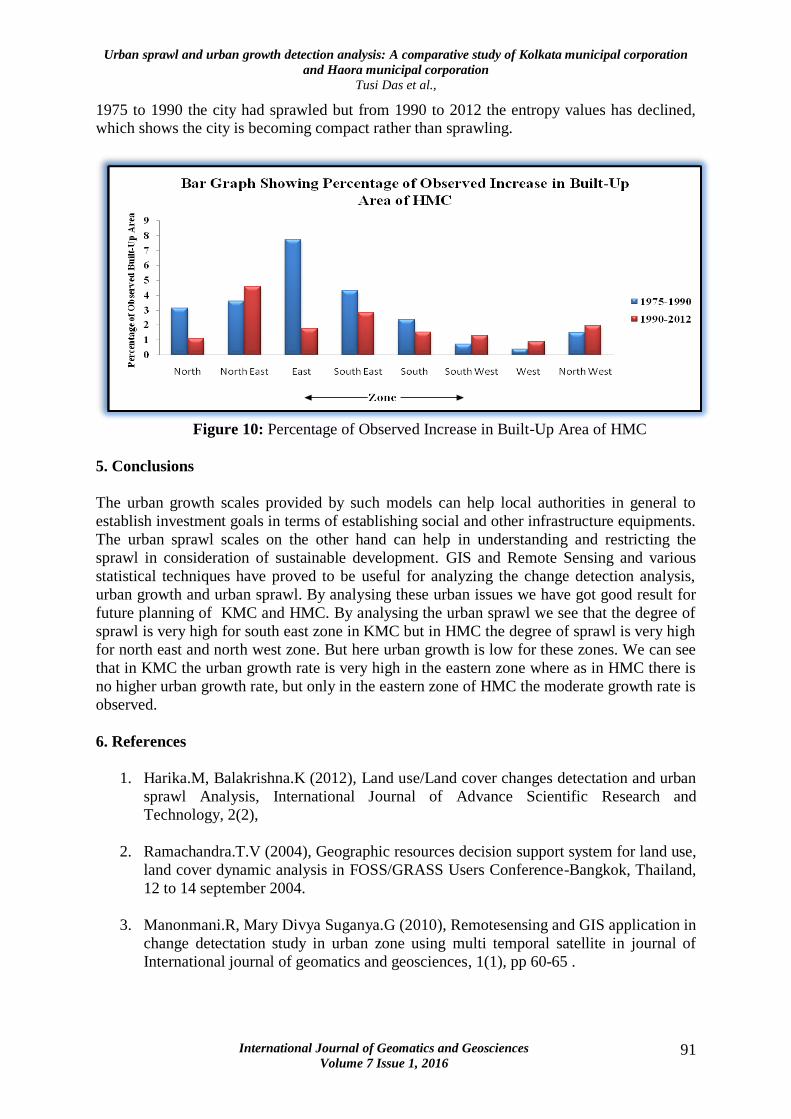
Table 6: Table Showing the Percentage of Built-up Area of HMC
Zone 1975
1990 2012
North 3.54
6.69 7.79
North East 12.66
16.27 20.86
East 5.68
13.43 15.18
Urban sprawl and urban growth detection analysis: A comparative study of Kolkata municipal corporation
and Haora municipal corporation
Tusi Das et al.,
International Journal of Geomatics and Geosciences
Volume 7 Issue 1, 2016 90
South East 4.78
9.07 11.89
South 0.12
2.49 4.02
South West 1.06
1.77 3.06
West 0.132
0.511 1.26
North West 1.26
2.75 4.7
Figure 9: Built-Up Area of HMC
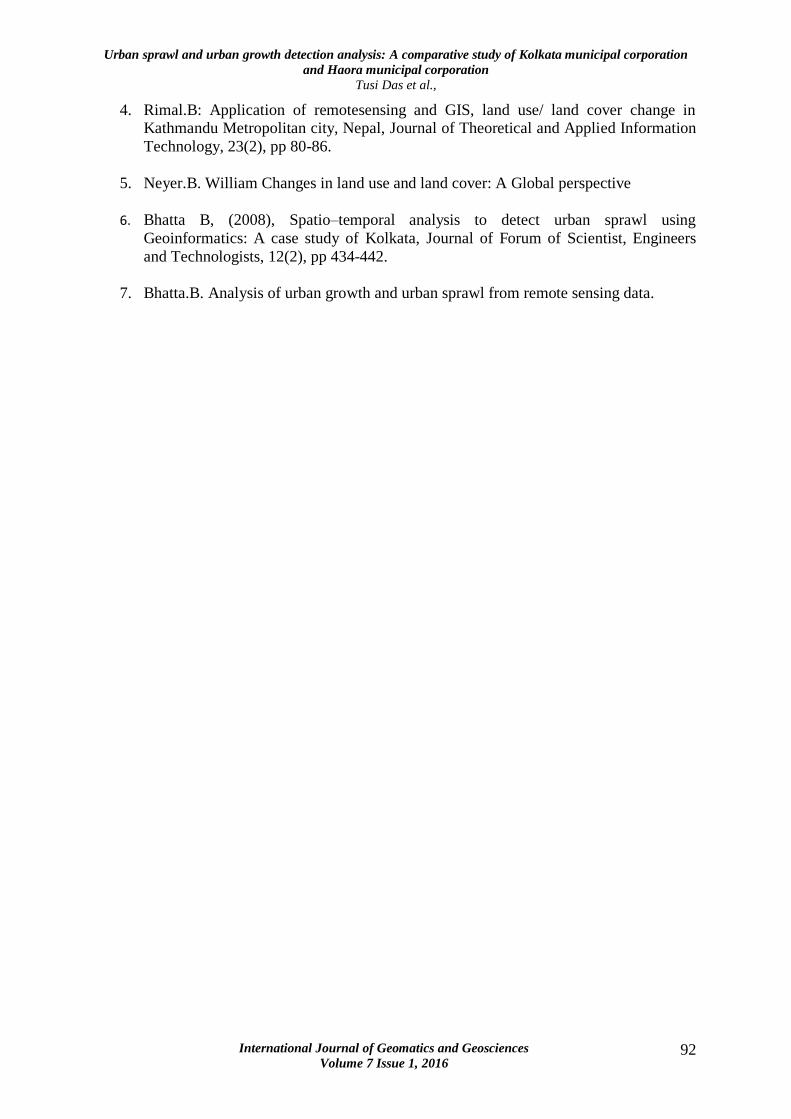
Table 7: Table Showing Observed Increase in Built-up Area of HMC
Zone
1975-1990 1990-2012 Row Total
North
3.15 1.1 4.25
North East
3.61 4.59 8.2
East
7.75 1.75 9.5
South East
4.31 2.82 7.13
South
2.37 1.53 3.9
South West
0.71 1.29 2
West
0.38 0.88 1.26
North West
1.49 1.95 3.44
Column Total
23.77 15.91 39.68
Analysis: By this comparative study between KMC and HMC on the basis of degree of urban
sprawl for different time. In KMC from 1975 to 2012 the urban sprawl is increasing
continuously. It clearly shows that the city is becoming spatially dispersed or sprawled with
time. But in HMC 1975 to 1990 have increased at an alarming rate, which shows that from
Urban sprawl and urban growth detection analysis: A comparative study of Kolkata municipal corporation
and Haora municipal corporation
Tusi Das et al.,
International Journal of Geomatics and Geosciences
Volume 7 Issue 1, 2016 91
1975 to 1990 the city had sprawled but from 1990 to 2012 the entropy values has declined, which shows the city is becoming compact rather than sprawling.
Figure 10: Percentage of Observed Increase in Built-Up Area of HMC
5. Conclusions
The urban growth scales provided by such models can help local authorities in general to
establish investment goals in terms of establishing social and other infrastructure equipments.
The urban sprawl scales on the other hand can help in understanding and restricting the
sprawl in consideration of sustainable development. GIS and Remote Sensing and various
statistical techniques have proved to be useful for analyzing the change detection analysis,
urban growth and urban sprawl. By analysing these urban issues we have got good result for
future planning of KMC and HMC. By analysing the urban sprawl we see that the degree of
sprawl is very high for south east zone in KMC but in HMC the degree of sprawl is very high
for north east and north west zone. But here urban growth is low for these zones. We can see
that in KMC the urban growth rate is very high in the eastern zone where as in HMC there is
no higher urban growth rate, but only in the eastern zone of HMC the moderate growth rate is
observed.
6. References
1. Harika.M, Balakrishna.K (2012), Land use/Land cover changes detectation and urban
sprawl Analysis, International Journal of Advance Scientific Research and
Technology, 2(2),
2. Ramachandra.T.V (2004), Geographic resources decision support system for land use,
land cover dynamic analysis in FOSS/GRASS Users Conference-Bangkok, Thailand,
12 to 14 september 2004.
3. Manonmani.R, Mary Divya Suganya.G (2010), Remotesensing and GIS application in
change detectation study in urban zone using multi temporal satellite in journal of
International journal of geomatics and geosciences, 1(1), pp 60-65 .
Urban sprawl and urban growth detection analysis: A comparative study of Kolkata municipal corporation
and Haora municipal corporation
Tusi Das et al.,
International Journal of Geomatics and Geosciences
Volume 7 Issue 1, 2016 92
4. Rimal.B: Application of remotesensing and GIS, land use/ land cover change in Kathmandu Metropolitan city, Nepal, Journal of Theoretical and Applied Information
Technology, 23(2), pp 80-86.
5. Neyer.B. William Changes in land use and land cover: A Global perspective
6. Bhatta B, (2008), Spatio–temporal analysis to detect urban sprawl using
Geoinformatics: A case study of Kolkata, Journal of Forum of Scientist, Engineers
and Technologists, 12(2), pp 434-442.
7. Bhatta.B. Analysis of urban growth and urban sprawl from remote sensing data.


![Urban Sprawl[Date] Today I will: Know the causes, problems and solutions to Urban Sprawl](https://img.dokumen.tips/doc/110x75/568166eb550346895ddb35ac/urban-sprawldate-today-i-will-know-the-causes-problems-and-solutions-to.jpg)