Embed Size (px)
DESCRIPTION
Urban Planning and Economic Development News Magazine provides educational information and services in urban planning and environmental conservation in a multi media format to an interconnected global community that will both enable individuals and communities to adapt to new holistic techniques and solutions to resolve existing and future urban and environmental issues and foster economic and sustainable development. Our Vision is to share a full range of interdisciplinary, professional knowledge with community leaders, professional planners, businesses and interested citizens having a commitment to operational excellence in the public and private sectors in a multi media format. Contributions from our constituency will assist in facilitating sound decisions in community development and promote continued commitments to create quality places to live, work and play. www.facebook.com/pages/urban-planning-and-economic-development-news-magazine/297997373595703?ref=hl
Citation preview

A Global Publication
Oct
ober
201
3
VOL
8
A Global Publication
URBAN PLANNING ANDECONOMIC DEVELOPMENT
Indian Country:New Tribal Trust Lands and Indigenous
Go BIG: Improving Suburbs
U.S. and Japanese Cultural Ties ShowReciprocity and the Promise of EconomicDevelopment
How the Netherlands Attract Foreign Investment

A Global Publication
Urban Planning and Development Through Partnership
In Association withUrban Planning and Economic Development Associates
Our Vision is to share a full range of interdisciplinary professional knowledge with community leaders, professional planners, businesses and interested citizens having a commitment to operational excellence in the public and private sectors. Contributions from our constituency will assist in facilitating sound decisions in community and economic development to promote continued commitments in creating quality places to live, work and play. Our goal is to provide educational information and services in urban planning and environmental conservation to an interconnected global community that will both enable individuals and communities to adapt to new holistic techniques and solutions to resolve existing and future urban and environmental issues and foster economic and sustainable development.
© October 2012
2
General Manager/PublisherPamela Shinn, BS URP
Editorial ConsultantDavid Weinstock, PhD
European Consultant
Andrey Maltsev
South American ConsultantTella Guillermo, PhD
North American ConsultantAmy Blatt, PhD
Advisory Board
Amy Blatt, PhD
Tracy Mullins, MS, AICP
Scott Ranville
Solenne Cucchi
Andrey Maltsev
We are always looking for contributing writers. If you would like to contribute to our magazine and cause, write to us at:
[email protected] Submit your abstract/idea! If you have any photos you would like to contribute, we welcome your contributions too! For more information about submission criteria go to:
www.urbanplanninganddevelopmentassociates.webs.comWatch for our 2014 listings under the new magazine up-date tab.
3
“Partnering for a Brighter Tomorrow”
GreenITers:Rethinking Our Relationship with Technologyby Flavio Souza, MBA 4
Indian Country:New Tribal Trust Lands and Indigenous Land Planning 6by Tracy Mullins, MS, AICP andMarcia Mullins, MNM
U.S. and Japanese Cultural Ties ShowReciprocity and the Promise of EconomicDevelopmentby Diane Fromme 18
Choices of a World-Class Cityby Nidhi Batra 24
Urban Codes and City PlanningOr the disagreement between theory and practiceby Guillermo Tella, PhD 28
Four-Year-Dry Spell: China in 2010-2013by Yekaterina Dobritskaya, PhD 31
Go BIG: Improving Suburbsby Jenny and Scott Randall 36
How the Netherlands Attract Foreign Investmentby Andrey Maltsev 46
The Last Wordby Pamela Shinn 49
We are on twitter, Urban Planning Mag@UrbanPlanningMa and like us on Facebook at:https://www.facebook.com/pages/Urban-Planning-and-Economic-Development-News-Maga-zine/297997373595703

4
Rethinking Our Relationship with Technologyby Flavio Souza, MBA
According to Wikipedia: “technology refers to the making, modification, usage, and knowledge of tools, machines, techniques, crafts, systems, and methods of organization, in order to solve a problem, improve a preexisting solution to a problem, achieve a goal, handle an applied input/output relation or perform a specific function”.
The definition continues:“The human species' use of technology began with the conversion of natural resources into simple tools. The prehistorically discovery of the ability to control fire increased the available sources of food and the inven-tion of the wheel helped humans in travelling in and controlling their environment. Recent technological developments, including the printing press, the tele-phone, and the Internet, have lessened physical barri-ers to communication and allowed humans to interact freely on a global scale”.
That’s all good but as of today, we have two main prob-lems with technology:
• Notalltechnologyhasbeenusedforpeace- ful/positive purposes. For example, the development of weapons of ever-increasing destructive power has progressed throughout history, from clubs to nuclear weapons.
• Manytechnologicalprocessesproduce unwanted by-products, known as pollution, and deplete natural resources to the detriment of the Earth and its environment.
Those two problems are so significant that they raise a vital question: Is the human race evolving or “devolv-ing” with the technologies around? From a biological perspective, there is no such thing as “devolution” but that can be assumed and the question reconstituted as: Is technology being used against or in pro of our race evolution.
The scientific truth is human race has stopped evolving but has kept on growing, which bring lots of challenges ahead. Therefore, it is time to rethink our relationship with technology if the human race wants to solve those challenges, and, as an extra bonus, achieve a level up in our humanity mindset.
That will require bold action, which, in turn, increases technology’s positive impact in our daily lives and a more friendly environmental approach overall--the ideal win-win scenario.
How? The first step will be for us to understand and act as people who want to use technology in a positive way: to advance knowledge, to expand awareness and spread wisdom to all. In other words, we want to use technology wisely, with a noble goal in mind. That is not restricted to the individual level. Companies could also embrace this idea. Let`s take a look at technology patent wars, where companies hold them with pride.
Some of them are great technology ideas that were never implemented or ever will but somehow are con-sider “assets” and efficient tools for generating revenue

through lawsuits if someone happens to step into their covered patent domain.
As Khalil Gibran said: “A little knowledge that acts is worth infinitely more than much knowledge that is idle”.
The pursuit of our shared awareness and the spread of this wisdom to all should be our main contribution to the next generations and our planet as a whole.
We are droplets in this universal ocean of humanity and hence we are all connected, so let`s let technology help us out on our way.
GreenIT’ersGreenITers.com motto:
We’re united individuals who want to use technology in a positive way: to advance knowledge, to expand aware-ness and spread wisdom to all.
Advances in positive technologies are critical to en-hance our human experience, and for making a more eco-friendly society. As with all technology, it is people with the passion for progress who make the biggest con-tributions. In the case of technological solutions, there are many people, both expert and amateur alike, who want a community to discuss ideas and improve the us-age of technology in a positive away.
GreenITers provides just such an online community, where everyone, from top academics to the average person with an interest in using technology in a posi-tive way can advance knowledge, expand awareness and spread wisdom. We get together online and share ideas, new gadgets, scientific news and break-throughs
It is free, fast and easy to join GreenITers and as a member, people can join groups, existing groups cover topics such as Renewable (Biofuel, Biomass, Geother-mal, Hydroelectricity, Solar, Tidal Wave, Wind), Elec-tric / Hybrid Vehicles, Green IT, Green Building,Eco Projects, Nature Protection, Climate Change, Recycle and Green Innovations.
These are great areas to post images, video, discuss ideas and collaborate on projects. Other features in-clude a news share, photo library, and blog. Whether members are interested in motoring technology advances or solar powered gadget re-chargers, or even how to generate energy from trees, this is a great place to whet your appetite, and work with or read posts from other GreenITers`s members.
It is going to take a global team effort to have a positive impact on the world, and GreenITers.com provides a place where global green like-minded individuals can come together and progress into real positive technol-ogy solutions to the world.
About the Writer
Flavio Souza holds a double master degree (e-business and MBA) from the International University of Japan (IUJ), Niigata. He has over 15 years of experience working in marketing and hi-tech business areas at global corporations in his native Brazil, Europe and Japan. Souza is also the founder of the fastest growing green community - GreenITers (www.GreenITers.com) and CEO at Fullcircle Innovations KK (www.fullcircle.co.jp).
5

The U.S. government recently announced it will spend nearly $2 billion on 10 million acres that will be given back to Native American Tribes. (United Press Inter-national, Aug 4, 2013). This action is rooted in the unique legal position of tribes in relation to the U. S. government, established through a long history of broken treaties, failed attempts to assimilate tribes into the dominant culture and acts of legislation intended to redress past wrongs.
Tribes have several options on how to plan for new tribal trust lands, and stakeholders who will inter-face with tribes with respect to tribal trust lands need insight into indigenous perspectives on urban design. This paper examines the historical context of this significant land purchase and considers the complex nature of Tribal land planning.
For the purpose of this article, we use the terms Amer-ican Indian, Native American and Indigenous people interchangeably; all refer to the native peoples that inhabited what is now the United States of America at the time of colonization. The term Indian Tribe refers to groups of American Indians that are recognized as constituting distinct and historically continuous political entities for at least some government purpose (Canby, 1998). In May of 2013, the United States Fed-eral Register issued an official list of 566 Indian Tribes that are “Indian Entities Recognized and Eligible to Receive Services from the United States Bureau of Indian Affairs” (Federal Register, 2013). For additional clarity on the topic, please refer to this official list. We also use the terms American Indian and Indigenous People interchangeably.
Historical Perspective: Colonialism
British colonialism in Canada, Australia, New Zea-land, and the United States determined the legal status of indigenous peoples living in those countries. As a former British colony, the United States inherited the English common law tradition, along with its rules and principles dealing with indigenous tribal peoples’
rights and status (Getches, Wilkinson, & Williams, 1993). However, the unique legal position of tribes in relation to the U. S. government is rooted in Ameri-can history; this historical context is a key element in understanding why the purchase of 10 million acres of lands for the tribes is necessary and how Indian tribes may deal with the newly acquired land.
The relationship between the U.S. federal government and Indian tribes has a long and complex legal history. The body of federal Indian law expressed in the United States Code and the Code of Federal Regulations, some 380 treaties, and hundreds of legal opinions are evidence that Indians, more than any other ethnic group, are subject to extensive legal regulation (Getch-es, Wilkinson, & Williams, 1993). Four themes based in case law can basically explain the doctrine respon-sible for the current relationship between Tribes and the federal government. The first theme is that all 566 Tribes are sovereign and independent entities with in-herent powers of self-government. The second theme is that the independence of a tribe is subject to the powers of the U.S. Congress to regulate or modify its status. The third theme declares that the power to deal with and regulate tribes is wholly a federal power and that individual states have no power of regulation over tribes unless the U.S. Congress delegates that power to the State. And the fourth theme is that the federal government, by international treaty law, has responsi-bility for the protection of tribes and their properties, including protection from infringement by states and their citizens (Canby, 1998).
Prior to European contact, Indian tribes occupied more than 2.3 billion acres of land that comprise the current United States of America. Many tribes were nomadic in nature and traveled great distances sea-sonally for hunting, gathering, ceremonial, and social purposes, returning each year to the same Territory. Tribes often shared overlapping territories with other tribes. The idea of land ownership by individuals, which European colonialists brought with them, was an alien and outlandish concept to Indian Tribes. Eu-ropean concepts of land as a transferable asset, with its
Indian Country: New Tribal Trust Lands andIndigenous Land Planning
By Tracy Mullins, MS, AICP and Marcia Mullins, MNM
6

emphasis on exploitation for monetary gain, conflicted with the native philosophy of respectful occupation and use of the land and what it viewed as “gifts from the creator” (Pre-Contact, 2009).
Tribal relationships with federal government started during the British colonization of the eastern sea-board of America. The British dealt with Indian tribes formally, as foreign sovereign nations, recogniz-ing that their inability to prevent encroachments on Indian lands gravely threatened the British govern-ment’s interests in North America. In order to gain the Indians as allies in the war against France, the British government decided to prohibit settlement on lands and hunting grounds belonging to the allied Tribes. Because the British government concluded that their colonists could not be trusted to avoid encroachment on Indian Territory, and that any Indian wars in North America would be fought at great expense, the British Government formalized a policy of protecting Indian lands (Getches, Wilkinson, & Williams, 1993).
As victors of the American War of Independence (1775-1783), the newly formed United States govern-ment found itself with the same problems of encroach-ment on Indian lands and threat of retaliation that the British had faced. Very early on, it was apparent to Congress that the tribes could be contained or decimated by force. It was also clear that the costs of wars with the tribes - in lives, material, time, and conscience - were far too great to risk. Indians were perceived to be barriers to settlement of the frontier, but these lands were too vast for the new U.S. govern-ment to defend against attacks by “hostile Indians” (Getches, Wilkinson, & Williams, 1993). The federal government’s policy of negotiating land secessions, treaties and agreements was born of necessity and convenience. U.S. federal treaties with Indian tribes provided legally based government-to-government agreements that guaranteed tribal retention of certain rights and privileges such as land-use, hunting and oc-cupation rights, concepts that were formally expressed in legislation such as the Northwest Ordinance of 1787, which promised “the utmost good faith…. towards the Indians, their lands and property” by the United States.
The U.S. federal government secured its role as the sole entity with power to negotiate treaties with Indian tribes through Article 1, Section 8 of the U.S. Consti-tution (the Commerce Clause). The Commerce Clause gave Congress the exclusive authority to “regulate commerce with foreign nations and among the several states and with Indian tribes”, while the President was empowered to make treaties, necessarily including In-dian treaties, with the approval of the Senate (Canby, 1998). In 1790, Congress adopted the Act to Regulate Trade and Intercourse with Indian Tribes, which among other things entrenched the role of the federal govern-ment as a necessary participant in Indian land transac-tions. This act was a protective provision designed to monopolize land transactions as a power within the federal government and to prevent loss of Indian lands to sharp dealings by non-Indians (Getches, Wilkinson, & Williams, 1993).
As settlers moved west in search of land to settle in the 1800s, the federal government created a policy of restricting tribes to specific reservations. Many people believed that with a small but intact reservation land base, most tribes would be able to maintain their cul-tural base, language and governance practices. Cer-tain governance and jurisdiction over the land would have remained with the sovereign nation (Stainbrook, 2002).
Establishment of the Reservation System
Most treaties or presidential executive orders required tribes to cede large land tracts of land in exchange for much smaller areas reserved for their exclusive use (hence the term reservation), including the right to continue their customary practices. In return, the set-tlers would have access to new land and would not be attacked. Treaties, war, and the threat of war became the means through which the United States was able to per-suade Indian nations to extinguish title to their increas-ingly sought after land.
Federal Indian policy continued to be reshaped by Su-preme Court decisions that redefined Indian rights and
Indian Country: New Tribal Trust Lands andIndigenous Land Planning
By Tracy Mullins, MS, AICP and Marcia Mullins, MNM
7

sovereignty. The most significant Supreme Court deci-sions are known as the Marshall trilogy (1823-1832). In brief, these cases set out the following principles of federal Indian law:
• Aboriginal Land Claims: Aboriginal people had land use rights of occupancy and only the United States government can settle those claims.
• Tribal Sovereignty: Tribes are similar to sovereign nations with the authority to govern themselves. The source of their authority to govern is inherent, meaning that it originates with tribes being self- governing long before explorers and set tlers came to the New World.
• Federal Trust Responsibility: The Fed- eral government has a responsibility to protect Indian lands and resources, and to provide essential services to Indian people. This comes from the fact that the Federal government took away the vast majority of Indian lands, and in return promised to provide these things (UAF Interior Aleutians Campus).
In 1831, Supreme Court Justice Marshall wrote the Supreme Court decision that determined tribes could not be considered foreign states; rather, their relation-ship to the United States resembles that of a ward to his guardian (Canby, 1998). This is the nexus of the unique legal position of tribes in relation to the federal government.
The Indian Removal Act of 1830 facilitated a wave of treaty-making that focused on the exchange of tribal lands in the East for “comparable” lands west of the Mississippi River, over which Indian nations would be guaranteed exclusive “use and occupation”. This removal often resulted in extreme hardship and death to many tribal members. The Indian Removal Act: Forced Relocation by Mark Steward (2006) gives a de-tailed account of this period in Indian history. In 1871, Congress abolished the practice of treaty-making with tribes. In the 1870s and 1880s, there was increasing
dissatisfaction with the reservation policy by both tribes and the federal government. Reservation life was plagued with extreme poverty. This was docu-mented by first hand observer Helen Hunt Jackson in her 1881 book A Century of Dishonor and later in Dee Brown’s 1976 book Bury My Heart at Wounded Knee.
The Allotment Era
Through the 1880s, reservation lands were held com-munally under tribal ownership. This was thought of by some non-Indians to be an ineffective use of land. Collective ownership on the reservation land was viewed as a major obstacle to assimilating Indians into the dominant culture. Reservations were created to “civilize” Indians, transforming them into yeo-man farmers in the Jeffersonian model and moving their culture away from collective ownership and into private ownership. The Federal government’s official Indian policy was to destroy tribalism through reduc-tion of the treaty-guaranteed tribal land base targeted for settlement by non-Indians moving west (Getches, Wilkinson, & Williams, 1993).
Many non-natives resented large tracts of lands be-ing excluded from white settlement. The combination of these two issues pushed Congress to produce the most important piece of tribal legislation in United States history: the General Allotment Act of 1887, better known as the Dawes Act (Canby, 1998).
The Dawes Act provided for granting allotments of land, usually 160 acres, to individual Indians, thus re-placing communal tribal holdings. An individual Indi-an could sell his allotment after a statutory period (25 years). The Dawes Act also allowed settlers to purchase “surplus” land that was not allotted to Indians. Within decades, the vast majority of what had been tribal land in the West was in the hands of non-Indians. The Dawes Act established a trust fund to collect and distribute proceeds from oil, mineral, timber, and graz-ing leases on Indian lands. The failure of the Bureau of Indian Affairs to manage this trust fund properly led to corrective legislation and lawsuits in the 1990s and early 2000s forcing the government to properly
Indian Country: New Tribal Trust Lands andIndigenous Land Planning
By Tracy Mullins, MS, AICP and Marcia Mullins, MNM
8
account for the revenues collected (The Columbia En-cyclopedia, 2012).
The Dawes Act resulted in the loss of thousands of acres of Indian land. For example, 46% of the land within the boundaries of the Swinomish reservation in Skagit County, Washington is owned by non-Indians in fee simple and 20% of the Indian trust land is leased to non-Indians for their use (Getches, Wilkinson, & Wil-liams, 1993). This is described in some detail by Delos Sacket Otis in the 1973 book The Dawes Act and the Al-lotment of Indian Lands.
Long-term effects of the Dawes Act became evident within a few decades. Not only were 60,000,000 acres lost at the outset through the lands declared surplus and sold, but individual ownership was compromised when allotted lands were passed to subsequent genera-tions without a will specifying land inheritance. Unless individual heir to the property was declared in a will, parcels of land remained intact but ownership title was divided among all heirs. Indian land owners with very small ownership interests (such as .05 acres) did not develop a sense of ownership and largely abandoned their role in managing their land. The ineffectiveness of the federal government in managing the income from tribal land leases is now well documented as a result of the Cobell v. Norton class action lawsuit (General Allot-ment Act Reviewed 115 Years Later, 2009).
As reservation land was severed from tribes in multiple ways, checkerboard patterns of mixed land ownership on reservations emerged as a result of allotment. Land ownership on a single reservation might include indi-vidual trust land, tribal trust land, non-Indian fee sim-ple land, federal land, and municipal land, all existing side-by-side with jurisdictional issues and limitations on land-use (Land Important to Spiritual Beliefs, 2009). From 1887 to 1934, 118 reservations were allotted; this was more than half of all existing reservations. The In-dian land base was decimated, dropping from nearly 138 million acres to less than 48 million acres. Nearly 90,000,000 acres of tribal land have been lost to Indian ownership. The allotment of Indian lands brought to an end centuries of close attachment that Indian people had to the land that had provided for the daily needs to
their ancestors. The hereditary land base with its con-nection to Indian culture has badly eroded, leading to weakened tribal structures, threatened tribal sovereign-ty and despair over the cultural loss (General Allotment Act Reviewed 115 Years Later, 2009).
The Dawes Act failed its mission completely for tribal peoples, making reservation lands readily available to non-Indians, creating checkerboard land ownership, introducing fractionated land ownership and triggering enormous jurisdictional conflicts that have lasted more than 100 years. Although the extent of its damage was probably not anticipated, the changes in Indian lifestyle brought about by the Dawes Act has caused widespread social, cultural and economic hardships for Indian peoples (Ibid). The dominant American culture did not understand the sacred and profane links between Indians and land; however they did understand that the key to destroying tribal culture was to separate the two through the process of allotment.
In 1924, Congress passed the statute conferring citizen-ship on all Indians born within the United States. Before 1924, Congress had pursued a policy of extending U.S. citizenship to Indians only selectively, through treaties and statutes. These laws uniformly conditioned citizen-ship upon Indians who changed their individual behav-ior, renouncing tribal culture and traditions, and thus conforming to the dominant culture’s norms (Getches, Wilkinson, & Williams, 1993). By reason of the 14th amendment, the granting of US citizenship to Indians had the additional effect of making Indians citizens of the states in which they reside (Canby, 1998).
From the Indian Reorganization Act to Termination
While the Dawes Act was meant to assimilate Indi-ans into the American dominant culture, the Indian Reorganization Act of 1934 authorized the Secretary of the Interior to restore tribal ownership to any lands acquired from the tribes under the Dawes Act (under certain circumstances), to acquire lands and water rights for the tribes, and to create new reservations
Indian Country: New Tribal Trust Lands andIndigenous Land Planning
By Tracy Mullins, MS, AICP and Marcia Mullins, MNM
9

(Canby, 1998). Allotment of land on reservations ended with the passage of the Indian Reorganization Act which recognized Indian nation’s sovereign status and encouraged Indians to form tribal governments, reclaim their land bases and manage tribal lands more independently. Although the Indian Reorganiza-tion Act abolished the practice of allotting land, trust land ownership interests were already fractionated and difficult to manage. In addition, the “takings” of Indian lands continued through the 1930s and 1940s as government entities seized Indian land for infrastructure such as dams and other water projects, railways, highways, schools, and Defense Department needs. A byproduct of the Indian Reorganization Act has been better control and management of tribal property. The Act provided a powerful stimulus to tribal governmental organization and in many cases so strengthened tribal governments as to enable contin-ued development despite fluctuations in U.S. federal administration policies (Getches, Wilkinson, & Wil-liams, 1993).
In 1953, less than two decades after the trust status of Indian land had been guaranteed by the Indian Reor-ganization Act, Congress passed House Concurrent Resolution 180 which was designed to end the federal responsibility towards tribes and assimilate them into mainstream society. This concurrent resolution de-fined the process whereby an Indian tribe as a politi-cal entity defined by the U.S. would be terminated. Termination meant a loss of status as a tribal nation, liquidation of tribal assets (including its land), and distribution of the proceeds to tribal members. Ter-mination imposed state jurisdiction on the territories of terminated tribes, eliminated the government-to-government relationship and ended the U.S. govern-ment’s trusteeship of Indian land (Ibid.) This practice effectively dismantled the reservation system and all US statutes related to tribal status.
The Self Determination Era
In 1970, President Richard Nixon officially ended the policy of termination. For terminated tribes, the reso-lution was to pursue re-recognition through Congress or the Bureau of Indian Affairs and attempt to recover each tribe’s land base as best they could. Congress passed the Indian Self-Determination and Education Assistance Act in 1975, signaling a major shift in fed-eral policy from one of terminating tribes to one of al-lowing Tribes greater control over the management of their resources and the determination of their futures as sovereign nations. In 1988, Congress declared the U.S Government’s commitment to the development of strong and stable tribal governments. The courts have invoked the trust responsibility to compel the U.S. federal government to undertake litigation to protect tribal lands and resources (Canby, 1998).
Indian tribes have become proactive in their approach to managing their existing lands and have voiced their concerns about government mismanagement of trust land in a number of ways, including legal actions. Many Indian tribes independently manage their land bases by setting up land offices that coordinate land-use planning, provide zoning and regulatory func-tions, manage land ownership information, and work closely with numerous local and federal agencies in the oversight of tribal lands. While there is a move-ment towards land recovery and reform, tribal govern-ments still struggle to protect and recover land, exer-cise their tribal sovereign jurisdiction over tribal trust land and develop land-use and management strategies that benefit tribal members (The Self-Determination Era, 2009). Tribal governments are attempting to buy back lands lost through the allotment era, erasing the checkerboard effect by acquiring the fee lands back to tribal ownership and then converting it into trust land. By eliminating checkerboard land through purchase and “fee to trust” conversion, Tribes can gain cultural, economic, cultural and jurisdictional benefits. De-spite the fact that the Indian Reorganization Act put an end to allotment and mandated the Secretary of the Interior to put recovered tribal land into trust, of the 90,000,000 acres loss, only about 9% or 8,000,000 acres
Indian Country: New Tribal Trust Lands andIndigenous Land Planning
By Tracy Mullins, MS, AICP and Marcia Mullins, MNM
10
Phot
o by
Pam
ela
Shin
n

have been reacquired into tribal trust lands (Checker-board Effect Fractures Land Base, 2002).
Taking Land into Tribal Trust
When land is taken into trust by the U.S. federal government on behalf of a tribe, the legal title of that land is assumed by the U.S. Secretary of the Interior and jurisdictional authority is assumed by the Indian tribe and the U.S. Bureau of Indian Affairs (Taking Back the Land: A Fee-to-Trust Process Overview, 2009). The tribe retains jurisdictional authority over the land and retains the right to any income generated from the land or from its resources such as mineral extraction, timber sales, agricultural leasing and rights-of-way leasing. Once the land is taken into tribal trust, it is no longer subject to taxation by state or local govern-ments, and in many cases it is not subject to state or county jurisdiction (Ibid.).
There are two principal methods for taking land back into trust: through an Act of Congress or through the approval of the Secretary of the Interior using the Bu-reau of Indian Affairs process. Taking land into tribal trust was initially spelled out as part of the Indian Reorganization Act, which authorizes the Secretary of the Interior to acquire land and take it into trust “for the purpose of providing land” for Indians; it also specifies that the land “shall be exempt from state and local taxation” (Ibid.). The purpose of putting Indian land back into trust is to restore and protect tribal land bases lost as a result of the General Allotment Act.
Sovereignty and Land Use Planning
American Indian tribes exercise sovereignty over lands taken into tribal trust by the U.S. federal government. Sovereignty is, for tribes, the inherent right or power to govern. At the time of the European discovery of the Americas, Indian tribes were sovereign by nature and necessity; Tribes conducted their own affairs and depended upon no outside source of power to legiti-mize their acts of government (Canby, 1998). Because a tribe is sovereign entity, it is in a very different posi-tion from a city or other subdivision of a state.
State-enabling legislation is a mechanism by which a state delegates its inherent police power authority, which includes giving the power to plan and zone to local government. When a city enacts regulations such as a comprehensive plan, there must be a show-ing that the State has delegated legislating powers on the city through State-enabling legislation. A tribe is its own source of power; thus, the tribe’s right to establish a court or levy a tax is not subject to attack on the grounds that Congress has not authorized the tribe through enabling legislation. A tribe is sovereign and needs no authority from the federal government (Ibid.). Tribal sovereignty is a doctrine of strength be-cause of its internal significance to tribal governments and the resulting external consequences for the state and non-Indian individuals and corporations within Indian country. (Getches, Wilkinson, & Williams, 1993).
The U.S federal government holds the legal title to tribal land in trust, and the undivided beneficial inter-est is held by the tribe as a single entity. There are two advantages to this type of ownership. The first advan-tage is that the land base of the tribe is given maxi-mum protection due to the continuity of advantageous ownership. The second advantage is that management of the land is relatively easy when decisions over leas-ing and development can be made by a single owner, even though that owner must go through its own form of institutional decision-making (Canby, 1998).
When land is communally held in tribal trust, individ-ual members may simply share the enjoyment of the entire property without having personal claim to an identifiable piece of land. In practice, however, tribal members need some method of identifying whether it is permissible for them to erect a residence, graze stock in a particular place, or engage in other activities requiring a relatively fixed location. This need is cus-tomarily met by the tribe conferring a license upon the tribal member to use particular land. The license may go by many names, but it is generally referred to as an assignment. The terms of the land assignment may vary greatly in duration and scope; however, there is a marked tendency to renew an assignment once given and to permit descendants to acquire the assignment of the deceased assignee (Canby, 1998).
Indian Country: New Tribal Trust Lands andIndigenous Land Planning
By Tracy Mullins, MS, AICP and Marcia Mullins, MNM
11

The Connection of Indians to the Land
“This earth that we walk on, no one can sell it” -- Tasunke Witko (Crazy Horse)
Indians considered land as something that could not be owned or traded; Indians did not seek to own or possess anything, but sought instead to belong. Indi-vidual Indians belonged to a family, which belongs to a tribe. Most tribes developed elaborate rules and cus-toms that guide social order and interactions between people as well as interactions between the people and the environment. This distinctive world view recog-nizes that the interrelatedness and interdependency of all things within the environment includes humans (Hart, 2010).
For many tribes, culture is conterminous with reli-gion, each encompassing the spiritual dimension of a human being living in harmony with all beings and within nature. European-derived values and tradi-tions view organized churches as representing religion, while the government’s role is to remain apart from and not hamper individual pursuit of a church-based religion. Therefore, the institutions of the United States’ political and legal systems were not designed to ensure the vitality of a culture whose essential spiritu-ality pervades all aspects of being and understanding (Getches, Wilkinson, & Williams, 1993). The site-specific nature of native religious practice is derived from the Native American perspective of land itself as a sacred living being where specific sites possess different spiritual properties and significance. Within this belief system, land is not fungible and cannot be bought, sold or traded (Ibid.). Tribal cultures have survived because they use the Earth’s resources with a sensitive touch.
Some tribes have engaged in cultural landscape resto-ration as a means of rebuilding their cultural renew-able resources. Cultural landscape restoration can include restoring edible, medicinal and basketry plants using traditional stewardship techniques of burning and pruning. Burning and pruning are agricultural
techniques that give back to the land, returning nu-trients back to the soils. Therefore, burning is not just a ceremonial act; it is part of an active relationship which connects the tribe to the land. In the not so distant past, the physical health and wellbeing of tribes depended on harvesting plants and animals at the right time, making offerings and prayers at the right time, and understanding one’s place among the other animals as part of the bigger picture. Indians pray before gathering plants and food as their food, clothes and lives are linked to the land. When some Indians do not have access to traditional materials on their land, they cannot in effect pray (Ceremonial Conser-vation Practices Rediscovered, 2002).
Indigenous Design: Working with Tribes
Urban design has been described as the process of shaping the physical environment and setting for life, cities, towns and villages. Urban design involves the design of buildings, groups of buildings, spaces and landscapes, establishing the processes that make successful development possible. Urban design is about the expression of a cultural perspective within a defined space and location (Schofield, 2004). The design of a subdivision or community reflects and replicates underlying cultural values of those that live within those communities. This has special signifi-cance with the design and development of tribal trust lands. Tribes are faced with finding their own design solu-tions and setting their own course of action, or risk losing what they have. The continuance of tribes as sovereign nations is at stake when the land base is diminished economically, culturally or environmen-tally.
"In our every deliberation, we must consider the impact of our decisions on the next seven genera-tions." – From the Great Law of the Iroquois Confederacy
The main types of planning currently practiced by Tribes within the United States are Comprehensive Planning, Strategic Planning and Indigenous Plan-ning.
Indian Country: New Tribal Trust Lands andIndigenous Land Planning
By Tracy Mullins, MS, AICP and Marcia Mullins, MNM
12

Reservations are not subject to the requirements of state-mandated comprehensive plans; however, tribes often elect to create comprehensive plans as good neighbors. The comprehensive plan can be an aid in the facilitation of inter-local agreements and intercon-nect agreements for utilities which originate outside the reservation. The substance of a comprehensive plan for a reservation relates the physical design to the social and economic goals of the reservation and is enabled by tribal sovereignty.
A comprehensive plan is implemented through zoning regulations. Standard zoning, as it has been applied to tribal housing in the past, has created suburban style communities that segregate and isolate extended families, which may not meet the requirements of tribal culture. Additionally, standard zoning can cre-ate neighborhood designs that are totally dependent on the automobile. The continued rising incidence of early onset diabetes and childhood obesity among native populations is linked to such land use patterns (Lovasi, Hutson, Gurra, & Neckerman, 2009). Another form of zoning - performance zoning - tends to tailor land to its site characteristics. Performance standards are based on such criteria as carrying capacity, thresh-old of safety and environmental impacts, which often better matches the needs of the tribe. The most im-portant aspect of performance zoning is that it is site specific.
Strategic planning is based on formulating a plan for attaining a tribe’s stated economic development objectives, as opposed to the inventory approach that is utilized in comprehensive planning. Under stra-tegic planning, infrastructure projects are treated as long-term investments and leveraged for the revenues that new development may generate. Revenues are the primary source for capital investment. Strategic plan-ning is the most responsible for linking infrastructure to economic development and capital gain. Strategic planning within the reservation can help identify and stimulate areas for economic development. Strategic planning can create formal and workable policies to create employment possibilities and therefore stimu-late educational motivation and desire to return to the community (Smith, 2000).
Indigenous planning incorporates traditional knowl-edge and cultural identity into the overall planning process. The key to this process is the acknowledgment of an indigenous worldview, which not only serves to unite indigenous planning philosophically but also to distinguish it from neighboring, non-land based com-munities. A worldview is rooted in distinct community traditions that evolved over a successful history of shared experiences (Jojola, 2009).
In Reclaiming Indigenous Planning, author Hirini Ma-tunga states that there are 4 essential components to Indigenous planning, which include:• Theexistenceofagroupofpeople,suchasa tribe, clan or nation linked by ancestry and kinship connections;• Thenotionofanunextractablelinkand association with traditionally proscribed custodial territory that the group claims as theirs, i.e. lands, waters, resources, and environments, irrespective of current title;• Theconceptofanaccumulatedknowledge about the place, environment, resources, and its history, including values for ethics or managing interactions with the place, envi- ronment, or land; • Theexistenceofaculturallydistinctsetof practices and approaches, including ap- proaches to making decisions and applying these to actions and activity agreed by the kinship group or community through vari- ous institutional arrangements (Walker, Jojola, & Natcher, 2013).
Matunga also posits that the five critical aims of indig-enous planning are:
• Improvedenvironmentalqualityand quantity• Politicaleconomyandadvocacy• Socialcohesionandwell-being;• Economicgrowthanddistribution;• Culturalprotectionandenhancement (Ibid.).
Indian Country: New Tribal Trust Lands andIndigenous Land Planning
By Tracy Mullins, MS, AICP and Marcia Mullins, MNM
13

Indigenous planning as a process needs to strive for a balance across the five dimensions. In pursuit of these aims, Indigenous planning also needs to negotiate, discuss, debate, and mediate internally, the difficult terrain between tradition and modernity (Walker, Jojola, & Natcher, 2013). It can, therefore, be seen that Indigenous planning is heavily invested in consen-sus building and community participation approach. Foremost in this to this effort is to adopt a community development process that is informed and driven by the indigenous worldview. Worldviews are endowed with cultural ideals that integrate the past the present and future. Central to worldview are values associ-ated with cultural identity, land tenure and steward-ship that are the hallmark of tribal survival (Jojola, 2007). In order to protect and preserve those unique values and qualities, reservation development must occur in a sensitive manner and consider those values impressed upon the landscape by tribal ancestors. The teachings of tribal elders instructed tribal members to hold the land sacred, because of their belief that it is infused with life-giving spirit. The land provided food, shelter and spiritual comfort. That is why Indians cer-emonially honour the land and their relationship to it (The Marshall Trilogy, 2009).
In the processes of Indigenous design, tribal values need to be translated into practical design elements even before the land is taken into trust through the BIA fee to trust application process. Tribal values as-sist and support the preservation of culturally signifi-cant resources and important landscape elements as well as building the unique identity of lands taken into tribal trust based upon the Tribe’s history and culture. Culture is the way of living developed and transmit-ted by a group of people to subsequent generations, including artifacts, beliefs, ethics, morals and other values, and underlying assumptions that allow people to make sense of selves and their environment (Smith, 2000). In order to protect and preserve the values and qualities of tribal culture, reservation development must occur in a sensitive manner embracing widely symbols and technologies of the historic tribe.
At the same time, Indigenous planning adapts those tools and technologies from the dominant American
culture that support the tribe in a positive manner. In reservation planning, this may manifest itself as land development regulations which enforce a state or tribal building code for home construction but al-lows for cultural accessory buildings such as a chickee (Seminole Tribes), a birch bark sweat lodge (Chippewa Tribes) or teepee (Lakota Tribes) to be constructed outside the regulation of a modern building code. The success of Indigenous planning may lie in taking those cultural technologies from the dominant culture that build the tribe’s capacities and rejecting the technology that do not build tribal capacities. A useful technology for indigenous planning is the Geographic Informa-tion System (GIS) which is used to develop inventories of natural resources and cultural sites on tribal lands and assists tribes to make decisions for locating basic infrastructure like roads, water systems and electrical lines.
The two types of resources available for develop-ment on a reservation are renewable resources and extractive resources. Traditional culture recognizes that renewable resources are to be managed with the understanding that short-term consumption should not occur at the cost of long term sustained use. Resources are to be cared for in order to maintain the continued health of the ecosystem. Resources ranging from salmon to forests to herd animals are considered renewable resources for use today, tomorrow and by the seventh generation (Smith, 2000).
Indigenous planning requires examining the rela-tionships and connections between the Tribe and the dominant culture outside of the reservation. Develop-ment of tribal trust land should reflect a knowledge and understanding of the tribal culture and the in ter-actions with the dominant cultures. The development of tribal utilities such as sewage plants, water systems and power systems in a manner that exercises
Indian Country: New Tribal Trust Lands andIndigenous Land Planning
By Tracy Mullins, MS, AICP and Marcia Mullins, MNM
14

sovereign rights can result pushback from surround-ing local governments. It is important to promote to all stakeholders a greater understanding of the tribal government’s sovereign rights with adjacent local gov-ernment and the importance of underlying cultural heritage to the tribe. Tribal heritage information such traditional place names and the stories behind them (such as the story of Nanabozo, the Sleeping Giant in Thunder Bay, Ontario, Canada) can inform the domi-nant culture of the long term tenure of the Tribe.
Indigenous development recognises the relationships between people and place that reflect social connec-tions with the environment. It is import to recognize and protect sites of significance, connections with neighbouring tribes, and connections with the ecosys-tem. Within tribes, politics is based in family because a tribe consists of several families interconnected by location and marriage. Thus, Indigenous planning considers family relationships because inter-family connections reflect the importance of the social inter-actions between tribal members and the environment.
Modern telecommunications and mass media have removed many people from the interpersonal relation ships which are vital to tribal planning. Indigenous planning efforts depend in part in making social and environmental connections through social gatherings taking place on the land. Indians are a communal peo-ple and value collective participation and membership. Food is a vital component of these social gatherings and traditional “country food” is especially desirable. Participation and membership in the community and its social setting is important to the indigenous design process as a consensus building conduit. Community gatherings recognise common interests and encourage and build community pride, identification and own-ership of the planning process. Design of common spaces like a Pow-Wow arena should encourage com-munity participation and membership and not isolate or segregate Tribal members.
Protection of significant landscape features is of ut-most cultural importance. A central feature of Indig-enous design is to protect the environmental and
cultural features through community ownership and collective responsibility. This can be done through onsite mitigation of storm water, recognition and pro-tection of spiritual and medicinal plants through GIS mapping and conservation programs, restoration of waterways, and community protection through Crime Prevention through Environmental Design (CPTED) principals. The conservation and protection of natural resources is a valuable culturally sustainable manage-ment mechanism. Tribes can enlist Federal govern-ment protection of sacred sites through the use of pro-grams of the Secretary of the Interior, or the National Parks System. Sacred sites may include geological features like waterfalls and mountain peaks and rocks with historic artwork and pictographs. Although all parts of the land are valued, many tribes have sacred sites that are especially important, such as the rock art in Montana’s Valley of the Chiefs, the Black Hills of South Dakota and Pipestone National Monument in Minnesota (Land Important to Spiritual Beliefs, 2009).
Historically, the use of natural resources was governed and regulated through tribal cultural knowledge and traditions based in the wisdom of the elders. Con-servation and protection of the natural environment, promotes community awareness of inherent values contained within the environment. Important natural resources should be identified and protected for cur-rent and future generations. Innovative design solu-tions are possible using tools like GIS to identify and create no-build buffer zones that preserve significant natural assets.
Sustainable management is not only about protection and conservation, but is also concerned with allowing and providing for suitable development, sustainable use, and proper resource management on behalf of tribal members. Sustainable resource management may require the ribe to partner with governments and organizations outside the reservation. Tribal partner-ships which connect ecological corridors across tribal trust lands to maintain wildlife migration or ecological restoration projects can benefit all stakeholders.
While preservation is important, it is also necessary to promote community access to natural resources found
Indian Country: New Tribal Trust Lands andIndigenous Land Planning
By Tracy Mullins, MS, AICP and Marcia Mullins, MNM
15

within the reservation. Providing and encouraging tribal access and sustainable use of nature and physical resources may require educational programs based in traditional teachings of the elders. Removal of invasive species and restoring indigenous plantings can be part of a cultural landscape restoration program. Designat-ing sensitive cultural and environmental sites can be part of the formal plan, as tribes historically prohibited access to certain areas through social discipline. Identi-fied cultural sites of significance should be protected under traditional sanction mechanisms. In Indigenous planning, access to resources is concerned with en-couraging community ownership and responsible management of natural resources found within tribal trust lands (such as picking berries or harvesting fish or game). As sovereign nations, tribes rightfully regu-late uses such as hunting, fishing, raising and gathering on tribal trust lands. Many treaties also provide Ameri-can Indians the right to practice these cultural tradi-tions in all mutual and accustomed places on ceded lands off the reservation as well (The Allotment Era, 2009).
Working Within the Indigenous Planning Process
Urban planners and economic developers representing stakeholders such as private, charitable, and govern-ment sector organizations or under contract to tribes will need to interact as new tribal trust lands pur-chased by the federal government are developed. Early engagement among the entire group of stakeholders can result in more informed decision-making on both sides of the table and result in outcomes which are to the benefit of all participants. For tribal organizations and stakeholders, closer engagement can contribute to:
Building effective working relationships requires trust and willingness to communicate and engage with each other. By adopting a focus on relationships, stakehold-ers are likely to build a better understanding of tribal perspectives and as a result be better informed when they provide advice delivering services that accom-modate tribal aspirations. Effective engagement can produce significant benefits, and requires adequate time energy and resources. Building relationships for effective engagement with tribes requires a shift from issue by issue consultation to long-term strategic engagement which addresses each stakeholder’s goals and aspirations. There may be specific issues or areas of interest to both stakeholders and the tribe for a joint approach will achieve maximum benefits for both par-ties.
In over 20 years of consulting with members of the Chippewa, Potawatomi, Seminole, Menominee, and Cree Tribes, the authors suggest the following ap-proaches when working with Tribes:
First and foremost, it is important to build genuine trust between all parties. It is important to remem-ber that most of the treaties made between tribes and non-Indian peoples have been broken in some form by the non-Indian peoples and their governments. Trust must be earned, and it will take time to estab-lish a truly trusting relationship. Native peoples have struggled to maintain and protect their traditions and cultural wisdom in an ever-changing environment. Exhibiting knowledge and understanding of, as well as respect for, tribal sovereignty is an essential first step in building trust.
Preparation is important, especially when talking with elders. Elders are normally given a high degree of respect, which is lacking within the dominant Ameri-can culture. Anthropologists explain that the term ‘elder’ does not necessarily mean the individual is old or ‘elderly’. Rather, it means that the individual has accumulated a great deal of wisdom about traditions, culture and/or tribal ways of life, and is accordingly treated with respect. The authors know many elders that are far from elderly!
• Agreaterunderstandingofoneanother’s expectations and aspirations• Increasedopportunitiestoestablish Tribal/Private partnerships and inter- local agreements• Improvedprocessesbasedonanunder- standing of one another’s priorities, expec- tations and available resources to create sustainable use of tribal resources.
Indian Country: New Tribal Trust Lands andIndigenous Land Planning
By Tracy Mullins, MS, AICP and Marcia Mullins, MNM
16

Indian Country: New Tribal Trust Lands andIndigenous Land Planning
All tribes have different customs, so it pays to do your homework before a meeting and check with an el-der or spiritual leader for the proper local custom or procedure. For example, tribal protocol may require offering a gift of tobacco or food when meeting with an elder for the first time. Likewise, if you are offered a gift or food, accept them graciously and respectfully without becoming overly aggressive.
When scheduling meetings, it is good to allow tribal representatives to suggest the meeting locations and times. While informal discussions may be conducted in the more relaxed and comfortable environment of a tribal member’s home, formal negotiations are often held in tribal offices, on sovereign tribal trust land.
It may not be necessary or possible to meet with all members of the tribal council, but don’t be surprised if this is requested.Council members can provide vital information on legal and intergovernmental issues and relationships. They can often provide insight into traditional cul-ture and may be closely in tune with areas of fric-tion between tribal values and the values inherent in development plans (Smith, 2000). And do not assume that the men are making decisions, as some tribes are matriarchal.
Research your questions carefully within the context of tribal history. A good practice is to send an email in advance of your meeting, outlining any input that may be needed at the meeting. This helps to build trust by eliminating potential surprises and allowing tribal members to speak with elders and other stakeholders beforehand.
Listen carefully and sensitively to whomever is speak-ing, try to say as little as possible, and remember that you are a guest in Indian Country. Be patient in your speech pattern and do not interrupt. Learning to wait silently during pauses in the conversation is a reward-ing skill, for it denotes respect and allows your speaker to talk in more detail and depth. Respect the sovereign nature of any negotiations, and never forget that when in Indian Country, their customs trump yours.
ConclusionThe recently announced purchase and subsequent transfer of ten million acres of land into tribal trust has potential to provide myriad opportunities for urban planners to learn and embrace Indigenous Planning techniques. Understanding the unique legal position of tribes in relation to the U.S. federal gov-ernment, in concert with appreciating the cultural richness of tribal traditions, provide a starting point for developing working relationships with local tribes. Many assets and resources are available for urban planners and economic developers involved in tribal planning and development. The authors encourage planners to embrace the new opportunities that may result from the upcoming land purchase/exchange, partnering with tribal entities to understand and en-courage Indigenous Planning.
About the WritersTracy Mullins AICP is an internationally experienced urban planner ,and urban designer who consults in community redevelopment, tribal planning, tourism development, marketing and geographic business intelligence. Marcia Mullins, MNM is an experienced consultant, trainer and nonprofit leader working in the areas of governance, strategic planning, collaborative pro-gramming, and outcomes management. In the last five years she provided technical assistance and training to over 100 nonprofits with varying levels of size, sophis-tication and funding levels. She has also worked with several Native American tribes in the Midwest and honors the traditions of black ash basketry, as taught to her by a Menominee elder.An advocate of nonprofit engagement at the commu-nity planning level, Marcia helps organizations main-tain a laser focus on their target population so they can expand collaborative efforts to improve their com-munity. She has co-facilitated numerous community planning charrettes with her husband Tracy Mullins, actively encouraging local nonprofits to attend and en-gage. Marcia holds a Master of Nonprofit Management from the University of Central Florida.
By Tracy Mullins, MS, AICP and Marcia Mullins, MNM
17

The January 2013 edition of Urban Planning and Economic Development News Magazine invited urban planners to explore the potential of U.S. and interna-tional sister city relationships. Sister city initiatives, born post-World War II to breed deeper intercultural understanding, are theoretically developed “to ad-vance peace and prosperity through cultural, edu-cational, humanitarian, and economic development efforts.” [1]
An official and proclaimed “friendship” between two cities or states is only phase one of several possible phases of mutual relationship benefit. According to a study of Eurocities over the decades, sister cities can reach their maximum potential across three phases of development: friendship building, a phase of under-standing each other’s cultures; reciprocating, which comes with the opportunity to offer assets such as assistance, training, and best practices; and concrete economic improvement, such as initiatives that bring an area revenue or cost savings. [2] Don Bultman, cur-rent president of Michigan’s Grand Rapids Sister Cities organization, comments that “the second and third take more time, networking, and finances in order to succeed.”
The Great Lakes area of the United States stands out as a region for further study of the possibilities that long-term sister city or state relationships can yield. For example, the State of Michigan and Shiga Prefec-ture in Japan initiated their sister state relationship in 1968, and according to the Japan Center for Michigan Universities (JCMU) it is one of the most active sister state relationships in existence. [3]
Apart from the formation of sister city or sister state relationships, it’s notable that this area of the United States – and in fact, the entire 12-state Midwest region – has attracted corporate Japanese investment over the last 45 years. According to the Consulate General of Japan (CGJ) in Detroit, “The 1970s marked the first phase of major Japanese investment in Michigan and
Ohio. This long-term commitment of capital and hu-man resources continues today. Drawn by the region's massive automotive presence, hundreds of Japanese companies have chosen to locate and expand their operations here. These companies benefit from Michi-gan and Ohio's dynamic economies, high-ranking educational institutions, affordable costs of living, abundance of convenient workplaces, and attractive residential communities. In turn, Japanese companies boost the state economies through job creation, capital investment, and tax contributions. Many of these Japa-nese companies also make significant philanthropic contributions to their local communities and strive for model corporate citizenship.” [4]
There is not a 100% direct relationship between Japanese investment in the Great Lakes area and an upspring of sister city relationships in the same area. However, the proliferation of Japanese-based busi-nesses, technologies, residents, and communities has increased local citizen exposure to and awareness of the Japanese culture over the last several decades. The CGJ notes that “Japan has become a pre-eminent foreign investor… in fact, according to the Consulate General of Japan’s Direct Investment Survey of 2012, there are 904 Japanese facilities in Michigan and Ohio. These facilities provide nearly 100,000 jobs, over half of which are direct manufacturing positions.” [4] An-drew Conti, CGJ representative, says, “There is some evidence of corporate investment or activity leading to the pursuit of sister city tie-ups.”
One clear example of such a relationship is Midland, MI and Handa, Japan. This sister city relationship began when the Dow Chemical Company in Midland expressed interest in establishing a plant in the city of Handa. The mayor of Handa at that time visited Mid-land to discover what kind of neighbor Dow would be to his community, which led to the official establish-ment of the Midland-Handa sister city relationshipin 1981. Handa did become home to Dow’s Kuna Ura manufacturing facility. The two cities have demon-
By Diane FrommeU.S. and Japanese Cultural Ties Show Reciprocityand the Promise of Economic Development
By Diane Fromme
18

strated friendships by hosting student exchanges and goodwill delegation visits. On a more tangible level, Handa delegates constructed a Japanese garden in Midland, and Midland reciprocated by sending Handa a sculpture conveying the meaning of family. [5] Regardless of corporate influence, Michigan alone boasts 27 sister city relationships. [6] Some of these relationships and at least one sister state relationship with Ohio have deepened to yield further examples of reciprocity, with foreshadowing of possible economic improvements. For example, in 2007 the first JW Mar-riott in the U.S. Midwest, located in Grand Rapids, MI, unveiled a sister city theme throughout the hotel. The story below explains how, through photographs and plaques, the JW Marriott’s hallways and rooms fea-ture the art and culture of the five Grand Rapids sister cities including its original sister city, Omihachiman, Japan. As another example of reciprocity, many cities have developed ongoing internship programs or work-study programs where students and citizens travel to the sister city and country to observe and learn the culture and new training techniques or best practices. More detail about such programs are provided herein, specifically with regard to the State of Ohio and its sister state prefecture of Saitama, Japan, as well as the Michigan-Shiga sister state relationship, and the sister city bond between Lansing, MI and the city of Otsu in Japan’s Shiga Prefecture.
The JW Marriott Brings the World to Grand Rapids, Michigan
A world map in the Grand Rapids JW Marriott denotes the locations of Grand Rapids and each of her sister cities: Omihachiman, Japan; Bielsko Biala, Poland; Perugia, Italy; Ga District of Ghana; and Zapopan, Mexico.
Independent of sister city relationships, the city of Grand Rapids experienced an urban development boom in the mid-1990s. New infrastructure sprang up including a convention center, three museums, and the “Medical Mile” of healthcare and medical research facilities. The Grand Rapids addition of the first JW Marriott in the Midwest was a pioneering strategy that piggybacked on this development.
The vision, however, to include the culture and art of Grand Rapids’ five sister cities within the hotel can be claimed by one man who is still heavily involved with the hotel's management. George Aquino, now the General Manager of the Grand Rapids JW Marriott, explains how the vision struck him. “We knew that the first JW in the Midwest was going to be a special project that deserved a theme that em-bodies the culture of the city,” says Aquino. “As the JW was going to be the center focal point of the skyline of Grand Rapids, we started brainstorming on a global theme around 2005.”
Aquino, who resides in a town neighboring Grand Rapids, was driving home one evening and took special notice of a sign he had seen a thousand times on the outskirts of the city. “The sign had the flags of the Grand Rapids sister cities,” says Aquino. “I ap-proached the hotel owners with the idea of using the sister cities theme to ‘bring the world to Grand Rap-ids’ as opposed to Grand Rapids always reaching out to the world.” The rest is Midwestern history. The JW owners loved the idea given that a lot of major companies in Grand Rapids have presence abroad. Aquino reached out to the mayor and to the Grand Rapids Sister Cities orga-
Phot
o by
Car
rie S
mith
-Hol
ehou
se
U.S. and Japanese Cultural Ties Show Reciprocityand the Promise of Economic Development
By Diane Fromme
19

connections to each of the five cities: Omihachiman, Japan (relationship established in 1986); Bielsko Biala, Poland (1991); Perugia, Italy (1993); Ga District of Ghana (1994); and Zapopan, Mexico (2008).
Lake Biwa, located in Japan’s Shiga Prefecture, is Japan’s largest freshwa-ter lake. Lake Superior, the United States’ largest freshwater lake, borders Shiga’s sister state of Michigan, thus presenting economic development opportunities for the sister states in the fields of freshwater treatment and stewardship.http://en.wikipedia.org/wiki/Lake_Biwa
“The building of the JW Marriott was a wonderful opportunity in exposing more people to our sister cit-ies,” says Don Bultman, president of the Grand Rapids Sister Cities organization. The JW commissioned photographer Dan Watts to spend three weeks photographing in each city, yielding more than 16,000 cultural photographs. The result is a hotel with entire floors dedicated to the décor of one of the sister cities. The floors alternate in succession through the five cities, repeating the pattern all the way to the top floor.
Each guest room at the JW Marriott hotel in Grand Rapids, MI is deco-rated with photographs of one of Grand Rapids’ sister cities. This guest room features Grand Rapids’ first sister city, Omihachiman, Japan.
Phot
o by
Car
rie S
mith
-Hol
ehou
se
“The JW themed our guest rooms, suites, meeting rooms, garage parking levels, key packets, and public art in the hotel to the sister cities theme,” says Aquino. “Waking up to magnificent photographs of another country and seeing them around the hotel makes Grand Rapids feel like a global city.” In the spirit of reciprocity, the JW has hosted dignitar-ies from each of the five sister cities. “It truly impresses them to see their city or country on display inside the hotel,” says Aquino. “The dignitaries specifically ask to stay in their respective country suites.”
Sister Cities International (SCI) also recognized the import of incorporating a sister cities theme into a commercial building. Aquino was invited to SCI’s 50th National Convention in Washington, DC in 2006 to present this idea to 2,000 international attendees. He observes, “There isn’t really a project like this in the world that has embraced the theme to the extent we envisioned it.” Aquino mentioned that the hotel would like to host the SCI convention to showcase the idea that “bringing everyone together from all parts of the world makes our earth a much better place.”
Sister Cities Reciprocate through Personal Exchange
Phase two of sister city or state development manifests in reciprocity – the opportunity to offer or exchange assistance, training, and best practices. [2] Many sister relationships reciprocate through some form of aca-
U.S. and Japanese Cultural Ties Show Reciprocityand the Promise of Economic Development
By Diane Fromme
20

demic exchange that spills over into intellectual and cultural sharing.
For example, the Michigan-Shiga sister state relation-ship, born in 1968, notably expanded in 1988 when the governors of both areas signed an agreement to create JCMU. Fifteen state-supported universities in Michi-gan formed a consortium “for the express purpose of operating JCMU and its academic programs.” [3] Mul-tiple exchange agreements with Japanese universities (University of Shiga Prefecture, Shiga University, and Shiga University of Medical Sciences) permit JCMU students and students from those Japanese universi-ties to take each other’s courses and participate in each other’s social and cultural activities. [3]
The relationship between the State of Ohio and Saita-ma Prefecture (a neighboring prefecture of Tokyo, Japan) has been developing since 1985, when former Governor Hata visited the Honda of America (HAM) plant in Marysville, OH. [6] May 1990 marked the signing date of the Ohio Saitama Friendship Agree-ment, and in 1990 the Institute for Japanese Studies (IJS) at Ohio State University established the Ohio Saitama English Teaching (OSET) Program. The OSET Program was one of three educational exchange pro-grams established between the sister states: teaching opportunities, student opportunities, and internship opportunities. (NOTE: Verify with IJS). In July 1990, seven Ohio participants traveled to Saitama for the first one- to three-year English teaching assignment, a tradition and program that continued until 2006. [8]
Another thriving educational program is Ohio-Saita-ma’s Internship Program. Each year IJS facilitates the selection of students from Ohio schools for the Ohio-Saitama Company Internship Program (OSCI) which provides 5-week summer internships in Saitama Pre-fecture. Overseas, the Saitama-Ohio Company Intern-ship Program (SOCI) places individuals from Saitama Prefecture so they can learn about Ohio businesses. [9]
Saitama Prefecture is located in the Kanto region of the island of Honshu, Japan. http://en.wikipedia.org/wiki/Saitama_Prefecture
Lansing, MI and Otsu, Shiga Prefecture have a sister city relationship that dates back to 1969. Lansing Community College's (LCC’s) friendship with Japan began 30 years ago when LCC’s first president, Dr. Philip Gannon, organized a goodwill mission to Japan. It later became known as the Japan Adventure, and for 25 years the work-study program gave more than 500 LCC students a front-row seat to observe Japanese heritage. The program was suspended for 4 years but was then renewed in 2011. Students who participate in the program have the opportunity to study the Japanese language and business practices. In addition, LCC students take the opportunity to work aboard the Michigan Boat on Lake Biwa, Japan’s largest freshwater lake, where they are able to greet Japanese tourists who ride the boat to experience American culture. [10]
Mangetsuji in Otsu, Shiga prefecture, Japan. Ōtsu is the capital city of Shiga Perfecture. |Source=[[:ja:user:663highland|663highlan, http://commons.wikimedia.org/wiki/File:Mangetsuji_Otsu_Shiga02n4500.jpg
U.S. and Japanese Cultural Ties Show Reciprocityand the Promise of Economic Development
By Diane Fromme
21

Kamezaki low tide cultural festival, Kamezaki Handa Japan; Tawashi2006. Handa is a city which is located in the Chita District, Aichi Prefecture, Japan. http://en.wikipedia.org/wiki/Handa,_Aichi
The Future of Sister Relationships Suggests Economic Development
Concrete economic improvement includes initia-tives that ultimately bring an area either revenue or cost savings. [2] CGJ representative Conti recognizes several cross-cultural activities that hold potential to grow regional economies in both Japan and the U.S. One such initiative occurred when officials from Oak-land County, MI visited Japan on a trade mission in April, 2013. One of those individuals was Amy Butler, Executive Director of OU INC, an Oakland Univer-sity business accelerator and clean energy research center under the University’s School of Engineering & Computer Science. On her visit, Butler educated both businesses and universities about the role of a business accelerator and how OU INC could help support and advance Japanese partnerships.
“As an accelerator, we focus on information technol-ogy, automotive, energy, and medical device start-up and growth stage businesses,” says Butler. “We also work on technology transfer from the university, and serve as a nexus between the university and the busi-ness community.” Butler shared the technology sup-port, talent development, and ongoing talent support that, as Butler states, “OU INC can provide to Japanese businesses locating in Oakland County.” On the aca-demic side, Butler met with four universities “to ex-change information and explore educational, research, and internship opportunities from both countries.” Of course, Butler included the JCMU universities, and she met with two JCMU students to learn about those universities’ experiences. Another part of this visit included Ritsumeikan University – which shares OU’s alignment towards renewable energy and technology transfer -- in Kyoto, Japan.
Meanwhile, other Oakland County officials visited 40 Japanese businesses in ten days, targeting companies that have located or will locate in Oakland County. “We visited to inform them of the changes that had been occurring in Michigan, including tax reform making Michigan the seventh most competitive state
in the nation, along with Michigan’s new designa-tion as a ‘Right-to-Work’ state – no longer making it a law to join a union,” says Irene Spanos, Director of Economic Development and Community Affairs for Oakland County. “For economic development, our results are many…we invited several medical device companies to attend our [upcoming] Medical Device Conference,” says Spanos. “We also continue to help their U.S. divisions here in Oakland County access re-sources for their operations.” These resources include workforce recruitment, training, and introductions to potential partners and customers.
Another compelling economic opportunity is born out of recognition that both Michigan and Shiga Prefec-ture are home to their respective countries’ largest freshwater lakes. Political officials have discussed the concept that more could be done to conduct joint research, investments, or business in the field of fresh-water treatment and stewardship. [10] This concept is quite similar to the potential that lays between the maritime sister cities of Rotterdam, Netherlands and Baltimore, MD who could share best practices with regard to their port city, estuarine locations and char-acteristics. The commonality of these ecological quali-ties in both sets of relationships could lead beyond best practices to some brilliant cost-savings operations.
U.S. and Japanese Cultural Ties Show Reciprocityand the Promise of Economic Development
By Diane Fromme
22

While Conti states that there has been “no tangible progress yet” in any of these arenas, the door of op-portunity remains open to those who study and fund urban planning and economic development. Finan-cial benefit from sister city relationships is a desirable concept to all political leaders involved. [10] With the right combination of time and resources, sister city and sister state relationships could take the leap into phase three of their development.
Footnotes:[1] http://www.sister-cities.org/about-sister-cities-international [2] http://www.academia.edu/1321335/Eurocities_and_Their_Sisters_How_They_Are_Close_to_Each_Other [3] http://www.jcmu.isp.msu.edu[4] http://www.detroit.us.emb-japan.go.jp/en/bilateral/economic.htm[5] http://www.midland-mi.org/sistercity/ [6] “Michigan-Japan Sister Cities,” report, Consulate General of Japan in Detroit, 2012 [7] http://japan.osu.edu/events/2010/Ohio_Saitama_History.pdf[8] Japan.osu.edu/Fellowships/winder_deadlines/OSET.html[9] http://easc.osu.edu/ijs-internship-programs[10] Question and Answer with Andrew Conti, CGJ representa-tive, July 1, 2013.
Diane Fromme is a freelance writer based in Northern Colorado. She is also an award-winning blogger and an international student exchange coordinator for Council for Educational Travel, USA. She frequently writes about the ways in which intercultural and fam-ily dynamics affect the quality of our lives. Her recent articles include “Sister Cities Strive for Intercultural Best Practices” (Urban Planning and Economic Devel-opment News Magazine, January 2013) and “My Inher-itance Journey,” (enneagram monthly, October 2012). You can access excerpts of Diane’s work and link to her parenting blog through www.dianefromme.com.
About the Writer
Sister Cities Colorado. Dushanbe, Takikistan gave the gift of a teahouse to their sisters in Boulder in 1990. http://en.wikipedia.org/wiki/List_of_sister_cities_in_Colorado
U.S. and Japanese Cultural Ties Show Reciprocityand the Promise of Economic Development
By Diane Fromme
23

Choices of a World-Class CityBy Nidhi Batra
"Here we stand in Delhi city, symbol of old India and the new. It is not the narrow lanes and houses of old Delhi nor the wide spaces and rather pretentious buildings of New Delhi that count, but the spirit of this ancient city. Delhi has been an epitome of India's history with its succession of glory and disaster and with its great capacity to absorb many cultures and yet remain itself. It is a gem with many facets, some bright and some darkened by age, presenting the course of 'India's life and thought during the ages.
We face the good and the bad of India in Delhi city which has been the grave of many empires and the nursery of a republic. What a tremendous story of hers! Here the tradition of millennia of our history surrounds us at every step, and the procession of innumerable generations passes by before our eyes"
Prime Minister Jawaharlal Nehrufrom Convocation Address of Delhi University
December, 1958
Recently I had an opportunity to participate in two en-gaging dialogues in the same evening, causing enough churning of thoughts for one day. One, a presentation by Patricia Clarke Annez on her paper- Ahmedabad – Building a Livable City for all and the second, ‘Dreams and Planning’ delivered by architect and urban and regional planner Prof. Edgar F. N. Ribeiro, and Prof. A. G. Krishna Menon as the discussant.
Patricia shared her study that evolved from the Slum Networking Programme of the 90s in Ahmedabad. Her key hypothesis was there is no ‘choice’ but to offer a decent dignified place to live for all – including slum dwellers. This implies that to grant the slum dwell-ers the dignity of life, which they have a right to, it is essential to invest in these slums- irrespective and independent of central sponsored schemes. Invest-ment in these slums that is required is basic neighbor-hood infrastructure. Cities cannot ‘wait’ for providing ‘housing for all’. In all practical terms, development will always race over the supply. Therefore, slums tend to be the hard reality of all developing economies. She cited a case example of SNP in Ahmedabad which was able to upgrade few of its slums, where even com-munity contributed 10% of the total amount towards this upgradation. This programme has now come to a halt due to the strong luring forces of mission schemes such as JnNURM and Rajiv Awas Yojana (RAY).
The second discussion was about Dreams and Plan-ning, the dream of a planner/ political leader/ bureau-crat/ artist/ a visionary all translated into a ‘planning’ document. Prof Ribeiro took us down to the memory lane of ‘Planning of Delhi’- the Master Plan of 1962. The vision of Mr. Nehru and Ford Foundation trans-lated into first ‘Land Use Plan’ of India.
Prof Menon, critiqued this process of dreaming – given the constraints and the context that Indian cities are subjected to, shouldn’t there be an ‘Indian way of dreaming’, rather than translating an idea of a Parisian / European city down on the geography of an Indian City. A country which is predominantly ‘poor’, a country which has ‘archaic democracy’, a country which is glorified by its heterogeneity, a country where community is known to be ‘argumentative’ and where consensus is not a black and white reality– needs its own ‘Mechanism of Dreaming’.
Delhi is now in its 10nth Dream- A dream of a ‘World Class City’. Delhi has been reincarnated at a new loca-tion every time a new ruler has crowned this city as its capital! From The oldest city near the site of the Qutab Minar, to Siri, Tughlqabad, Jahanpanah, Firozobad, The city around Purana Qila, Shahjahanabad, Lutyens-New Delhi and the Master Plan-1962 – All chose a tabula rasa approach, as if Delhi was a virgin land, and
24

to isolate the new capital from rest of the neglected/abandoned in some case cities of Delhi was the natural choice.
Delhi implemented conditions through the tool of Modern planning to isolate many historic layers in the development of Delhi. Lutyen’s Delhi devel-oped a distinct divide between the imperial city and the old Delhi, his organization principle of freezing monuments within the green and creating a green belt around the imperial Delhi such as the monuments of Lodhi, enclosed in the green and called as observatory by Lutyens are examples of this isolation.
Choices of a World-Class City
Figure 1: intentional isolation of Shahjahanabad during construc-tion of British Imperial Delhi
The thrust of Delhi’s Master Plan (DMP) 1962 was to develop Delhi on the lines of ‘modernism' and hence it negated various layers of development and the vast historic context of prior eras, and declared those his-toric layers as slums, because of incompetence in deal-ing with them. Delhi got divided into three levels, the old Delhi, which got designated as a slum, the imperial Delhi, and the rest- where most of the new develop-ment is undertaken by the government. This kind of fragmentation at the city level did not consider
all the seven cities of Delhi and the urban villages got engrossed into the city as Lal Dora areas and were left to fate with no clear regulations and control.
DMP- 2001, failed to define ‘urban Heritage’. It des-ignated two areas of Shahjahanabad and Karol Bagh as special areas, and the whole approach towards the recognition of these areas as special areas, was based on chaos and mixed use instead of historic consid-erations. Certain other areas within Delhi like Sri, Tughlakabad which are of equal heritage importance were ignored as an important development layer in the process of growth of the city.
With respect to environmental resources, DMP-2021 merely states that the Ridge shall continue to be desig-nated as a Regional Park, but only until the delineation of the exact boundary by the Forest Department. The riverbed, on the other hand, is officially designated for water harvesting, although Zone O converts almost 10,000 hectares in the riverbed to commercial, recre-ational, and residential uses. And the green belt has been done away with completely. Indications of what is likely to happen to the Ridge and the Yamuna are already on view, with 20 official violations in the for-mer and 30 in the latter. The recent disputes over the Malls under construction on the Vasant Kunj section of the Southern Ridge and the Commonwealth Games Village near the Akshardham Mandir on the Yamuna, illustrate the neglect of these layers due to our inad-equate planning systems.
The 10nth Delhi- the World Class Delhi supports these new landmark icons. When in 2003, the Ridge Bachao Andolan submitted a petition to the Supreme Court of India challenging the construction of India’s larg-est shopping mall complex for being built on Delhi’s southern ridge, a protected green space, in the up mar-ket South Delhi colony, DDA defended the project in court for being ‘planned’ and thus legal because of the involvement of professional builders, its high-quality construction and its strategic function in boosting Delhi’s architectural profile – forming a ‘world class’ commercial complex!
By Nidhi Batra
25

Choices of a World-Class City
Figure 2: Vasant Kunj malls at Delhi Southern RidgePhoto courtesy http://forum.skyscraperpage.com
During the course of the mall proceedings in the Court, an adjacent multi-generation slum settlement was declared ‘unplanned’ and illegal – brought a ‘nuisance’ to the neighboring middle class and orders were set for its demolition.
So what is this dreamof a world class city?
• Avision‘to dispel most visitors’ first impres- sion that India is a country soaked in poverty’ (Ramesh 2008)• Avisionof‘Clean Delhi, Green Delhi’
And this can only be achieved through iconic world class imagery of ‘modern’ infrastructural develop-ments. Delhi Metro, more than 25 flyovers, toll roads, satellite cities, commonwealth Games Village, Shop-ping malls and commercial complexes and most of this in the ‘under-utilized’ public land occupied by slum dwellers into commercially exploitable private property.
The world class city therefore contests between the
binary terms of beauti-ful. Ugly, visible/invis-ible, legal/illegal – an aesthetics of world class city, which most often is neither inclusive nor sustainable.
ronically, the city’s world class appearance is now
increasingly being expressed through an environmen-tal discourse of cleanliness and pollution – in return establish a legal category of ‘nuisance’ and demolish-ing a slum for its nuisance causing activities like open defecation or unhygienic living condition that do not fall in place with this ‘image’ of the world class city of the bourgeois middle class mind. RWAs with NIMBY attitude (Not in my backyard) call and file petition or removal of slums, but no one talks of removing this whole gamut of exclusive gated developments. On one hand where Rajiv Awas Yojana is initiated for making a ‘slum free India’, on April 20th 2012, officials from DDA, along with a huge deployment of policeman, began the process of demolition in Gayatri Colony, near Baljeet Nagar (Anand Parbat industrial area). Can slums really exist in this ‘World Class City’ of ours then?
The middle class with its obsession of ‘cleanliness’,
By Nidhi Batra
26

however quickly forgets the great blow to the environ-ment done through the ‘planned’ world class quality malls. In yet another example of the same in the NCR- Bani Forest will be home to mega tourism projects soon. Entertainment parks, like Gurgaon’s Kingdom of Dreams, could replace this stretch of the Aravalis, which serves not only as a wildlife corridor but also as a groundwater recharge zone for the NCR.
Land records reveal that property sales in the region have tripled from 42 deals between September-No-vember 2011 to 164 between November 2011-March 2012. This coincides with the period when the Mangar Draft Development Plan 2031 was being cleared at various stages. Although it restricts people from build-ing farmhouses, industries and hotels, it opens up the area for mega tourism projects and colleges .
Choices of a World-Class City
Is this the making of a world-class city?
How should we then justify our dream of a world class city? Does a world class city really mean choosing be-tween a pastiche of icons or does it really mean inclu-siveness where there is ‘right to dignity’ being offered to each and every citizen!
I believe that one doesn’t have any choice here; we have to give the poor the right that they deserve. We cannot wait for centrally sponsored schemes like Rajiv Awas Yojana to make a ‘slum free India’, which might just be another disguise to ‘get rid’ of these, marginal-ized poor rather than to cater to an inclusive society.
In our cities where tenure problems shall take years to resolve, where the debate on central /state/private land prolongs, a growth rate that will always supersede the infrastructure supply, governance which lacks ac-countability and transparency –We have to protect the right of the poor/ we have to protect the right of the environment/ we have to demand an inclusive qual-ity of life. It is not about reaching the perfection – it is really about providing good livable conditions for all - ‘People can find perfect, when they get the good!’
About the Writer
1Delhi Master Plan 2021: What is to be done?, Hazard Centre, 2007 2Delhi will go dry as you get taken for a ride- Janani Ganesan
Nidhi Batra is a practicing Architect and Urban \De-signer from Delhi. She is an Urban Design Consultant with The World Bank and Participatory Research in Asia (PRIA) . She is also the editor for The Urban Vision, a think-do tank.
By Nidhi Batra
27

Urban Codes and City PlanningOr the disagreement between theory and practice
By Guillermo Tella, PhD
Now days, the city is going through processes as much controversial as it is important. Urban cosmetic surgery will let it display certain elegant profiles, but this treatment does not consider some very impor-tant problems. The city has undergoing great change and, at the same time, one of the deepest transforma-tions it has ever experienced. These changes and transformations are creating questions about how cities are redeveloping.
Which role do technicians, urban planners, professional and neighboring associations perform?
Aim at the experts
- Do urban people know what kind of city they want for themselves? And, taking this into account, have they been sufficiently consulted? Is there true agreement about such projects?
- What role do technicians, urban planners, professional and neighbouring associations perform?
- Is it possible that, with the works already set in motion, there are still no suggestions about the need to set a master plan for the city?
Phot
o co
urte
sy G
uille
rmo
Tella
28

Urban Codes and City PlanningOr the disagreement between theory and practice
By Guillermo Tella, PhD
An integral project
A disagreement between theory and practice sets up a legal vacuum that reaches its peak in the consolidation of a “parallel code”. As a normal abnormality, urban legislation has not yet created an important set of new practices in the city. These are practices already incor-porated into the urban life but are not contemplated by the present legislation in force.Would it not be necessary to stop the ball rolling, in order to reach an open consensus as to what is the project of city that the inhabitants of the city want, a project in which they take part and contribute towards the different institutional aspects, and only then codify it?That is to say: we should first define what and then go into how. Then, to reflect deeply on which should be the rules that will enable the putting into practice of an integral project of the city more quickly.
Buenos Aires has been undergoing one of the deepest transformations it has ever experienced.
Phot
o co
urte
sy G
uille
rmo
Tella
29

Urban Codes and City PlanningOr the disagreement between theory and practice
By Guillermo Tella, PhD
New practices have been incorporated into urban life but these are not contemplated by the present legislation in force.
“Codes” vs. the CodeIn this way, we ought to consider the always criticized division into zones; but from a criterion which stems from the protection of the intrinsic qualities of each zone—their stylistic character, services provided by the available infrastructures, daily usages and cus-toms—and not from the convenience of successful real estate enterprises with no risks and impact evaluation.
The presence of “codes” -urban practices- which tend to be used as part of the Code -urban laws- is obvi-ously the most genuine expression of complex urban sceneries in conflict. Ignoring them will cause a dete-rioration of the city as cultural patrimony and, at the same time, as a daily life support system.
A disagreement between theory and practice sets up a legal vacuum that reaches its peak in the consolidation of a “parallel code”]
Guillermo Te is an Architect and Philosophy Doctor (PhD) in Urban Planning. In addition, he has devel-oped the Postdoctoral Program in Social Sciences and Humanities. He has been Professor and Researcher in Urban Planning since 1989. Moreover, since 2005 he carries out academic activities in the Institute of the Conurbation in the University of General Sarmiento (Argentina). In his professional experience, he takes part and coordinates the development of strategic plans and of urban ordinance and local development for public as well as for socio-urban and environ-mental consulting firms. As a result of this theoretical production and professional practice, he has published numerous sciences and outreach works on the pro-cesses and effects of the metropolitan trans-formation.
About the Writer
Phot
o co
urte
sy G
uille
rmo
Tella
Phot
o co
urte
sy G
uille
rmo
Tella
30

Four Year Dry Spell: China in 2010-2013 By Yekaterina Dobritskaya, PhD
The area of China is about 9 596 960 km 2. Ranked 3rd in the list of countries by area, the Middle Kingdom holds the population 1.35 billion people (one fifth of the world’s population) in 2013. During last quarter of century China economy has been growing at average annual rate of 8%. As a reaction, the country trans-formed into a major player in global economy. But at a steep price.
Chinese city Linfen of Shanxi province followed by Tianying, Anhui province, heads Time’s 2013 List of the World’s Most Polluted Places [1]. The main air pollutant is coal; lead and other heavy metals. As were reported, 70% of the water flows through urban areas is unsafe.
Due to economic rapid growing and overpopulation China bears a strong relation to climate change and greenhouse effect. China is world largest coal produc-er and consumer (70% of primary energy consump-tion) and also largest fossil fuels consumer. The high consumption gives rise to environmental degradation due to low pollution (especially dust and SO2) and energy utilization control.Accept of public health deterioration, the dark sides of rapid economic development are the next:
1. Lingering droughts. Four-year long (2010 – 2013) drought in Yangtze River Basin and Yunnan province (southwest of China) brought about lots of talks about China contribution into green gas emissions on our planet.
2. Increasing of temperature and precipitation extremes. Langing droughts are followed by storms and flooding causing human and large economic loss, like in 1998 and 2013.
3. Expanding desert. Now deserts cover one fourth of China area with annual advancing rate of 1 300 sq. miles. World fifth large the Gobi desert covering large part of China is continually expanding.
Lingering Drought: facts
In September of 2009 severe drought hit usually lush Yunnan province in the southwest of China. As the president of Yunnan Agricultural University Zhu Youyong told Nature journal, he had never been seen such severe drought for his 54 years life [2].
2010 drought in southwestern China hit several China province like Yunnan, Guizhou, Guanxi, Henan, Shanxi, Hebei, Gansu, and Chongqing area. During the winter of 2009-2010, the temperature in southwest region was 2 °C warmer – and the precipitation was 60% less – than normal.
As Ministry of Civil Affairs reported, 51 million of China people were short of water. A lot of wells in Yunnan province were dry, and 18% of inhabitants - more than 8 million people – faced drinking water shortage. Over 250 000 inhabitants of Inner Mongolia’s Chifeng was also suffering from drinking water short-age. Reservoirs of the city contained more than 70% less water than normal and water volume in major river of the region was reduced by near 80%.
The world largest grain producer and consumer also hit grain shortage. When more than 900 000 ha of crops in Guizhou province were affected by drought, and more than 3 600 rivers and brooks were dry, 8
Phot
o by
Yek
ater
ina
Dob
ritsk
aya
31

million inhabitants of Guizhou were affected by the shortage. In May, 2010 was recorded that crops of worth USD 2.5-billion were expected to fail in Yunnan province. One month later near 5 million ha of China land were suffering from drought.
Economic damage to agriculture and failed electricity generation of China 2010 drought amounted to $3.5 billion USD at least.
A lack of precipitation since October of 2010 caused the hard drought on the North China Plain the next year. On December 6, the Office of State Flood Con-trol and Drought Relief Headquarters reported about serious drought affected Shandong, Henan, and parts of Shanxi, Hebei, Anhui and Jiangsu provinces. About 75% of winter wheat crop traditionally planted in this area [3].
Four-Year-Dry Spell: China in 2010-2013 By Yekaterina Dobritskaya, PhD
By February of 2011, more than 7.7 million ha of winter crops, were affected by drought was called the worst in 50 years. Precipitation were at lowest level in 50 years (about 10% of the normal) in Henan in No-vember and December, and most part of North China Plain was not receiving any precipitation in December and January.
Total Precipitation on the North China Plain
Source: USDA/OCE - Date range is 1983/84 through 2010/11 [3]
By the end of May, a number of people facing shortage of drinking water amounted to more than 4 million. Direct economic damage from the drought reached near USD 2.5 billion.
In the fall of 2011 - spring of 2012 large territory of China once again was affected by serious drought concentrating in Yunnan. As Reuters cited the Xinhua agency in April of 2012, 7.8 million people and 4.6 mil-lion livestock suffered from drinking water shortage in affected provinces like Yunnan, Hebei, Shanxi and Gansu. Reservoirs and threatens spring planting was near completely dried up [4].
According o IB Times, “farmers have had to switch to more resistant crops, but this has not alleviated many of the problems created by the drought. Families in some regions must turn to transporting water from more than 10 kilometers (6 miles) away”. The losses of agricultural industry had reached approximately USD 317 million by April [5].
By the last decade of June 5.17 million ha of planted land in Henan, Anhui, Shandong and Inner Mongolia was affected by drought. 4.28 million of inhabitants and 4.85 million heads of livestock in Yunnan, Hu-bei and Inner Mongolia were suffered from drinking water shortage [6].
But Three-Year-Long Dry Spell was renamed by media into Four-Year-Long in 2012. In summer of 2012, the China Daily USA named Hunan and Guizhou prov-
Phot
o by
Yek
ater
ina
Dob
ritsk
aya
32

inces as “…the worst-hit regions where 3.35 million and 2.98 million people respectively are facing water shortages” [7].
Anhui, Jiangxi, Hubei and Zhejiang provinces, as well as Chongqing municipality, were also affected by dry spell. Totally, the drought in south of China caused crop fail on about 900 000 ha of farmland [7].
At August, 6 of 2012 new record-high daily tempera-ture (40.6 degrees Celsius) was registered in Shanghai. As were reported: “Shanghai’s municipal government has requested that all companies and units ensure safe working conditions in the severe heat, especially for those working outdoors. Power consumption exceeded 50 billion kwh in July in neighboring Jiangsu Province, the highest among all provinces, partly due to the wide use of air-conditioners” [8].
According to Xinhua, “The current heat wave has swept 13 provincial-level areas across China, leaving about 5.95 million people and 1.72 million heads of livestock short of drinking water. The drought has caused direct economic losses of 1.98 billion U.S. dol-lar and affected about 2.09 million hectares of farm-land, including 350,000 hectares that have been left unharvestable” [8].
The China Daily USA, however, suggested, that “the drought caused a direct economic loss of nearly $6.5 billion.” [7].
Four-Year-Dry Spell: China in 2010-2013 By Yekaterina Dobritskaya, PhD
Lingering Drought: affecting factorsAs climate experts consider, lingering drought in China in 2009-2013 highlights main trends of climate change on the Earth. China is the main contributor into the global warming. The report sponsored by the Chinese Academy of Science and the China Meteo-rological Administration recorded, that temperatures were getting higher and precipitation was getting less in Yunnan province during past 50 years. The extreme events like storms, tornados and droughts however have become more often. Thus climate change is the first factor affecting the drought.
The second factor is deforestation. Natural forests are key regulators in climate and hydrological processes. But the primary-forest area in China is decreasing rapidly. In Xishuangbanna prefecture of Yunnan natu-ral tropical rainforest replaced by rubber trees now cover 3.6% of its 1976 area. In the Ailao Mountains natural forest was replaced by eucalyptus for require-ments of the paper industry. Cleaning of forest areas for logging, mining, quarrying and human settlement construction caused soil erosion, landslides and floods [2].
The third cause following drought toughening is poor environmental and hydrological management in the country. 2010 drought in Yunnan showed unready of the authorities for facing the disaster. The water from most of natural lakes in the province was undrinkable due to high pollution level of the wells. Most of res-ervoirs for drinking water were built in 1960 and was either disused or not functioned property. Small-scale hydrological infrastructure of the region – ponds, small reservoirs and canals was also ineffective. Thus water distributing to the areas suffering from disaster was near impossible.
Climate Change
China National Climate Center predicts possible rainfall decrease in the south of China over the next 20 years. Moreover, air flow and water moisture move-ment over Pacific and Indian oceans directly lead to droughts in southwest of China.
Dan Bebber, a climate researcher of the Earthwatch Institute in Oxford, UK, showed statistical relationship between ENSO (El Niño/Southern Oscillation, an at-mospheric circulation system originates in the western Pacific Ocean) and the monsoon system in southwest-ern China. During ENCO-years the wind from Pacific weakens causing droughts in Southern Asia.
The mechanisms of the ENSO influence upon China southwest are unclear, because Yunnan is not directly influenced by ENCO. But China Academy of Science
33

(CAS) reported, that Yunnan rainy seasons (from May to October) was delayed in strong El Niño years, with less rain in the summer and more rain in the autumn [2].
Yang Xiaobo, an analyst of Sichuan Meteorological Bureau, added: “In recent years, the Indian Ocean’s temperature has been at abnormal levels, leading to the abnormal water moisture movement, and this has lead to the drought in southwest China” [9].
Totally, as Chris Bukley from Reuters matched in 2011: “China’s drought along its biggest river, the Yangtze, is… a demonstration of how global warming could increasingly disrupt the complex dance of air flows, rains and waterways that feeds dams and farm-ing heartlands” [10].
Rapid Deforestation
Four-Year-Dry Spell: China in 2010-2013 By Yekaterina Dobritskaya, PhD
Liu Wenyao, an ecologist of the Xishuangbanna Topi-cal Botanical Garden (research Institute of Chinese Academy of Science, said: “The forest’s thick litter layer of organic materials can absorb up to seven times its own weight in water… Natural forests also have an extensive network of roots that keep the ground moist, and the canopy can trap water vapour, creating a dense fog that keeps the myriad plant species alive during dry seasons… Such large-scale deforestation removes the valuable ecological services natural forests pro-vide… The impact of deforestation on hydrological processes becomes particularly acute during pro-longed droughts.” The region could also be plagued by other natural hazards: with drought the risk of forest fire increases, whereas wetter monsoon seasons could see more floods wreaking havoc”.
“Many scientists are now worried that severe droughts, such as Yunnan’s, will become more common across southeast Asia. In addition to the effect on humans, “the impact on biodiversity could be huge,” added Jen-nifer Baltzer, an ecologist at Mount Allison University in Sackville, New Brunswick, Canada”.
Lianas space increasing follow lingening drought and rapid deforestation. Deep root system allows lianas ab-sorb the water in deeper layers of the soil, and closing of the minute stomatal pores minimizes evaporation. But lianas are poor at absorbing carbon dioxide, that compromises the function of the rainforests as carbon sinks [2].
Poor environmental andhydrological management of
China authoritiesThe 2010 drought in Yunnan showed unpreparedness of the authorities to protect Chinese people against the disaster. As was mentioned above, water infrastructure was unused and not functioned. Only 10% of Yunnan groundwater was surveyed by 2010, geologists evi-denced. Thus the location of the groundwater remains elusive despite of longtime drilling. The quality of water was finally got remains also an issue [2].
To prevent the same problem in the future, Yunnan planned to build about 400 000 cisterns annually in 2013-2015 for population store drinking and collect rainwater. Zhou Yuping, a member of the Lantian res-cue team, that helped residents of Yunnan for 3 years, said it’s not enough: “Cisterns mainly collect rain in wet seasons… but people use the water in cisterns sev-eral months after it is collected… Building roads and water channels are what people need most” [9].
Phot
o by
Yek
ater
ina
Dob
ritsk
aya
34

Four-Year-Dry Spell: China in 2010-2013 By Yekaterina Dobritskaya, PhD
In practice, inhabitants from rural areas were forced to walk up to 16 (!) kilometers, sometimes through the mountains, for getting some drinking water for the family. They walked to the wells or rivers up to 3-4 times per day carrying small kids and got as much wa-ter as possible! They also was called upon sailing their beast because of water shortage and bearing much losses from crop failing.
Anyway, high economic damages and suffered people, livestock and planted lands is the high price China pay for rapid development and leading on the world economic stage. The environment are suffering from China developed industry and extremely poor envi-ronmental management. And the nature also forced Chinese to pay a very high price for the gross inter-vention in nature.
Resources:1. Walsh B. The World's Most Polluted Places // Time maga-zine. – 2013. – http://content.time.com/time/specials/2007/arti-cle/0,28804,1661031_1661028,00.html2. Qiu J. China drought highlights future climate threats // Nature. – 2010-05-11. – 465, 142-143 (2010). – http://www.nature.com/news/2010/100511/full/465142a.html3. Drought May Impact China’s 2011 Winter Wheat Crop // Report of United States Department of Agriculture, Foreign Agricul-tural Service. – 2011-01-14. - http://www.pecad.fas.usda.gov/high-lights/2011/01/China/ 4. Qin K.G. Drought hits 4 million hectares of China's crops… // Reuters. – 2012-04-05. - http://www.reuters.com/article/2012/04/05/us-china-drought-idUSBRE8340QE201204055. Zhang Yifei. China Drought 2012: Three-Year-Long Dry Spell Continues in Southwest // International Business Times. – 2012-04-05. - http://www.ibtimes.com/china-drought-2012-three-year-long-dry-spell-continues-southwest-5549746. Drought hits Yellow-Huai regions, affects agricultural produc-tion // Xinhua. – 2012-06-21. - http://news.xinhuanet.com/english/china/2012-06/21/c_131668876.htm7. China drought leaves 13 million thirsty // China Daily USA. – 2013-08-15. – http://usa.chinadaily.com.cn/china/2013-08/15/con-tent_16897560.htm8. China Focus: Heat, drought, flooding: severe weather tests China//Xinhua. – 2013-08-06. – http://news.xinhuanet.com/english/china/2013-08/06/c_132607372.htm9. China: Lingering Drought, Extreme Weather, Strong Earth-quake and Heavy Rain in 2013 // Earth Changing and the Pole Shift. – 2013-05-08. – http://poleshift.ning.com/profiles/blogs/china-lingering-drought-extreme-weather-strong-earthquake-and-hea10. Buckley Ch., China drought raises questions about climate change // Mother Nature Network. – 2013-06-02. – http://www.mnn.com/earth-matters/climate-weather/stories/china-drought-raises-ques-tions-about-climate-change11. China and Climate Change. Global Greenhouse Warming. – 2013. – http://www.global-greenhouse-warming.com/China-and-climate-change.html
About the Writer
Dr. Yekaterina Dobritskaya (Moscow, Russia) is a Doc-tor (PhD) of Chinese Philosophy and interpreter from Chinese of the Tomsk Polytechnic University in 2005-2009. During 2003-2005 lived and studied in China (study at Jilin University, Changchun). Is an author of the dissertation and number of articles in Chinese philosophy and culture area.
Phot
o by
Yek
ater
ina
Dob
ritsk
aya
35

36
Families are essential for a city to thrive. If a city is too relaxed towards investing in families, they will lose their child population and economic opportunities to neighboring cities.
The Human Life Project research has identified 11 truths about cities:
1) Cities thrive with a balance of ages and incomes.2) Growth occurs where young families are moving in.3) Cities with a small percent of 3-plus-bedroom homes will struggle to attract families.4) Cities with few children must rely on new people moving to fill vacant housing.5) School quality will either attract or cause families to move out of city.6) Good jobs are vital to supporting families.7) Cities in a metropolitan region are typically strong in jobs or family housing, but not both.8) Affordable living is more than affordable housing.9) Retail and services locate closest to their strongest consumer base: families.
Scorecard Overview - Level I
The scorecard consists of 12 main categories with 36 subcategories. Data is collected from the Internet and input to a computer program. In the following list, the subcategories in bold are weighted more heavily.
10) Older adults enjoy better services and community engagement by living in neighborhoods with families.11) The family-support structure is linked to the human sustainability of the city.
The Human Life Project encourages cities to pro-actively work on identifying and reversing negative trends before they become big problems and to build a lasting legacy by investing in families. To this end, the Human Life Project has developed a scorecard for cities. The scorecard is an analytical method to quickly assess the family-friendliness of a city. “Family” is be-ing used to mean all family members from the young-est child to the oldest grandparent.
The Human Life Project has also created a “toolkit” of ideas for how cities can become more family-friendly.
Human Life Project
Go BIG: Improving Suburbs
By Jenny and Scott Randall

Scorecard Overview - Level II
The Level II scorecard is a diagramming exercise. The first step is to plot the concentration of family hous-ing and services. With this basic data, three overlays are created to ultimately determine the city's family centers, Business Centers and Resource Centers.
Family centers: Hub of daily living activity
Family centers are the areas with the highest concen-trations of households with three or more people. The city's family infrastructure such as schools, parks, libraries and museums are also placed on the diagram. The diagram can be used to analyze how the family infrastructure corresponds to where families live.
Business Centers: Hub of economic activity
Business centers are the areas with the highest concen-trations of jobs. Major transportation routes are over-laid on this diagram along with the family centers. The diagram can be used to analyze the proximity of jobs to where the families are living as well as how easily the family members can get to the jobs. The goal is to minimize commute times so as to maximize the time available for family or other non-work activities.
Resource Centers: Hub of resource activity
Resource centers are the locations of grocery stores, farms, water, and power generation. The family and business centers are also shown on this diagram. The goal is to promote local resources as well as easy ac-cess to food for the city residents.
Scorecard Example for Portland and Selected Suburb Cities
illustrate the scorecard, Portland and 5 suburb cities were selected.
The results were somewhat predictable in that most suburbs are more family-friendly than Portland. It should be noted that of the 50 most populated U.S. cit-ies, Portland ranked 16th, so it is more family-friendly than many large cities. The biggest area of opportunity for Portland is attracting more families and, hence, more children to live in the city.
Figure 1 Portland and Suburb Trends
Go BIG: Improving Suburbs
By Jenny and Scott Randall
37

Go BIG: Improving Suburbs
By Jenny and Scott Randall
Littleton Case Example
For a more detailed case example, Littleton, Colorado, will be considered. Littleton is a suburb of Denver. The population is 42,000 and has traditionally been considered a bedroom community.
Littleton scorecard Level II
38

Analysis:
The “A” and “B” labels indicate family centers. These are areas that have the highest concentrations of fami-lies as well as the infrastructure (schools and parks) to support the families.
The “C” labels indicate what appears to be family centers in the past with a high concentration of family infrastructure. However, the families raising children appear to have moved away from these areas or repre-sent many empty-nesters aging in place.
The “D” label indicates an area that has the family infrastructure but is potentially on the edge of not hav ing the family densities to support this infrastructure investment.
The “E” label indicates an area potentially on the edge of having the family densities to support consideration for additional infrastructure investment. This area could potentially need a school, especially considering that a major road exits between this area and the near-est school.
The “F” label indicates an area that is a strong candi-date for consideration for additional infrastructure
Analysis:
Area 1 is the primary business center in the city. Area 2 and 3 also has a good concentration of jobs. Area 1 and 2 are close to family centers. This is desirable in that families could potentially live close to the jobs.
Area 3 is reasonably close to a family center. However, there is a major road between these two which makes non-car travel more challenging.
A large number of city residents do work at one of three business centers that are located outside of the city limits. These jobs require car access. There is light-rail access to the Denver business center. Unfortu-nately, there is limited parking at the light-rail stations, which limits how many commuters can conveniently use the light rail.
Figure 3: Business Centers
investment. This area could potentially need a school, especially considering that this area is geographically distant from the nearest school, and the area has a high number of families.
Figure 2: family centers
Go BIG: Improving Suburbs
By Jenny and Scott Randall
39

Figure 4: Resource Centers
Analysis:
The city has two reservoirs, and therefore has a good water source.
The households near the geographic center of the city and the southwest area have to travel further to get to the nearest grocery store. However, there is no com-mercial farm within the city limits, which means all food must be imported.
Aside from small-scale solar installations on indi-vidual buildings, all of the power comes from outside of the city.
Metro Extension to Level II scorecard
The Level II scorecard can be extended to the metro-politan region. The following diagram illustrates the Denver metropolitan region. The orange dots are the larger cities with the highest concentrations of fami-lies. The red dots are the cities with the highest con-centration of jobs. The gray dots are the larger cities that are not a family or business center. The purple
lines are the light rail (current = light purple and pro-posed = bright purple).
Except for one city, all cities are either a family center or a business center but not both. The business cen-ters tend to be grouped close to the Denver, while the families tend to be “pushed” to the suburbs. Ideally, to help reduce commute times and traffic congestion, the family centers would be located closer to the business centers. However, considering the current locations, Denver is doing a reasonable job of using light rail to connect the family centers to the business centers.
Toolkit
The following are ideas for how to make Littleton more family-friendly. The concepts behind these ideas should be able to be applied to other suburbs. These specifics are being used to try to make the concepts more practical and understandable.
Figure 5: Denver metropolitan family and business centers
Go BIG: Improving Suburbs
By Jenny and Scott Randall
40

Restaurant and Microbrewery District
Littleton has a number of issues that can be addressed by a restaurant/microbrewery district. The issues include a limited number of local jobs resulting in long commute times. The city would benefit from ad-ditional economic activity. A community college with 20,000 students and staff is only a couple of blocks from downtown but feels disconnected. The city also does not have a good gathering location.
The proposed solution is to encourage restaurants and microbreweries to locate on a direct connector street between the community college and downtown. At the end of this street are two relatively new and popu-lar restaurants. The recommendation is to follow the architectural style of these two restaurants and en-courage or require that new restaurants include: brick facade, outdoor seating and roof or patio seating. In addition to providing a consistent urban design, this should encourage the street to become a gathering place and maintain the small town character.
As more restaurants and microbreweries locate along this street, the street will become a good location to hold events, potentially even temporarily making the street pedestrian- only for the events.
LSV District
Littleton has a parking issue in the downtown area. Recent proposals for new development were actually recommended against because of these parking issues. The downtown area is also not bike-friendly.
The recommendation is to remove all car traffic from the downtown area. Cars would be diverted around the downtown area, similar to what is down for exist-ing downtown events. For downtown visitors, parking would occur on the edges of the downtown district. For those with less mobility, the recommendation is to encourage the city to create local taxi cab permits. The recommendation is for the taxis to be electric low-speed vehicles (LSVs) and for fares to be family-friendly such as $1/adult for a one-way trip. children would be free, when accompanied by a paying adult.
The following are example LSVs with different styles, depending on what image the city would like to proj-ect.
Basic Multi-Passenger LSV:
http://www.roadratmotors.com/product.aspx?ProductId=14&title=citEcar+6PF+Street+Legal+Golf+Cart ($9300)
Solar Powered:
http://ctturbine.en.alibaba.com/product/376050838-209335396/solar_trolley_for_golf.html ($9400)
Feeling of Luxury:
http://www.gatormotouv.com/low-speed-vehicles/index.cfm ($14,000)
Go BIG: Improving Suburbs
By Jenny and Scott Randall
41

Fully Enclosed:
http://www.roadratmotors.com/electric-shuttles ($23,000)
LSV Network
Littleton has two light-rail stations, but they appear to be used more for "exporting" workers than for "im-porting" shoppers.
To create a unique destination experience, the recom-mendation is to create a LSV network. This network would connect both light-rail stations to three of Lit-tleton's restaurant and shopping areas. The taxi system described in the LSV District could be extended to in-clude this network. In addition, LSV sharing stations (similar to a bike sharing station) could be established. Local residents could also own private LSVs for use on the LSV network.
This network would have a number of benefits:
- Allow residents in all three areas to more easily get to the businesses in the other two areas
- Activate the river for economic growth (new businesses going in along the network)
- Allow residents near the one non-light-rail area to get to the two light-rail stations without using a full size car. LSVs are approximately one-quarter the size of a car and therefore, more people could park near the light rail. - Encourage tourists to take light rail to Littleton to visit all three business areas.
Figure 6 LSV Network
Legend:
Yellow Stars = Light-rail stations located close to res-taurants and businessesWhite Star = Restaurant and business areaMusical Notes = Community event centerSmiley Face = Undeveloped land that could tie into the proposed LSV network
Example personal LSVs:
Basic:
http://www.cunninghamgolfcar.com/c-36-electric-vehicles.aspx ($7600)
Go BIG: Improving Suburbs
By Jenny and Scott Randall
42

Fun:
http://www.cunninghamgolfcar.com/c-36-electric-vehicles.aspx ($17,000)
Enclosed:
http://www.polaris.com/en-us/gem-electric-car/passenger-vehicle/e2/pages/overview.aspx ($7800)
Housing
Littleton is an attractive place to raise children and age. This becomes an issue because families move there, but because of limited senior housing in the city, do not move out of the family sized housing for many years. The city is built out, which results in an imbal-ance in the age of the residents. These issues can be addressed by updating zoning to allow the following and also promoting these housing options.
Group housing typically looks like a single-family resi-dence from the outside and located within single-fam-ily neighborhoods. Inside, each resident has a private bedroom and possibly a private bathroom. The rest of the house is common space, shared by all residents. A certified nurse or caregiver may reside on site or visit regularly.
Accessory dwelling units (ADU) allow a second unit to be built on a lot with an existing house. The ADU may house a recent college graduate looking for a job or an elderly parent. ADUs can also be rented to non-family members.
ADUs can be taken to the next level by allowing them to be sold independent of the main house. This can provide additional flexibility for the homeowner. To encourage more accessible housing, zoning could al-low the minimum lot size to be half the current size provided that a "universal design" house built on each half-lot. This would allow a homeowner in an existing single-family neighborhood to demo the old house, replace with two universal-design houses, and poten-tially live in one of the houses, while selling the other house to pay off the construction loan.
Pocket neighborhoods are a miniature neighborhood on a small lot in which residents share resources such as having only one "back yard". This concept of shared resources is similar to another multi-generational op-tion of co-housing, but with less mandatory interaction between the residents.
Figure 7: pocket neighborhood
Go BIG: Improving Suburbs
By Jenny and Scott Randall
Phot
os co
urte
sy S
cott
and
Jenn
y Ra
nvill
e
43

The pocket neighborhood image shows nine 1,200-square foot houses with two-three bedrooms on a one-acre site. Each house costs $100,000. Adding basement bedrooms with egress window wells could result in affordable and family-friendly housing.
For Littleton, the pocket neighborhoods would have the additional benefits of gradually increasing density without altering the small-town qualities that resi-dents highly value.
Local food and food access
Compared to other U.S. cities, Littleton does not have as many grocery stores per resident. Zoning could be modified to allow a "corner" grocery store built in resi-dential neighborhoods.
To help address the lack of locally grown food, and to increase opportunities to live and work in the city, zoning can be modified to allow "farm kits". The TSR Group/Agriburbia has developed a farm kit. This in-cludes the specs and materials to build a combined
1 From NRDC.org
house, greenhouse, office, commercial kitchen, storage and distribution center, as well as a business plan andtraining to help ensure success. The farm kit is de-signed for commercial farming of two to 10 acres. Ad-vanced farming techniques are used to minimize time and water usage while maximizing profits and food production. In one example, they generated 6,000 pounds of fresh produce on one-third of an acre.
Another option to increase local food is to hire a company to commercially farm land owned by others. For example, unused land on school property or an unused city owned lot that the city is spending money for lawn care. The land owner will be paid for the use of the land, sharing in the profits generated from sell-ing the food.
While Littleton is a suburb, it still has a number of flat roofs from stores like Home Depot and Lowes. By allowing, and encouraging commercial gardening on these flat roofs, it can provide more local jobs and local food.
The following is an example undeveloped area in Littleton that is in the middle of a neighborhood under-served by grocery stores.
Go BIG: Improving Suburbs
By Jenny and Scott Randall
44

Rooftop gardening can be practical with the only change to the roof being the addition of lightweight planters. In 2011, “450 urban agriculture planters were installed on the roof of the Palais des congrès, allow-ing three partner restaurants (Crudessence, the Palais’ catering service and Intercontinental Hotel) to learn more about the basics of market gardening in cities and offer a wide variety of produce on their menu for those who want to eat locally and in season.”
As one example, Biotop has an edible, roof-integrated system for growing food. It is lightweight and can be installed on an existing roof without structural modi-fications. The Montreal Convention Center installed this system (see above picture) over the summer dur-ing the Ecocity World Summit 2011. The food grown went to local restaurants.
Conclusion
The Human Life Project Scorecard is a data-driven metric to help cities determine their strengths and weaknesses. The weaknesses can be used to prioritize projects for improving the city. The scorecard can also
be used to compare cities. Thus, cities with a weakness in one category can look at cities with a strength in that category for ideas on how to improve. HLP is also collecting best practices, case studies and generating our own unique ideas for how cities can improve.
With a coordinated, data-driven, cross-disciplinary effort and some creative thinking, suburbs can once again become a highly desirable location to live.
About the Writers
Scott and Jenny Ranville run a consulting/think tank/architecture/software development company, Human Life Project®. Our mission is to promote sustainable patterns, helping cities design for all ages. Our inter-pretation of the triple bottom line for urban planning encompasses: environmental sustainability, economic sustainability, and human sustainability. Human sus-tainability is the most important component for HLP.HLP Consulting/Think Tank/Architecture firm specializing in creating enliv-ened, strong, sustainable communities for all ages
Facebook: http://www.facebook.com/pages/Human-Life-Proj-ect/373809785911
Phot
os co
urte
sy S
cott
and
Jenn
y Ra
nvill
e
Go BIG: Improving Suburbs
By Jenny and Scott Randall
45

How the Netherlands Attract Foreign InvestmentBy Andrey Maltsev
The countries of Western Europe have experienced rising immigration over the past decades. But only recently has immigration appeared on the politi-cal agenda. Asylum and immigration questions have become more commonplace in the European Union recently.
The Dutch economy has strong foundations. The Netherlands is a good location for international busi-nesses. There is a dynamic layer of small and medium sized enterprises. Physically, the Netherlands is the gateway to Europe. The ports of Rotterdam and Schi-phol, and the Dutch waterway network as an extens-dion, play a huge role in the country's transport sector.
The Netherlands have a number of economic sec-tors that are in the first rank internationally and can become even stronger. The cabinet of Premier Mark Rutte has provided an important impulse for the busi-ness policy of Deputy Prime Minister Maxime Verha-gen.
Unemployment in the Netherlands is unusually low. There is as much work available for the citizens of the Netherlands as there is for its immigrants. However, the 2008 financial crisis did not leave our country un-touched. And yet, even now when the economic situa-tion is again difficult, the Netherlands is in a relatively good position.
Policy implicationsThe Netherlands, like many other western European countries, are facing pressure from immigrants sup-ported by interested parties inside country, such as employers, to open the door to highly qualified immi-grants.
From a national perspective, the question may be divided on two parts: how to deal with immigration pressure and if possible, produced advantage. A neces-sary condition would be that immigrants do not rely too heavily on welfare.
It is clear that any successful policy will be restrictive as regards access to the country or its welfare. One way to achieve this is selectivity, with respect to the eco-nomic potential of immigrants.
Family migration and asylumReunification of families and asylum, taken together, has been standard practices for the majority of Dutch immigration in recent years. Economic criteria do not play a role. The economic situation of these im-migrants may be improved by either financial or legal means, assuring fast and painless integration.
The Netherlands can investigate what can be possible to take from other countries in the EU, as most of these countries seem to do better, at least judged from the employment rates of immigrants. In integration policy, attention should also be given to the second generation, where the country’s education system plays a crucial role.
Labor migrationLarge-scale immigration of labor is not effective in al-leviating the financial burden of aging, while there are no positive labor market effects to be expected from such immigration. However, some degree of labor migration may be beneficial for the labor market. This is in particular the case if immigrants have a high eco-nomic potential and can fill persisting vacancies.
The present system of labor migration in the Nether-lands allows employers who cannot find suitable staff to fill vacancies within the European Economic Area (EEA), to hire, on a temporary basis, employees from countries outside that area. This system is demand-driven. It is sometimes suggested we can learn from the traditional immigration countries like Australia, Canada and the United States, that employ more supply-driven systems of labor migration, based on quota or point system or a combination of the two.
46

Though such systems offer better opportunities for selectivity, they imply risks for the welfare state as they weaken the incentive for employers to search among residents living on benefits.
Companies and the labor market
A readily available pool of qualified people is essen-tial for business success. The right people in the right place. That sounds simple but it is really difficult. It seems strange that a company with, for instance, five vacancies still finds it difficult to fill those five posi-tions in a working population of 7.5 million, some of whom are unemployed. But it is not just about finding the people who have the training and the necessary knowledge to do the work; they also have to have the skills. Sometimes the good experience is necessary. Particular personal characteristics are sometimes relevant. In some companies, teamwork is important, in others a person needs to be able to work well alone; some positions call for “do-ers”, others for thinkers. For many jobs, some international experience and an ability to speak one or more foreign languages are needed. The required knowledge and skills are highly dynamic.
How the Netherlands Attract Foreign InvestmentBy Andrey Maltsev
In Dutch companies, work migration is based on con-crete vacancy and efforts by the employer to fill that vacancy from the pool of Dutch nationals or people from countries in the EU for which free movement is applicable. Hence, if Dutch employers need somebody, they must recruit in the Netherlands or one of the
other EU countries. If they find a person who formally fits the present vacancy and who has the right qualifi-cations, then they must hire that worker and may not look beyond the allowable borders.
The Dutch government is working to attract invest-ments by foreign firms, and especially those involved in knowledge-intensive activities. The larger metropol-itan areas and technologically specialized regions are the big spots for knowledge-intensive, foreign-owned firms within Netherlands.
More than 73 percent of those active in knowledge-intensive industries were located in North Holland, South Holland and North Brabant in 2012, a concen-tration stronger than that of domestic firms. These three Dutch regions are among the top regions for these kinds of businesses around Europe.
Why? They offer foreign firms a good business envi-ronment and a central location within the European market. The knowledge bases of the Dutch regions are well developed, but have very different characteristics: North Holland and South Holland are specialized in software industrial and public knowledge and North Brabant in technological knowledge.
In 2010, 31 percent of the foreign-owned firms in the Netherlands worked in the financial services industry. These companies, especially focused on foreign finan-cial services, are unusually sensitive to changes in the financial climate or recessions.
Such companies are attracted by the beneficial climate for multinational corporations and changes in this situation may start them to shift all activities to other countries, quickly lowering the number of foreign-owned firms in the Netherlands. This situation shows, that except the economic factors, keeping the high level of quality of life may be important for the Am-sterdam region. Amsterdam mainly attracts invest-ments in industrial activities that are sensitive to any changes in economic conditions.
Phot
o by
And
rey
Mal
tsev
47

Quality of life is not so important to attracting techno-logical firms. North Brabant is an especially attractive location for high- and medium-high tech manufactur-ing.
Such a strategy, divided by regions, gives the Nether-lands a great advantage. For instance, North Brabant and also South Holland have received a relatively high share of investments by foreign firms in medium high-tech manufacturing. On the other hand, policy that has a too narrow regional focus may overlook the attractiveness of other regions (such as South Holland) for such technological investments.
Foreign investments in the Netherlands are going well during the last several years. Active working by the Dutch government has given a great result. More than € 850 million of the foreign investment has occurred in the Dutch economy in the first six months of this year.
These investments have created 4,332 additional jobs. Foreign companies accounted for nearly 15 percent of private sector investments in the Dutch economy in 2013. French companies account for the largest foreign share according to Statistics Netherlands.
Altogether, companies invested 39.7 billion euro in the Dutch economy in 2010. Foreign companies account-ed for nearly 24 percent. More than 16 percent of total investments are from the European Union (EU).
The highest investments by foreign companies were made in the manufacturing sector; 42 percent of total investments were made by foreign-owned companies. Private sector investments in transport, information and communication amounted to 8.1 billion euro. For-eign companies accounted for 29 percent. With nearly 7 percent, French-owned companies made the largest contribution.
The construction sector was neither popular among foreign investors, nor among Dutch investors.
How the Netherlands Attract Foreign InvestmentBy Andrey Maltsev
The Netherlands has always works intensively with other countries, international companies as within Netherlands as outside. The Netherlands is becoming more and more attractive for foreign companies look-ing to establish themselves in Europe.
References:
1. Hogenbirk, A.E. (2002) Determinants of inward foreign direct investments: the case of The Netherlands, dissertation University of Maastricht.2. Economic Policy Reforms: Going for Growth, 2013 edition. OECD’s website at http://www. oecd.org/eco/labour/3. Hartog, Joop, 2002b, Nederland Immigra- tieland? Nee!, van Dalen, Harry en Frank Kalshoven (eds.): Meesters van de welvaart, Balans, Amsterdam.
About the Writer
Andre Maltsev is a staff writer for Urban Planning and Economic Development News Magazine. Andre also works in IT Technology and is a freelance photogra-pher/journalist from Almere, Netherlands. Born in Russia, Andrea’s career has taken him from Russia, to working in Her Majesty’s service for the British Embas-sy, to Italy to where he is located today in the Nether-lands. You can view many of Andre Maltsev’s works at http://www.flickr.photos/ryzhik/
48

The Last WordBy Pamela Shinn
The recent government shutdown in Washington which forced the closing of 401 of our National Parks had a tremendous effect on many state and local econ-omies has come to a temporary halt. The question remains, should the American Public tolerate another episode and do those we sent to Washington have a sequel in mind for February 2014? Most of you have heard the debt crisis debate and standoff over the past weeks, and that Washington has finally made a politi-cal move to a temporary resolution. The temporary agreement is designed to only fund the federal govern-ment until January 15, 2013, and also covers the debt limit until February 7, 2014. In my mind this poses a very big question; will 2014 be the year of a bi-partisan cooperative government in Washington, or should state and local governments have a master plan to take control of fragile state and local economies in light of yet another inevitable conflict?
The National Park Service (NPS) only represents ap-proximately 1% of the federal budget, and is a bureau under The US Department of the Interior. The NPS consists of 401 National Parks (NP) with approxi-mately 20,000 NPS employees. Twenty-seven states have NP along with American Samoa and US Virgin Islands. The impact of the federal shutdown brought many state and local economies during this “political stalemate” to halt, by many local and regional econo-mies to a halt. Having a plan in place to divert future loss of revenue from these sites now seems prudent. Don’t be fooled, this 1% has a very big one-two punch.
The 16 days of the “Washington Stalemate” budget agreement and healthcare, essentially cost the Ameri-can public an estimated at 24.1 billion dollars in total, which boils down to 1.5 billion dollars a day, which is what is being reported federally and seems exceeding low to me. This estimated does not take into account the true “trickle down” effect to local and regional economies which rely on the tourism industry.
During the federal shutdown, many state and local economies which are reliant on seasonal tourism be-ing infused into their local economies were directly impacted by the incident. One example is Groveland California. Groveland, which has a rich history going back to the Gold Rush, is reliant on tens of thousands of tourists and is essentially the gateway for visitors to Yosemite National Forest. All thought Yosemite National Forest furloughed approximately 660 of its employees, the shutdown drove the tourism market to a point where local business was off by approximately 85% and has forced some small businesses to perma-nently close, per a recent CBS report . With regret, due to the California budget, the state was not able to assist in the reopening the NPS within the state.
According to a report in SFGATE, “Several states and local governments had offered to reopen National Parks in an attempt to snatch back some of the mil-lions in tourist dollars scattered to the winds by the government shutdown, but California won’t be among them, state officials said Thursday. The state (Califor-nia) can barely afford to take care of its own parks, let alone move in on federal land. Many of California’s 280 state parks, which were closed or partially closed due to the state’s budget crisis years ago, have re-mained open to the public because private citizens and groups stepped forward with donations to fund the operations.” It was also reported that the California Park Officials had just finished negotiating a coopera-tive agreement with the National Park Service prior to the federal shutdown which would have sent Federal Park Employees to assist the State Parks System, which went to the sidelines as well. The state of California is host to 23 National Park Sites.
On October 11th, Spokesman for the California Department of Finance, HD Palmer, reported that although the state of California has a balanced budget and is under pressure to use general funds and reopen
49

the national parks, that prospect was rejected due to the fact there were no guarantees in place that they would be reimbursed for the reopening. This poses a very sharp doubled edged sword for its citizens and local governments, as has been reflected in Groveland. On one side the federal government, the other, the state of California. California also hosts Joshua Tree, Death Valley, Sequoia and other parks within the NPS. It is estimated that California projected losses (based on California 2011 tourism earnings of $106 billion and an estimated growth to $112 billion for 2013) would amount to an approximate loss of $648 million for California alone during the recent shutdown.
Other states, such as Utah, Colorado, New York , Ten-nessee and Arizona put up state funds to reopen some of their National Parks. Colorado hosts a total of 13 National Parks, including 3 National Heritage areas , 14 National Natural Landmarks and 24 National Landmark sites, in which 2012 reported approximately 5, 811,546 visitors. Utah estimated that the economic impact for their state during the federal government shutdown could cost the state approximately $100 mil-lion.
I could not locate 2012 local economic benefit in-formation, but I was able to locate information for 2011 in a Natural Resource report compiled for the NPS. The study reported that “Economic impacts of individual parks can be aggregated to the state level with a few complications.” The report identifies that regional-level economic impacts for each NPS region and that regional- level economics are larger than the impacts for state economies since regions generally include a larger economic productive capacity than states and therefore account for a larger share of the overall impacts.
According to the Natural Resource Report, compiled for the NPS, it estimated that the contribution of
The Last WordBy Pamela Shinn
visitors spending generated by the NPS to the national economy in 2011 was approximately $30.09 billion in sales, 251,600 jobs, $9.34 billion in labor income, and $16.50 billion in value added. Figure 1 indicates spending within a 60 mile radius of any given National Park. These percentages exclude such items as airfare, durable goods and major equipment. The data also did not capture commercial expenses such as rafting trips and other special activities, which may underesti-mate spending percentages.
Figure1. Distribution of National Park Visitor Spending in 2011 within a 60 mile radius.
Studies by Travel Effects have estimated that in 2011 alone, all direct travel spending (not to just NPS) was approximately $813 billion, which directly supported approximately 7.5 million US jobs and had generated around $124 billion in tax revenue. They go on to say that equated to $2.2 billion/day, $92.8 million/hour, $1.5 million/minute.
50
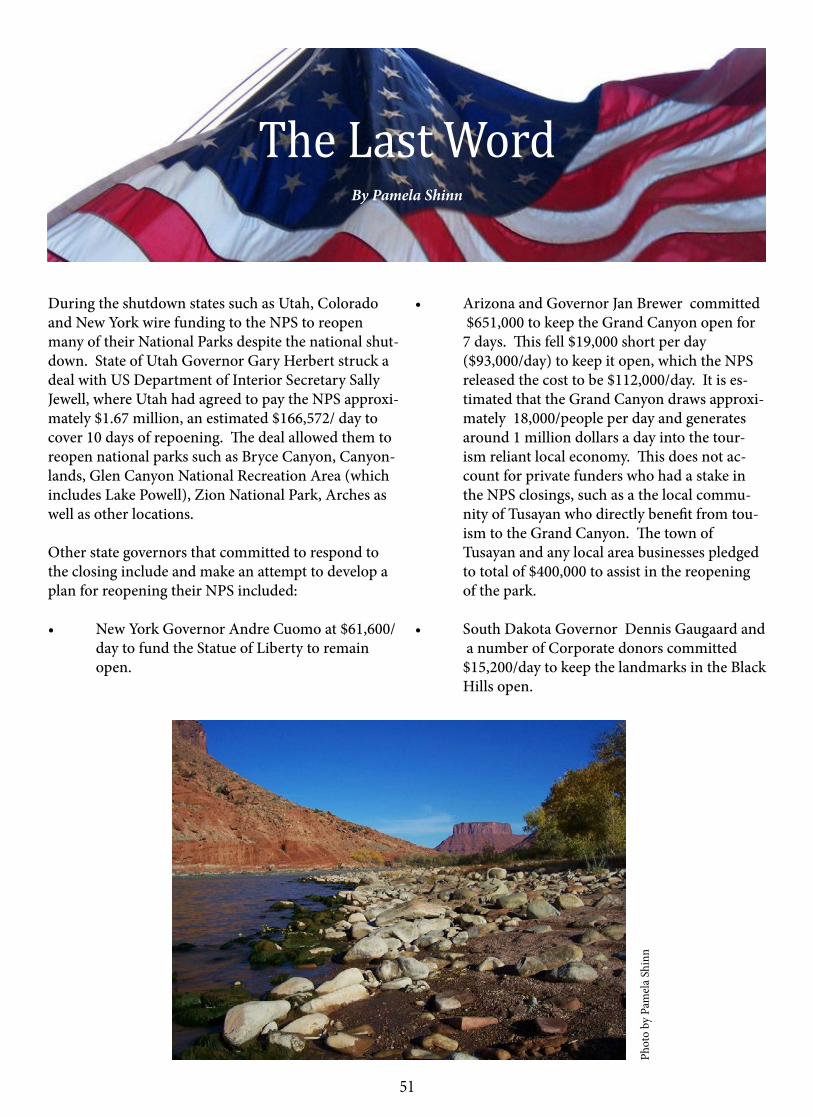
The Last WordBy Pamela Shinn
During the shutdown states such as Utah, Colorado and New York wire funding to the NPS to reopen many of their National Parks despite the national shut-down. State of Utah Governor Gary Herbert struck a deal with US Department of Interior Secretary Sally Jewell, where Utah had agreed to pay the NPS approxi-mately $1.67 million, an estimated $166,572/ day to cover 10 days of repoening. The deal allowed them to reopen national parks such as Bryce Canyon, Canyon-lands, Glen Canyon National Recreation Area (which includes Lake Powell), Zion National Park, Arches as well as other locations.
Other state governors that committed to respond to the closing include and make an attempt to develop a plan for reopening their NPS included:
• NewYorkGovernorAndreCuomoat$61,600/ day to fund the Statue of Liberty to remain open.
• ArizonaandGovernorJanBrewercommitted $651,000 to keep the Grand Canyon open for 7 days. This fell $19,000 short per day ($93,000/day) to keep it open, which the NPS released the cost to be $112,000/day. It is es- timated that the Grand Canyon draws approxi- mately 18,000/people per day and generates around 1 million dollars a day into the tour- ism reliant local economy. This does not ac- count for private funders who had a stake in the NPS closings, such as a the local commu- nity of Tusayan who directly benefit from tou- ism to the Grand Canyon. The town of Tusayan and any local area businesses pledged to total of $400,000 to assist in the reopening of the park.
• SouthDakotaGovernorDennisGaugaardand a number of Corporate donors committed $15,200/day to keep the landmarks in the Black Hills open.
Phot
o by
Pam
ela
Shin
n
51

• ColoradoGovernorJohnHickenlooper committed $362,700 to the Department of Interior to reopen Rocky Mountain National Park for 10 days. The park estimated in 2012, 3.2 million visitors and had estimated around 550,000 visitors during this years fall color season. The 16 day shutdown particularly hurt the Colorado local economy in light of the recent flooding and the states attempt to re- open damaged roads and highways and already suffering a 4.8 million dollar economic loss . The town of Estes Park was particularly hit, first with the washout of Trail Ridge Road, then the NPS shutdown. A study done by the Regional Economics Institute Center for Disaster and Risk Analysis at Colorado State University and based on data from 2011 and 56% of visitors being from out of state, “If the loss in tourism expenditures is 30 percent ($31.4 million), then 335 jobs will be lost, state economic activity will fall by $27.2 million (0.01 percent) and real household income will fall by $13.9 million (0.01 percent). State tax revenue will fall by $1.8 million and local tax revenue will fall by $1.3 million.”
The Last WordBy Pamela Shinn
In some states, such as Washington State, Wyoming, Florida and Nevada said no to utilize state funds to reopen its NP. Some states cited the necessity to fund other federally cut programs such as the food stamp program and WIC (Aid to Women, Infants and Chil-dren).
In total, it has been estimated that approximately 700,000 people a day and that the park service was losing $450,000 per day in revenue from entrance fees and other in-park expenditures. Also, now that it is clear that states can provide funding, with still a ques-tion for private contributions from private donors and stake holders, it does seem that there is an apparent need for a plan of action after looking at some the data for those most at risk for economic disaster.
We all know that the current federal extension will only fund the federal government until January 15, 2014, and that the debt limit is secure until February 7, 2014. Based on comments made by Ted Cruz however on the Sunday ABC News, Cruz stated he is willing to do this all again, but can the American economy and public afford another Washington shutdown , draining funds from our state and local economies? You be the judge.
Phot
o by
Pam
ela
Shin
n
Phot
o by
Pam
ela
Shin
n
52


