Embed Size (px)
Citation preview
Urban LandMark Land Release Assessment Tool: Pennyville Case Study Report
July 2011
Prepared by: Commissioned by:

List of abbreviations
al+hdc Affordable Land and Housing Data Centre
BNG Breaking New Ground
CBA Cost Benefit Analysis
FLISP Finance-linked Institutional Subsidy Programme
INEP Integrated National Electrification Programme
IRR Internal Rate of Return
JOSHCO Johannesburg Social Housing Company
LRA Land Release Assessment
MIG Municipal Infrastructure Grant
NPV Net Present Value
PPP Public-Private Partnership
PZR Pennyville Zamimpilo Relocation (Company)

Contents
1 Introduction ...........................................................................................1
2 Project background ...............................................................................1
3 Location .................................................................................................2
4 Land and services .................................................................................3
5 Housing mix and target market ...........................................................4
6 Project funding ......................................................................................6
7 Results of the financial model ..............................................................7 7.1 The Developer perspective ............................................................. 7
7.2 The State perspective ................................................................... 10
7.3 The Household perspective .......................................................... 12
7.4 Summary ....................................................................................... 14
8 Conclusion .......................................................................................... 19
References .................................................................................................... 21

List of figures
Figure 1: Market rental units at Pennyville, with single-storey and walk-up subsidised units in the background .............................................................. 2
Figure 2: Location of Pennyville in relation to the Johannesburg CBD ................ 3 Figure 3: Site plan of Pennyville ........................................................................... 3 Figure 4: State subsidies by housing type ......................................................... 12 Figure 5: Developer’s overall waterfall chart (per average unit) ........................ 16 Figure 6: State’s overall waterfall chart (per average unit) ................................ 16 Figure 7: Household waterfall chart – subsidy single storey ............................. 17 Figure 8: Household waterfall chart – subsidy walk up ..................................... 17 Figure 9: Household waterfall chart – social rental family ................................. 18 Figure 10: Household waterfall chart – social rental rooms .............................. 18 Figure 11: Household waterfall chart – market rental ....................................... 19
List of tables
Table 1: Developer performance by housing type ............................................... 8 Table 2: Inflows and outflows per unit from the developer’s perspective .......... 9 Table 3: Sensitivity on market rental operating cost assumption ..................... 10 Table 4: Sensitivity analysis on developer’s cost of capital ............................... 10 Table 5: State performance by housing type ..................................................... 11 Table 6: Up-front and ongoing costs from the State perspective ...................... 11 Table 7: State subsidy analysis .......................................................................... 12 Table 8: Inflows and outflows from the household’s perspective ..................... 13 Table 9: Calculation of imputed rent for rental units ........................................ 14 Table 10: Summary of NPV and ROI for all actors and unit types ..................... 15
Urban LandMark Land Release Assessment Tool: Pennyville Case Study
Financial figures are best estimates given available data. Should new data become available, these may change.
1
1 Introduction
In co-operation with the Western Cape Department of Human Settlements and the City of Cape Town, Urban LandMark commissioned 80/20 and PDG to develop an approach to evaluate the cost effectiveness of public land release. A Land-release Assessment (LRA) model was developed and used to assess the cost effectiveness of the case-studies in the Western Cape. The model is an Excel-based financial model which undertakes a cost benefit analysis (CBA) from the perspectives of the state, developer and resident households. PDG has been commissioned to apply the LRA model in two Gauteng case studies, namely Cosmo City and Pennyville in order to a) increase the case-study application to generate a database of model inputs and outputs, b) to test the model, and c) to compare the Gauteng experience with that of the Western Cape.
This report covers the Pennyville case study and provides background information to the project, as well as the results of the LRA model and an analysis of the results. Separate reports cover the Cosmo City case study, a comparison between the Western Cape and Gauteng case studies and an assessment of the model itself.
2 Project background
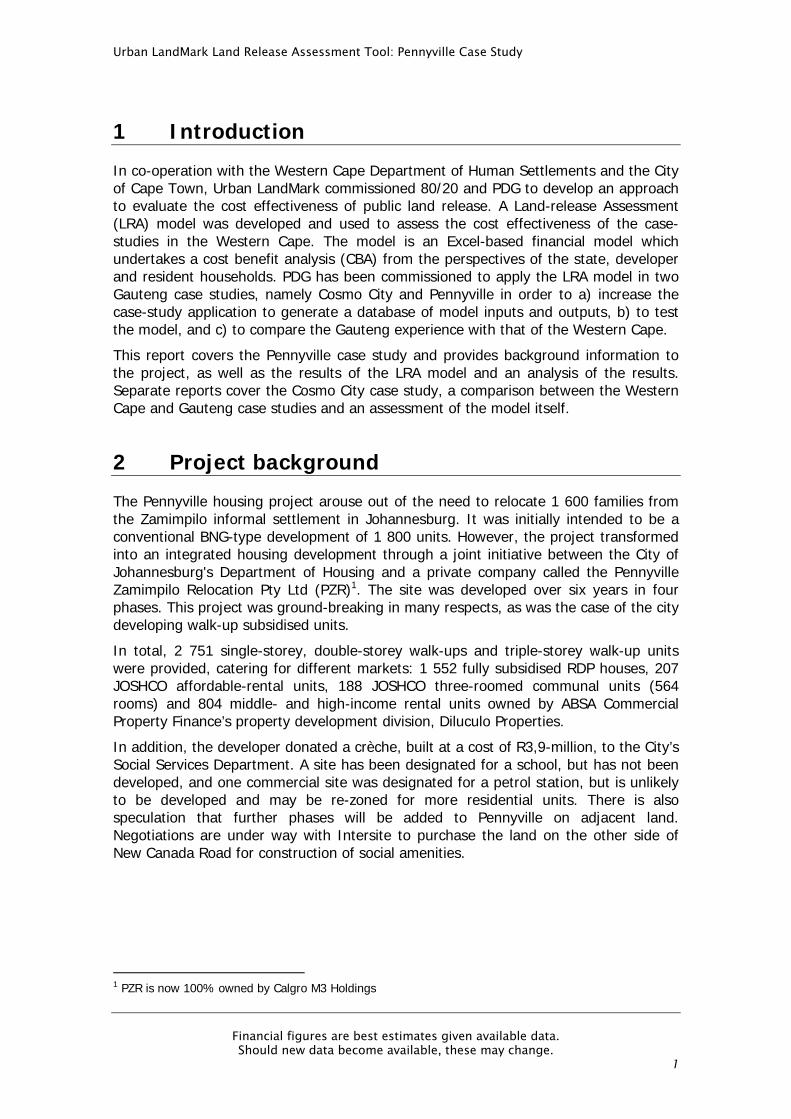
The Pennyville housing project arouse out of the need to relocate 1 600 families from the Zamimpilo informal settlement in Johannesburg. It was initially intended to be a conventional BNG-type development of 1 800 units. However, the project transformed into an integrated housing development through a joint initiative between the City of Johannesburg's Department of Housing and a private company called the Pennyville Zamimpilo Relocation Pty Ltd (PZR)1. The site was developed over six years in four phases. This project was ground-breaking in many respects, as was the case of the city developing walk-up subsidised units.
In total, 2 751 single-storey, double-storey walk-ups and triple-storey walk-up units were provided, catering for different markets: 1 552 fully subsidised RDP houses, 207 JOSHCO affordable-rental units, 188 JOSHCO three-roomed communal units (564 rooms) and 804 middle- and high-income rental units owned by ABSA Commercial Property Finance’s property development division, Diluculo Properties.
In addition, the developer donated a crèche, built at a cost of R3,9-million, to the City’s Social Services Department. A site has been designated for a school, but has not been developed, and one commercial site was designated for a petrol station, but is unlikely to be developed and may be re-zoned for more residential units. There is also speculation that further phases will be added to Pennyville on adjacent land. Negotiations are under way with Intersite to purchase the land on the other side of New Canada Road for construction of social amenities.
1 PZR is now 100% owned by Calgro M3 Holdings
Urban LandMark Land Release Assessment Tool: Pennyville Case Study
Financial figures are best estimates given available data. Should new data become available, these may change.
2
Figure 1: Market rental units at Pennyville, with single-storey and walk-up subsidised units in the background (Source: Calgro M3)
3 Location
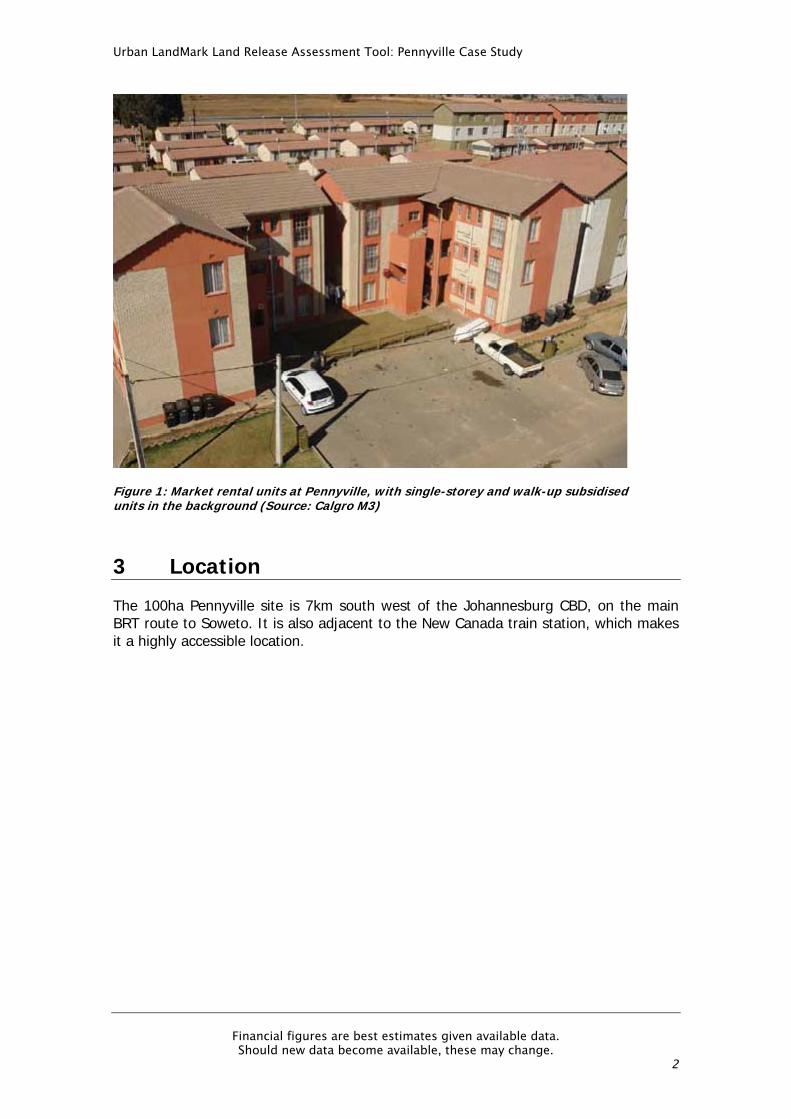
The 100ha Pennyville site is 7km south west of the Johannesburg CBD, on the main BRT route to Soweto. It is also adjacent to the New Canada train station, which makes it a highly accessible location.

Urban LandMark Land Release Assessment Tool: Pennyville Case Study
Financial figures are best estimates given available data. Should new data become available, these may change.
3
Figure 2: Location of Pennyville in relation to the Johannesburg CBD (Source: Google Maps)
Figure 3: Site plan of Pennyville (Source: Google Maps)
4 Land and services
The site was purchased by the developer in 2006, but could not be used for subsidised housing because the subsidy rules prohibited the use of subsidies on privately-owned land. However, the developer and City signed a land-exchange agreement, whereby the Pennyville site was exchanged for a nearby site called Riverlea, which was owned by the City. The Riverlea site was of similar value and more suited to the development of bonded residential units, so was favoured for a private commercial development.

Urban LandMark Land Release Assessment Tool: Pennyville Case Study
Financial figures are best estimates given available data. Should new data become available, these may change.
4
Under the land-exchange agreement, the City paid the developer the difference in the value of the sites, while the developer paid the City in transfer fees on the bonded housing units developed on the Riverlea sites2. However, in the case of the subsidy units the city never took transfer of the land, but transfer happened directly from the developer to the beneficiaries. For the JOSCHO units, as JOSHCO is 100% owed by the City, transfer never took place between the City and JOSHCO. This arrangement short-circuited various administrative issues, and also resulted in zero land-holding costs on the part of the developer. The developer therefore did not pay the City for the land, except for the rental units sold to Diluculo, for which the developer paid R9 000 per unit to the City – a total payment of R7.236 million.
Some bulk infrastructure was required to service the site, including a bulk water connection, an outfall sewer, the main bus route through Pennyville, a pedestrian bridge and some preliminary earthworks. These were budgeted for and paid for by the City through their MIG budget. The various separate MIG applications for this work totalled R60 million. The developer was not required to pay any bulk contributions on the project.
Ground was broken on the site in September 2006, with bulk and internal services being constructed concurrently. Top-structure construction started in January 2007 and the first units were completed by October of the same year. The first houses were transferred in December 2007, with the final houses of the last phase being handed over in May 2011. The developer sub-contracted the construction of the top structures, but in some cases had to complete the work themselves.
5 Housing mix and target market
The housing mix in Pennyville as determined by the City of Johannesburg was:
1 090 fully subsided free-standing and semi-detached units
462 fully subsidised two-storey walk-up units
207 JOSCHO social rental family units
188 JOSHCO three-room rental units (564 rooms)
In addition, 804 market rental units were constructed on land sold to Diluculo. In total, 3 127 housing opportunities have been provided in Pennyville.
The project was initially conceived to be only free-standing, fully subsidised units, but changed to an integrated development, firstly because of changes in housing policy and discourse, and a shift towards social rental housing, and secondly to make the project as a whole more viable for the developer. The infrastructure was constructed for the planned 2 800 subsidy units prior to the changes in the development model. It was then agreed that 800 units could be sold to a private company for rental. Therefore, to recoup the ‘subsidy’ money3, a portion of the sale price for the rental units went to the City for land and infrastructure. The developer had proposed the units be sold to a partner financial institution, but the City ruled that the sale had to go
2 As the Riverlea development is not within the scope of this project, we will consider the land to have
been donated to the project by the City of Johannesburg, and ignore the details of the land-exchange agreement.
3 This was not strictly subsidy money yet, because of the bridging finance being provided by the City

Urban LandMark Land Release Assessment Tool: Pennyville Case Study
Financial figures are best estimates given available data. Should new data become available, these may change.
5
through correct procurement procedures and the tender process took 10 months to complete. The land was sold to Diluculo for R185 000 (excluding VAT) per unit construction cost (paid to the developer) and R9 000 per unit for the land (paid to the City), with a condition that PZR build the units to pre-determined specifications. The 43m² two-bedroom rental units include kitchens and built-in cupboards. In addition, Diluculo spent approximately R6 000 per unit on landscaping and paving.
The fully subsidised units have a fairly high specification including tiled roofs, which added approximately R5 000 per unit to the basic cost of the minimum BNG house. This decision was made to increase the attractiveness of the rental units. However, the units are the minimum required size for subsidy units (at the time of the project initiation) of 36m² on fairly small 80m² stands. The free-standing and semi-detached units cost the same amount to construct, but on smaller stands, and thus higher densities were achievable on the semi-detached units. The eight-year moratorium on the sale of the fully subsidised units means that the actual property value escalation cannot be determined. However, a valuation undertaken by ABSA in 2009 estimated the market value of the units at R120 000. The developer now estimates these units to be worth approximately R200 000.
The walk-up units were more expensive to construct than the single-storey units, but savings were made on the infrastructure required per unit, resulting in a total package cost lower than the free-standing units. One complication with the walk-up units was that the Department of Energy did consider these units to qualify for the INEP grant of R3 490, which the City then had to pay.
The single rental rooms were essentially the same unit layout as the 36m² two-bedroom fully subsidised walk-up units, but with the lounge area converted into a third rental room, with a shared kitchen and bathroom for the three rooms. The three-roomed units were sold to JOSHCO for R80 000 per unit. The single rooms were initially rented out for R250 per month, which included contributions for electricity and water. Over three years this rental has escalated to R284 per month. These units were specifically aimed at serving those renting in the Zamimpilo informal settlement, but who still fulfilled the JOSCHO social housing criteria4. A survey found that shacks in Zamimpilo were being rented for R400 per month, and thus the single rental rooms, with full services, offered a better, cheaper alternative.
The 43m² family rental units were built at a cost of R205 000, which included landscaping and security measures. These were initially rented out for R1 500 per month. The result was that they were of a higher specification, but R600 per month cheaper than the market rental units. However, the JOSHCO qualification requirements limited the target market. Even so, the demand for these units was extremely high, and the units were rented out immediately. The collection rate for the JOSHCO units has been reported to be around 65%, which contrasts with the market rental units (see below).
The demand for the 43m2 market rental units was extremely high. When the first 76 units were advertised, over 500 qualifying applications were received. The qualifying criteria for the rental of R2 100 per month was a monthly income of approximately R8 000 per month. Applications were received from individuals and households earning up to R14 000 per month. The landlord, understandably, accepted the applications from the highest income earners, who represented a much more secure income stream. This 4 These criteria include qualifying for a state housing subsidy and being first-time housing subsidy
recipients.
Urban LandMark Land Release Assessment Tool: Pennyville Case Study
Financial figures are best estimates given available data. Should new data become available, these may change.
6
resulted in initial collection rates of over 95%, but has led to a greater income disparity between the tenants of the market rental units and the subsidy beneficiaries. The rental of the units has escalated to R2 300 per month over two years. The sale agreement with Diluculo specified that 50% of the units could only be sold after two years, and the remaining 50% could only be sold after five years. The initial two-year moratorium on sales is coming to an end, and the units are intended to be sold for R350 000, representing a 50% increase in value in real terms.
Though the project was initially intended to eradicate the Zamimpilo informal settlement, this was not possible and the informal settlement still remains, although it is now substantially smaller. The first reason for this is the fact that many of the informal settlement residents did not qualify for the housing subsidy. The second reason is that there was significant political competition for the housing opportunities at Pennyville and the City had to make some compromises on the allocations. Backyard dwellers from Orlando East, Riverlea and Westbury also had to be accommodated.
It is interesting to note that the project did not include any credit-linked (FLISP) subsidy units for the ‘gap’ market. The reason for this was a) that the project was initially conceived as a pure BNG fully subsidised development and only included the social rental component and the market rental units to make the project more viable, and b) there was agreement that the banks were not lending to the FLISP target market and these units would be very difficult to sell. The developers argue that in order to create the right balance between rate-paying residents and recipients of free houses and services, integrated developments need to have 60% bonded units and 40% subsidised units. This is an argument that needs to be tested by the model.
However, from the perspectives of the City and the developer, the project has been a huge success and they feel that the co-developer model, and the mix of housing provided, has worked well.
6 Project funding
The project was funded primarily from the provincial housing subsidies, but bridging finance was provided by the City of Johannesburg and subsidies were paid by the province to the City on completion of project milestones. The subsidy value changed from R48 344 to R68 334 over the project period. For the purposes of the model, a weighted average subsidy value of R56 381 was used5, based on the number of fully subsidised units paid for at each subsidy level.
In addition to R60 million of MIG funding, the City provided an undisclosed top-up on the internal infrastructure, which has not been captured in the model. It is difficult to determine the exact investment made by the City because it has not yet fully recouped the subsidy money from the provincial Department of Local Government and Housing. City Parks and some of the municipal-owned entities (MOEs) provided contributions to the landscaping and public services, but this expenditure was not included in the analysis. The National Department of Energy funded the upgrading of an electrical
5 Note that this only refers to the housing subsidy. Other subsidies in the form of MIG and INEP were also
applied to the subsidised units, as is discussed later.
Urban LandMark Land Release Assessment Tool: Pennyville Case Study
Financial figures are best estimates given available data. Should new data become available, these may change.
7
substation, which was installed by City Power, which has also been excluded due to lack of data.
The National Social Housing Capital Grant was used to put R6 million towards the 400 JOSHCO units. The difference of the cost of the family units was paid for by JOSHCO, at a total cost of approximately R48 million, and the rental rooms were paid for by the City of Johannesburg at a cost of R80 000 per three-roomed unit. JOSHCO was fully capitalised as a City-owned company by the City of Johannesburg, and obtained an additional loan from DBSA.
Some level of internal cross-subsidy was also provided through the sale of the rental units to Diluculo to fund the additional cost of the subsidised top structures, beyond what was covered by the housing subsidy.
The multiple sources of funding (ABSA, MIG, City, JOSHCO) allowed the developer to continue with the development with no bridging finance. As has been mentioned, holding costs were minimised through the transfer of land ownership to the City.
7 Results of the financial model
As for the Western Cape case studies, the results of the financial model are discussed from the perspectives of the developer, the State and the beneficiary households. Commentary is also provided on the source and reliability of the model input data. PDG has attempted to use the Urban LandMark Land Release Assessment Tool ‘as is’, without modifications of the model formulas or questioning the assumptions that are implicit in the model calculations6. However, formula changes have been unavoidable due to the model not treating rental stock adequately. Given that rental stock is a significant portion of the Pennyville project, it was deemed necessary to modify the model. Where the model has been altered, these changes are noted in the report.
Note that all NPV values are calculated in the model to the project start date (2006), but these have been re-escalated to 2011 Rands using standard CPI escalation for ease of analysis.
7.1 The Developer perspective The Pennyville case study is considerably simpler than the Cosmo City case study in that fewer developers were involved. However, it was still necessary to group a number of entities under the banner of ‘developer’ for the sake of the model. The ‘developer’ therefore comprises the main developer, PZR (Calgro M3), their top-structure sub-contractors, Diluculo and JOSHCO. Although JOSCHO is a state-owned entity, it has had to be included here, as it is the entity that manages the social rental units and accrues revenue from these over time; there is no facility in the model to include JOSHCO as the ‘State’ in this scenario.
The data for the developer were sourced from Calgro M3 and from JOSHCO. All data for the Diluculo units were sourced via Calgro M3. The following points should be noted regarding the data inputs:
6 In some instances inputs have had to be modified to suit the context of the specific case study. These
are discussed in a separate report dealing with the model itself.

Urban LandMark Land Release Assessment Tool: Pennyville Case Study
Financial figures are best estimates given available data. Should new data become available, these may change.
8
The monthly operating costs for the JOSCHO units were not supplied. However, in their annual review of tariffs, JOSCHO note that the rental does not cover the operating costs and the operating costs have therefore been estimated as 10% higher than the rental (i.e. a 10% rental subsidy).
The monthly operating costs for the market rental units were not supplied and have been estimated at 40% of rental revenue.
The developer was assumed to have no holding costs because of the land exchange agreement.
No construction cost information was supplied for the subsidised units and these have been estimated at R20 000 for internal services and R62 000 for the top structure. This cost of R82 000 per unit is assumed to be all-inclusive of construction overheads and was set in order to reflect a small loss on the subsidy units.
The capital costs of the social rental and market rental units were set at the prices paid by JOSCHO and Diluculo respectively to Calgro M3. While this represents some degree of profit for the developer, because of the way the entities have been lumped together in the model this ‘internal’ profit is not reflected in the model results.
The model initially ignored the asset value of rental stock remaining at the end of the period of analysis. In order to accommodate this clear benefit to the developer, the model formulas were changed to assume all rental stock to be sold after 20 years. This theoretical sale was used as a proxy for the asset value retained by the developer, should the units still be owned by them. It is acknowledged that the Diluculo units are likely to be sold earlier, in which case less capital benefit is realised sooner, and the asset is transferred to the next owner, who may be a company or a household. However, as the model is not able to cater for this complexity, it is assumed that the units remain rental stock for 20 years.
In total, the net present value (NPV) for the developer is calculated at R203 million (R2011 Rands), representing a 29% return on total costs and an internal rate of return (IRR) of 18%. However, this includes the sale of the rental units after 20 years, with an assumed annual property escalation of 10%. The table below provides a breakdown of the present values by unit type, from the developer’s perspective.
Table 1: Developer performance by housing type
Mix Type Per Unit TotalROI: PV of Return on Total Cost
Subsidy - single storey -6,739 -7,345,262 -8.1%Subsidy - walk-up -6,739 -3,113,311 -8.1%Social rental - family -79,111 -16,376,045 -11.5%Social rental - rooms 1,226 691,287 1.2%Market rental 285,545 229,577,850 62.0%
Total NPV 203,434,519 29.0%
NPV
The capital cost of the subsidised units was set to reflect a small loss, given an understanding that there was some degree of cross-subsidisation in the project. Profit

Urban LandMark Land Release Assessment Tool: Pennyville Case Study
Financial figures are best estimates given available data. Should new data become available, these may change.
9
is shown for the social rental rooms and a significant profit margin for the market rental units. It is useful to analyse these net costs and benefits in more detail, as is provided in Table 2 (costs escalated to 2011).
Table 2: Inflows and outflows per unit from the developer’s perspective
Subsidy ‐
single
Subsidy ‐
walk‐up
Social rental
‐ family
Social rental
‐ rooms
Market
rental
per unit per unit per unit per unit per unit
Inflows
VAT inflow 2,580R 2,580R 6,641R ‐R 8,435R
Sales revenue ‐R ‐R 162,491R 20,634R 157,289R
Subsidy revenue 74,170R 74,170R 51,069R 23,131R 20,416R
Rental revenue ‐R ‐R 390,751R 65,125R 559,709R
Total inflows 76,750R 76,750R 610,953R 108,890R 745,850R
Outflows ‐R ‐R ‐R ‐R ‐R
Land & holding costs ‐0R ‐0R ‐0R ‐0R ‐11,404R
EIA and rezoning ‐R ‐R ‐R ‐R ‐R
Prof serv & project admin ‐0R ‐0R ‐0R ‐0R ‐0R
Infra dev and dev charges ‐25,165R ‐25,165R ‐25,641R ‐8,547R ‐25,922R
Top structure & NHBRC ‐58,324R ‐58,324R ‐229,086R ‐24,114R ‐198,125R
Marketing & sales ‐R ‐R ‐R ‐R ‐R
Operating costs ‐R ‐R ‐435,337R ‐73,846R ‐224,854R
VAT outflow ‐R ‐R ‐R ‐1,157R ‐R
Total outflows ‐83,489R ‐83,489R ‐690,064R ‐107,664R ‐460,305R
Net Position ‐6,739R ‐6,739R ‐79,111R 1,226R 285,545R
The subsidy units produce a VAT inflow because of the zero VAT rating on the subsidies paid to the developer. Surprisingly, the market rental units also show a VAT inflow. This is due to the VAT redeemable being calculated in the year of construction (2008), and the VAT payable in the year of sale (2028) – the discount rate therefore generates a net benefit. Subsidy revenue is reflected on all the units because of the infrastructure portion of the housing subsidy that was used for all units before the development model was changed. The land cost of R9 000 per market rental unit is discounted to an NPV of R8 461 in 2006 and then escalated to a cost of R11 404 in 2011. All other costs are reflected as infrastructure or top-structure costs as no breakdown of these costs was provided.
Note that the JOSCHO rental subsidy is considered in the model as a subsidy from the developer to the household and not the State to the household.
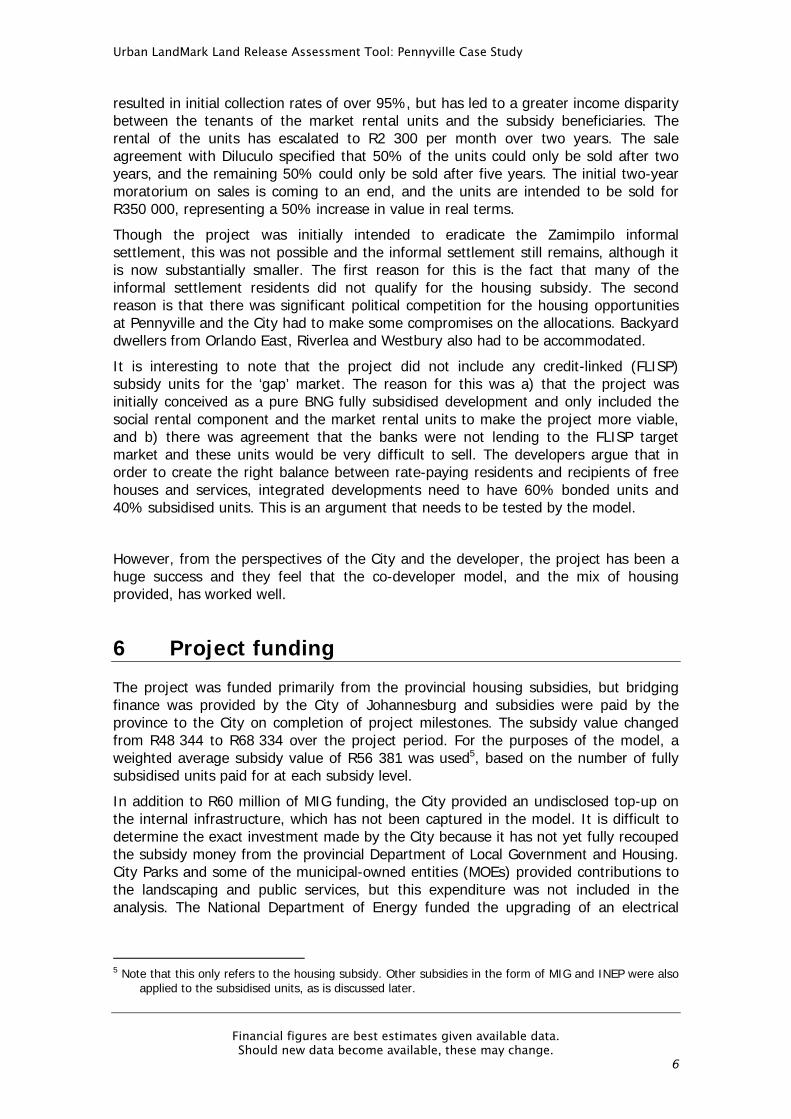
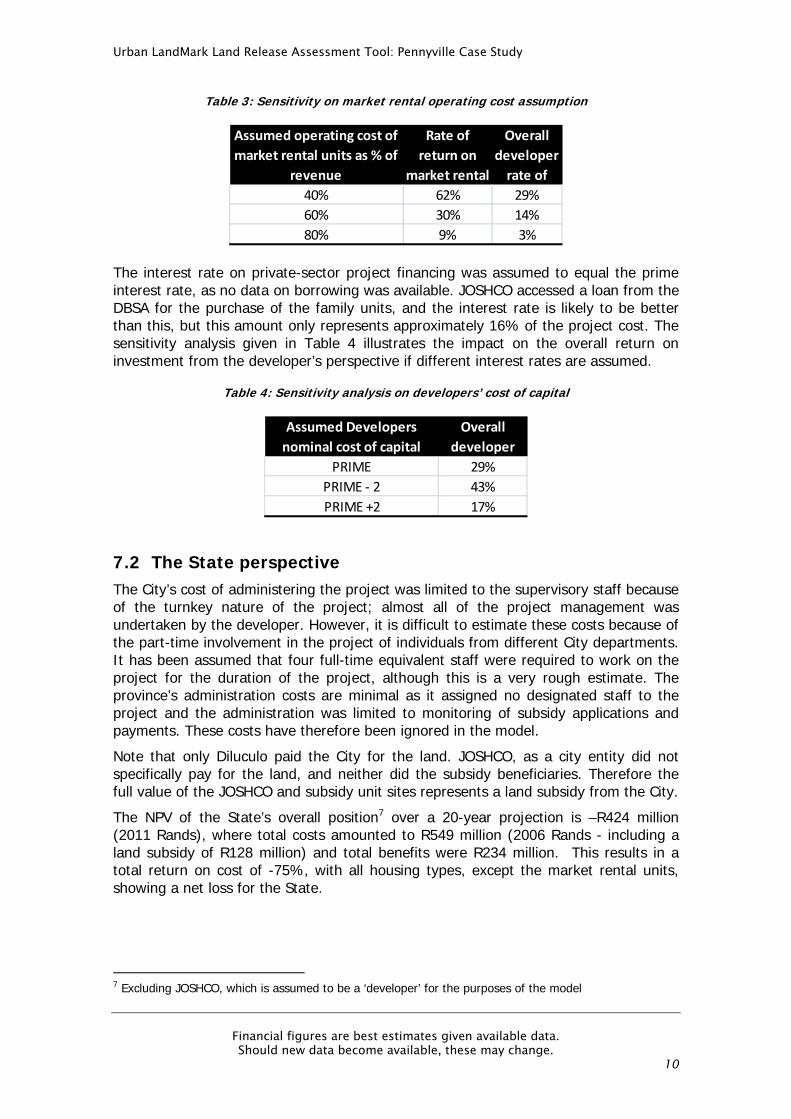
The assumption regarding the monthly operating costs for the market rental units is a significant variable in the calculation of the rate of return on these units. A sensitivity analysis showed that if the operating costs are set at 60% of rental revenue, the rate of return drops to only 30% for the market rental units and 14% for the developer overall, and these returns drop further to 9% and 3% respectively with operating costs set at 80% of revenue (See Table 3).
Urban LandMark Land Release Assessment Tool: Pennyville Case Study
Financial figures are best estimates given available data. Should new data become available, these may change.
10
Table 3: Sensitivity on market rental operating cost assumption
Assumed operating cost of
market rental units as % of
revenue
Rate of
return on
market rental
Overall
developer
rate of
40% 62% 29%
60% 30% 14%
80% 9% 3%
The interest rate on private-sector project financing was assumed to equal the prime interest rate, as no data on borrowing was available. JOSHCO accessed a loan from the DBSA for the purchase of the family units, and the interest rate is likely to be better than this, but this amount only represents approximately 16% of the project cost. The sensitivity analysis given in Table 4 illustrates the impact on the overall return on investment from the developer’s perspective if different interest rates are assumed.
Table 4: Sensitivity analysis on developers’ cost of capital
Assumed Developers
nominal cost of capital
Overall
developer
PRIME 29%
PRIME ‐ 2 43%
PRIME +2 17%
7.2 The State perspective The City’s cost of administering the project was limited to the supervisory staff because of the turnkey nature of the project; almost all of the project management was undertaken by the developer. However, it is difficult to estimate these costs because of the part-time involvement in the project of individuals from different City departments. It has been assumed that four full-time equivalent staff were required to work on the project for the duration of the project, although this is a very rough estimate. The province’s administration costs are minimal as it assigned no designated staff to the project and the administration was limited to monitoring of subsidy applications and payments. These costs have therefore been ignored in the model.
Note that only Diluculo paid the City for the land. JOSHCO, as a city entity did not specifically pay for the land, and neither did the subsidy beneficiaries. Therefore the full value of the JOSHCO and subsidy unit sites represents a land subsidy from the City.
The NPV of the State’s overall position7 over a 20-year projection is –R424 million (2011 Rands), where total costs amounted to R549 million (2006 Rands - including a land subsidy of R128 million) and total benefits were R234 million. This results in a total return on cost of -75%, with all housing types, except the market rental units, showing a net loss for the State.
7 Excluding JOSHCO, which is assumed to be a ‘developer’ for the purposes of the model

Urban LandMark Land Release Assessment Tool: Pennyville Case Study
Financial figures are best estimates given available data. Should new data become available, these may change.
11
Table 5: State performance by housing type
Mix Type Per Unit Total ROI: PV of Return on Total CostSubsidy - single storey -218,538 -238,206,322 -102.9%Subsidy - walk-up -202,205 -93,418,610 -96.1%Social rental - family -164,971 -34,149,079 -92.0%Social rental - rooms -125,549 -70,809,669 -189.4%Market rental 15,418 12,395,849 7.6%
Total NPV -424,187,830 -74.9%
NPV
State revenue includes a VAT benefit from the theoretical sale of the rental units after 20 years, as discussed previously. The cost and benefit components for each of the unit types are separated into up-front flows versus ongoing costs and benefits in Table 6, below:
Table 6: Up-front and ongoing costs from the State perspective
Mix Type Total
Inflows Outflows Net up‐front Inflows Outflows Net on‐going
Subsidy ‐ single storey 0R ‐192,716R ‐192,716R 73,649R ‐99,471R ‐25,822R ‐218,538R
Subsidy ‐ walk‐up 0R ‐176,382R ‐176,382R 73,649R ‐99,471R ‐25,822R ‐202,205R
Social rental ‐ family 55,680R ‐170,989R ‐115,309R 47,587R ‐97,250R ‐49,663R ‐164,971R
Social rental ‐ rooms 7,070R ‐104,329R ‐97,258R ‐R ‐28,291R ‐28,291R ‐125,549R
Market rental 65,600R ‐44,358R 21,242R 153,164R ‐158,988R ‐5,824R 15,418R
Up‐front costs and benefits On‐going costs and benefits
The table above shows the significant up-front costs to the State, with smaller costs in the longer term. It is interesting to note that the model shows losses on service provision to all housing types. While this is expected for the subsidised units (receiving free basic water and electricity and rate rebates), it is not expected for the market rental units, where full cost recovery (and even a small profit) would be likely. This anomaly is most likely due to the default operating costs, tariffs and consumptions entered for these residents being incorrect, and adjustments to these figures may be possible to achieve a more realistic scenario. However, it is also possible that the City tariffs are not covering the full costs of service provision.
Table 7 provides an analysis of the explicit and implicit subsidies provided by the State. The internal services subsidy is shown as applying equally to all units because the housing subsidy was used to service the entire site before the development model was changed. Similarly the bulk infrastructure subsidy applies to all units in the development. Land subsidies apply to all units except the market rental units, for which the land was purchased at what is understood to be a market price from the City. The net result is that the subsidy units obtain the highest subsidy (as would be expected), but the market rental units also benefit from State subsidies.

Urban LandMark Land Release Assessment Tool: Pennyville Case Study
Financial figures are best estimates given available data. Should new data become available, these may change.
12
Table 7: State subsidy analysis
Subsidy ‐
single
Subsidy ‐
walk‐up
Social rental
‐ family
Social
rental ‐
Market
rental
per unit per unit per unit per unit per unit
Explicit subsidies
Institutional subsidy 46,039R 46,039R ‐R ‐R ‐R
Flisp ‐R ‐R ‐R ‐R ‐R
Internal services 21,553R 21,553R 21,553R 7,184R 21,553R
Geo‐tech variance 8,396R 8,396R ‐R ‐R ‐R
Total explicit subsidies 75,988R 75,988R 21,553R 7,184R 21,553R
Other subsidies ‐R ‐R ‐R ‐R ‐R
Land Subsidy 20,216R 15,555R 15,555R 5,185R ‐R
Bulk infrastructure 32,679R 30,636R 23,022R 10,278R 23,122R
Total other subsidies 52,895R 46,191R 38,577R 15,463R 23,122R
Total subsidies 128,883R 122,179R 60,130R 22,647R 44,675R
R ‐
R 20,000
R 40,000
R 60,000
R 80,000
R 100,000
R 120,000
R 140,000
Subsidy ‐single storey
Subsidy ‐walk‐up
Social rental ‐family
Social rental ‐rooms
Market rental
State subsidies by housing type
Bulk infrastructure
Land Subsidy
Geo‐tech variance
Internal services
Institutional subsidy
Figure 4: State subsidies by housing type
It is important to note that there are also implicit rental subsidies that apply to the JOSHCO units, as rental is below cost, and also below possible market rentals. This is reflected as a cost to the developer and not State subsidy because JOSCHO picks up this difference. Whether this subsidy is in turn claimed back from provincial government is not known.
7.3 The Household perspective Costs and benefits for households are discounted to the first date of occupation in the model. This is problematic when considering multiple housing types with different dates of occupation. For this reason, the costs and benefits have been de-escalated to 2006 Rand values and then re-escalated to 2011 Rands to be consistent with the other NPVs for the developer and State.

Urban LandMark Land Release Assessment Tool: Pennyville Case Study
Financial figures are best estimates given available data. Should new data become available, these may change.
13
As the project consists of only subsidised and rental units (i.e. no bonded or gap housing), none of the households would incur finance charges. The subsidised units generate a positive net purchase of approximately R92 000 due to the assumed sale of the property after 20 years, with a 10% nominal annual property value escalation. The discount rate used for the household NPV calculation is prime+1, as was the case for the Cosmo City and Western Cape case studies. In Table 8, all households are shown to receive the benefit of imputed rent, as explained below.
Table 8: Inflows and outflows from the Households’ perspective
Subsidy ‐
single
Subsidy ‐
walk‐up
Social
rental ‐
Social
rental ‐ Market rental
per unit per unit per unit per unit per unit
Inflows
Net Purchase 92,366R 92,366R ‐R ‐R ‐R
Imputed Rent* 172,151R 172,151R 504,090R 96,017R 525,233R
Subsidy ‐R ‐R ‐R ‐R ‐R
Total inflows 264,517R 264,517R 504,090R 96,017R 525,233R
Outflows ‐R ‐R ‐R ‐R ‐R
Electricity ‐42,769R ‐42,769R ‐40,776R ‐R ‐87,895R
Water ‐3,617R ‐3,617R ‐3,356R ‐R ‐9,784R
Property Tax ‐2,537R ‐2,537R ‐R ‐R ‐R
Sewage ‐1,426R ‐1,426R ‐1,323R ‐R ‐3,509R
Refuse Removal ‐8,195R ‐8,195R ‐R ‐R ‐R
Maintenance ‐5,541R ‐5,541R ‐R ‐R ‐R
Insurance ‐R ‐R ‐R ‐R ‐R
Rent ‐R ‐R ‐369,338R ‐61,556R ‐525,233R
Net Purchase ‐R ‐R ‐R ‐R ‐R
Total outflows ‐64,086R ‐64,086R ‐414,794R ‐61,556R ‐626,421R
Net Position 200,431R 200,431R 89,296R 34,461R ‐101,188R
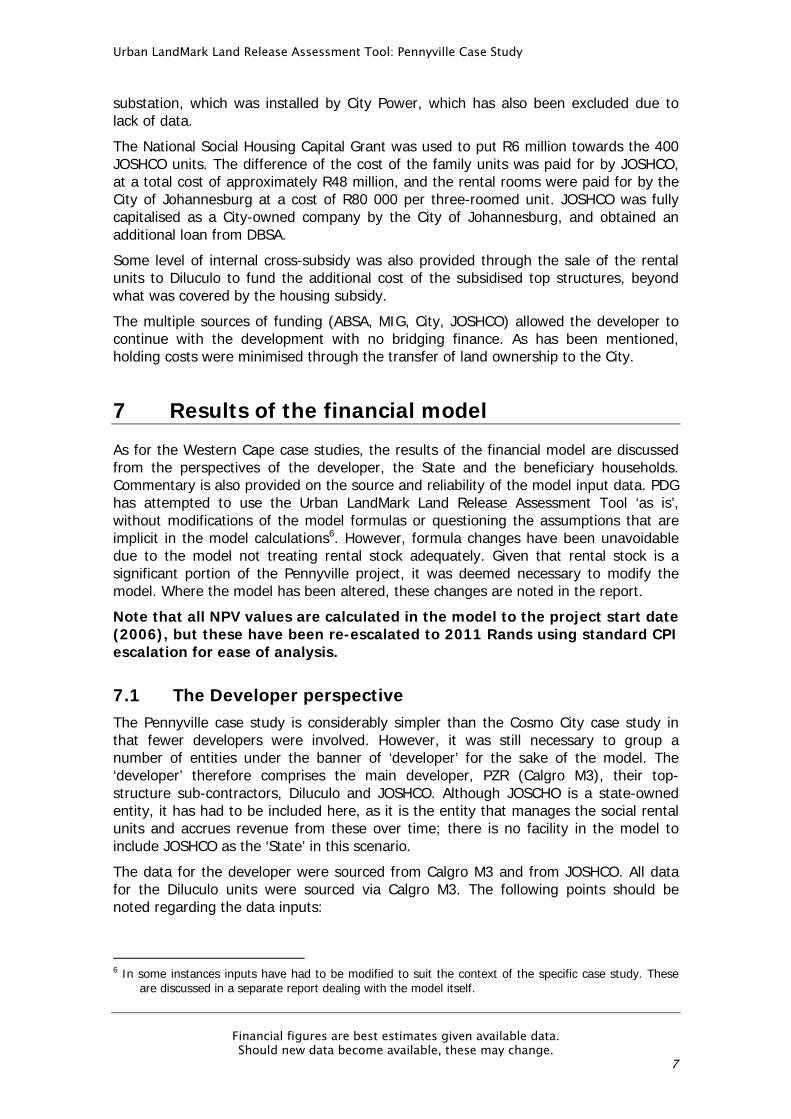
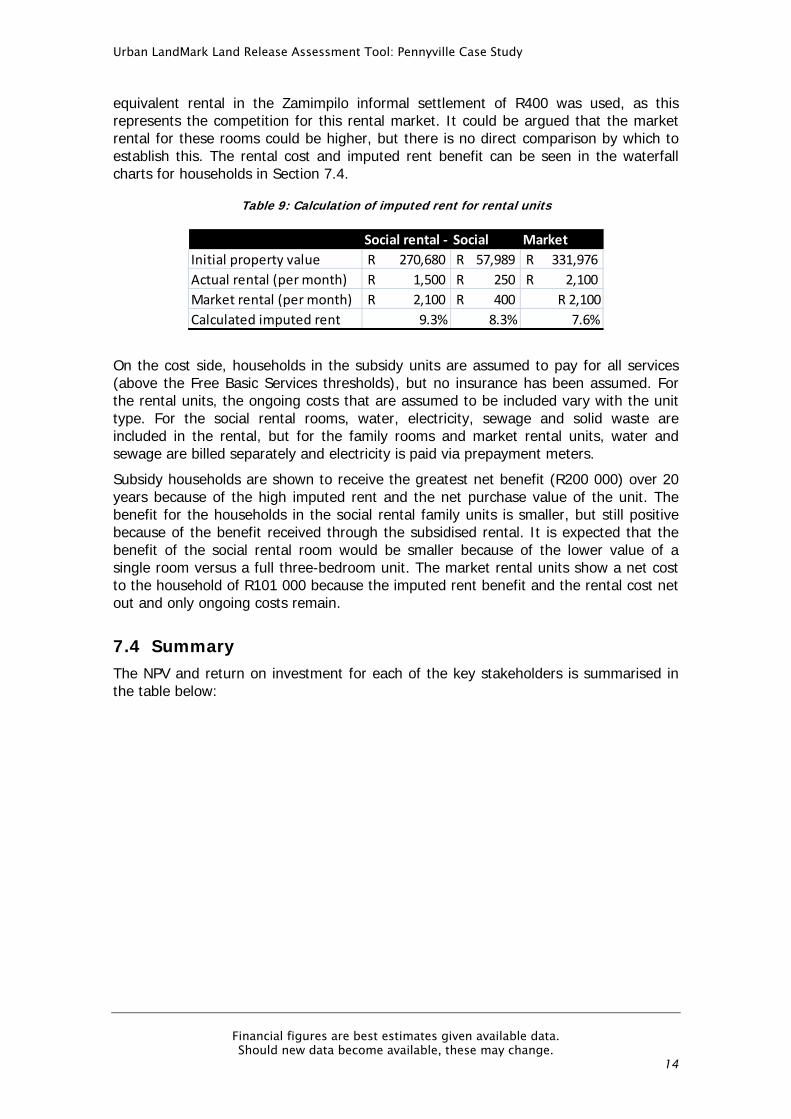
The relationship between actual rent and imputed rent was not made explicit in the previous case studies using the LRA tool. The outputs of the model have therefore been adapted to illustrate this relationship more explicitly. Imputed rent is the benefit that households gain from living in owned accommodation, and is measured by the equivalent rent that would be paid if they were renting the property they lived in. This is estimated by Stats SA as 7% of property value – a figure that has been used in the Western Cape and Cosmo City case studies. However, for households that are renting, imputed rent is equal to the rental that is being paid (provided that it is market-related rental) and thus the net benefit is zero. This has been illustrated by reflecting both the rental and imputed rent for all households, including tenant households. The exception is for social rental, where rentals are below market rental. The net benefit for these households is the imputed rent (market rental) less the actual rent (at a subsidised level). Fortunately, in the case of Pennyville, the social rental family units are equivalent to the Diluculo market rental units, and thus the actual market rental is known and this difference can be calculated. This calculation is shown in Table 9. The resulting imputed rent is between 7.6% and 9.3% of property value, which is close to the Stats SA estimate of 7% used as a default value. For the rental rooms, the
Urban LandMark Land Release Assessment Tool: Pennyville Case Study
Financial figures are best estimates given available data. Should new data become available, these may change.
14
equivalent rental in the Zamimpilo informal settlement of R400 was used, as this represents the competition for this rental market. It could be argued that the market rental for these rooms could be higher, but there is no direct comparison by which to establish this. The rental cost and imputed rent benefit can be seen in the waterfall charts for households in Section 7.4.
Table 9: Calculation of imputed rent for rental units
Social rental ‐ Social Market
Initial property value 270,680R 57,989R 331,976R
Actual rental (per month) 1,500R 250R 2,100R
Market rental (per month) 2,100R 400R R 2,100
Calculated imputed rent 9.3% 8.3% 7.6%
On the cost side, households in the subsidy units are assumed to pay for all services (above the Free Basic Services thresholds), but no insurance has been assumed. For the rental units, the ongoing costs that are assumed to be included vary with the unit type. For the social rental rooms, water, electricity, sewage and solid waste are included in the rental, but for the family rooms and market rental units, water and sewage are billed separately and electricity is paid via prepayment meters.
Subsidy households are shown to receive the greatest net benefit (R200 000) over 20 years because of the high imputed rent and the net purchase value of the unit. The benefit for the households in the social rental family units is smaller, but still positive because of the benefit received through the subsidised rental. It is expected that the benefit of the social rental room would be smaller because of the lower value of a single room versus a full three-bedroom unit. The market rental units show a net cost to the household of R101 000 because the imputed rent benefit and the rental cost net out and only ongoing costs remain.
7.4 Summary The NPV and return on investment for each of the key stakeholders is summarised in the table below:

Urban LandMark Land Release Assessment Tool: Pennyville Case Study
Financial figures are best estimates given available data. Should new data become available, these may change.
15
Table 10: Summary of NPV and ROI for all actors and unit types
NPV and ROI State Developer Household
Total NPV Subsidy ‐ single storey ‐238,206,322R ‐7,345,262R
Subsidy ‐ walk‐up ‐93,418,610R ‐3,113,311R
Social rental ‐ family ‐34,149,079R ‐16,376,045R
Social rental ‐ rooms ‐70,809,669R 691,287R
Market rental 12,395,849R 229,577,850R
Total ‐424,187,830R 203,434,519R
NPV per Unit Subsidy ‐ single storey ‐218,538R ‐6,739R 200,431R
Subsidy ‐ walk‐up ‐202,205R ‐6,739R 200,431R
Social rental ‐ family ‐164,971R ‐79,111R 89,296R
Social rental ‐ rooms ‐125,549R 1,226R 34,461R
Market rental 15,418R 285,545R ‐101,188R
ROI: PV of Return on Total Cost Subsidy ‐ single storey ‐139% ‐11% 422%
Subsidy ‐ walk‐up ‐130% ‐11% 422%
Social rental ‐ family ‐124% ‐15% 29%
Social rental ‐ rooms ‐255% 2% 75%
Market rental 10% 84% ‐22%
Total ‐101% 39% 0%
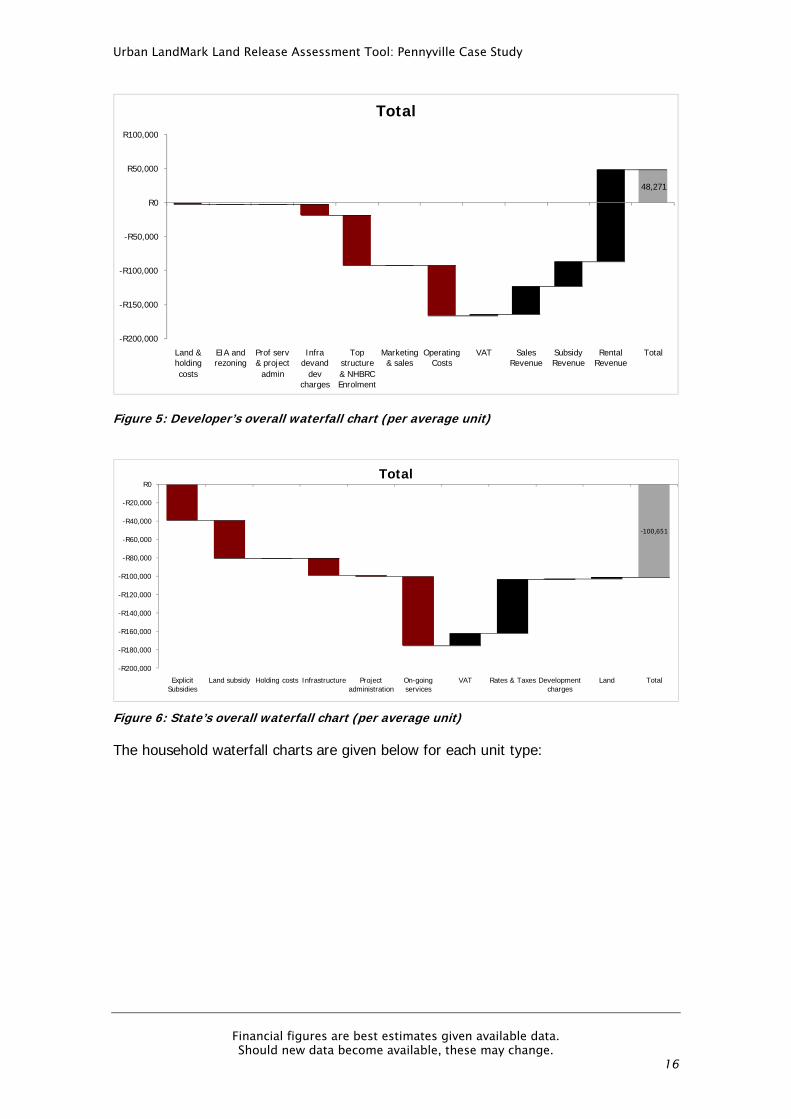
The total NPVs for the developer and the State are split up into inflows and outflows and displayed graphically in the following ‘waterfall’ charts. Note that all costs are average costs per unit in the development (3 127 units in total) and are given to the project start date for the developer and State and to the date of occupation for households8.
8 This is a limitation of the model and is the reason why the waterfall chart figures will differ from those
presented in the tables above.
Urban LandMark Land Release Assessment Tool: Pennyville Case Study
Financial figures are best estimates given available data. Should new data become available, these may change.
16
- 48,271
-R200,000
-R150,000
-R100,000
-R50,000
R0
R50,000
R100,000
Land & holding costs
EIA and rezoning
Prof serv & project
admin
Infra devand
dev charges
Top structure & NHBRC Enrolment
Marketing & sales
Operating Costs
VAT Sales Revenue
Subsidy Revenue
Rental Revenue
Total
Total
Figure 5: Developer’s overall waterfall chart (per average unit)
‐100,651
-R200,000
-R180,000
-R160,000
-R140,000
-R120,000
-R100,000
-R80,000
-R60,000
-R40,000
-R20,000
R0
Explicit Subsidies
Land subsidy Holding costs Infrastructure Project administration
On-going services
VAT Rates & Taxes Development charges
Land Total
Total
Figure 6: State’s overall waterfall chart (per average unit)
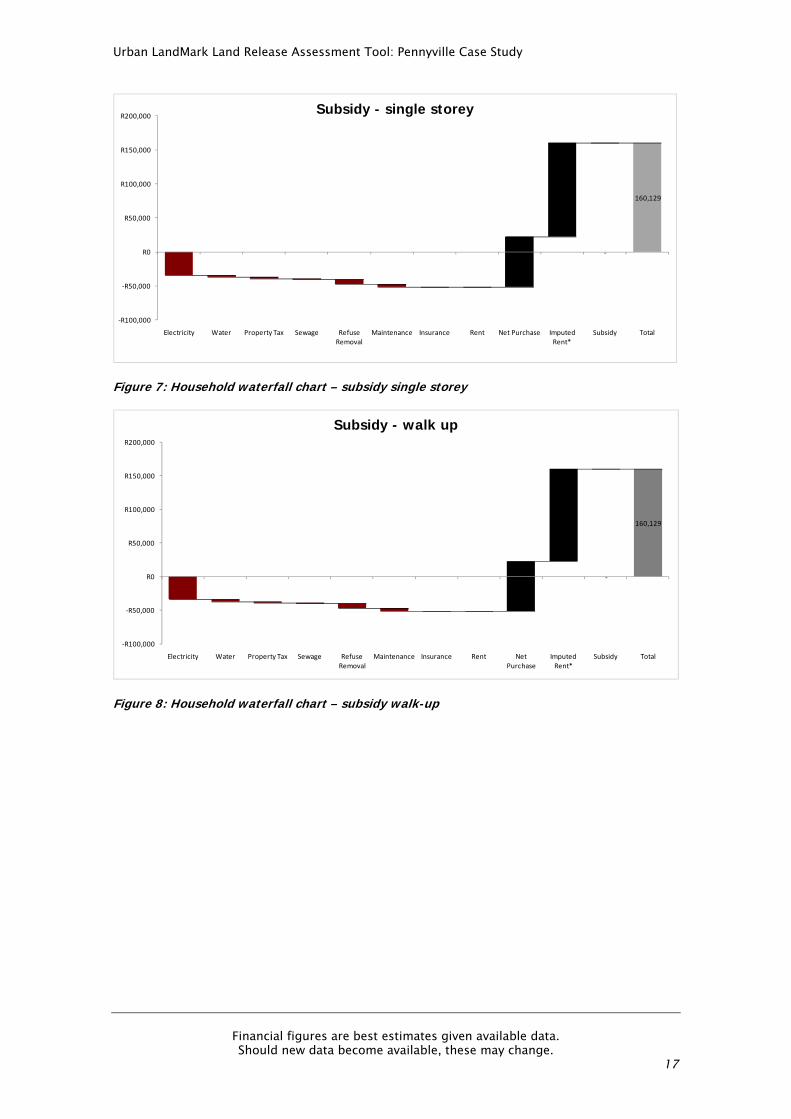
The household waterfall charts are given below for each unit type:
Urban LandMark Land Release Assessment Tool: Pennyville Case Study
Financial figures are best estimates given available data. Should new data become available, these may change.
17
‐
160,129
‐R100,000
‐R50,000
R0
R50,000
R100,000
R150,000
R200,000
Electricity Water Property Tax Sewage Refuse Removal
Maintenance Insurance Rent Net Purchase Imputed Rent*
Subsidy Total
Subsidy - single storey
Figure 7: Household waterfall chart – subsidy single storey
‐
160,129
‐R100,000
‐R50,000
R0
R50,000
R100,000
R150,000
R200,000
Electricity Water Property Tax Sewage Refuse Removal
Maintenance Insurance Rent Net Purchase
Imputed Rent*
Subsidy Total
Subsidy - walk up
Figure 8: Household waterfall chart – subsidy walk-up

Urban LandMark Land Release Assessment Tool: Pennyville Case Study
Financial figures are best estimates given available data. Should new data become available, these may change.
18
‐
75,261
‐R400,000
‐R350,000
‐R300,000
‐R250,000
‐R200,000
‐R150,000
‐R100,000
‐R50,000
R0
R50,000
R100,000
Electricity Water Property Tax Sewage Refuse Removal
Maintenance Insurance Rent Net Purchase Imputed Rent*
Subsidy Total
Social rental - family
Figure 9: Household waterfall chart – social rental family
‐
29,044
‐R60,000
‐R50,000
‐R40,000
‐R30,000
‐R20,000
‐R10,000
R0
R10,000
R20,000
R30,000
R40,000
Electricity Water Property Tax Sewage Refuse Removal
Maintenance Insurance Rent Net Purchase Imputed Rent*
Subsidy Total
Social rental - rooms
Figure 10: Household waterfall chart – social rental rooms
Urban LandMark Land Release Assessment Tool: Pennyville Case Study
Financial figures are best estimates given available data. Should new data become available, these may change.
19
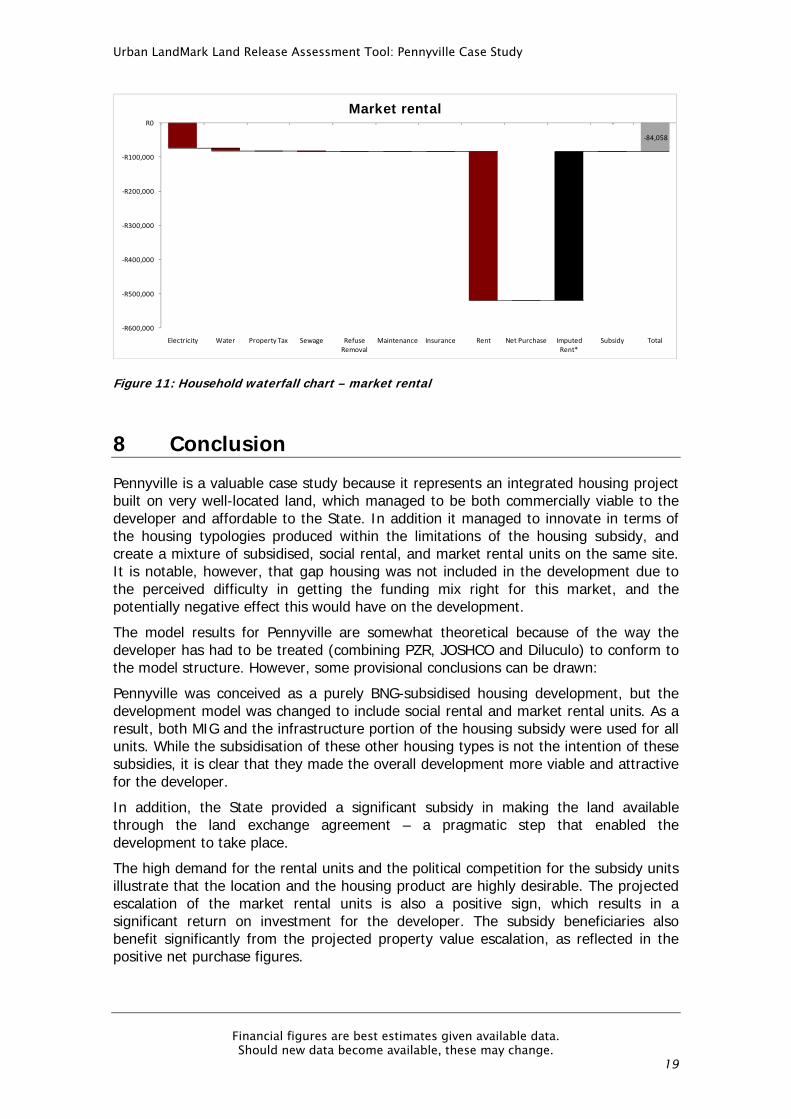
‐
‐84,058
‐R600,000
‐R500,000
‐R400,000
‐R300,000
‐R200,000
‐R100,000
R0
Electricity Water Property Tax Sewage Refuse Removal
Maintenance Insurance Rent Net Purchase Imputed Rent*
Subsidy Total
Market rental
Figure 11: Household waterfall chart – market rental
8 Conclusion
Pennyville is a valuable case study because it represents an integrated housing project built on very well-located land, which managed to be both commercially viable to the developer and affordable to the State. In addition it managed to innovate in terms of the housing typologies produced within the limitations of the housing subsidy, and create a mixture of subsidised, social rental, and market rental units on the same site. It is notable, however, that gap housing was not included in the development due to the perceived difficulty in getting the funding mix right for this market, and the potentially negative effect this would have on the development.
The model results for Pennyville are somewhat theoretical because of the way the developer has had to be treated (combining PZR, JOSHCO and Diluculo) to conform to the model structure. However, some provisional conclusions can be drawn:
Pennyville was conceived as a purely BNG-subsidised housing development, but the development model was changed to include social rental and market rental units. As a result, both MIG and the infrastructure portion of the housing subsidy were used for all units. While the subsidisation of these other housing types is not the intention of these subsidies, it is clear that they made the overall development more viable and attractive for the developer.
In addition, the State provided a significant subsidy in making the land available through the land exchange agreement – a pragmatic step that enabled the development to take place.
The high demand for the rental units and the political competition for the subsidy units illustrate that the location and the housing product are highly desirable. The projected escalation of the market rental units is also a positive sign, which results in a significant return on investment for the developer. The subsidy beneficiaries also benefit significantly from the projected property value escalation, as reflected in the positive net purchase figures.

Urban LandMark Land Release Assessment Tool: Pennyville Case Study
Financial figures are best estimates given available data. Should new data become available, these may change.
20
The high NPV calculated for the developer represents the benefit to all ‘developers’ assuming that the rental stock is retained for 20 years. The actual profit to the main developer (Calgro M3) will be less than this, and the rental stock will almost certainly not be retained by Diluculo for this period. The developer’s rate of return is highly sensitive to the cost of capital assumed in the model.
The State makes a loss on all units, with the loss on the subsidy units and the largest negative return on investment on the social rental rooms. The minor loss on the market rental units is surprising, but may be due to errors in the operating costs of servicing these units. It would be expected that the City would at least cover the costs of servicing the units through the tariffs.
Households receiving a subsidy unit achieve the highest net benefit after 20 years, with households in the social rental units also achieving substantial benefits through the subsidised rental of the JOSHCO units. As expected, the market rental units produce a net cost for the tenant households.
Urban LandMark Land Release Assessment Tool: Pennyville Case Study
Financial figures are best estimates given available data. Should new data become available, these may change.
21
References
Affordable Land and Housing Data Centre (2011) On-line housing and land resource, developed by Finmark Trust, Urban LandMark, Eighty20 and Lightstone. http://www.alhdc.org.za/ . Accessed on 04 April 2011.
Rust (2009) Gap Housing: The Next Property Boom - A conference on innovative funding and delivery. Input to the I H S Conference (16 September 2009): What is the gap market?