Embed Size (px)
Citation preview

International Scientific Conference March 26-27 2012 on Sustainable Development & Ecological Footprint Sopron, Hungary
Urban Land Cover Mapping Based on Object Oriented
Classification Using WorldView 2 Satellite Remote Sensing
Images
XIAOCHENG ZHOUa –TAMÁS JANCSÓ
b –CHONGCHENG CHEN
a –MALGORZATA
WOJTASZEK VERŐNÉb
a. Key Laboratory of Spatial Data Mining & Information Sharing of Ministry of Education, Spatial Information Research Center of Fujian Province, Fuzhou University, 350002,China;
b. University of West Hungary, Faculty of Geoinformatics, Szekesfehervar, H-8000, Hungary
Abstract –Land use and Land cover (LULC) map is important basic data for assessing eco-environment. The present study highlights the potential advantage of the WorldView-2 image, which can provide more detailed land cover map at local level. The poster deals with the problem, how to classify worldview 2 image with object-oriented image analysis method and get the detailed land cover map. A decision tree for classifying the worldview 2 images in Szekesfehervar, Hungary was proposed. Main steps are as follows: First, multi-scale segmentation; Second, feature extraction and selection; Third, creation of process tree with the rule set. Forth, classification and accuracy assessment. The result shows that a total of nine LULC classes have been successfully classified with overall classification accuracy of 79.4%. More than 85% classification accuracy, in terms of producer’s accuracy, is achieved for five classes (water, forest, crop, building with brick roof, others building), with highest for water (100%). Urban area and suburban can be effectively distinguished with multi-scale object-oriented classification technique. Moreover, the new bands of Seashore are found to be very important for discrimination of bare arable land from other land cover. Class related feature such as the distance to tree or shadow is significant for distinguishing the building from some special land cover class, for example some bare land with higher water content.
Keywords: WorldView 2 / object-oriented classification / urban land cover/ high resolution remote sensing
1. Introduction
Presently, the importance of urban studies that can guide more efficient city planning policies has been increased in the context of recent massive urban sprawl and the generally accepted need for environmental protection (Grimm, 2008). One of the most basic data of urban planning is based on the land cover map of the city, which can be obtained most efficiently with help of remote sensing data.
Nevertheless, automatic classification approaches proposed by research in the last few years still face some limitations. These limitations are no longer related to the coarse spatial resolution of the sensors, because for the last ten years imagery from several space-borne sensor systems with sub-meter spatial resolution have been available (Rogan, 2004). Obtaining better results is most frequently hampered by the fact that these sensors provide images with only four spectral bands (generally named blue, green, red and infra-red), which makes the distinction of urban land cover classes of similar coloration a difficult task ( Lu,2009,2011; Tessio,2011) .
With the launch of the WorldView-2 (WV-2) satellite, a high spatial resolution remote sensing data with eight spectral bands ranging from blue to the near infrared parts of the electromagnetic spectrum can be acquired [5]. According to its manufacturer, the additional
International Scientific Conference March 26-27 2012 on Sustainable Development & Ecological Footprint Sopron, Hungary
2
Coastal Blue (400–450 nm), Yellow (585–625 nm), Red-Edge (705–745 nm) and NearIR-2 (860–1,040 nm) bands can provide an increase of up to 30% in the classification accuracy. The recently launched WorldView-2 (WV-2) sensor’s 8-band imagery provides a cost-effective combination of sufficient spectral resolution of 8 bands and a very high spatial resolution of 0.5 m. This combination of fine spatial and spectral resolutions, for the first time, has presented new opportunities for detailed urban land cover classification applications.
The objective of this study is to Access WorldView-2 (WV-2) imagery regarding its potential for object-based urban land cover classification. (Blaschke, 2010).
2. Study area and data
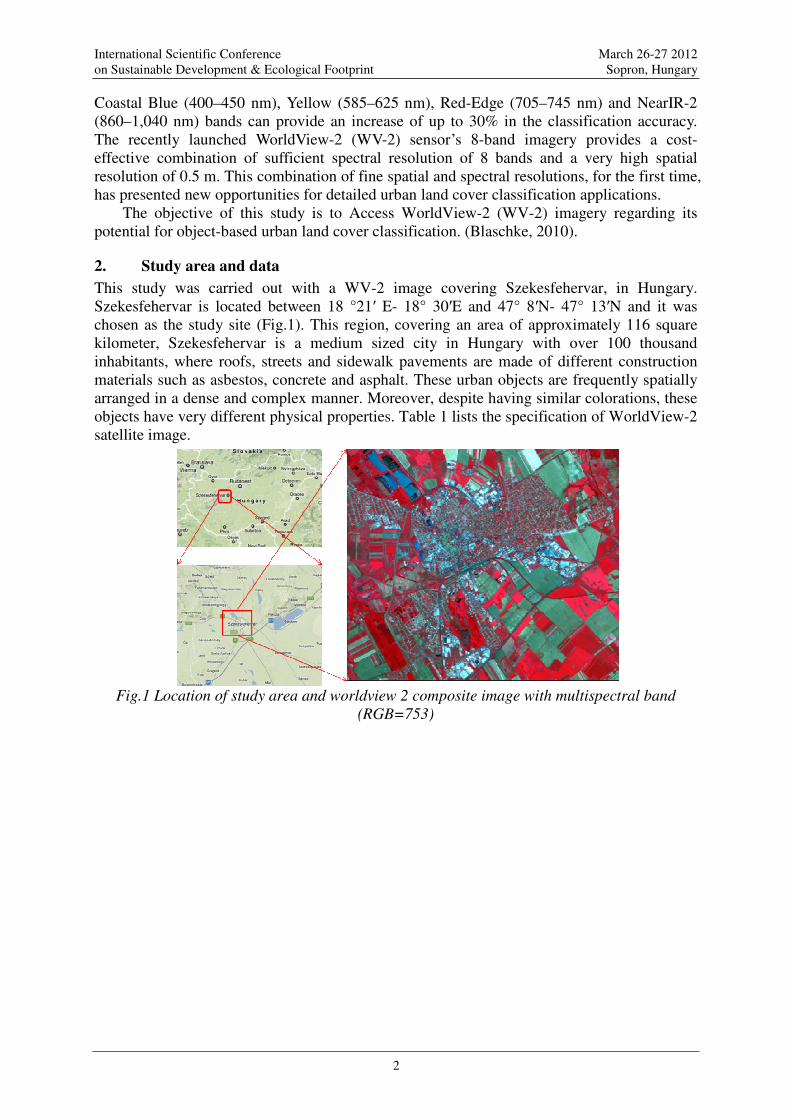
This study was carried out with a WV-2 image covering Szekesfehervar, in Hungary. Szekesfehervar is located between 18 °21′ E- 18° 30′E and 47° 8′N- 47° 13′N and it was chosen as the study site (Fig.1). This region, covering an area of approximately 116 square kilometer, Szekesfehervar is a medium sized city in Hungary with over 100 thousand inhabitants, where roofs, streets and sidewalk pavements are made of different construction materials such as asbestos, concrete and asphalt. These urban objects are frequently spatially arranged in a dense and complex manner. Moreover, despite having similar colorations, these objects have very different physical properties. Table 1 lists the specification of WorldView-2 satellite image.
Fig.1 Location of study area and worldview 2 composite image with multispectral band
(RGB=753)

International Scientific Conference March 26-27 2012 on Sustainable Development & Ecological Footprint Sopron, Hungary
3
Table 1 Specification of WorldView-2 satellite image Satellite WorldView-2 Sensor Panchromatic (Pan)
Multispectral (MS) Spectral bands Pan (450-800 nm)
Band 1, Coastal (400-450 nm) Band 2, Blue (450-510 nm) Band 3, Green (510-580 nm) Band 4, Yellow (585-625 nm) Band 5, Red (630-690 nm) Band 6, Red Edge (705-745 nm) Band 7, NIR1 (770-895 nm) Band 8, NIR2 (860-1040 nm)
Spatial resolution 0.5 m (Pan), 2.0 m (MS) Swath 16.4 km at nadir
Operating altitude 770 km Average revisit time 1.1day Collection capacity 550000 km2 day-1
3. Methodology
Object oriented image classification has been applied successfully to high resolution remote sensing image (Lucieer,2008; Mathieu,2007). In this study, A multi-level object based hierarchical classification was performed, which models the image region at different levels of objects starting from vegetation cover at the coarse scale to individual building at a finer scale.
For most urban remote sensing applications and for most of those ones, which are based on very high spatial resolution data, the object-based image analysis approach is advantageous. Object-based image classification involves three main steps: (1) Determination of appropriate segmentation parameters; (2) Feature selection for the classification based on objects; (3) Creation of classification rule sets or the application of a classification algorithm. Therefore, this investigation on the importance of the WV-2 additional bands regarding urban land cover classification is related to each of these different object-based classification steps (Tessi , 2011).
3.1 Data preprocessing
WorldView 2 multispectral (MS) image was classified in this study. The MS WV2 image with eight bands was orthorectified based on the topographic map with scale of 10000 and DEM with scale of 50000, RMS error is less than one pixel. The orthorectifed WV-2 image was converted into 8 bit unsigned image after resample.
3.2 Multi-scale Segmentation
In order to take complete advantage of both, the spatial and spectral information, an object based approach utilizing a group of pixels is adopted. An Image object/segment can be defined as a group of contiguous pixels that share some similar characteristics and the process of obtaining these objects is called as segmentation.
The Object based hierarchical classification is realized first by using a segmentation algorithm based on Fractal Net Evolution approach (Yu et al, 2006) available in the eCognition software. This segmentation is a bottom-up region growing technique which begins with image objects in the size of one pixel and then gradually grows by merging adjacent objects. The assimilation of objects depends on the average heterogeneity of the

International Scientific Conference March 26-27 2012 on Sustainable Development & Ecological Footprint Sopron, Hungary
4
object weighted by its size and stops when user-defined criteria are reached (Benz et al, 2004; Baatz and Schape, 2000).
The size of the segments is highly dependent on the scale at which they are generated. By varying the scale parameter, objects of different sizes with varying homogeneity criterion are produced. The objects of interest typically appear on different scales in an image simultaneously (Baatz and Schape, 2000) and correspond to a different sub-class of the same category depending on the aggregation level. A hierarchy, therefore, exists amongst these classes which are often ignored in a traditional classifier that works on a single fixed scale. The objective is to model the land cover as a network of cascading structures. Multiple scales are used to represent different levels of this structure and the objects in the next level of the hierarchy are dependent on and nested into their parent object in the previous level (Benz et al, 2004; Definiens, 2009).
WV 2 image was segmented with Multi-resolution segmentation algorithm based on the Definiens eCognition Developer ver. 8.64. For segmenting the WV-2 imagery, all the eight bands were used.
Based on a trial-and-error analysis, two level object layers were created according to the patch size of land cover classes. Following parameters of the multi-resolution Segmentation algorithm were defined:
Level 1 object layer: weight is 1.0 for eight bands; Scale parameter is 30; color parameter is 0.9, and compactness parameter is 0.5.
102098 objects was created in the level 1 object layer based on the segmentation parameters described above. The Level 1 object layer is suitable for extracting building, road, tree, shadow and grass in the test area according to its object size.
Level 2 object layer derived from Level 1 object layer through merging objects in the level 1 object layer with a scale parameter of 350, and 831 image objects was created in the level 2 layer. The level 2 object layer is suitable for extracting forest, crop, arable land and water according to its object size.
The segments obtained this way were considered in the subsequent feature selection analysis.
3.3 . Feature extraction and Selection
3.3.1. Customized features
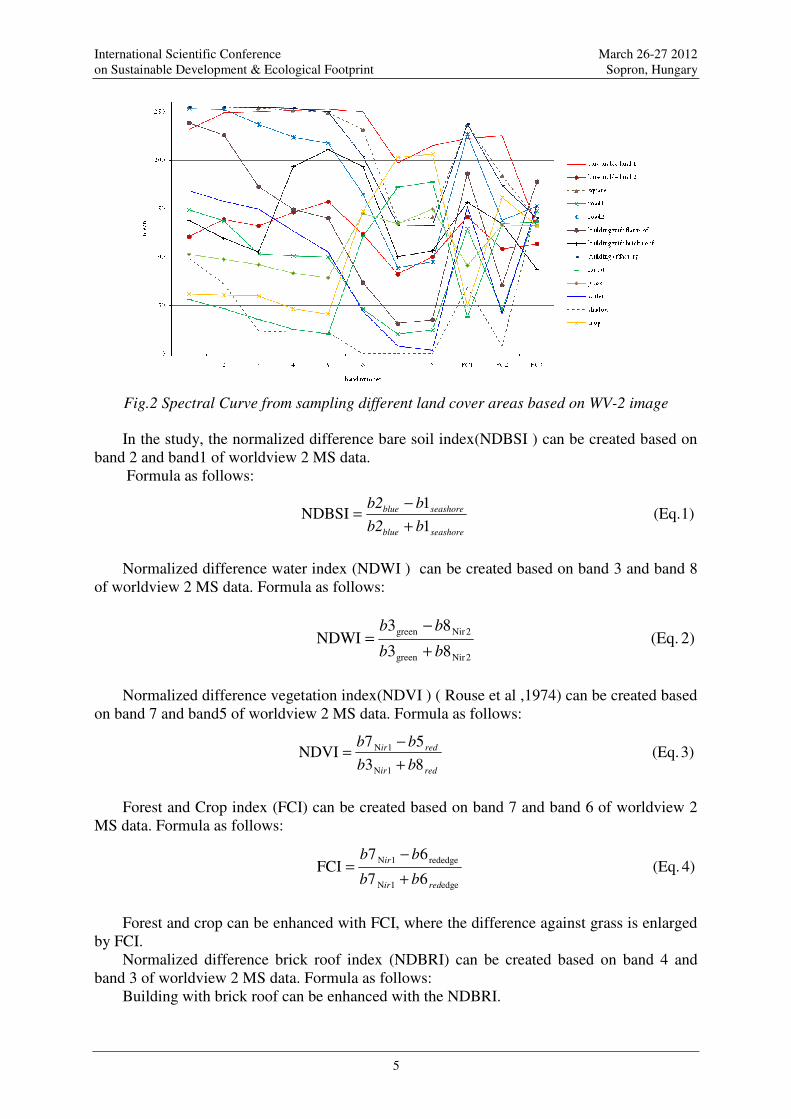
Spectral mean curve based on samples was analyzed in order to take advantage of the richer spectral feature in the WV 2 data comparing to a general high spatial resolution data such as QuickBird or IKONOS. Some normalized difference index can be created according to the spectral mean curve in different bands including the first three principle component based on principle component analysis (Fig.2).
International Scientific Conference March 26-27 2012 on Sustainable Development & Ecological Footprint Sopron, Hungary
5
Fig.2 Spectral Curve from sampling different land cover areas based on WV-2 image
In the study, the normalized difference bare soil index(NDBSI ) can be created based on
band 2 and band1 of worldview 2 MS data. Formula as follows:
Normalized difference water index (NDWI ) can be created based on band 3 and band 8
of worldview 2 MS data. Formula as follows:
Normalized difference vegetation index(NDVI ) ( Rouse et al ,1974) can be created based
on band 7 and band5 of worldview 2 MS data. Formula as follows:
Forest and Crop index (FCI) can be created based on band 7 and band 6 of worldview 2
MS data. Formula as follows:
Forest and crop can be enhanced with FCI, where the difference against grass is enlarged
by FCI. Normalized difference brick roof index (NDBRI) can be created based on band 4 and
band 3 of worldview 2 MS data. Formula as follows: Building with brick roof can be enhanced with the NDBRI.
1) (Eq. 1
1NDBSI
seashoreblue
seashoreblue
bb2
bb2
+
−
=
2) (Eq. 83
83NDWI
2Nirgreen
2Nirgreen
bb
bb
+
−
=
3) (Eq. 83
57NDVI
1N
1N
redir
redir
bb
bb
+
−
=
4) (Eq. 67
67FCI
edge1N
rededge1N
redir
ir
bb
bb
+
−
=

International Scientific Conference March 26-27 2012 on Sustainable Development & Ecological Footprint Sopron, Hungary
6
Some special bare land will be confused with built up area, the problem may be solved
with class-related features. For example, the feature distance to shadow computed from unclassified objects and shadow can be used for identifying buildings when shadow can be detected exactly.
3.3.2. Feature selection
To determine the most relevant features to be used in classification routines is not always an easy task when conventional exploratory analyses are carried out (e.g., scatter plot, histograms, feature values shown in grey levels, etc.). This is especially true when hyper-spectral imagery is used or when object-based image classification is performed. When approaching a classification problem through the object-based method, hundreds or even thousands of object-based spectral and textural features, not to mention geometrical and contextual features, can be created and then used for classification rule generation. When using conventional four-band imagery, e.g., QuickBird, IKONOS etc., the Definiens Developer system automatically creates hundreds of spectral and textural features. Because the WV-2 has twice as many bands compared to these sensors, the bundle of available features make a detailed qualitative exploratory analysis of such features a very time-consum-ing task (Van, 2007). This makes the use of feature selection and dimensionality reduction algorithms particularly interesting. Feature space optimization (FSO) tools were used to help identify optimal feature for distinguishing different classes according to patterns expressed in the training data.
FSO reports separation distances so that the user can evaluate the relative separation between classes (of training samples). Separation distances are represented by coefficients, typically reported on a scale of 0 to 1, which provide a relative measure of the ability of nearest neighbor to separate classes in feature space according to the selected features.
3.4 . Object Based Hierarchical Classification At the level 2 layer of the hierarchy there is a basic distinction between water and non water , vegetation and non vegetation, performed at a coarse scale in this study. Following this, urban regions are masked out and impervious objects are further classified into building and road etc. This multi-level object based hierarchical classification successively masks out irrelevant regions, thereby greatly reducing complexity of classification which occurs in the next level of detail. However, the classification accuracy at the finer level is also dependent on the accuracy at the higher level because the errors can be propagated to the next level. Carefully selected scale and well-suited classifiers should be selected to shrink this impact.
In this study, an object based hierarchical classification decision rule tree was proposed. The decision tree of hierarchical object-oriented classification of the urban land cover in this study is given in Fig.3.
5) (Eq. 34
34NDBRI
greenyellow
greenyellow
bb
bb
+
−
=

International Scientific Conference March 26-27 2012 on Sustainable Development & Ecological Footprint Sopron, Hungary
7
Fig.3 Decision tree of object-oriented classification
Level 2 object layer
For distinguishing between water and land classes, the Normalized Difference Water Index (NDWI), developed by McFeeters (1996) was used. After that, vegetation in suburban and others land cover was separated by the feature threshold from NDVI and Stand deviation band 1. Furthermore, we can distinguish forest from crop by the threshold of standard deviation NDVI .On the other hand, urban area and bare arable land can be separated by the proposed new feature of NDBSI.(Fig.3 )
Level 1 object layer
Using the results from the level 2 object layer as a mask, this level focused on finer classification of the urban land cover objects into tree stands, grass and shadow, road,building with brick roof, etc. Vegetation in urban area can be distinguished from non vegetation in urban area by NDVI threshold based on urban area mask resulted from Level 2 layer. Second, trees and grass in urban area can be distinguished by combining FCI and standard deviation NDVI feature. In the other hand, building with brick roof can be extracted with NDBRI from the non vegetation in urban area. Shadow can be extracted from non brick roof area by feature max diff.>2 and NDWI. Road can be extracted from non shadow by feature length/width (Fig.3)
Class related feature distance to shadow can be created after the shadow has been extracted. Additionally, class related feature distance to tree and distance to brick roof can also be extracted. By this way we can distinguish others buildings from special bare land with the three-class related features above based on non road mask.
International Scientific Conference March 26-27 2012 on Sustainable Development & Ecological Footprint Sopron, Hungary
8
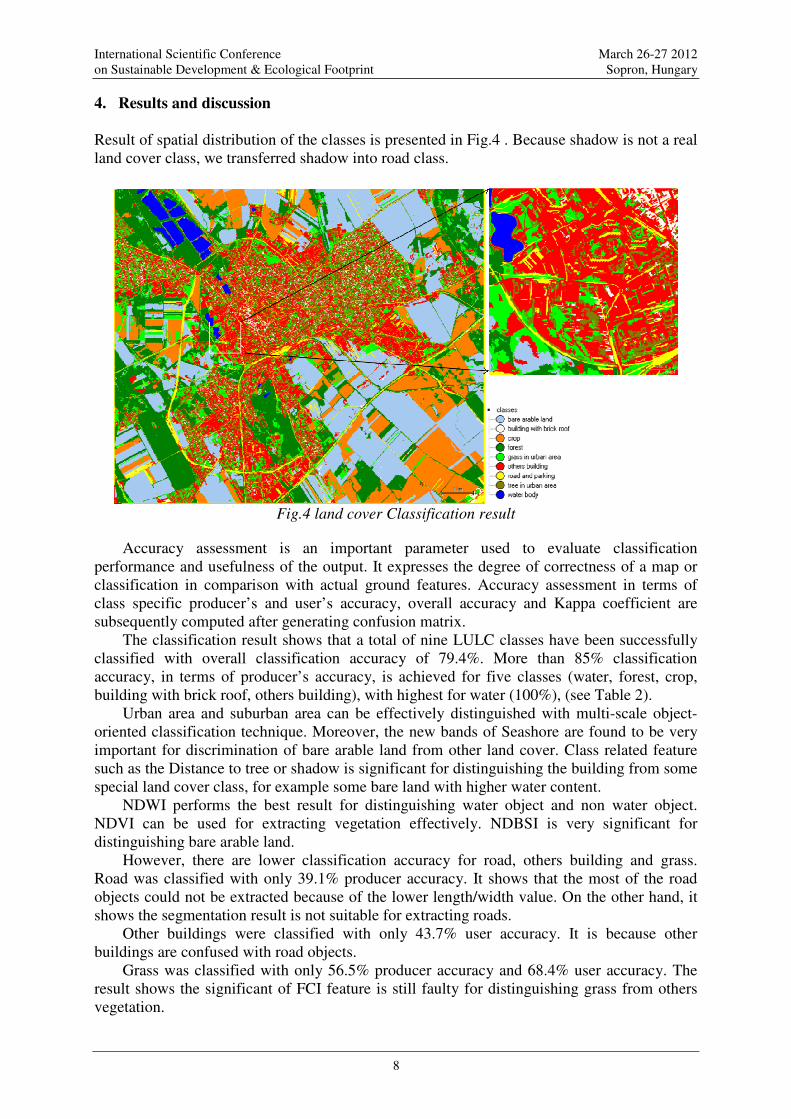
4. Results and discussion
Result of spatial distribution of the classes is presented in Fig.4 . Because shadow is not a real land cover class, we transferred shadow into road class.
Fig.4 land cover Classification result
Accuracy assessment is an important parameter used to evaluate classification
performance and usefulness of the output. It expresses the degree of correctness of a map or classification in comparison with actual ground features. Accuracy assessment in terms of class specific producer’s and user’s accuracy, overall accuracy and Kappa coefficient are subsequently computed after generating confusion matrix.
The classification result shows that a total of nine LULC classes have been successfully classified with overall classification accuracy of 79.4%. More than 85% classification accuracy, in terms of producer’s accuracy, is achieved for five classes (water, forest, crop, building with brick roof, others building), with highest for water (100%), (see Table 2).
Urban area and suburban area can be effectively distinguished with multi-scale object-oriented classification technique. Moreover, the new bands of Seashore are found to be very important for discrimination of bare arable land from other land cover. Class related feature such as the Distance to tree or shadow is significant for distinguishing the building from some special land cover class, for example some bare land with higher water content.
NDWI performs the best result for distinguishing water object and non water object. NDVI can be used for extracting vegetation effectively. NDBSI is very significant for distinguishing bare arable land.
However, there are lower classification accuracy for road, others building and grass. Road was classified with only 39.1% producer accuracy. It shows that the most of the road objects could not be extracted because of the lower length/width value. On the other hand, it shows the segmentation result is not suitable for extracting roads.
Other buildings were classified with only 43.7% user accuracy. It is because other buildings are confused with road objects.
Grass was classified with only 56.5% producer accuracy and 68.4% user accuracy. The result shows the significant of FCI feature is still faulty for distinguishing grass from others vegetation.

International Scientific Conference March 26-27 2012 on Sustainable Development & Ecological Footprint Sopron, Hungary
9
Only Multi-spectral (MS) bands were classified in the study. There is still potential to identity other classes in urban area based on worldview 2 image, such as square or building of factory, when the panchromatic band will be merged with MS band, since shadow maybe be more accurately detected from the higher resolution image.
Table2 Classification accuracy
LULC category Producer accuracy(%)User accuracy(%)
Water 100 100
Forest 93.0 93
Crop 88.4 95.8
Bare arable land 83.3 100
Building with brick roof 97.0 97
Road 39.1 85.7
Others building 95.4 43.7
Tree 84.3 96.4
Grass 56.5 68.4
Overall classification accuracy 79.4% Overall Kappa statistics 0.768
5.Conclusion
Our results lead to the conclusion that spectrally similar classes like forest and tree, impervious surface and bare soil, water and shadow can be better distinguished when the additional bands of the WV-2 sensor are used throughout the object-based classification process.
The new feature as NDBSI was proposed based on band 2(blue)and band 1(coastal. Bare soil surface can be enhanced with the NDBSI. Class related feature such as the Distance to tree or shadow is significant for distinguishing the building from some special land cover class, for example some bare land with higher water content.
Urban area and suburban area can be effectively distinguished with multi-scale object-oriented classification technique.
There is still potential to identity other classes in urban area based on worldview 2 images, such as square, building of factory, when the panchromatic band will be merged with MS band.
Acknowledgement
We acknowledge the IGIT international cooperation project, Seventh Framework Program of the European Union (code: PIRSES-GA-2009-247608) for financial support during the realization of this study. This paper is also funded by the Key Laboratory of Urban Environment and Health Institute of Urban Environment, Chinese Academy of Sciences(Code: KLUEH201002and Hungarian TÁMOP-4.2.1/B-09/1/KONV-2010-0006 project aiming a complex ecological study in urban environment .

International Scientific Conference March 26-27 2012 on Sustainable Development & Ecological Footprint Sopron, Hungary
10
References
Blaschke, T. (2010). Object based image analysis for remote sensing. ISPRS J. Photogramm. 65,2-16. Benz, U.C.; Hofmann, P.; Wilhauch, G.;etc al.(2004) .Multi-resolution,object-oriented fuzzy analysis
of remote sensing data for GIS-ready information. ISPRS J. Photogramm. 58, 239-258. Baatz, M., & Schape, A. (2000). Multiresolution segmentation- An optimization approach for high
quality multiscale image segmentation. In Angewandte Geographische Informationsverarbeitung XII. (Eds: Strobl, J. and Blaschke, T.), Beitrage zum AGIT- Symposium Salzburg 2000, Karhlsruhe, Herbert Wichmann Verlag, pp.12–23
Definiens A. Definiens developer 8 Reference Book . Germany, 2009. Grimm, N.B.; Faeth, S.H.; Golubiewski, N.E.; etc al.(2008).Global change and the ecology of cities.
Science, 319, 756-760. Lucieer VL. Object-oriented classification of sidescan sonar data for mapping benthic marine habitats.
International Journal of Remote Sensing, 2008, 29(3): 905–921. Lu, D.; Weng, Q. (2009).Extraction of urban impervious surfaces from IKONOS imagery. Int. J.
Remote Sens. 30, 1297-1311. Lu, D.; Hetrick, S.; Moran, E. (2011).Impervious surface mapping with QuickBird imagery. Int.
J.Remote Sens., 32, 2519-2533. Mathieu , R , Aryal ,J. (2007).Mapping private gardens in urban areas using object-oriented techniques
and very high-resolution satellite imagery. Landscape and Urban Planning, 81(3): 179-192. Moonmoon H, Baruah, D. C.; (2011).Land use and land cover classification for biomass energy
assessment using high resolution WorldView-2 satellite image (http://dgl.us.neolane.net/res/img/a910acc0f913852f25117fee909c59a6.pdf
Rogan, J.; Chen, D. (2004). Remote sensing technology for mapping and monitoring land-cover and land-use change. Progress in Planning. 61, 301-325.
Van Coillie, FMB;Verbeke, LPC;etc al.( 2007).Feature selection by genetic algorithms in object-based classification of IKONOS imagery for forest mapping in Flanders, Belgium. Remote Sensing of Environment, (110 ): 476–487.