Embed Size (px)
Citation preview

Remar 1
URBAN HEAT ISLAND EXPANSION IN THE GREATER LAS VEGAS METROPOLITAN AREA
By
Alex Remar
Advisor:
Dr. William Preston
Earth and Soil Sciences Department
California Polytechnic State University
San Luis Obispo
2010

Remar 2

Remar 3
ABSTRACT
The growth of human settlements into vast urban metropolitan areas is often
accompanied by relatively higher temperatures in comparison with surrounding rural
country sides, a phenomenon known as the “urban heat island effect.” The city of Las
Vegas has been selected as an examination of this trend because of its unprecedented
urban growth in the last 50 years, which has been mapped by satellite imagery for several
decades. Studying the growth of Las Vegas’ relatively new heat island can provide
valuable insight into the causes and magnitude of all urban heat islands in general.
In this investigation, a series of temperature records were collected between the
years 1973 and 2009 from two weather stations: one located in an urban area and the
other located in a nearby rural area. The records from these weather stations were used to
construct tables and figures in order to directly and effectively compare Las Vegas’ urban
and rural climates. Analysis shows that the minimum temperatures in Las Vegas’ urban
areas have been increasing at significantly higher rates than surrounding rural minimum
temperatures. This trend has been especially pronounced since the early 1990’s, when
the urban weather station used in this analysis became entirely surrounded by urban
features. A comparative analysis of Las Vegas’ rural and urban temperature data
produces statistically significant evidence for the presence of an urban heat island effect
in the area.

Remar 4
TABLE OF CONTENTS
Title Page………………………………………………………………………………….i
Approval Page………………………………………………………………...…….……ii
Abstract………………………………………………………………………………….iii
Table of Contents………………………………………………………………………..iv
Introduction………………………………………………………………………………1
Background………………………………………………………………………1 Objectives…………………………………………………………………………3 Materials and Methods…………………………………………………………………..4
Acquiring Satellite Imagery……………………………………………………..4 Selection of Weather Stations…………………………………………………...5 Acquisition of Data………………………………………………………………6 Results and Discussion…………………………………………………………………...7
(1) Maximum Monthly Temperatures………………………………………….8 (2) Minimum Monthly Temperatures…………………………………………..9 (3) Diurnal Temperature Ranges…………………………………………..….12 (4) Urban and Rural Minimum Temperature Differences………………..…14
Conclusion………………………………………………………….………………..….15
References…………………………………………………………………….….……...19
Appendices…………………………………………………………….………….……..20
Appendix A: Satellite Images of Las Vegas Area………………………….....20 Appendix B: Tables of Weather Station Data………………………….……..24 Appendix C: Figures from Examination Method One……………..….….....26
Appendix D: Figures from Examination Method Two…...…………….…....30 Appendix E: Tables and Figures from Examination Method Three………..34 Appendix F: Table and Figures from Examination Method Four………......40

Remar 5
Remar 6
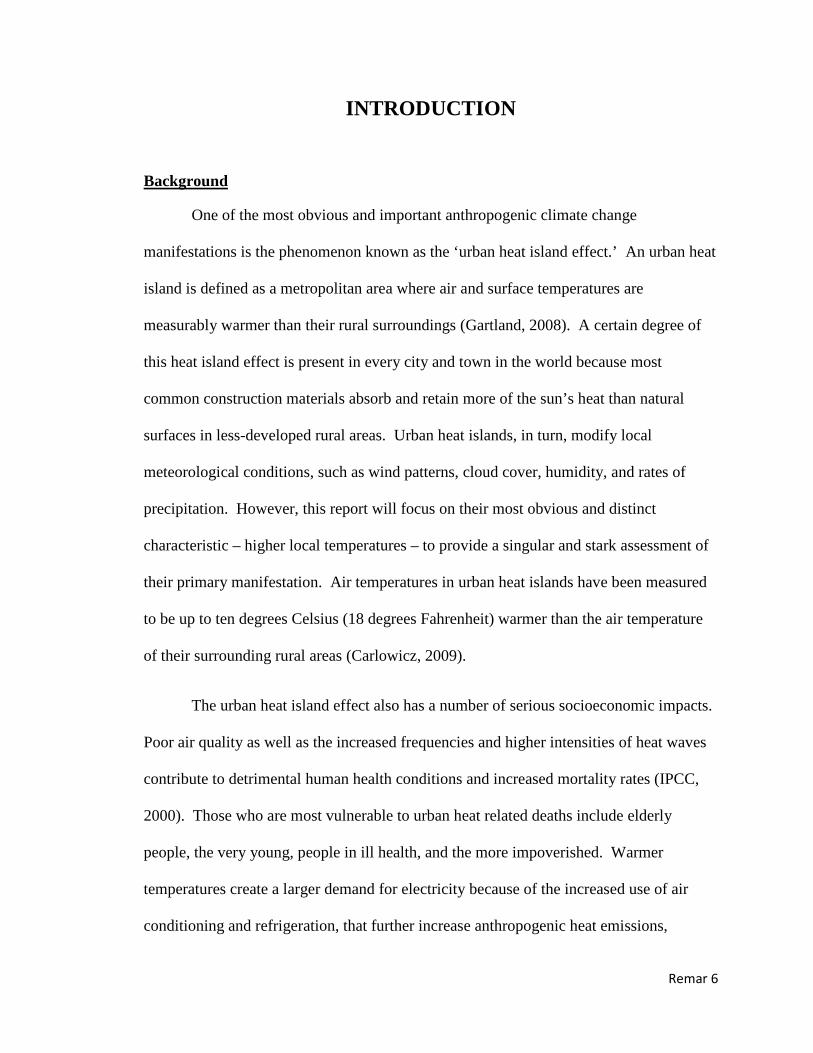
INTRODUCTION
Background
One of the most obvious and important anthropogenic climate change
manifestations is the phenomenon known as the ‘urban heat island effect.’ An urban heat
island is defined as a metropolitan area where air and surface temperatures are
measurably warmer than their rural surroundings (Gartland, 2008). A certain degree of
this heat island effect is present in every city and town in the world because most
common construction materials absorb and retain more of the sun’s heat than natural
surfaces in less-developed rural areas. Urban heat islands, in turn, modify local
meteorological conditions, such as wind patterns, cloud cover, humidity, and rates of
precipitation. However, this report will focus on their most obvious and distinct
characteristic – higher local temperatures – to provide a singular and stark assessment of
their primary manifestation. Air temperatures in urban heat islands have been measured
to be up to ten degrees Celsius (18 degrees Fahrenheit) warmer than the air temperature
of their surrounding rural areas (Carlowicz, 2009).
The urban heat island effect also has a number of serious socioeconomic impacts.
Poor air quality as well as the increased frequencies and higher intensities of heat waves
contribute to detrimental human health conditions and increased mortality rates (IPCC,
2000). Those who are most vulnerable to urban heat related deaths include elderly
people, the very young, people in ill health, and the more impoverished. Warmer
temperatures create a larger demand for electricity because of the increased use of air
conditioning and refrigeration, that further increase anthropogenic heat emissions,

Remar 7
greenhouse gas emissions and overall temperatures. Warmer temperatures also result in a
larger demand on water utilization within a metropolitan area, which has become an
increasingly valuable and diminishing resource. Considering that more than 50 percent
of the world’s population currently lives in urban areas, such heat island impacts pose
serious environmental and health hazards that warrant careful study and remedy (United
Nations, 2007).
I have chosen the city of Las Vegas as the case study for urban heat islands
because it is located in the desert, has detailed climate data over the past several decades,
and has experienced an unprecedented rate of development and expansion in the past half
century. At 36 degrees North latitude, Las Vegas’ extremely hot, dry, and calm desert
climate can mostly be attributed to subtropical high pressure systems caused by the
Hadley cell. Under stationary high-pressure systems – a common occurrence for the Las
Vegas climate – temperature differences between urban and rural areas become most
pronounced (Landsberg, 1981).
Las Vegas is also the fastest growing metropolitan area in the United States. In
1950, the city of Las Vegas was home to 24,624 people. By 2008, the population of the
Las Vegas Valley (the city and surrounding settlement areas) was over 1.8 million
people, not including its many tourists (US Census Bureau, 2009). Between the years
2000 through 2008, Las Vegas experienced an unprecedented 35.6% increase in
population, the greatest increase of any metropolitan city in the United States during that
time period (US Census Bureau, 2009). Due to this exceptionally fast population
explosion, Las Vegas’ metropolitan area has rapidly grown from 37,677 acres to 206,708
acres as shown in Figure 1, and will most certainly continue to expand. According to
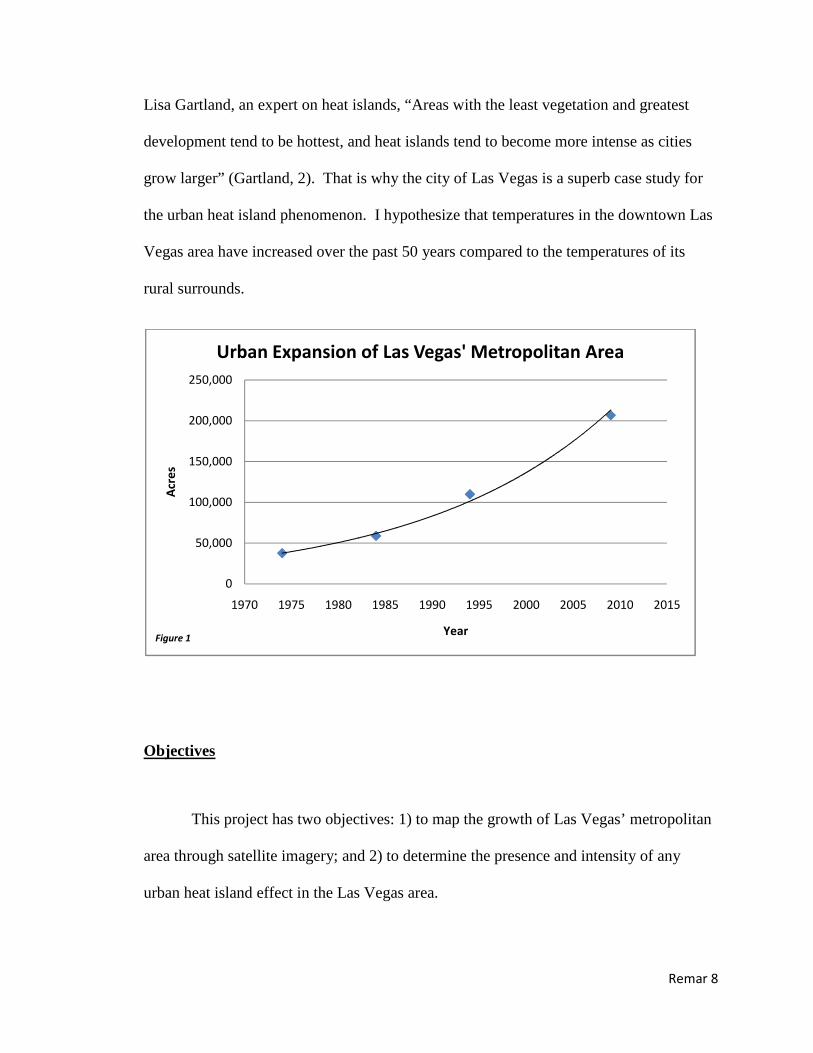
Remar 8
Lisa Gartland, an expert on heat islands, “Areas with the least vegetation and greatest
development tend to be hottest, and heat islands tend to become more intense as cities
grow larger” (Gartland, 2). That is why the city of Las Vegas is a superb case study for
the urban heat island phenomenon. I hypothesize that temperatures in the downtown Las
Vegas area have increased over the past 50 years compared to the temperatures of its
rural surrounds.
Objectives
This project has two objectives: 1) to map the growth of Las Vegas’ metropolitan
area through satellite imagery; and 2) to determine the presence and intensity of any
urban heat island effect in the Las Vegas area.
0
50,000
100,000
150,000
200,000
250,000
1970 1975 1980 1985 1990 1995 2000 2005 2010 2015
Acr
es
Year
Urban Expansion of Las Vegas' Metropolitan Area
Figure 1
Remar 9
MATERIALS AND METHODS
Acquiring Satellite Imagery
Satellite images were acquired in order to display Las Vegas’ rapid urban
expansion and to measure the growth of its metropolitan area by acreage. A total of four
visuals are presented in this report. Image 1 was captured in 1974, Image 2 was captured
in 1984, Image 3 was captured in 1994, and image 4 was captured in 2009. All satellite
photos were downloaded from the USGS Earth Resources Observation and Science
(EROS) Center’s website. Then each compressed file was unzipped by “winzip”
software and imported into the computer program “ERDAS IMAGINE.” Because each
image covered terrain far beyond the area of examination, an Area of Interest (AOI) was
selected in order to focus on the greater Las Vegas area. Each image was assigned a
common AOI in order to ensure that the map scales and areas displayed are identical,
ensuring no possibility for scale distortion.
Image 1 shows the earliest clear satellite image of Las Vegas, captured in 1974
by “LANDSAT 1-TM (thematic mapper), which has only four spectral bands. The color
red was assigned to spectral band number 4 (near-infrared), green was assigned to band
number 3 (red), and blue was assigned to band number 2 (green) in order to make the
urban features more visually pronounced compared to the natural surface. This selection
of spectral bands makes urban features appear orange in Image 1. Images 2-4 were
captured by the more modern satellite “LANDSAT 5-MSS (multi-spectral scanner)
which has seven spectral bands. For Images 2-4, the colors red and blue were still
Remar 10
assigned to band numbers 4 and 2 respectively. However, green was assigned to band
number 7 (thermal), causing the urban features to appear red.
Lastly, the “measure” tool was used in ERDAS IMAGINE to draw a polygon
around Las Vegas’ metropolitan area within each image and then calculate the total
acreage inside each polygon. The approximate metropolitan area is stated below each
image and is graphed in Figure 1. By analyzing Images 1-4 in chronological order, Las
Vegas’ speedy urban growth becomes obvious.
Selection of Weather Stations
As stated in the introduction, an urban heat island is defined as a metropolitan
area where temperatures are measurably warmer than its rural surroundings (Gartland,
2008). Therefore, the two ideal locations to retrieve weather data would be in the center
of Las Vegas’ metropolitan area (where the heat island effect would be expected to be
most pronounced) and in a nearby site that has an identical climate and is completely
isolated from any human presence (to simultaneously provide temperatures under
“normal” conditions). Additionally, each weather station used needed to have accurate
data spanning back further than 30 years. Data from both weather stations were retrieved
from the Western Regional Climate Center’s (WRCC) website.
For this report’s urban weather data, the weather station at McCarran International
Airport (Las Vegas’ main airport) was used because of its detailed temperature archive
and its centralized location to the city. A white pin is located in the center of Images 1-4
and marks the location of this weather station, which begins on the outskirts of Las Vegas

Remar 11
in 1974 and is encompassed into the city’s center in 2009. For this report’s rural weather
data, Nevada’s Valley of Fire State Park weather station was used. This site, located only
43 miles Northeast of McCarran International Airport, is only 127 feet lower in elevation,
and continues to be devoid of human development. Therefore, temperatures recorded
from both weather stations should be very similar without human alterations, given their
geographic proximity and comparable elevation.
Acquisition of Data
All temperatures evaluated in this report were recorded from McCarran
International Airport’s weather station and Nevada’s Valley of Fire State Park weather
station between January of 1973 and December of 2009. In each of these 36 years,
average maximum and minimum monthly temperatures were assessed (see Tables 1 and
2 in appendices). The solstices usually occur on June and December 21st and mark the
official beginnings of summer and winter respectively, while the equinoxes usually occur
on March 20th and December 22nd and mark the official beginning of spring and autumn
respectively. However, there is always a lag time of about a month between the official
start of a season and the sensible weather of that season. For example, although June 21st
officially marks the start of summer on our calendars, the hottest month of the year is
usually July. Accordingly, the months of January, April, July, and October have been
chosen to represent each of the four seasons.
Average monthly maximum and minimum temperatures from both weather
stations have been evaluated in order to understand each sites normal climate, and to

Remar 12
compare the urban site to the rural site. The average diurnal temperature ranges of both
sites for each month (maximum temperature minus minimum temperature) have also
been evaluated in Tables 4 and 5 and their trends are displayed in Figures 18-27. To
directly compare both sites, the difference between the airport and state park’s maximum
and minimum temperatures were calculated for each month and can be seen in Table 3.
The temperature differences between the two sites can be seen in Figures 28-35. All
tables and figures displayed in this report have been produced from each of the four
different evaluation methods described in the “Results and Discussion” section.
RESULTS AND DISCUSSION
Maximum and minimum temperatures have been recorded for the months of
January, April, July, and October between the years 1973 and 2009 from the weather
stations at McCarran International Airport and Nevada’s Valley of Fire State Park. Using
this data, four different evaluation methods are mentioned below and have been
conducted in order to determine the presence and intensity of an urban heat island in the
Las Vegas area. Tables 1-5 and Figures 1-35 are presented in the appendices in order to
enhance the clarity and comprehension of each method’s results. It should be noted that
temperatures measured before significant human settlement show a natural disparity
between the two sites. Specifically, the park averages 1-3°F warmer temperatures than
the Las Vegas urban area throughout the year, regardless of any human influence on
climate (Weather America, 2000). Therefore, these differences in specific recorded
temperatures from each site are irrelevant because they merely show a slight disparity in

Remar 13
natural climate between the two sites, not a proof or disproof of an urban heat island
effect, and will therefore be ignored in this section. Instead, the presence or absence of
any long term trends in temperature change will be the determining factor in assessing the
accuracy of this paper’s hypothesis.
(1) Maximum Monthly Temperatures (Appendix C)
After investigating the average maximum seasonal temperatures at Nevada’s
Valley of Fire State park and McCarran International Airport since 1973, it has been
determined that there is no statistically significant comparative change over this time
frame for both of the urban and rural locations. Tables 2-9 show that the maximum
temperatures for every month have remained relatively normal since 1973, with monthly
highs from year to year occurring at random. The lack of an increasing temperature trend
in maximum temperatures is surprising and seems to disprove the presence of an urban
heat island in Las Vegas. However, further research into the matter proved that these
results are typical of heat islands. According to Dr. Helmut E. Landsberg, an expert on
urban climates, “daytime urban heat island intensity…is generally quite small…” and is
sometimes even non-existent (Landsberg, 100).
There is a simple explanation for the absence of a daytime heat island effect. The
sun’s radiation, which ultimately is converted into heat at the earth’s surface, is most
intense during the middle of the day when the angle between the earth and sun is at its
greatest. Not surprisingly, high temperatures are typically recorded at around 3:00pm.
By the time a high temperature is recorded for each day, natural materials in rural areas,
such as soil and wood, as well as construction materials in urban areas, such as concrete

and stone, have been heated up to their full capacity and have a roughly equal heating
effect on air temperatures (Gartland, 2008). This is espe
such asLas Vegas, because its surface receives some of the highest levels of solar
radiation on the planet. Therefore, it should not be surprising that maximum
temperatures in Las Vegas and its rural surroundings have remained unchanged
time period being measured
temperatures, is comparable to all recorded maximum temperatures shown in
and illustrates that there are
(2) Minimum Monthly Temperatures
In sharp contrast to
average minimum temperatures
minimum temperatures in Las Vegas’ metropolitan area have been increasing at a
remarkable rate. During this same time period,
40.00
45.00
50.00
55.00
60.00
65.00
70.00
1970
Te
mp
era
ture
(°F
)
Figure 6
Figure 6 illustrates maximum temperatures in January from 1973 to 2009 at Mccarran International Airport.
and stone, have been heated up to their full capacity and have a roughly equal heating
mperatures (Gartland, 2008). This is especially true in a desert climate,
because its surface receives some of the highest levels of solar
radiation on the planet. Therefore, it should not be surprising that maximum
Vegas and its rural surroundings have remained unchanged
period being measured. Figure 6, which displays average January maximum
is comparable to all recorded maximum temperatures shown in
that there are minimal maximum temperature trends.
Minimum Monthly Temperatures (Appendix D)
sharp contrast to the relatively stable maximum temperatures in Las Vegas
ge minimum temperatures at the urban and rural locations since 1973
in Las Vegas’ metropolitan area have been increasing at a
rate. During this same time period, minimum temperatures in
1975 1980 1985 1990 1995 2000 2005
Year
McCarran January Max
illustrates maximum temperatures in January from 1973 to 2009 at Mccarran International Airport.
Remar 14
and stone, have been heated up to their full capacity and have a roughly equal heating
cially true in a desert climate,
because its surface receives some of the highest levels of solar
radiation on the planet. Therefore, it should not be surprising that maximum
Vegas and its rural surroundings have remained unchanged over the
, which displays average January maximum
is comparable to all recorded maximum temperatures shown in Figures 2-9
in Las Vegas, the
at the urban and rural locations since 1973 shows that
in Las Vegas’ metropolitan area have been increasing at a
minimum temperatures in Las Vegas’
2005 2010 2015
illustrates maximum temperatures in January from 1973 to 2009 at Mccarran International Airport.

Remar 15
rural surroundings have shown no statistically significant change or upward trend.
McCarran International Airport shows a clear trend of increasing minimum temperatures,
especially since 1990. A white pin is visible in the center of Images 1-4 and marks the
location of McCarran International Airport’s weather station, which is at the outskirts of
Las Vegas in 1974 and progresses into the city’s center in 2009. In Image 2, which was
captured in 1984, McCarran’s weather station is still located on the outskirts of Las
Vegas’ metropolitan area; however, by 1994 the weather station has been completely
surrounded by urban features. The fact that minimum temperatures begin to rapidly
increase at around the same time that the weather station becomes engulfed by urban
features provides significant evidence that Las Vegas is producing and experiencing an
urban heat island effect. During this same time period, there have been no indications of
any statistically significant changes in minimum temperatures at Nevada’s Valley of Fire
State Park.
According to Lisa Gartland, an expert on urban heat islands, “The heat island
intensity is usually largest at night, since urban surfaces continue to give off heat and
slow the rate of night-time cooling” (Gartland, 3). This phenomenon occurs because of
specific heat, which is a material’s capacity to gain and lose heat. The greater the
specific heat value of a material, the greater the capacity for that material to store heat.
Common urban features, such as concrete and stone, tend to have a higher specific heat
than do common rural features, such as soil and wood. Consequently, once the sun goes
down, rural materials quickly lose their stored heat and have no effect on night-time
cooling, which is when minimum temperatures are measured. In contrast, urban
materials retain the heat they stored from the sun during the day and slowly release it

Remar 16
throughout the night, thereby diminishing overall night-time cooling and increasing
minimum temperatures in the area.
Figure 14 illustrates minimum temperatures in the month of January from 1973 to
2009 at Nevada’s Valley of Fire State Park. Between 1973 and 1990, January’s average
minimum temperatures were approximately 38°F at this rural site. Between 1991 and
2009, the average minimum temperature in January rose to 39°F, only a 1°F increase. In
direct contrast, Figure 10 illustrates elevations of average minimum temperatures in the
month of January from 1973 to 2009 at McCarran International Airport. Between 1973
and 1990, the average minimum temperature in January was approximately 35°F at this
urban site. Between 1991 and 2009, the average minimum temperature in January rose to
39°F, a 4°F increase. To summarize, Las Vegas’ urban minimum temperatures have
increased 3°F more than its rural surroundings since 1991. This comparison between
Figure 14 and Figure 10 prove that average minimum temperatures in Las Vegas’
metropolitan area are increasing at a significantly faster rate than those for the rural
surroundings, a distinct trait of heat islands.
30.00
32.00
34.00
36.00
38.00
40.00
42.00
44.00
46.00
1970 1975 1980 1985 1990 1995 2000 2005 2010 2015
Te
mp
era
ture
(°F
)
Year
McCarran January Min
Figure 14
Figure 14 illustrates minimum temperatures in January from 1973 to 2009 at Mccarran International Airport.

Remar 17
(3) Diurnal Temperature Ranges (Appendix E)
Evaluating the diurnal temperature ranges of both urban and rural locations can
provide compelling evidence as to the presence of an urban heat island. A diurnal
temperature range is a meteorological term that represents the variation in temperature
that occurs between the highs of the day and the lows of the night. This value can be
retrieved by subtracting the night-time low temperature from the day-time high
temperature. Because increased minimum temperatures and relative unaltered maximum
temperatures are a common characteristic of urban heat islands, it is expected that the
diurnal range of an urban area should show a decreasing trend over time, while a rural
area’s diurnal range should remain relatively constant.
Because the weather station located at McCarran International Airport became
completely surrounded by urban features around the year 1990, the average diurnal
temperature range between 1973 and 1990 will be directly compared to the average
30.00
32.00
34.00
36.00
38.00
40.00
42.00
44.00
46.00
1970 1975 1980 1985 1990 1995 2000 2005 2010 2015
Te
mp
era
ture
(°F
)
Year
VOF January Min
Figure 10
Figure 10 illustrates minimum temperatures in January from 1973 to 2009 at Nevada’s Valley of Fire State Park.

Remar 18
diurnal temperature range from 1991 to 2009 in order to assess the presence of any long
term trends. The average diurnal temperature range at McCarran International Airport is
3.375°F lower between the years of 1991 and 2009 than it was from 1973 to 1990 (see
Figure 24). In contrast, the average diurnal temperature range at Nevada’s Valley of Fire
State Park has only decreased by 0.375°F during these same time periods (see Figure 19).
Therefore, the average diurnal temperature range in Las Vegas’ urban areas has
decreased by 3°F more than its rural surroundings. This change between urban and rural
diurnal temperature differences provides further evidence that Las Vegas is producing
and experiencing a heat island effect. A direct comparison between Figures 19 and 24
clearly demonstrates this phenomenon.
12.00
14.00
16.00
18.00
20.00
22.00
24.00
26.00
28.00
1970 1975 1980 1985 1990 1995 2000 2005 2010 2015
Diu
rna
l T
em
p R
an
ge
(°F
)
Year
VOF January DTR
Figure 19
Figure 19 illustrates January’s diurnal temperature range from 1973 to 2009 at Nevada’s Valley of Fire State Park.

Remar 19
(4) Urban and Rural Minimum Temperature Differences (Appendix F)
Differences in minimum temperature have been calculated by subtracting the
average rural minimum temperature from the average urban minimum temperature within
the same month. After investigating minimum temperature differences since 1973, it has
been determined that the difference between urban and rural minimum temperatures have
been increasing. The growth of this difference over time proves that Las Vegas’ urban
minimum temperatures have been increasing at a significantly greater rate than its rural
surroundings. For example, Figure 29 demonstrates that the average minimum
temperature in January at McCarran International Airport has warmed by approximately
3°F more than the average minimum temperature in Nevada’s Valley of Fire State Park
during this same month.
12.00
14.00
16.00
18.00
20.00
22.00
24.00
26.00
28.00
1970 1975 1980 1985 1990 1995 2000 2005 2010 2015
Diu
rna
l T
em
p R
an
ge
(°F
)
Year
McCarran January DTR
Figure 24
Figure 24 illustrates January’s diurnal temperature range from 1973 to 2009 at Mccarran Internation Airport.

Remar 20
CONCLUSION
Las Vegas’ Urban Heat Island
After evaluating Las Vegas’ rural and urban temperature data, this paper has
found statistically significant evidence for the presence of an urban heat island effect in
the area. As expected, the first evaluation method, which examined rural and urban
maximum temperatures in the Las Vegas area, did not provide any intelligible evidence
to support this paper’s hypothesis. The second evaluation method, which examined Las
Vegas’ urban and rural minimum temperatures, reveals that Las Vegas’ urban minimum
temperatures have been increasing at a substantial rate, while minimum temperatures in
its rural surroundings have shown no statistically significant changes or trends. The third
evaluation method shows that these unnatural increases in minimum temperatures have
-7.00
-6.00
-5.00
-4.00
-3.00
-2.00
-1.00
0.00
1.00
2.00
1970 1975 1980 1985 1990 1995 2000 2005 2010 2015
Te
mp
Dif
fere
nce
(°F
)
Year
January Min Temp Difference
Figure 29
Figure 29 illustrates the difference between urban and rural minimum January temperatures from 1973 to 2009.
Remar 21
reduced the diurnal temperature range of Las Vegas’ urban areas by 3°F more than its
rural surroundings. The fourth evaluation method, which is the only method that
provides a long-term direct comparison between Las Vegas’ urban and rural climates,
shows that the difference between urban and rural minimum temperatures has been
growing over time, mainly due to urban minimum temperatures increasing at a
significantly greater rate than those in rural surroundings. Because an urban heat island
is defined as a metropolitan area that has higher temperatures than its rural surroundings,
the fourth evaluation method provides the most compelling evidence for Las Vegas’
urban heat island.
Although Las Vegas’ urban heat island is certainly measurable, it is not as intense
as many other documented urban heat islands because of its surrounding environment.
Heat island intensity is defined as “The greatest difference between urban and rural
temperatures…” (Gartland, 2008). Heat island intensity is the same measurement as the
fourth evaluation method, which calculated the difference between average urban and
rural minimum temperatures. The fourth evaluation method determined Las Vegas’ heat
island intensity to be approximately 3°F between 1973 and 2009.
Astoundingly, Baltimore’s heat island intensity has been measured to be as high
as 18°F in 2009. The strength of a city’s heat island intensity depends on its regional
climate as well as the vegetation cover of the surrounding ecosystem that the city
replaced (Carlowicz, 2009). According to NASA researchers, “Urban areas developed in
arid and semi-arid regions show far less heating compared with the surrounding
countryside than cities built amid forested and temperate climates” (Carlowicz, 2009).
Therefore, the disparity in heat island intensity between Las Vegas and Baltimore can be

Remar 22
attributed to the vast differences of their surrounding ecosystems. The city of Baltimore
was built in a naturally forested area. High levels of urbanization have created a drastic
alteration of its ecosystem. When the sun’s radiation hits a tree, as is often the case in a
heavily forested area, it evaporates the water held inside the tree’s leaves and is converted
into latent (or delayed) heat. Once it eventually rains, this latent heat becomes sensible
heat and warms our upper atmosphere. However, when the sun’s radiation hits an urban
feature, it is immediately converted into sensible heat and directly warms the Earth’s
surface. As a result of this unnatural heating, there is a massive difference between
Baltimore’s urban and rural temperatures.
In contrast, Las Vegas is located in a barren desert with minimal vegetation cover,
causing minimal ecosystem alterations. Consequently, the majority of the sun’s radiation
becomes sensible heat at the Earth’s surface, regardless of whether it hits an urban feature
or the desert floor. Ironically, there is more vegetation cover in the Las Vegas
metropolitan area today than there was before human settlement, possibly creating an
urban cooling effect during the day. Ultimately, the city of Las Vegas has a weaker heat
island intensity than would typically be expected because it is located in an arid, desert-
like ecosystem.
Between 1973 and 1990, very minimal statistically significant trends are revealed
in the retrieved data. Since 1991, however, all trends mentioned above become more
pronounced, signifying a noticeably abrupt change in the data. This can be explained by
the rapid urbanization of land surrounding the urban weather station. Marked by a white
point in the center of Images 1 and 2, McCarran International Airport’s weather station is
visibly located on the outskirts of Las Vegas’ metropolitan area before 1990. However,

Remar 23
by the year 1994, captured in Image 3, McCarran International Airport’s weather station
has become completely surrounded by urban features. By 2009, rapid urban expansion
has relocated the relative position of this urban weather station to the middle of Las
Vegas’ metropolitan area. These images, coupled with trends in rising urban minimum
temperatures, provide indisputable proof of the mechanism behind Las Vegas’ urban heat
island – the measured warming of urban minimum temperatures caused by the night-time
release of heat from urban materials. In summary, Las Vegas’ unprecedented urban
growth in the last 50 years has made it an ideal location to study, measure, and confirm
the presence, strength, and growth of an urban heat island effect in an arid setting.

Remar 24
REFERENCES
Carlowicz, Mike. "Ecosystem, Vegetation Affect Intensity of Urban Heat Island Effect." NASA's Earth Science News Team. NASA, 12 15 2009. Web. 07 May 2010. <http://www.nasa.gov/mission_pages/terra/news/heat-islands.html>.
Gartland, Lisa. Heat Islands: Understanding and Mitigating Heat in Urban Areas. 1st d. 1 vol. London: Earthscan, 2008. 1-3. Print.
"Las Vegas McCarran International Airport." Weather America. 2nd ed. Millerton, NY: Grey House Publishing, Inc., 2000. 2208. Print.
Landsberg, Helmut E. The Urban Climate. 1st ed. 28. London: Academic Press, Inc, 1981. 84-85, 100. Print.
Population Division of the Department of Economic and Social Affairs of the United Nations Secretariat, World Population Prospects: The 2006 Revision and World Urbanization Prospects: The 2007 Revision, Monday, May 17, 2010; 6:04:18 PM <http://esa.un.org/unup>
Scott, Michael, and Sujata Gupta. "Human Settlements, Energy, and Industry." IPCC Reports. International Panel on Climate Control, 2000. Web. 10 May 2010. <http://www.ipcc.ch/ipccreports/tar/wg2/pdf/wg2TARchap7.pdf>.
United States. Cumulative Estimates of Population Change for Metropolitan Statistical Areas and Rankings: April 1, 2000 to July 1, 2008. , 2009. Print.
WRCC, "LAS VEGAS WSO AIRPORT, NEVADA (264436) ." Western Regional Climate Center. 12 31 2009. Web. 21 April 2010. <http://www.wrcc.dri.edu/cgi-bin/cliMAIN.pl?nv4436>.

Remar 25

Remar 26

Remar 27

Remar 28

Remar 29
Appendix B (Tables 1 and 2)
Valley of Fire State Park, Nevada
Lat: 36°26° N Long: 114°31° W Elev: 1,998 ft.
Year 1MaxT 1MinT 4MaxT 4MinT 7MaxT 7MinT 10MaxT 10MinT
1973 49.71 32.71 75.70 50.60 108.54 79.36 83.71 57.71
1974 49.53 33.97 78.36 51.22 105.40 77.04 82.83 60.47
1975 54.27 35.23 70.28 48.03 105.59 80.13 81.07 55.69
1976 58.47 39.23 75.50 50.87 105.68 80.23 78.21 55.93
1977 54.70 37.85 81.96 56.07 106.77 81.58 85.52 62.58
1978 55.07 41.40 75.28 52.13 107.19 79.74 86.42 62.58
1979 47.00 34.32 78.93 52.63 106.87 78.87 86.42 60.55
1980 57.58 41.90 78.20 51.80 106.61 79.42 83.81 59.00
1981 61.67 42.33 83.57 59.80 107.94 84.16 78.61 57.13
1982 55.29 37.29 77.30 53.20 103.39 78.29 76.48 54.39
1983 56.06 38.87 71.43 49.87 104.58 79.52 80.97 58.74
1984 58.00 38.32 76.77 53.70 101.81 80.45 76.48 53.26
1985 55.84 38.16 83.23 57.20 106.06 80.68 80.48 57.42
1986 65.74 43.23 79.60 56.40 101.52 78.29 78.87 56.19
1987 54.90 36.61 82.80 56.60 101.55 76.26 85.71 61.97
1988 54.26 35.65 77.37 53.50 107.19 82.16 90.35 64.61
1989 54.45 35.61 88.47 60.20 107.10 81.45 87.63 61.72
1990 56.65 36.84 81.83 57.33 104.19 80.00 83.13 59.23
1991 55.29 36.58 76.57 53.43 104.42 77.84 86.13 60.77
1992 56.61 36.35 82.71 56.13 101.35 77.32 84.19 60.35
1993 53.06 37.35 80.24 54.67 102.53 78.50 83.14 57.65
1994 60.65 38.94 83.60 51.95 107.81 82.65 79.71 55.77
1995 56.03 40.97 77.00 53.07 106.06 79.03 85.03 57.45
1996 60.32 38.42 84.63 56.70 107.29 82.87 81.61 56.06
1997 57.94 41.61 76.90 52.87 103.42 78.06 81.61 57.06
1998 59.74 40.81 74.37 52.37 105.35 78.87 79.26 55.94
1999 62.06 38.52 72.23 50.50 86.57 60.23
2000 60.48 40.90 84.83 60.21 105.90 79.43 79.26 59.19
2001 57.03 38.87 78.45 54.77 104.35 79.90 86.26 60.77
2002 57.10 36.87 83.30 59.23 108.00 83.81 79.39 58.06
2003 65.94 43.61 75.67 53.33 109.61 83.84 89.06 64.68
2004 57.74 38.00 79.93 57.30 105.03 81.39 78.96 59.42
2005 59.13 45.20 75.50 52.50 107.60 81.12 81.29 59.16
2006 61.81 39.62 78.17 55.57 106.45 81.81 77.90 58.23
2007 54.05 34.86 81.03 57.47 107.94 84.06 81.03 58.39
2008 54.32 37.84 79.33 54.97 105.74 81.65 83.77 58.68
2009 60.69 41.42 76.90 54.40 107.61 83.48 78.35 57.32
Table 1

Remar 30
LAS VEGAS McCarran International Airport
Lat: 36°05° N Long: 115°10° W Elev: 2,125
Year 1MaxT 1MinT 4MaxT 4MinT 7MaxT 7MinT 10MaxT 10MinT
1973 50.58 31.10 74.50 49.77 106.29 77.00 82.52 52.87
1974 49.97 32.00 77.03 49.83 102.06 75.39 81.32 57.16
1975 57.35 33.06 68.03 45.10 103.74 76.84 79.61 52.58
1976 61.06 32.74 75.90 49.17 100.71 73.06 78.94 54.03
1977 57.97 33.29 84.20 53.03 106.48 78.16 86.52 56.29
1978 57.13 38.58 75.80 50.37 106.94 76.84 88.10 58.81
1979 49.35 32.68 80.50 51.57 106.77 75.29 84.29 57.13
1980 58.87 40.03 76.43 50.60 105.48 78.35 82.81 55.00
1981 62.61 39.45 84.03 57.10 105.90 79.52 76.45 55.29
1982 56.81 34.42 76.00 51.47 101.29 74.84 75.42 50.65
1983 57.16 35.94 69.10 47.77 101.71 75.16 79.52 56.00
1984 58.68 35.52 75.40 50.67 99.97 76.26 74.65 51.42
1985 54.23 34.45 81.93 54.37 105.19 78.81 80.32 54.32
1986 64.42 39.03 78.97 53.30 100.65 74.48 77.81 52.06
1987 55.13 34.19 82.97 53.83 101.32 72.39 84.29 57.58
1988 55.97 34.13 77.17 51.07 106.87 78.26 89.39 60.26
1989 55.32 32.39 86.83 58.47 107.29 79.35 80.58 53.68
1990 56.77 33.61 82.00 55.63 103.74 77.87 82.81 55.58
1991 56.94 34.00 76.60 51.77 104.19 76.19 85.00 59.35
1992 56.74 35.13 83.50 57.50 101.00 76.26 83.26 58.48
1993 53.71 37.65 80.07 54.80 102.58 76.23 81.65 56.48
1994 61.26 37.32 79.10 56.07 106.42 80.13 79.26 55.03
1995 54.45 40.48 76.37 53.23 105.29 79.35 83.42 55.35
1996 59.90 37.06 81.13 55.53 105.97 80.52 78.87 54.71
1997 57.19 39.35 76.53 54.27 101.03 75.35 79.26 55.29
1998 58.10 39.16 72.27 49.80 104.81 78.61 77.48 55.61
1999 61.45 39.39 71.40 50.43 99.00 77.35 85.13 58.03
2000 60.81 42.03 83.30 59.07 104.71 79.77 77.10 57.42
2001 55.26 37.45 75.93 54.00 102.10 78.55 83.94 60.23
2002 56.32 35.90 81.70 57.70 106.48 82.58 78.61 56.23
2003 65.32 42.94 72.80 52.93 106.58 82.94 87.16 63.48
2004 57.00 37.90 78.13 57.53 104.61 81.45 77.87 58.61
2005 58.87 43.90 76.67 54.67 106.97 83.58 79.94 60.84
2006 60.26 40.06 77.80 55.33 105.52 83.65 77.61 57.87
2007 56.35 35.58 81.60 59.33 107.06 83.65 80.61 58.87
2008 54.39 37.84 79.33 55.93 104.81 82.52 82.71 59.42
2009 61.13 40.87 77.90 54.03 105.97 83.35 77.48 56.45
Table 2

Remar 31
Appendix C (Figures 2-9)
40.00
45.00
50.00
55.00
60.00
65.00
70.00
1970 1975 1980 1985 1990 1995 2000 2005 2010 2015
Te
mp
era
ture
(°F
)
Year
VOF January Max
Figure 2
65.00
70.00
75.00
80.00
85.00
90.00
1970 1975 1980 1985 1990 1995 2000 2005 2010 2015
Te
mp
era
ture
(°F
)
Year
VOF April Max
Figure 3

Remar 32
100.00
102.00
104.00
106.00
108.00
110.00
112.00
1970 1975 1980 1985 1990 1995 2000 2005 2010 2015
Te
mp
era
ture
(°F
)
Year
VOF July Max
Figure 4
74.00
76.00
78.00
80.00
82.00
84.00
86.00
88.00
90.00
92.00
1970 1975 1980 1985 1990 1995 2000 2005 2010 2015
Te
mp
era
ture
(°F
)
Year
VOF October Max
Figure 5

40.00
45.00
50.00
55.00
60.00
65.00
70.00
1970 1975
Te
mp
era
ture
(°F
)
Figure 6
60.00
65.00
70.00
75.00
80.00
85.00
90.00
1970 1975
Te
mp
era
ture
(°F
)
Figure 7
1980 1985 1990 1995 2000 2005
Year
McCarran January Max
1980 1985 1990 1995 2000 2005
Year
McCarran April Max
Remar 33
2010 2015
2010 2015

Remar 34
98.00
100.00
102.00
104.00
106.00
108.00
1970 1975 1980 1985 1990 1995 2000 2005 2010 2015
Te
mp
era
ture
(°F
)
Year
McCarran July Max
Figure 8
72.00
74.00
76.00
78.00
80.00
82.00
84.00
86.00
88.00
90.00
92.00
1970 1975 1980 1985 1990 1995 2000 2005 2010 2015
Te
mp
era
ture
(°F
)
Year
McCarran October Max
Figure 9

Remar 35
Appendix D (Figures 10-17)
30.00
32.00
34.00
36.00
38.00
40.00
42.00
44.00
46.00
1970 1975 1980 1985 1990 1995 2000 2005 2010 2015
Te
mp
era
ture
(°F
)
Year
VOF January Min
Figure 10
45.00
47.00
49.00
51.00
53.00
55.00
57.00
59.00
61.00
1970 1975 1980 1985 1990 1995 2000 2005 2010 2015
Te
mp
era
ture
(°F
)
Year
VOF APRIL Min
Figure 11

Remar 36
75.00
76.00
77.00
78.00
79.00
80.00
81.00
82.00
83.00
84.00
85.00
1970 1975 1980 1985 1990 1995 2000 2005 2010 2015
Te
mp
era
ture
(°F
)
Year
VOF July Min
Figure 12
50.00
52.00
54.00
56.00
58.00
60.00
62.00
64.00
66.00
1970 1975 1980 1985 1990 1995 2000 2005 2010 2015
Te
mp
era
ture
(°F
)
Year
VOF October Min
Figure 13

Remar 37
30.00
32.00
34.00
36.00
38.00
40.00
42.00
44.00
46.00
1970 1975 1980 1985 1990 1995 2000 2005 2010 2015
Te
mp
era
ture
(°F
)
Year
McCarran January Min
Figure 14
40.00
45.00
50.00
55.00
60.00
65.00
1970 1975 1980 1985 1990 1995 2000 2005 2010 2015
Te
mp
era
ture
(°F
)
Year
McCarran April Min
Figure 15

Remar 38
70.00
72.00
74.00
76.00
78.00
80.00
82.00
84.00
86.00
1970 1975 1980 1985 1990 1995 2000 2005 2010 2015
Te
mp
era
ture
(°F
)
Year
McCarran July Min
Figure 16
45.00
50.00
55.00
60.00
65.00
1970 1975 1980 1985 1990 1995 2000 2005 2010 2015
Te
mp
era
ture
(°F
)
Year
McCarran October Max
Figure 17

Remar 39
Appendix E (Tables 3-4 and Figures 18-27)
VOF Diurnal Temp Difference
Year Jan Diff April Diff July Diff Oct Diff
1973 17.00 25.10 29.18 26.00
1974 15.56 27.14 28.36 22.36
1975 19.04 22.25 25.46 25.38
1976 19.24 24.63 25.45 22.28
1977 16.85 25.89 25.19 22.94
1978 13.67 23.15 27.45 23.84
1979 12.68 26.30 28.00 25.87
1980 15.68 26.40 27.19 24.81
1981 19.34 23.77 23.78 21.48
1982 18.00 24.10 25.10 22.09
1983 17.19 21.56 25.06 22.23
1984 19.68 23.07 21.36 23.22
1985 17.68 26.03 25.38 23.06
1986 22.51 23.20 23.23 22.68
1987 18.29 26.20 25.29 23.74
1988 18.61 23.87 25.03 25.74
1989 18.84 28.27 25.65 25.91
1990 19.81 24.50 24.19 23.90
1991 18.71 23.14 26.58 25.36
1992 20.26 26.58 24.03 23.84
1993 15.71 25.57 24.03 25.49
1994 21.71 31.65 25.16 23.94
1995 15.06 23.93 27.03 27.58
1996 21.90 27.93 24.42 25.55
1997 16.33 24.03 25.36 24.55
1998 18.93 22.00 26.48 23.32
1999 23.54 21.73 26.34
2000 19.58 24.62 26.47 20.07
2001 18.16 23.68 24.45 25.49
2002 20.23 24.07 24.19 21.33
2003 22.33 22.34 25.77 24.38
2004 19.74 22.63 23.64 19.54
2005 13.93 23.00 26.48 22.13
2006 22.19 22.60 24.64 19.67
2007 19.19 23.56 23.88 22.64
2008 16.48 24.36 24.09 25.09
2009 19.27 22.50 24.13 21.03
Table 3

Remar 40
12.00
14.00
16.00
18.00
20.00
22.00
24.00
26.00
28.00
1970 1975 1980 1985 1990 1995 2000 2005 2010 2015
Diu
rna
l T
em
p R
an
ge
(°F
)
Year
VOF January DTR
Figure 19
20.00
22.00
24.00
26.00
28.00
30.00
32.00
34.00
1970 1975 1980 1985 1990 1995 2000 2005 2010 2015
Diu
rna
l T
em
p R
an
ge
(°F
)
Year
VOF April DTR
Figure 20

Remar 41
20.00
21.00
22.00
23.00
24.00
25.00
26.00
27.00
28.00
29.00
30.00
1970 1975 1980 1985 1990 1995 2000 2005 2010 2015
Diu
rna
l T
em
p R
an
ge
(°F
)
Year
VOF July DTR
Figure 21
15.00
17.00
19.00
21.00
23.00
25.00
27.00
29.00
1970 1975 1980 1985 1990 1995 2000 2005 2010 2015
Diu
rna
l T
em
p R
an
ge
(°F
)
Year
VOF October DTR
Figure 22

Remar 42
McCarran Diurnal Temp Difference
Year Jan Diff April Diff July Diff Oct Diff
1973 19.48 24.73 29.29 29.65
1974 17.97 27.20 26.67 24.16
1975 24.29 22.93 26.90 27.03
1976 28.32 26.73 27.65 24.91
1977 24.68 31.17 28.32 30.23
1978 18.55 25.43 30.10 29.29
1979 16.67 28.93 31.48 27.16
1980 18.84 25.83 27.13 27.81
1981 23.16 26.93 26.38 21.16
1982 22.39 24.53 26.45 24.77
1983 21.22 21.33 26.55 23.52
1984 23.16 24.73 23.71 23.23
1985 19.78 27.56 26.38 26.00
1986 25.39 25.67 26.17 25.75
1987 20.94 29.14 28.93 26.71
1988 21.84 26.10 28.61 29.13
1989 22.93 28.36 27.94 26.90
1990 23.16 26.37 25.87 27.23
1991 22.94 24.83 28.00 25.65
1992 21.61 26.00 24.74 24.78
1993 16.06 25.27 26.35 25.17
1994 23.94 23.03 26.29 24.23
1995 13.97 23.14 25.94 28.07
1996 22.84 25.60 25.45 24.16
1997 17.84 22.26 25.68 23.97
1998 18.94 22.47 26.20 21.87
1999 22.06 20.97 21.65 27.10
2000 18.78 24.23 24.94 19.68
2001 17.81 21.93 23.55 23.71
2002 20.42 24.00 23.90 22.38
2003 22.38 19.87 23.64 23.68
2004 19.10 20.60 23.16 19.26
2005 14.97 22.00 23.39 19.10
2006 20.20 22.47 21.87 19.74
2007 20.77 22.27 23.41 21.74
2008 16.55 23.40 22.29 23.29
2009 20.26 23.87 22.62 21.03
Table 4

Remar 43
12.00
14.00
16.00
18.00
20.00
22.00
24.00
26.00
28.00
1970 1975 1980 1985 1990 1995 2000 2005 2010 2015
Diu
rna
l T
em
p R
an
ge
(°F
)
Year
McCarran January DTR
Figure 24
15.00
17.00
19.00
21.00
23.00
25.00
27.00
29.00
31.00
33.00
1970 1975 1980 1985 1990 1995 2000 2005 2010 2015
Diu
rna
l T
em
p R
an
ge
(°F
)
Year
McCarran April DTR
Figure 25

Remar 44
20.00
22.00
24.00
26.00
28.00
30.00
32.00
34.00
1970 1975 1980 1985 1990 1995 2000 2005 2010 2015
Diu
rna
l T
em
p R
an
ge
(°F
)
Year
McCarran July DTR
Figure 26
15.00
17.00
19.00
21.00
23.00
25.00
27.00
29.00
31.00
1970 1975 1980 1985 1990 1995 2000 2005 2010 2015
Diu
rna
l T
em
p R
an
ge
(°F
)
Year
McCarran October DTR
Figure 27

Remar 45
Appendix F (Table 5 and Figures 28-35)
Differences (Airport Temp minus Park Temp)
Year
Jan
Max
Jan
Min
April
Max
April
Min
July
Max
July
Min
Oct
Max
Oct
Min
1973 0.87 -1.61 -1.20 -0.83 -2.25 -2.36 -1.19 -4.84
1974 0.44 -1.97 -1.33 -1.39 -3.34 -1.65 -1.51 -3.31
1975 3.08 -2.17 -2.25 -2.93 -1.85 -3.29 -1.46 -3.11
1976 2.59 -6.49 0.40 -1.70 -4.97 -7.17 0.73 -1.90
1977 3.27 -4.56 2.24 -3.04 -0.29 -3.42 1.00 -6.29
1978 2.06 -2.82 0.52 -1.76 -0.25 -2.90 1.68 -3.77
1979 2.35 -1.64 1.57 -1.06 -0.10 -3.58 -2.13 -3.42
1980 1.29 -1.87 -1.77 -1.20 -1.13 -1.07 -1.00 -4.00
1981 0.94 -2.88 0.46 -2.70 -2.04 -4.64 -2.16 -1.84
1982 1.52 -2.87 -1.30 -1.73 -2.10 -3.45 -1.06 -3.74
1983 1.10 -2.93 -2.33 -2.10 -2.87 -4.36 -1.45 -2.74
1984 0.68 -2.80 -1.37 -3.03 -1.84 -4.19 -1.83 -1.84
1985 -1.61 -3.71 -1.30 -2.83 -0.87 -1.87 -0.16 -3.10
1986 -1.32 -4.20 -0.63 -3.10 -0.87 -3.81 -1.06 -4.13
1987 0.23 -2.42 0.17 -2.77 -0.23 -3.87 -1.42 -4.39
1988 1.71 -1.52 -0.20 -2.43 -0.32 -3.90 -0.96 -4.35
1989 0.87 -3.22 -1.64 -1.73 0.19 -2.10 -7.05 -8.04
1990 0.12 -3.23 0.17 -1.70 -0.45 -2.13 -0.32 -3.65
1991 1.65 -2.58 0.03 -1.66 -0.23 -1.65 -1.13 -1.42
1992 0.13 -1.22 0.79 1.37 -0.35 -1.06 -0.93 -1.87
1993 0.65 0.30 -0.17 0.13 0.05 -2.27 -1.49 -1.17
1994 0.61 -1.62 -4.50 4.12 -1.39 -2.52 -0.45 -0.74
1995 -1.58 -0.49 -0.63 0.16 -0.77 0.32 -1.61 -2.10
1996 -0.42 -1.36 -3.50 -1.17 -1.32 -2.35 -2.74 -1.35
1997 -0.75 -2.26 -0.37 1.40 -2.39 -2.71 -2.35 -1.77
1998 -1.64 -1.65 -2.10 -2.57 -0.54 -0.26 -1.78 -0.33
1999 -0.61 0.87 -0.83 -0.07 -1.44 -2.20
2000 0.33 1.13 -1.53 -1.14 -1.19 0.34 -2.16 -1.77
2001 -1.77 -1.42 -2.52 -0.77 -2.25 -1.35 -2.32 -0.54
2002 -0.78 -0.97 -1.60 -1.53 -1.52 -1.23 -0.78 -1.83
2003 -0.62 -0.67 -2.87 -0.40 -3.03 -0.90 -1.90 -1.20
2004 -0.74 -0.10 -1.80 0.23 -0.42 0.06 -1.09 -0.81
2005 -0.26 -1.30 1.17 2.17 -0.63 2.46 -1.35 1.68
2006 -1.55 0.44 -0.37 -0.24 -0.93 1.84 -0.29 -0.36
2007 2.30 0.72 0.57 1.86 -0.88 -0.41 -0.42 0.48
2008 0.07 0.00 0.00 0.96 -0.93 0.87 -1.06 0.74
2009 0.44 -0.55 1.00 -0.37 -1.64 -0.13 -0.87 -0.87
Table 5

Remar 46
-2.00
-1.00
0.00
1.00
2.00
3.00
4.00
1970 1975 1980 1985 1990 1995 2000 2005 2010 2015
Te
mp
Dif
fere
nce
(°F
)
Year
January Max Temp Difference
Figure 28
-7.00
-6.00
-5.00
-4.00
-3.00
-2.00
-1.00
0.00
1.00
2.00
1970 1975 1980 1985 1990 1995 2000 2005 2010 2015
Te
mp
Dif
fere
nce
(°F
)
Year
January Min Temp Difference
Figure 29

Remar 47
-5.00
-4.00
-3.00
-2.00
-1.00
0.00
1.00
2.00
3.00
1970 1975 1980 1985 1990 1995 2000 2005 2010 2015
Te
mp
Dif
fere
nce
(°F
)
Year
April Max Temp Difference
Figure 30
-4.00
-3.00
-2.00
-1.00
0.00
1.00
2.00
3.00
4.00
5.00
1970 1975 1980 1985 1990 1995 2000 2005 2010 2015
Te
mp
Dif
fere
nce
(°F
)
Year
April Min Temp Difference
Figure 31

Remar 48
-6.00
-5.00
-4.00
-3.00
-2.00
-1.00
0.00
1.00
1970 1975 1980 1985 1990 1995 2000 2005 2010 2015
Te
mp
Dif
fere
nce
(°F
)
Year
July Max Temp Difference
Figure 32
-8.00
-6.00
-4.00
-2.00
0.00
2.00
4.00
1970 1975 1980 1985 1990 1995 2000 2005 2010 2015
Te
mp
Dif
fere
nce
(°F
)
Year
July Min Temp Difference
Figure 33

Remar 49
-8.00
-7.00
-6.00
-5.00
-4.00
-3.00
-2.00
-1.00
0.00
1.00
2.00
3.00
1970 1975 1980 1985 1990 1995 2000 2005 2010 2015
Te
mp
Dif
fere
nce
(°F
)
Year
October Max Temp Difference
Figure 34
-10.00
-8.00
-6.00
-4.00
-2.00
0.00
2.00
4.00
1970 1975 1980 1985 1990 1995 2000 2005 2010 2015
Te
mp
Dif
fere
nce
(°F
)
Year
October Min Temp Difference
Figure 35


![ORIGINAL ARTICLE - CORE · quad-helix treatment were greater than [1–3], or comparable with [4], those of the expansion plate treatment. Others evaluated the maxillary expansion](https://img.dokumen.tips/doc/110x75/5e7fb15c1e3ebb3d5e25c58a/original-article-core-quad-helix-treatment-were-greater-than-1a3-or-comparable.jpg)