Embed Size (px)
Citation preview

www.ccsa.ca • www.cclt.ca
Opal A. McInnis, MSc
Research and Policy Analyst, Canadian Centre on Substance Abuse
Matthew M. Young, PhD
Senior Research and Policy Analyst, Canadian Centre on Substance Abuse
Student Drug Use Surveys Working Group
Urban and Rural Student
Substance Use
Technical Report
September 2015
www.ccsa.ca • www.cclat.ca

Urban and Rural Student
Substance Use
Technical Report
This document was published by the Canadian Centre on Substance Abuse (CCSA).
Suggested citation: McInnis, O.A., Young, M.M., Saewyc, E., Jahrig, J., Adlaf, E., Lemaire, J., Taylor,
S., Pickett, W., Stephens, M., Di Gioacchino, L., Pica, L., Levin, D., Tonita, A., Wang, H., & Xiong, H.
(2015). Urban and Rural Student Substance Use, Ottawa, Ont.: Canadian Centre on Substance
Abuse.
© Canadian Centre on Substance Abuse, 2015.
CCSA, 500–75 Albert Street
Ottawa, ON K1P 5E7
Tel.: 613-235-4048
Email: [email protected]
Production of this document has been made possible through a financial contribution from Health
Canada. The views expressed herein do not necessarily represent the views of Health Canada.
The Student Drug Use Surveys Working Group would like to thank Manon Mireault of the Office of
Research and Surveillance, Controlled Substances and Tobacco Directorate, Healthy
Environments and Consumer Safety Branch, Health Canada for contributing the Youth Smoking
Survey data and attending working group meetings in an observer and advisory capacity.
This document can also be downloaded as a PDF at www.ccsa.ca
Ce document est également disponible en français sous le titre :
Consommation de substances chez les élèves en milieu rural ou urbain
ISBN 978-1-77178-289-0

Urban and Rural Student Substance Use
Canadian Centre on Substance Abuse • Centre canadien de lutte contre les toxicomanies
Table of Contents
Executive Summary ..................................................................................................................................... 1 Background ............................................................................................................................................ 1 Methods ................................................................................................................................................. 1 Results ................................................................................................................................................... 2 Implications............................................................................................................................................ 2 Conclusions and Next Steps ................................................................................................................. 3
Introduction .................................................................................................................................................. 4 Urban versus Rural Settings ................................................................................................................. 4 Substance Use in Urban versus Rural Settings ................................................................................... 4 The Student Drug Use Surveys Working Group ................................................................................... 5
Methods ........................................................................................................................................................ 6 Defining Rurality .................................................................................................................................... 6 Analytic Strategy .................................................................................................................................... 6 Outcome Variables ................................................................................................................................ 7 Differences in Contributing Surveys ..................................................................................................... 7
Results .......................................................................................................................................................... 8 Alcohol .................................................................................................................................................... 8
Alcohol Use ...................................................................................................................................... 8 Consumption of 5+ Drinks on a Single Occasion ......................................................................... 9 Driving after Alcohol Use ............................................................................................................. 10
Cannabis Use ...................................................................................................................................... 11 Daily or Almost Daily Cannabis Use ............................................................................................ 12 Driving after Cannabis Use .......................................................................................................... 13
Illicit Drug Use ..................................................................................................................................... 14 Prescription Drug Abuse..................................................................................................................... 15
Survey Specific Analyses ............................................................................................................. 15 Summary of Findings.......................................................................................................................... 16
Discussion ................................................................................................................................................. 17 Alcohol ................................................................................................................................................. 17 Drinking and Driving ........................................................................................................................... 17 Cannabis Use ...................................................................................................................................... 18 Cannabis Use and Driving .................................................................................................................. 18 Illicit Drug Use and Prescription Abuse ............................................................................................. 18 Implications......................................................................................................................................... 18 Limitations and Strengths .................................................................................................................. 19 Future Research ................................................................................................................................. 20 Conclusion .......................................................................................................................................... 20
References ................................................................................................................................................ 21 Appendix A: Operational Definition of Rural ............................................................................................ 24 Appendix B: Question Wording and Comparisons in Predictors Used in
the Logistic Regression Analysis .............................................................................................................. 25 Appendix C: Common Outcomes across the Surveys: Methods of Assessment ................................... 26 Appendix D: Survey Design Variables of Contributing Surveys .............................................................. 30 Appendix E: Odds Ratios with 95% Confidence Intervals for Bivariate and Multivariate Models ........ 31

Urban and Rural Student Substance Use
Canadian Centre on Substance Abuse • Centre canadien de lutte contre les toxicomanies
Author Author
Opal A. McInnis, MSc
Research and Policy Analyst
Canadian Centre on Substance Abuse
Matthew M. Young, PhD
Senior Research and Policy Analyst
Canadian Centre on Substance Abuse
Adjunct Research Professor of Psychology
Carleton University
Student Drug Use Surveys (SDUS) Working Group
Current members of the SDUS Working Group in order of membership seniority
Elizabeth Saewyc, PhD, RN (Co-Chair)
University of British Columbia School of Nursing
McCreary Centre Society, British Columbia
Jesse Jahrig (Co-Chair)
Alberta Health Services
Ed Adlaf, PhD
Centre for Addiction and Mental Health
Jackie Lemaire
Addiction Foundation of Manitoba
Stacy Taylor
Department of Health New Brunswick
William Pickett, Ph.D.
Faculty of Health Sciences, Queen's University
Michael Stephens
Canadian Centre on Substance Abuse
Lisha Di Gioacchino
Canadian Centre on Substance Abuse
Lucille Pica
Institut de la statistique du Québec
Daniel Levin
Addiction Foundation of Manitoba
Adam Tonita
Alcohol and Drug Education and Prevention
Directorate, Community Care Branch, Ministry of
Health, Saskatchewan
Hao Wang
Department of Health New Brunswick
Hui Xiong
Newfoundland and Labrador Centre for Health
Information

Urban and Rural Student Substance Use
Canadian Centre on Substance Abuse • Centre canadien de lutte contre les toxicomanies 1
Executive Summary
Background
Differences in economic, cultural, social and educational factors between urban and rural areas in
Canada might influence behavioural and mental health outcomes. However, most research
assessing differences in urban and rural patterns of substance use has been conducted in the
United States. Within Canada, information is limited on whether students who attend urban and rural
schools differ in substance use. To address this gap, this report analyzes data from regularly
occurring student surveys and outlines differences and similarities between students who attend
urban and rural schools. Though this report is technical in nature, it has implications for a broader
audience such as those working in prevention programming and schools, and others who work with
youth. Understanding differences in Canada between adolescent students in urban and rural
communities can help guide best practices in prevention programs for schools and communities.
Methods
To develop a picture of student substance use across Canada, and to help understand differences in
students who attend urban and rural schools, data from regularly occurring student surveys were
contributed to the Canadian Centre on Substance Abuse (CCSA) by members of the Student Drug
Use Surveys (SDUS) Working Group. The SDUS group represents jurisdictions with dedicated
programs of reliable, valid, regularly occurring, provincial or national student surveys. The SDUS
members contributed data from the following surveys:
British Columbia Adolescent Health Survey (2013)
Alberta data from the Youth Smoking Survey (2012–2013)
Alcohol and Other Drugs: Students in Manitoba survey (2007)
Quebec Survey of Smoking, Alcohol, Drugs and Gambling in High School Students (2013)
Student Drug Use Survey in the Atlantic Provinces:
• Newfoundland and Labrador (2012)
• New Brunswick (2012)
National data from the Youth Smoking Survey (YSS) (2012–2013)
Health Behaviour in School-Aged Children (HBSC) survey (2009–2010)
Rurality was determined using school postal codes and defined using the statistical area
classification system developed by Statistics Canada (2001). Estimates were provided by each
survey for urban and rural settings to determine approximate prevalence rates for the following
outcomes: alcohol use, drinking five or more drinks on a single occasion, driving after alcohol or
cannabis use, cannabis use, daily or almost daily cannabis use, illicit drug use, and prescription drug
abuse. Second, these same outcomes were assessed by each contributing survey using multivariate
logistic regressions controlling for sex, grade level (or age), with grades assessed ranging from seven
to 12 depending on the survey, and socioeconomic status to determine if they differed as a function
of whether students attended school in an area defined as urban or rural.

Urban and Rural Student Substance Use
Canadian Centre on Substance Abuse • Centre canadien de lutte contre les toxicomanies 2
Results
Overall, the most consistent findings were related to alcohol use and associated risk behaviours. Seven
out of eight of the contributing surveys indicated that students who attended schools in rural settings
were more likely to report alcohol use. Students who attended rural schools were also more likely to
report drinking five or more drinks on a single occasion with five out of the eight surveys observing a
significant effect. Of the surveys that assessed drinking and driving, three out of four reported that
students in a rural setting were more likely to report driving after consuming alcohol.
Rural students were also found to be more likely to drive after using cannabis according to three of
the four surveys that assessed this outcome. Findings with respect to cannabis use in general,
however, were mixed, with three out of eight surveys indicating students who attended school in a
rural setting were more likely to report cannabis use. Only two of eight surveys found that students
who attended rural schools were at increased likelihood of daily or almost daily cannabis use.
Finally, reports of differences in illicit drug use (other than cannabis) among students in urban versus
rural settings were mixed, with only three out of the eight surveys finding that students who attended
rural schools were more likely to report this outcome. Prescription drug abuse did not vary
appreciably by setting as only one out of seven surveys observed a significant effect.
None of the eight surveys drawn on for this report found that urban students were more like to report
any of the outcomes explored.
Implications
The current report has implications for the way communities and schools in rural settings address
youth alcohol use and associated risk behaviour prevention. School boards might want to ask if rural
students have equal access to the treatment and prevention resources and services available to
their urban counterparts. Further research might explore if it is beneficial to provide additional or
specialized training for those responsible for youth drug use prevention services in rural settings. The
question of access for rural youth to services and resources for risky substance use should be asked
to determine if alternative treatment and prevention methods of delivery might be beneficial in rural
schools. Some studies have suggested that increased substance use among rural youth could be
due to limited access to drug education and treatment services that might be available in more
populated centres (Conger, 1997; DeVoe, Krois, & Stenger, 2009).
Other recommendations include examining the infrastructure of rural communities to assess whether
disparities exist between these communities and urban settings with respect to part-time job
opportunities, sport, music, clubs and so on. Building capacity within communities to enhance various
protective factors (e.g., extracurricular activities) and to limit risk factors (e.g., negative social influences)
should always be considered in initiatives aimed at preventing youth substance use (Canadian Centre
on Substance Abuse, 2010; United Nations Office on Drugs and Crimes, 2013). It would also be helpful
to examine further how students travel from parties, schools and other events in an effort to assess
what can be done to support easier access to safe transportation for rural youth. Finally, engaging youth
in the development of preventive approaches might provide the most effective way to initiate change.
These suggestions are speculative and further evidence is required to determine the effectiveness of
these approaches in preventing or reducing substance use and associated risky behaviours among
rural students. While rural students appeared to be at greater risk of reporting substance use and
risk behaviours as compared to urban students, urban students continue to use substances and the
need to improve prevention efforts for all youth remains.
Urban and Rural Student Substance Use
Canadian Centre on Substance Abuse • Centre canadien de lutte contre les toxicomanies 3
Conclusions and Next Steps
Together, national and provincial data indicate that students who attend schools in rural settings are
at increased likelihood of reporting certain outcomes related to substance use, predominantly those
pertaining to alcohol use and associated risk behaviours. Longitudinal data are needed to determine
whether the differences in rural student substance use and risky behaviours observed in this report
are linked to later health disparities in urban versus rural communities. These findings are an
essential first step towards obtaining a cross-Canada picture of urban-rural student differences and
point to key areas where drug prevention strategies could be tailored for rural youth.

Urban and Rural Student Substance Use
Canadian Centre on Substance Abuse • Centre canadien de lutte contre les toxicomanies 4
Introduction The substances Canadian youth ages 15–19 most commonly reported using are alcohol (60%),
cannabis (22%), psychoactive pharmaceutical drugs (non-medical use; 10%) and hallucinogens
(3.0%) (Statistics Canada, 2015). Risky behaviours associated with substance use have also been
reported among Canadian students. Among adolescent drivers in grades 10–12 in Ontario, 4%
reported driving after the consumption of alcohol and close to 10% had driven after smoking
cannabis (Boak, Hamilton, Adlaf, & Mann, 2013). Despite the prevalence of alcohol and drug use
among youth, there are under-investigated factors that might influence the prevalence and harms of
substance use among youth. For instance, Canada-wide data are lacking on whether the prevalence
and harms of alcohol and other drugs differ between youth living in urban versus rural settings.
Urban versus Rural Settings
Differences related to economic, cultural, social and educational factors across urban versus rural
areas could influence behavioural and mental health outcomes. For example, rural adults living on
farms report greater levels of anxiety and depressive symptoms, as well as an increased risk of
suicide (Gregoire, 2002; Sanne, Mykletun, Moen, Dahl, & Tell , 2004), while adults living in urban
settings appear to be at a greater risk of developing schizophrenia (van Os, Kenis, & Rutten, 2010).
There have also been differences observed in urban-rural patterns of substance use, but this
research has been mainly conducted among American students. To date, there has been no cross-
Canadian research conducted to determine whether there are differences in prevalence and harms
of alcohol and other drug use between students living in urban versus rural settings and, if
differences exist, what approaches are needed to promote health equity related to substance use.
Substance Use in Urban versus Rural Settings
Most research assessing urban-rural patterns of substance use has been conducted in the United
States. Though illicit drug use among those living in rural settings has historically been viewed as
less common than those in urban settings (Pruitt, 2009), in recent years illicit drug use in rural
regions of the United States has caught up to or in some instances exceeded that of urban and
suburban communities (Dew, Elifson, & Dozier, 2007). There is also evidence that the rate of drug
deaths related to heroin, cocaine and opioid analgesic in the United States has been increasing
more rapidly in rural compared to urban areas (248% vs. 16%; Paulozzi & Xi, 2008).
Among American youth, those living in a rural setting are more likely to report use of alcohol, compared
to those living in urban areas (Coomber et al., 2011; Hanson et al., 2009; National Center on Addiction
and Substance Abuse, 2000; Rhew, Hawkins, & Oesterle, 2011). The former group is also more likely to
report heavy drinking on one occasion and risk behaviours, such as drinking and driving, or driving
under the influence of illicit drugs (Cronk & Sarvela, 1997; Lambert, Gale, & Hartley, 2008).
Findings are somewhat mixed for substances other than alcohol, with some reports indicating higher
use levels of drugs such as cannabis, methamphetamines, cocaine and inhalants among youth living
in rural settings (Aronson, Feinberg, & Kozlowski, 2009; Coomber et al., 2011; Gfroerer, Larson, &
Colliver, 2007; Lambert et al., 2008; National Center on Addiction and Substance Abuse, 2000;
Rhew et al., 2011). Others report greater levels of illicit substance use in urban populations (Hanson
et al., 2009). Still others report no urban-rural differences in illicit substance use (Cronk & Sarvela,
1997); for instance, the 2013 Monitoring the Future Survey (the U.S. national school-based survey)
indicated there has not been any appreciable or consistent data to suggest differences in adolescents’

Urban and Rural Student Substance Use
Canadian Centre on Substance Abuse • Centre canadien de lutte contre les toxicomanies 5
illicit substance use associated with population density (Johnston, O’Malley, Miech, Bachman, &
Schulenberg, 2014). Across these studies operational definitions for “urban” and “rural” settings
vary substantially and so comparisons of these findings should be interpreted with caution.
Canadian information is limited on whether urban and rural differences exist in relation to substance
use. Analysis of the 2001–2002 Health Behaviour in School-Aged Children (HBSC) survey indicated
that adolescents (11–15 years of age) living in rural areas consume a greater amount of alcohol and
were at a greater risk of alcohol-related injuries compared to their urban counterparts (Jiang, Li,
Boyce, & Pickett, 2008). Similarly, a recent report that examined data collected from the HBSC
survey indicated that adolescent students who were living in rural regions closer to metropolitan
areas had higher rates of prescription drug misuse (Pulver, Davison, & Pickett, 2014). Other reports
have indicated that rural Canadian youth might be more likely to engage in risky behaviours such as
riding in a car with an individual who had used alcohol or cannabis (Leadbeater, Foran, & Grove‐White, 2008; Poulin, Boudreau, & Asbridge, 2006).
The 2011 Ontario Student Drug Use and Health Survey indicated that compared to urban and
suburban students, those in rural areas reported greater use of alcohol, methamphetamine and non-
medical use of prescription opioid pain relievers for non-medical purposes, over-the-counter cold
medication and stimulants. In contrast, urban and suburban students were more likely to report
using inhalants compared to rural students. Importantly, students in rural areas were more apt to
report drinking and driving, or being a passenger in a vehicle with a driver who had been drinking
alcohol (Centre for Addiction and Mental Health, 2012). Likewise, data from the HBSC survey also
indicated that students were at increased risk of operating a motor vehicle after using alcohol,
cannabis or illicit drugs if they were from a rural community (Pickett et al., 2012). These findings
underscore the importance of further delineating urban and rural differences among Canadian youth
to inform the development of effective, context-specific prevention and treatment programs.
To better understand whether urban-rural differences exist in substance use among Canadian
students, representatives from the eight regularly occurring student surveys or health surveys which
assess drug and alcohol use, agreed to re-analyze data from their surveys. National estimates were
provided by the HBSC survey and the Youth Smoking Survey (YSS). This analysis will describe
similarities and differences in alcohol and other drug use between students who attend schools in
rural and urban settings, and make suggestions about how programs can address these differences
through effective context-specific practices in substance use prevention and treatment.
The Student Drug Use Surveys Working Group
The Canadian Centre on Substance Abuse (CCSA) was given the mandate under Canada’s renewed
National Anti-Drug Strategy to work with an expert group to support the collection of student drug use
data in provinces and territories. The Student Drug Use (SDUS) Working Group was formed, consisting of
representatives from jurisdictions with dedicated programs of reliable, valid, regularly occurring,
provincial or national student surveys. In December, 2012 under its new mandate, the SDUS
Working Group decided that the great diversity of questions asked and data collected by the various
surveys offered an opportunity to explore more specific questions about student drug use across
Canada. The working group decided that it would focus on specific research topics of interest. The
first topic the group chose to assess was the prevalence and harms of substance use among
students who attend schools in urban and rural settings.

Urban and Rural Student Substance Use
Canadian Centre on Substance Abuse • Centre canadien de lutte contre les toxicomanies 6
Methods In an effort to develop a picture of student substance use across Canada, and to allow for an
understanding of urban and rural differences, data from regularly occurring student surveys were
contributed by members of the SDUS Working Group. These include the British Columbia: Adolescent
Health Survey (2013); Alberta data from the Youth Smoking Survey (2012–2013); the Alcohol and
Other Drugs: Students in Manitoba Survey (2007); the Quebec Survey of Smoking, Alcohol, Drugs
and Gambling in High School Students (2013); the Student Drug Use Survey in the Atlantic Provinces
(data collected from Newfoundland and Labrador, and New Brunswick in 2012); as well as national-
level data from Health Canada’s Youth Smoking Survey (YSS) (2012–2013) and the Health
Behaviour in School-Aged Children (HBSC) survey (2009–2010).
Defining Rurality
Rurality was determined according to the postal codes of the various school locations. “Urban”
versus “rural” participants were defined using the statistical area classification system developed by
Statistics Canada. (See Appendix A for more information.) Therefore, this report assesses differences
in students who attend schools located in urban versus rural settings and does not necessarily
reflect differences in students who live in urban or rural communities. The category “rural”
encompassed rural and remote communities and small towns. A binary classification scheme of
urban and rural — rather than a scheme using more than two categories or a continuous measure —
was chosen in an effort to limit the complexity of the results from multiple surveys and to avoid the
complex interpretation that would have been required for multiple categories across urban-rural
regions from eight different surveys.
Analytic Strategy
In March 2014, the SDUS working group developed a common model to conduct analyses across
multiple jurisdictional and national surveys. First, estimates were provided by each survey for urban
and rural settings to determine approximate prevalence rates of alcohol and other drug use and
associated risk behaviours. Second, working group members from each contributing survey
conducted a multivariate logistic regression to control for sex, age (or grade level as a proxy for age)
and socioeconomic status to determine if agreed-upon common outcomes (outlined below) differed
as a function of whether students attended a school in an area defined as urban or rural.
Socioeconomic status was operationally defined differently across the surveys. Grade levels ranged
from seven to 12 depending on the survey. Differences among surveys can be found in Appendix B.
Data are presented in odds ratios. Significance was determined using 95% confidence intervals. All
analyses accounted for the clustered nature of the study design. To aid in the understanding and
interpretation of the odds ratios, size of odds ratios are grouped into categories and labelled low,
moderate or high. These categories are based on previous studies that have used a similar
categorization of odds ratios (e.g., Iles, Davidson, Taylor, & O’Halloran, 2009). However, these
qualitative labels should be interpreted cautiously. Direct comparisons of odds ratios generated from
the participating surveys are not appropriate due to variations in survey sampling and methodology.
The median (i.e., the value separating the higher half of the data from the lower half) and range of
each outcome is also provided to allow for an approximation of prevalence for each indicator.
However, survey-specific estimates of prevalence are not provided to limit comparisons across the
surveys; such comparison would be problematic because of differences in sampling and
methodology across surveys.

Urban and Rural Student Substance Use
Canadian Centre on Substance Abuse • Centre canadien de lutte contre les toxicomanies 7
Outcome Variables
Though there was considerable variability in questionnaire wording among contributing surveys, the
following common outcomes were agreed-upon by the SDUS Working Group and assessed (see
Appendix C for information about variables specific to the individual surveys):
Alcohol use refers to the proportion of students who reported using alcohol. British Columbia
assessed past 30-day use, whereas all other surveys assessed alcohol use in the past 12
months.
Cannabis use refers to the proportion of students who reported using cannabis. British Columbia
assessed past 30-day use, whereas all other surveys assessed use in the past 12 months.
Illicit drug use (excluding cannabis and prescription drugs) refers to the proportion of students
who reported using illicit drugs. British Columbia and HBSC assessed lifetime prevalence,
whereas all others assessed use in the past 12 months.
Prescription drug abuse refers to the proportion of students who reported abusing prescription
drugs at least once in the past 12 months.1 British Columbia assessed lifetime use, whereas all
other surveys assessed use in the past 12 months.
Driving after alcohol use refers to the proportion of students who reported driving after alcohol
use.1,2 New Brunswick and Newfoundland and Labrador assessed past 12 months of driving
within an hour of consuming alcohol, whereas the other surveys that measured this indicator
assessed lifetime occurrence.
Consumption of 5+ drinks on a single occasion refers to the proportion of students who reported
five or more drinks on a single occasion in the past year (HBSC, YSS, Alberta (YSS), Manitoba and
Quebec) or past 30 days (British Columbia, Newfoundland and Labrador, and New Brunswick)
(see Appendix C for wording specific to the individual surveys).
Daily or almost daily use of cannabis refers to the proportion of students who reported daily or
almost daily use of cannabis. British Columbia and HBSC assessed use in the past 30-days,
whereas all other surveys assessed past 12-month usage.
Driving after cannabis use refers to the proportion of students who reported driving after
cannabis use.2 New Brunswick and Newfoundland and Labrador assessed the occurrence of
driving within an hour of cannabis use in the past 12 months, whereas the other surveys
assessed lifetime occurrence.
Differences in Contributing Surveys
Differences in survey design methodologies across the provinces can affect estimates. These
differences include whether all school districts participate, who administers the survey (e.g.,
teachers, public health nurses, research staff), and how well students trust that their answers will be
maintained in confidence. Differences in samples sizes and other methodological factors among the
surveys can be found in Appendix D.
1 Data not available for Quebec
2 Data not available for national and Alberta analysis of the YSS or HBSC.
Urban and Rural Student Substance Use
Canadian Centre on Substance Abuse • Centre canadien de lutte contre les toxicomanies 8
Results
Alcohol
Alcohol Use
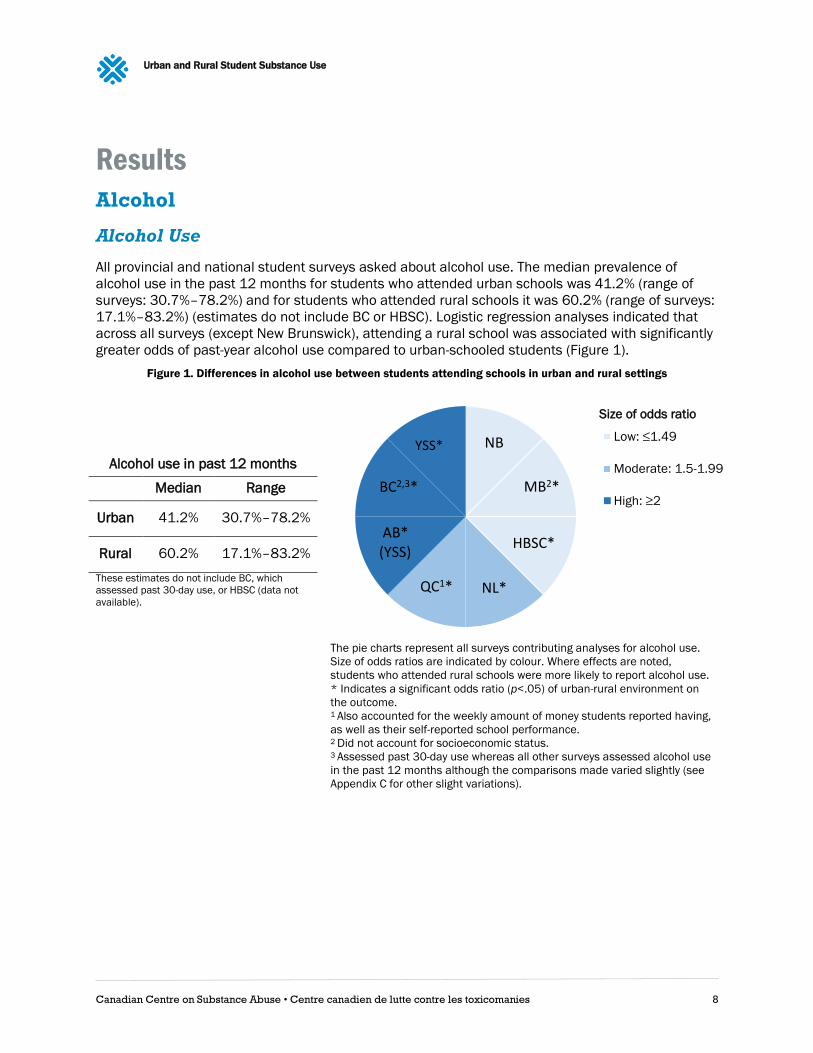
All provincial and national student surveys asked about alcohol use. The median prevalence of
alcohol use in the past 12 months for students who attended urban schools was 41.2% (range of
surveys: 30.7%–78.2%) and for students who attended rural schools it was 60.2% (range of surveys:
17.1%–83.2%) (estimates do not include BC or HBSC). Logistic regression analyses indicated that
across all surveys (except New Brunswick), attending a rural school was associated with significantly
greater odds of past-year alcohol use compared to urban-schooled students (Figure 1).
Figure 1. Differences in alcohol use between students attending schools in urban and rural settings
The pie charts represent all surveys contributing analyses for alcohol use.
Size of odds ratios are indicated by colour. Where effects are noted,
students who attended rural schools were more likely to report alcohol use.
* Indicates a significant odds ratio (p<.05) of urban-rural environment on
the outcome. 1 Also accounted for the weekly amount of money students reported having,
as well as their self-reported school performance. 2 Did not account for socioeconomic status. 3 Assessed past 30-day use whereas all other surveys assessed alcohol use
in the past 12 months although the comparisons made varied slightly (see
Appendix C for other slight variations).
Low: ≤1.49
Moderate: 1.5-1.99
High: ≥2MB2*BC2,3*
AB*(YSS)
NB
NL*
HBSC*
QC1*
YSS*Alcohol use in past 12 months
Median Range
Urban 41.2% 30.7%–78.2%
Rural 60.2% 17.1%–83.2%
These estimates do not include BC, which
assessed past 30-day use, or HBSC (data not
available).
Size of odds ratio

Urban and Rural Student Substance Use
Canadian Centre on Substance Abuse • Centre canadien de lutte contre les toxicomanies 9
Consumption of 5+ Drinks on a Single Occasion
The median prevalence of consuming five or more drinks on a single occasion among students from
urban schools was 25.2% (range of surveys: 23.9%–59.3%) and for students from rural schools it
was 51.0% (range of surveys: 43.7%–61.2%) (estimates do not include MB, BC, NB, NL or HBSC).
Findings were mixed with respect to whether rural students were at an increased risk of consuming
five or more drinks on a single occasion with five of the eight surveys reporting this association as
significant (Figure 2).
Figure 2. Differences in consumption of five or more drinks on a single occasion between students attending schools
in urban and rural settings
The pie charts represent all surveys contributing analyses for consumption of
five or more drinks on a single occasion. Size of odds ratios are indicated by
colour. Where effects are noted, students who attended rural schools were
more likely to report 5+ drinks on a single occasion drinking.
* Indicates a significant odds ratio (p<.05) of urban-rural environment on
the outcome. 1 Also accounted for the weekly amount of money students reported having,
as well as their self-reported school performance. 2 Did not account for socioeconomic status. 3 Assessed past 30-day excessive drinking whereas all other surveys
assessed excessive drinking in the past-12 months (see Appendix C for other
slight variations).
Low: ≤1.49
Moderate: 1.5-1.99
High: ≥2
MB2*
BC2,3*
YSS*
AB*(YSS)
NB3
NL3
HBSC*
QC1
5+ drinks on a single occasion
drinking in past 12 months
Median Range
Urban 25.2% 23.9%–59.3%
Rural 51.0% 43.7%–61.2%
These estimates do not include MB, BC, NB, or
NL, which assessed past 30 days, as well as
HBSC (data not available).
Size of odds ratio

Urban and Rural Student Substance Use
Canadian Centre on Substance Abuse • Centre canadien de lutte contre les toxicomanies 10
Driving after Alcohol Use
The median prevalence of driving after alcohol use in the past 12 months was not calculated as
there were only two data points that measured past-year incidence of this behaviour (NB and NL,
whereas BC and MB assessed lifetime incidence). The range of past 12-months driving after alcohol
use among students who attended urban schools was 2.2%–9.8%, and for students who attended
rural schools it was 4.3%–17.1% (estimates do not include MB, BC or HBSC). Three of the four
surveys that assessed driving after drinking indicated students who attended school in a rural setting
had greater odds of engaging in this behaviour than those who attended school in an urban setting
(Figure 3). Data from the HBSC survey were not included in the figure as a combined question was
used to assess past 30-days driving after drinking alcohol, using marijuana or illegal drugs. In line
with other findings, results indicated that rural students also had significantly greater odds of
reporting this combined outcome of substance use and driving (odds ratio = 2.07 [1.57–2.71]).
Figure 3. Differences in driving after alcohol use between students attending schools in urban and rural settings
The pie charts represent all surveys contributing analyses for driving after
alcohol use. Size of odds ratios are indicated by colour. Where effects are
noted, students who attended rural schools were more likely to report driving
after drinking alcohol.
* Indicates a significant odds ratio (p<.05) of urban-rural environment on
the outcome. 1 Did not account for socioeconomic status. 2 Assessed past 12 months of driving within an hour of consuming alcohol. 3 Assessed lifetime prevalence of driving after alcohol consumption (see
Appendix C for other slight variations).
Low: ≤1.49
Moderate: 1.5-1.99
High: ≥2
MB1,3*
BC1,3* NB2
NL2*
Driving after alcohol use in past
12 months
Median Range
Urban N/A 2.2%–9.8%
Rural N/A 4.3%–17.1%
These estimates do not include BC and MB,
which assessed lifetime incidence, or HBSC
(data not available). Medians were not
calculated as there were only two data points.
Size of odds ratio

Urban and Rural Student Substance Use
Canadian Centre on Substance Abuse • Centre canadien de lutte contre les toxicomanies 11
Cannabis Use
Based on data from provincial and national student surveys, the median prevalence of cannabis use
in the past 12 months among those attending school in an urban setting was 21.2% (range of
surveys: 15.0%–32.8%). The corresponding figure for those attending rural schools was 24.1%
(range of surveys: 8.7%–30.5% (estimates do not include BC or HBSC). Most surveys indicated that
school setting was not associated with past-year cannabis use. However, the national YSS, the
Alberta component of the YSS, as well as the British Columbia survey, found rural students had
greater odds of cannabis use. Of note here, however, is that the British Columbia survey assessed
past 30-day cannabis use (Figure 4).
Figure 4. Differences in cannabis use between students attending schools in urban and rural settings
The pie charts represent all surveys contributing analyses for cannabis use.
Size of odds ratios are indicated by colour. Where effects are noted,
students who attended schools were more likely to report cannabis use.
* Indicates a significant odds ratio (p<.05) of urban-rural environment on
the outcome. 1 Also accounted for the weekly amount of money students reported having,
as well as their self-reported school performance. 2 Did not account for socioeconomic status. 3 Assessed past 30-days whereas all other surveys assessed past 12-months
(see Appendix C for other slight variations).
Low ≤1.49
Moderate: 1.5-1.99
MB2
BC2,3*
YSS*
AB*(YSS) NB
NL
HBSC
QC1
Cannabis use in past 12 months
Median Range
Urban 21.2% 15.0%–32.8%
Rural 24.1% 8.7%–30.5%
These estimates do not include BC, which
assessed past 30-days, or HBSC (data not
available).
Size of odds ratio

Urban and Rural Student Substance Use
Canadian Centre on Substance Abuse • Centre canadien de lutte contre les toxicomanies 12
Daily or Almost Daily Cannabis Use
The median prevalence of past-year daily or near daily cannabis was the same across students who
attended urban (5.9%; range of surveys: 3.1%–13.3%) and rural schools (5.9%; range of surveys:
1.4%–21.2%) (estimates do not include BC, NB, NL or HBSC). The data indicated that there was no
consistent association between students who attended school in an urban versus rural setting on
daily or near daily use of cannabis as only two (Manitoba and British Columbia) of the eight surveys
indicated that students who attended a rural school had greater odds of reporting daily or near daily
cannabis use (Figure 5).
Figure 5. Differences in daily or almost daily cannabis use between students attending schools in urban and rural
settings
The pie charts represent all surveys contributing analyses for daily or almost
daily cannabis use. Size of odds ratios are indicated by colour. Where effects
are noted, students who attended rural schools were more likely to report
daily or near daily use of cannabis.
* Indicates a significant odds ratio (p<.05) of urban-rural environment on
the outcome. 1 Also accounted for the weekly amount of money students reported having,
as well as their self-reported school performance. 2 Did not account for socioeconomic status. 3 Assessed past 30-days whereas all other surveys assessed past
12-months (see Appendix C for other slight variations).
Low: ≤1.49
Moderate: 1.5-1.99
MB2*
BC2,3*
YSSAB(YSS)
NB3
NL3
HBSC3
QC1
Daily or almost daily cannabis use
in past 12 months
Median Range
Urban 5.9% 3.1%–13.3%
Rural 5.9% 1.4%–21.2%
These estimates do not include BC, NL and NB,
which assessed past 30-days, or HBSC (data not
available).
Size of odds ratio

Urban and Rural Student Substance Use
Canadian Centre on Substance Abuse • Centre canadien de lutte contre les toxicomanies 13
Driving after Cannabis Use
The median prevalence of driving after cannabis use in the past 12 months is not provided as there
were only two data points that measure past-year incidence of this behaviour (NB and NL, whereas
BC and MB assessed lifetime incidence). The range of driving after cannabis use among urban
students was 7.2%–13.3%; among rural students, the range was 6.2%–8.1% (estimates do not
include BC, MB or HBSC). Multivariate logistic regression analyses indicated that attending a rural
school appeared to be associated with greater odds of driving after cannabis use in three of the four
surveys that provided data on this measure (Figure 6).
Figure 6. Differences in driving after cannabis use between students attending schools in urban and rural settings
The pie charts represent all surveys contributing analyses for driving after
cannabis use. Size of odds ratios are indicated by colour. Where effects are
noted, students who attended rural schools were more likely to report
driving after cannabis use.
* Indicates a significant odds ratio (p<.05) of urban-rural environment on
the outcome. 1 Did not account for socioeconomic status. 2 Assessed past 12 months of driving within an hour of using cannabis. 3 Assessed lifetime prevalence of driving after using cannabis (see Appendix
C for other slight variations).
Low: ≤1.49
Moderate: 1.5-1.99
MB1,3*
BC1,3*
NB2*
NL2Driving after cannabis use in past
12 months
Median Range
Urban N/A 7.2%–13.3%
Rural N/A 6.2%–8.1%
†These estimates do not include BC and MB,
which assessed lifetime incidence, or HBSC (data
not available). Medians were not calculated as
there were only two data points
Size of odds ratio

Urban and Rural Student Substance Use
Canadian Centre on Substance Abuse • Centre canadien de lutte contre les toxicomanies 14
Illicit Drug Use
All surveys assessed illicit drug use (other than cannabis). The median prevalence of past-year illicit
drug use among urban students was 6.5% (range of surveys: 3.5%–10.5%) compared with 7.3%
(range of surveys: 6.1%–10.2%) of rural students (estimates do not include BC, NB, NL or HBSC).
Most surveys indicated no urban-rural drug differences; however results revealed that the surveys
found that the odds of illicit drug use was greater for students who attended a rural-school than
those who attended an urban school in the YSS, the Alberta component of the YSS and the British
Columbia surveys (Figure 7).
Figure 7. Differences in illicit drug use between students attending schools in urban and rural settings
The pie charts represent all surveys contributing analyses for illicit drug use.
Size of odds ratios are indicated by colour (see legend). Where effects are
noted, students who attended rural schools were more likely to report illicit
drug use.
* Indicates a significant odds ratio (p<.05) of urban-rural environment on
the outcome. 1 Also accounted for the weekly amount of money students reported having,
as well as their self-reported school performance. 2 Did not account for socioeconomic status. 3 Assessed lifetime use. 4 Assessed past 12-months use (See Appendix C for other slight variations).
Low: ≤ 1.49
Moderate: 1.5-1.99
MB2,4
BC2,3*
YSS4*
AB4*(YSS)
NB4
NL4
HBSC3
QC1,4
Illicit drug use in past 12 months
Median Range
Urban 6.5% 3.5%–10.5%
Rural 7.3% 6.1%–10.2%
These estimates do not include BC, NL and NB,
which assessed lifetime use, or HBSC (data not
available).
Size of odds ratio

Urban and Rural Student Substance Use
Canadian Centre on Substance Abuse • Centre canadien de lutte contre les toxicomanies 15
Prescription Drug Abuse
The median prevalence of past-year prescription drug abuse was 8.5% (range of surveys: 3.5%–
15.8%) and 5.4% (range of surveys: 5.1%–16.3%) among students who attended urban and rural
schools, respectively (estimates do not include BC or HBSC). Similar to what was observed with illicit
drug use, no consistent urban-rural differences were observed with respect to rates of prescription
drug abuse. Only one of the YSS found that students who attended rural-schools had greater odds of
reporting prescription drug abuse (Figure 8).
Figure 8. Differences in prescription drug abuse between students attending schools in urban and rural settings
The pie charts represent all surveys contributing analyses for prescription
drug abuse. Size of odds ratios are indicated by colour (see legend). Where
effects are noted, students who attended rural schools were more likely to
report prescription drug abuse.
*Indicates a significant odds ratio (p<.05) of urban-rural environment on the
outcome. 1Did not account for socioeconomic status. 2Assessed lifetime use whereas all other surveys assessed past 12-months
use (See Appendix C for other slight variations).
Survey Specific Analyses
Some of the contributing surveys assessed additional outcomes to determine if they varied as a
function of whether students attended school in an urban or rural setting. Regarding other alcohol-
relevant outcomes, the HBSC observed that rural students were at greater odds of being a
passenger in a vehicle in which the driver was under the influence of drugs or alcohol (odds ratio =
1.53 [1.24–1.88]). Likewise, the YSS observed that rural students were also at greater odds of
reporting riding in a car driven by someone (including themselves) who was high or had been using
alcohol or other drugs (odds ratio = 1.75 [1.49–2.06]). Newfoundland and Labrador also observed
that students who attended a rural school were at greater odds of drinking in a licensed venue (odds
ratio = 1.5 [1.1–2.1]), but did not find any urban-rural differences in alcohol-related self-injury (odds
ratio = 0.8 [0.5–1.2]) or self-injury caused by drug use (odds ratio = 1.7 [1.0–2.8]).
Low: ≤ 1.49
MB1
BC1,2
YSS*
AB(YSS)
NB
NL
HBSCPrescription drug abuse in past
12 months
Median Range
Urban 8.5% 3.5%–15.8%
Rural 5.4% 5.1%–16.3%
These estimates do not include BC, which that
assessed lifetime use, or HBSC (data not
available).
Size of odds ratio

Urban and Rural Student Substance Use
Canadian Centre on Substance Abuse • Centre canadien de lutte contre les toxicomanies 16
Summary of Findings
Table 1. Summary of the results of multivariate logistic regressions examining urban-rural differences in substance use
and associated risk behaviour outcomes
Size of Odds Ratio
Number of surveys indicating rural
students were at a significantly
greater odds (p<.05) of reporting out
of total number of surveys assessing
the outcome*
Alcohol Use
7 out of 8 surveys
Consumption of 5+
drinks on a single
occasion
5 out of 8 surveys
Driving after alcohol
use
3 out of 4 surveys
Cannabis Use
3 out of 8 surveys
Daily or almost daily
cannabis use
2 out of 8 surveys
Driving after cannabis
use
3 out of 4 surveys
Illicit Drug Use
3 out of 8 surveys
Prescription Drug Abuse
1 out of 7 surveys
*None of the surveys indicated that students attending urban schools were more likely to report an outcome.

Urban and Rural Student Substance Use
Canadian Centre on Substance Abuse • Centre canadien de lutte contre les toxicomanies 17
Discussion The findings outlined in this report provide evidence at a cross-Canadian level that substance use
and substance-use-related risk behaviours among Canadian students might vary by geographical
setting. None of the eight studies involved in this report found urban students at increased likelihood
of reporting any of the outcomes explored. Four other main findings emerged from the analysis:
1. Students attending rural schools had a greater likelihood of reporting alcohol use and consuming
five or more drinks on a single occasion;
2. Students attending rural schools also had a greater likelihood of reporting drinking and driving,
and cannabis use and driving;
3. Some surveys noted that rural students had a greater likelihood of reporting cannabis use,
whereas others did not; and
4. There were no appreciable differences in the likelihood of reporting illicit drug use (other than
cannabis) or prescription drug abuse among students attending school in urban or rural settings.
Results of these analyses are consistent with the findings of similar studies reviewed for this report
(e.g., Centre for Addiction and Mental Health, 2012; Jiang, Li, Boyce, & Pickett, 2008).
Alcohol
Despite declining rates of substance use among adolescent students within Canada, youth continue
to use alcohol at high rates, with two in every three youth aged 15 to 19 years old reporting
consumption of alcohol in the past year (Statistics Canada, 2015). Moreover, 20% of youth drinkers
exceeded the low-risk drinking guidelines for chronic health effects and 15% exceeded amounts
linked to acute health risks (Statistics Canada, 2015; Canadian Centre on Substance Abuse, 2013).
The most consistent differences in urban-rural settings across the surveys were related to alcohol
use. Depending on the survey, students who attended school in a rural setting were close to one and
a half to three times more likely to report alcohol use in the past 12 months or 30 days. There was
some indication that rural students were also more likely to report drinking five or more drinks on a
single occasion with five out of eight surveys reporting this finding. Such results suggest that students
attending schools in rural settings could be at a greater risk for harms associated with alcohol use.
High levels of alcohol consumption among adolescents is a serious issue as it has been associated with
various negative consequences such as injuries (Swahn, Simon, Hammig, & Guerrero, 2004) and risky
sexual behaviour (Fergusson & Lynskey, 1996), as well as brain abnormalities such as, smaller cerebellar
volumes (Lisdahl, Thayer, Squeglia, McQueeny, & Tapert, 2013). Efforts focused on delaying, reducing or
preventing alcohol use among students, especially those attending schools in rural settings, and
education on the harms associated with drinking five or more drinks on a single occasion are essential.
Drinking and Driving
Among Canadian youth age 15 to 19 years old, approximately 16% reported driving after drinking
alcohol in the past 30 days in 2012 (Jonah, 2013). One third of collisions resulting in fatalities are
believed to be due to impaired driving. Many of these collisions involve youth (Traffic Injury Research
Foundation of Canada, 2011). In 2010, close to half (47.2%) of all fatal crashes among Canadian
youth aged 16 to 19 years involved alcohol (Traffic Injury Research Foundation of Canada, 2013).
The current study found that reports of driving after consuming alcohol were more likely among
students who attend schools in a rural setting compared with students in urban areas.

Urban and Rural Student Substance Use
Canadian Centre on Substance Abuse • Centre canadien de lutte contre les toxicomanies 18
Cannabis Use
Cannabis remains the illicit substance most widely used among youth in Canada; with approximately
22% of youth ages 15 to 19 reporting past-year use (Statistics Canada, 2015). The findings in the
current report do not suggest any consistent results that indicate urban or rural settings provide
either risk or protective factors for cannabis use among students. This result was also the case for
frequent cannabis use, with only two of the eight surveys indicating rural students were at increased
likelihood of reporting daily or almost daily use.
Cannabis Use and Driving
Similar to driving after alcohol use, students in rural settings appear to be more likely to report
driving after cannabis use. Identifying which youth might be more likely to engage in driving after
cannabis use is meaningful as youth are often misguided about the safety of driving after use. One
report found that students believed driving after cannabis to be the “safest way” to drive if under the
influence (Barrie, Jones, & Wiese, 2011). Moreover, it has also been observed that youth often
perceive the use of cannabis while driving to be safe, and some youth report that cannabis makes
drivers more focused (Porath-Waller, Brown, Frigon & Clark, 2013).
Illicit Drug Use and Prescription Abuse
Findings were mixed and effects were infrequently observed with respect to illicit drug use other than
cannabis, and this was also the case with the abuse of prescription drugs. One possible explanation
for why youth in rural settings were more likely to report alcohol use and drinking five or more drinks
on a single occasion, but not as consistently reported using other substances (e.g., cannabis, illicit
and prescription drugs), might be the differing normative values of urban versus rural populations
about underage drinking. While both urban and rural populations hold similar negative perceptions
and stigma toward cannabis and other drug use by youth, there is often more acceptance of
underage drinking in rural settings (Cronk & Sarvela, 1997; Alberta Alcohol and Drug Abuse
Commission, 2005). As a result, high-risk behaviours associated with alcohol consumption might be
more frequent in rural settings, although further research is needed to determine whether this link
exists. Rural communities might also have differing attitudes toward drinking or cannabis use and
driving because of the lack of public transit and taxis in rural areas. This differing attitudes might
help explain the increased odds of rural students drinking or using cannabis and driving.
Implications
Outlining the differences in patterns of substance use between urban and rural settings is important
as feelings of stigmatization, concerns around privacy when seeking treatment and a lack of
confidence in treatments for alcohol use are more prevalent among at-risk drinkers who reside in
rural areas (Fortney et al., 2004). Although not assessed in the current report, reluctance to access
treatment and stigma might be important variables to examine in future research exploring
differences in substance use patterns between urban and rural populations. Highlighting where
substance use and risk behaviour disparities exist across urban-rural settings could help inform
appropriate resource allocation and drug prevention strategies for communities at the greatest risk.
As well, many other factors such as level of access to substances, which was not assessed in the
current report, could also be accounting for urban-rural differences.

Urban and Rural Student Substance Use
Canadian Centre on Substance Abuse • Centre canadien de lutte contre les toxicomanies 19
The findings from the current report, as well as further research examining the factors accounting for
urban-rural student differences, could help inform the development of an evidence-based approach
to addressing youth alcohol use and to associated risk behaviour prevention in rural settings. For
instance, school boards might want to assess whether there is equity between the resources and
services available to rural students compared to their urban counterparts. Further research could
explore whether it is beneficial to provide additional or even specialized training for those
responsible for youth drug prevention and services within rural school settings.
The level of access that youth in rural settings have to services and resources related to risky
substance use should also be determined to ascertain if because of the geographical setting of
these schools, alternative treatment and prevention methods of delivery might be more beneficial.
Increased access to telephone or online services might be one potential avenue, if shown to be
effective. Indeed, there has also been some suggestion that higher levels of substance use among
rural youth could be due to limited drug education and treatment services because of the geographic
location of some rural communities (Conger, 1997; DeVoe et al., 2009).
Other recommendations could include schools seeking partnership opportunities with community
organizations to find ways to enhance extracurricular activities in an effort to ensure rural youth are
provided with alternative avenues of recreation. Ultimately, this recommendation might require
examining the infrastructure of rural communities to assess whether disparities exist between these
communities and urban settings with respect to part-time job opportunities, sport, music, clubs and so
on. If this is the case, finding ways to partner with organizations to bring more opportunities to youth in
rural settings could be another preventative measure. Building capacity within communities to
enhance protective factors (e.g., extracurricular activities) and limit risk factors (e.g., negative social
influences) should always be considered in initiatives aimed at preventing youth substance use
(Canadian Centre on Substance Abuse, 2010; United Nations Office on Drugs and Crimes, 2013).
Further examination of how students are travelling from parties, school and other events in an effort
to assess what can be done to support easier access to safe transportation among rural youth might
also be helpful to reduce the incidence of substance use and driving. Other factors such as mental
health, social norms and education, which were not explored in the current report, might be
influencing these differences in substance use. Finally, engaging youth in developing preventive
approaches might provide the most effective way to initiate change. Indeed, the more youth are
involved in health promotion initiatives, the more likely benefits will be realized for everyone in the
community (Kahn, Lynn, Braga, Hoxworth, & Donovan, 2008). In line with this perspective, The
Canadian Standards for Youth Substance Abuse Prevention advocates that youth partners be
involved in prevention initiatives (Canadian Centre on Substance Abuse, 2010).
These suggestions are speculative, and further evidence is required to determine the effectiveness
of these approaches in preventing or reducing substance use and associated risky behaviours
among rural students. Importantly, while rural students appeared to be at a greater risk of reporting
substance use and risk behaviours as compared to urban students, urban students continue to use
substances and there remains a need to improve prevention efforts among all youth.
Limitations and Strengths
Several methodological limitations associated with this research should be noted. The surveys
collected their data at various time points from 2007 to 2013, and so might not all be capturing
recent urban-rural trends in student substance use. As well, variations in some of the outcome
indicators could make comparisons across the surveys more difficult. Specifically, there were
differences in the timeframe of assessments used for some of the outcomes (e.g., past 30-day use
Urban and Rural Student Substance Use
Canadian Centre on Substance Abuse • Centre canadien de lutte contre les toxicomanies 20
of a substance vs. past 12-month). These variations have been noted where relevant and are
summarized in Appendix B.
There were also differences across surveys in which variables were controlled for when conducting the
multivariate logistic regression. British Columbia and Manitoba included age and sex in their models,
but did not include socioeconomic status. In contrast, Quebec included age, sex and socioeconomic
status as well as two additional variables: the weekly amount of money students reported having and
self-reported school performance. Differences in sampling and methodology across the surveys
preclude interprovincial comparisons. Some provinces and territories do not have student surveys that
address drug use (Nunavut, Northwest Territories, Yukon and Saskatchewan) and some provinces that
have student surveys did not contribute data for the current report (Ontario, Prince Edward Island).
Despite these limitations, there are a number of strengths to this work. For example, the surveys
used were population based and the methodologies employed were robust. The use of multiple
surveys allowed for an assessment of the level of consistency of findings across multiple sources of
data. Rurality was defined by the school’s location and while this definition could have allowed
students who reside in urban or rural settings to be classified as the opposite if they attended a
school in a different setting, it is also likely that this classification is the most useful method given
that most student drug prevention and education programs are implemented at the school level. As
well, the current report did not further delineate geographical settings that are encompassed within
urban-rural regions. For instance, examining other subcategories within the urban-rural classification
such as suburban or remote communities separately would be informative.
Future Research
An important extension of the current research would be to develop a better understanding of the
underlying risk and protective factors, and pathways related to substance use among urban versus
rural students. One potential factor that could influence differences in urban versus rural student
substance use is boredom. It has been suggested that youth living in rural areas report a great level
of boredom, which might be tied to greater consumption of alcohol (Kelly, Comello, & Edwards,
2004; Pettigrew, Miller-Day, Krieger, & Hecht, 2012). It would also be important to further explore
the urban-rural differences in driving after alcohol and cannabis use to determine if the increased
likelihood observed among rural youth is an artifact of greater time spent driving, possibly due to
lack of access to public transit, or some other factor that might be contributing to such risk-taking
behaviours. The current report also did not assess gender differences among urban and rural
students and an important extension of the current findings would be to determine whether there
were gender variations in substance use among students attending urban-rural schools. Future
research could also investigate whether variations in perceived approval or disapproval exists for
various substances and risk behaviours among urban and rural youth, as these beliefs might provide
an indication of the underlying behavioural differences.
Conclusion
In sum, national and provincial data indicate that students who attend schools in rural settings are at
increased likelihood of reporting certain outcomes related to substance use, predominantly those
related to alcohol use and associated risk behaviours. Longitudinal data are needed to determine
whether the differences in rural student substance use and risky behaviours observed in this report are
linked to later health disparities in urban versus rural communities. These findings are an essential
first step towards obtaining a cross-Canada picture of urban-rural student differences and point to key
areas for which drug prevention strategies could be tailored for rural youth.

Urban and Rural Student Substance Use
Canadian Centre on Substance Abuse • Centre canadien de lutte contre les toxicomanies 21
References Alberta Alcohol and Drug Abuse Commission. (2005). Preventing heavy episodic drinking among
youth and young adults: A literature review. Edmonton, Alta: Author.
Aronson, K. R., Feinberg, M. E., & Kozlowski, L. (2009). Alcohol, tobacco, and other drug use among
youth in rural Pennsylvania. Harrisburg, PA: Center for Rural Pennsylvania.
Barrie, L. R., Jones, S. C., & Wiese, E. (2011). “At least I’m not drink-driving”: Formative research for
a social marketing campaign to reduce drug-driving among young drivers. Australasian
Marketing Journal, 19(1), 71-75.
Boak, A., Hamilton, H.A., Adlaf, E.M., & Mann, R.E. (2013). Drug use among Ontario students, 1977–
2013: Detailed OSDUHS findings (CAMH Research Document Series No. 36). Toronto, Ont.:
Centre for Addiction and Mental Health.
Canadian Centre on Substance Abuse (2013). Canada’s low-risk alcohol drinking guidelines
[brochure]. Ottawa, Ont: Author.
Canadian Centre on Substance Abuse. (2010). Stronger together: Canadian standards for
community-based youth substance abuse prevention. Ottawa, Ont.: Author.
Canadian Institute for Health Information. (2013). Hospital mental health services for concurrent
mental illness and substance use disorders in Canada. Toronto, Ont.: Author.
Centre for Addiction and Mental Health. (2012). Rural vs. non-rural differences in drug-related risk
behaviours among high school students. CAMH Population Studies eBulletin, 13(1).
Coomber, K., Toumbourou, J. W., Miller, P., Staiger, P. K., Hemphill, S. A., & Catalano, R. F. (2011).
Rural adolescent alcohol, tobacco, and illicit drug use: A comparison of students in Victoria,
Australia, and Washington State, United States. Journal of Rural Health, 27(4), 409–415.
Conger, R. D. (1997). The special nature of rural America. NIDA Research Monograph, 168, 37–52.
Cronk, C. E., & Sarvela, P. D. (1997). Alcohol, tobacco, and other drug use among rural/small town
and urban youth: A secondary analysis of the Monitoring the Future data set. American Journal of
Public Health, 87(5), 760–764.
Dew, B., Elifson, K., & Dozier, M. (2007). Social and environmental factors and their influence on
drug use vulnerability and resiliency in rural populations. Journal of Rural Health, 23(s1), 16–21.
DeVoe, J. E., Krois, L., & Stenger, R. (2009). Do children in rural areas still have different access to
health care? Results from a statewide survey of Oregon's food stamp population. Journal of Rural
Health, 25(1), 1–7.
Fergusson, D. M., & Lynskey, M. T. (1996). Alcohol misuse and adolescent sexual behaviors and risk
taking. Pediatrics, 98(1), 91-96.
Fortney, J., Mukherjee, S., Curran, G., Fortney, S., Han, X., & Booth, B. M. (2004). Factors associated
with perceived stigma for alcohol use and treatment among at-risk drinkers. Journal of
Behavioral Health Services & Research, 31(4), 418–429.
Gfroerer, J. C., Larson, S. L., & Colliver, J. D. (2007). Drug use patterns and trends in rural
communities. Journal of Rural Health, 23(s1), 10–15.
Gregoire, A. (2002). The mental health of farmers. Occupational Medicine, 52(8), 471–476.

Urban and Rural Student Substance Use
Canadian Centre on Substance Abuse • Centre canadien de lutte contre les toxicomanies 22
Hanson, C. L., Novilla, M. L. L., Barnes, M. D., Eggett, D., McKell, C., Reichman, P., & Havens, M.
(2009). Using the rural-urban continuum to explore adolescent alcohol, tobacco, and other drug
use in Montana. Journal of Child & Adolescent Substance Abuse, 18(1), 93–105.
Iles, R. A., Davidson, M., Taylor, N. F., & O’Halloran, P. (2009). Systematic review of the ability of
recovery expectations to predict outcomes in non-chronic non-specific low back pain. Journal of
Occupational Rehabilitation, 19(1), 25–40.
Jiang, X., Li, D., Boyce, W., & Pickett, W. (2008). Alcohol consumption and injury among Canadian
adolescents: variations by urban-rural geographic status. Journal of Rural Health, 24(2), 143–
147.
Jonah, B. (2013). CCMTA public opinion survey of drugs and driving in Canada: Summary Report.
Ottawa, Ont.: Canadian Council of Motor Transport Administrators.
Johnston, L. D., O’Malley, P. M., Miech, R. A., Bachman, J. G., & Schulenberg, J. E. (2014). Monitoring
the Future national results on drug use: 1975–2013: Overview, key findings on adolescent drug
use. Ann Arbor, MI: Institute for Social Research, University of Michigan.
Johnston, L. D., O’Malley, P. M., Miech, R. A., Bachman, J. G., & Schulenberg, J. E. (2015). Monitoring
the Future national survey results on drug use: 1975–2014: Overview, key findings on
adolescent drug use. Ann Arbor, MI: Institute for Social Research, University of Michigan.
Kahn, R., Lynn, J., Braga, A., Hoxworth, T., & Donovan, K. (2008). Engage youth! Colorado’s guide to
building effective adult-youth partnerships. Denver, CO: Colorado Youth Partnership for Health,
Colorado Department of Public Health and Environment.
Kelly, K. J., Comello, M. L. G., & Edwards, R. W. (2004). Attitudes of rural middle-school youth toward
alcohol, tobacco, drugs, and violence. Rural Educator, 25(3), 19–24.
Lambert, D., Gale, J. A., & Hartley, D. (2008). Substance abuse by youth and young adults in rural
America. Journal of Rural Health, 24(3), 221–228.
Leadbeater, B. J., Foran, K., & Grove‐White, A. (2008). How much can you drink before driving? The
influence of riding with impaired adults and peers on the driving behaviors of urban and rural
youth. Addiction, 103(4), 629–637.
Lisdahl, K. M., Thayer, R., Squeglia, L. M., McQueeny, T. M., & Tapert, S. F. (2013). Recent binge
drinking predicts smaller cerebellar volumes in adolescents. Psychiatry Research: Neuroimaging,
211(1), 17–23.
National Center on Addiction and Substance Abuse. (2000). No place to hide: Substance abuse in
mid-size cities and rural America. New York, NY: National Center on Addiction and Substance
Abuse, Columbia University.
Patterson, I., & Pegg, S. (1999). Nothing to do. The relationship between “leisure boredom” and
alcohol and drug addiction: Is there a link to youth suicide in rural Australia? Youth Studies
Australia, 18(2), 24–29.
Paulozzi, L. J., & Xi, Y. (2008). Recent changes in drug poisoning mortality in the United States by
urban-rural status and by drug type. Pharmacoepidemiology and Drug Safety, 17(10), 997–
1005.
Pettigrew, J., Miller-Day, M., Krieger, J., & Hecht, M. L. (2011). Alcohol and other drug resistance
strategies employed by rural adolescents. Journal of Applied Communication Research, 39(2),
103–122.

Urban and Rural Student Substance Use
Canadian Centre on Substance Abuse • Centre canadien de lutte contre les toxicomanies 23
Pickett, W., Davison, C., Torunian, M., McFaull, S., Walsh, P., & Thompson, W. (2012). Drinking,
substance use and the operation of motor vehicles by young adolescents in Canada. PloS One,
7(8), e42807.
Porath-Waller, A.J., Brown, J.E., Frigon, A.P., & Clark, H. (2013). What Canadian youth think about
cannabis. Ottawa, Ont.: Canadian Centre on Substance Abuse.
Poulin, C., Boudreau, B., & Asbridge, M. (2007). Adolescent passengers of drunk drivers: A multi‐level exploration into the inequities of risk and safety. Addiction, 102(1), 51–61.
Pruitt, L. R. (2009). The forgotten fifth: Rural youth and substance abuse. Stanford Law & Policy
Review, 20, 259–404.
Pulver, A., Davison, C., & Pickett, W. (2014). Recreational use of prescription medications among
Canadian young people: Identifying disparities. Canadian Journal of Public Health, 105(2),
e121–e126.
Rhew, I. C., Hawkins, J. D., & Oesterle, S. (2011). Drug use and risk among youth in different rural
contexts. Health & Place, 17(3), 775–783.
Robertson, R., Vanlaar, W., Simpson, H., & Boase, P. (2009). Results from a national survey of Crown
prosecutors and defense counsel on impaired driving in Canada: A “System Improvements”
perspective. Journal of Safety Research, 40(1), 25–31.
Sanne, B., Mykletun, A., Moen, B. E., Dahl, A. A., & Tell, G. S. (2004). Farmers are at risk for anxiety
and depression: the Hordaland Health Study. Occupational Medicine, 54(2), 92–100.
Statistics Canada. (2013). CMA and CA: Detailed definition. Retrieved from
www.statcan.gc.ca/pub/92-195-x/2011001/geo/cma-rmr/def-eng.htm.
Statistics Canada. (2015). Canadian Tobacco, Alcohol and Drugs Survey: Summary of results for
2013. Ottawa, Ont.: Author.
Swahn, M. H., Simon, T. R., Hammig, B. J., & Guerrero, J. L. (2004). Alcohol-consumption behaviors
and risk for physical fighting and injuries among adolescent drinkers. Addictive Behaviors, 29(5),
959–963.
Traffic Injury Research Foundation of Canada. (2011). The alcohol-crash problem in Canada: 2009.
Ottawa: Traffic Injury Research Foundation, CCMTA Road Safety Report Series.
Traffic Injury Research Foundation of Canada. (2013). The alcohol-crash problem in Canada: 2010.
Ottawa, Ont.: Canadian Council of Motor Transport Administrators and Transport Canada.
United Nations Office on Drugs and Crime (2013). The international drug control conventions. New
York, NY: Author.
van Os, J., Kenis, G., & Rutten, B. P. (2010). The environment and schizophrenia. Nature, 468, 203–
212.

Urban and Rural Student Substance Use
Canadian Centre on Substance Abuse • Centre canadien de lutte contre les toxicomanies 24
Appendix A: Operational Definition of Rural The group decided upon the rural and small town definition. The approach decided upon uses the
Statistical Area Classification system, which was introduced by Statistics Canada in 2001 and covers
all of Canada. The system groups Census Subdivisions (CSDs) according to whether they are in a
Census Metropolitan Area (CMA), a Census Agglomeration (CA)3 or a census Metropolitan Influenced
Zone (MIZ).
Each postal code can be linked to a CSD and these are coded as follows:
1. CSD in a CMA
2. CSD in a CA with at least one census tract4
3. CSD in a CA having no census tracts
4. CSD outside of a CMA or CA, and having strong metropolitan influence
5. CSD outside of a CMA or CA, and having moderate metropolitan influence
6. CSD outside of a CMA or CA, and having weak metropolitan influence
7. CSD outside of a CMA or CA, and having no metropolitan influence
8. CSD within the territories and outside of a CA
Schools in CSDs coded from 1 to 3 are classified as urban; schools in CSDs coded from 4 to 8 are
classified as rural or small town.
3 Statistics Canada provides the following definitions: “A census metropolitan area (CMA) or a census agglomeration (CA) is formed by one
or more adjacent municipalities centred on a population centre (known as the core). A CMA must have a total population of at least
100,000 of which 50,000 or more must live in the core. A CA must have a core population of at least 10,000. To be included in the CMA or
CA, other adjacent municipalities must have a high degree of integration with the core, as measured by commuting flows derived from
previous census place of work data” (Statistics Canada, 2013). The definitions are complicated and more information can be found at
www.statcan.gc.ca/pub/92-195-x/2011001/geo/cma-rmr/def-eng.htm.
4 According to a Statistics Canada analyst: “Census tracts are a lower level of geography. They are one step up from Dissemination Areas,
which are the lowest level of geography we release data for. They only exist in larger centres (population of 50,000 and up). Average
census tract population is somewhere around 5,000. We work with local planners to create the boundaries for these so they better reflect
local needs. In the City of Toronto they can be aggregated to neighbourhood boundaries, although that isn’t a common linkage in other
areas.”

Urban and Rural Student Substance Use
Canadian Centre on Substance Abuse • Centre canadien de lutte contre les toxicomanies 25
Appendix B: Question Wording and Comparisons in Predictors Used in
the Logistic Regression Analysis Table 2: Question wording and comparisons in predictors used in logistic regression analysis
National
HBSC
National
YSS
QC BC AB
YSS
MB NL NB
Sex Compared
female to male
Compared
female to male
Compared
female to male
Compared
female to male
Compared
female to male
Compared
female to male
Compared
female to male
Compared
female to male
Age or
Grade
Compared
youngest age
category ≤14 to
older students
Compared grade
7 to, 8, 9, 10, 11
and 12
Compared 1st
level of
secondary to 2nd,
3rd, 4th and 5th
Included age as
a continuous
variable 12–19
Compared grade
7 to, 8, 9, 10, 11
and 12
Compared grade
7 to grades 8–
12.
Compared grade
7 to grade 9, 10
and 12
Compared grade
7 to grade 9, 10
and 12
Socio-
economic
Status
Compared
highest
socioeconomic
status to
medium and low
Compared top
20% to bottom
20%
Compared to
high to low
Not included in
the model
Compared top
20% to bottom
20%
Not included in
the model
Position on the
“Canadian
society ladder”
Compared high
to middle and
low
Position on the
“Canadian
society ladder”
Compared high
to middle and
low

Urban and Rural Student Substance Use
Canadian Centre on Substance Abuse • Centre canadien de lutte contre les toxicomanies 26
Appendix C: Common Outcomes across the Surveys: Methods of
Assessment Table 3. Question wording and comparisons in outcomes used in prevalence estimates and logistic regression analysis
National
HBSC
National
YSS
QC BC AB
YSS
MB NL NB
Alcohol
Use
“On how many
occasions in the
last 12 months
have you drank
alcohol?”
Compared 3 or
more times vs.
less than 3 times
Past 12-months
alcohol use
Alcohol use in
the past 12
months
“During the past
30 days, on how
many days did
you have at least
one drink of
alcohol?”
Compared 0
days to one or
more days
Past 12-months
alcohol use
12-months
alcohol use
Compared no to
yes
“In the past 12
months, how
often did you
drink alcohol-
beer, wine,
coolers, or hard
liquor (rum,
whisky, vodka,
gin, etc.)?”
Compared past-
year alcohol use
“once a month
or less” and
higher to “just a
sip” or “never”
“In the past 12
months, how
often did you
drink alcohol-
beer, wine,
coolers, or hard
liquor (rum,
whisky, vodka,
gin, etc.)?”
Compared past-
year alcohol use
“once a month
or less” and
higher to “just a
sip” or “never”
Consump-
tion of 5+
Drinks on
One
Occasion
“In the past 12
months, how
often have you
had 5 or more
drinks (4 or more
for females) on
one occasion?”
Compared At
least once a
month vs. less
than once a
month
Past 12-month
excessive or
binge drinking as
defined by 5 or
more drinks on
one occasion
Past 12-month
excessive binge
drinking as
defined by 5 or
more drinks on
at least one
occasion
“During the past
30 days, on how
many days did
you have 5 or
more drinks of
alcohol within a
couple of
hours?”
Compared 0
days to 1 or
more days
Past 12-month
excessive or
binge drinking as
defined by 5 or
more drinks on
one occasion
Past 12-month
excessive or
binge drinking as
defined by 5 or
more drinks on
one occasion.
Compared never
to less than once
a month and
greater
“In the past 30
days, how many
times have you
had five or more
drinks of alcohol
on the same
occasion?”
Compared
consumption of
5+ drinks of
alcohol on single
occasion at least
once in the past
30 days to no or
did not drink
alcohol in the
past 30 days
“In the past 30
days, how many
times have you
had five or more
drinks of alcohol
on the same
occasion?”
Compared
consumption of
5+ drinks of
alcohol on single
occasion at least
once in the past
30 days to no or
did not drink
alcohol in the
past 30 days

Urban and Rural Student Substance Use
Canadian Centre on Substance Abuse • Centre canadien de lutte contre les toxicomanies 27
National
HBSC
National
YSS
QC BC AB
YSS
MB NL NB
Driving
after
Alcohol
Use
Not available Not available Not available “Have you driven
a car or other
vehicle when you
had been
drinking
alcohol?”
Compared no to
yes
Not available Among students
who drive: if they
have ever driven
within an hour of
drinking.
Compared never
to 1–2 times or
more
“In the past 12
months, how
often have you
driven a motor
vehicle within an
hour of drinking
two or more
drinks of
alcohol?”
Excluding
students who did
not drive or drink
alcohol
compared at
least once in the
past year to
never.
“In the past 12
months, how
often have you
driven a motor
vehicle within an
hour of drinking
two or more
drinks of
alcohol?”
Excluding
students who did
not drive or drink
alcohol
compared at
least once in the
past year to
never.
Cannabis
Use
“Have you ever
used or taken
cannabis in the
last 12
months?”
Compared 3 or
more times vs.
less than 3 times
Past 12-months
cannabis use
Past 12 months
cannabis use
“During the past
30 days, on how
many days did
you use
marijuana?”
Compared 0
days to 1 or
more days.
Past 12-months
cannabis use
Past 12-month
cannabis use.
Compared no to
yes
“In the past 12
months, how
often did you use
cannabis
(marijuana,
grass, weed, pot,
hash, hash oil)?”
Compared once
or more to never
used or does not
know what
cannabis is
“In the past 12
months, how
often did you use
cannabis
(marijuana,
grass, weed, pot,
hash, hash oil)?”
Compared once
or more to never
used, or did not
use cannabis in
the past 12
months, or does
not know what
cannabis is
Daily or
Almost
Daily
Cannabis
Use
“Have you ever
used or taken
cannabis in the
last 30 days?”
Compared 6 or
more times vs.
less than 6 times
Past 12-months
daily or almost
daily use
Past 12-months
daily, almost
daily or at least
once or twice a
week use among
high school
students
“During the past
30 days, used
marijuana on 6
or more days?”
Compared no to
yes
Past 12-months
daily or almost
daily use
How often
students had
“smoked pot” in
the past 30
days.
Compared less
than 3 times a
week to almost
“In the past 30
days, how often
did you use
cannabis
(marijuana,
grass, weed, pot,
hash, hash oil)?”
Compared every
“In the past 30
days, how often
did you use
cannabis
(marijuana,
grass, weed, pot,
hash, hash oil)?”
Compared every

Urban and Rural Student Substance Use
Canadian Centre on Substance Abuse • Centre canadien de lutte contre les toxicomanies 28
National
HBSC
National
YSS
QC BC AB
YSS
MB NL NB
every day and
above
day or almost
every day to no
or once a week
or less
day or almost
every day to no
or once a week
or less
Driving
after
Cannabis
Use
Not available Not available Not available “Have you driven
a car or other
vehicle when you
had been using
marijuana?”
Compared no to
yes
Not available Among students
who drive if they
had driven after
using pot
Compared never
to once or more
“In the past 12
months, how
many times have
you driven a
motor vehicle
within an hour of
using cannabis?”
Excluding
students who did
not drive or use
cannabis
compared at
least once in the
past year to
never
“In the past 12
months, how
many times have
you driven a
motor vehicle
within an hour of
using cannabis?”
Excluding
students who did
not drive or use
cannabis
compared at
least once in the
past year to
never
Illicit Drug
Use
Comparison
conducted on
Illicit drugs was
ever vs never
use.
Illicit drugs
included ecstasy,
MDMA,
amphetamines,
opiates, cocaine,
glue or solvents,
LSD and other
hallucinogens,
methampheta-
mines, salvia
Past 12-months
illicit drug use
Illicit drugs
included
amphetamines
(speed, ice,
meth); MDMA
(ecstasy, E, X);
hallucinogens
(LSD or acid,
PCP, magic
mushrooms,
mesc); salvia
(Divine Sage,
Magic Mint, Sally
D); heroin
(smack, H, junk,
crank); cocaine
(coke, crack,
blow, snow)
Past 12 months
use of other
drugs, excluding
cannabis or non-
prescription
medications
Comparison
conducted on
Illicit drugs was
ever vs never
use.
Illicit drugs
included:
cocaine,
hallucinogens,
ecstasy, MDMA,
mushrooms,
inhalants,
amphetamines,
crystal meth,
heroin,
ketamine, and
steroids
Past 12-months
illicit drug use
Illicit drugs
included
amphetamines
(speed, ice,
meth); MDMA
(ecstasy, E, X);
hallucinogens
(LSD or acid,
PCP, magic
mushrooms,
mesc); salvia
(Divine Sage,
Magic Mint, Sally
D); heroin
(smack, H, junk,
crank); cocaine
(coke, crack,
blow, snow)
Past 12-months
illicit drug use
Illicit drugs
included
mushrooms,
cocaine, crack,
ecstasy,
hallucinogens,
over the counter
drugs to get
high,
hallucinogens,
methampheta-
mines, inhalants,
aerosol, heroin,
opioids, and
salvia
Past 12-months
illicit drug use
Illicit drugs
included cocaine
or crack cocaine,
LSD, psilocybin
or mescaline,
methampheta-
mine (crystal
meth, speed,
crank, chalk,
ice), MDMA
(ecstasy),
mephedrone
(drone, bubbles,
m-cat), inhalants
(solvents and
glue) and salvia
divinorum
Compared yes to
no
Past 12-months
illicit drug use.
Illicit drugs
included cocaine
or crack cocaine,
LSD, psilocybin
or mescaline,
methampheta-
mine (crystal
meth, speed,
crank, chalk,
ice), MDMA
(ecstasy),
mephedrone
(drone, bubbles,
m-cat).
Compared yes to
no

Urban and Rural Student Substance Use
Canadian Centre on Substance Abuse • Centre canadien de lutte contre les toxicomanies 29
National
HBSC
National
YSS
QC BC AB
YSS
MB NL NB
Prescrip-
tion Drug
Abuse
Medication to
get high, taken in
the last 12
months; pain
relievers,
stimulants,
sedatives-
tranquilizers
Compared never
use vs ever
Past 12-months
psychoactive
pharmaceutical
used to get high
Psychoactive
pharmaceutical
drugs used to
get high include
tranquillizers or
sedatives
(tranqs,
downers);
stimulants
(uppers,
bennies) or
ADHD treatment;
pain relievers
(such as
Percocet,
Percodan,
Demerol,
OxyContin or any
pain reliever with
codeine)
Not available “During your life,
have you used
prescription pills
without a
doctor's
consent?”
Comparison
conducted on
ever vs. never
use
Past 12-months
psychoactive
pharmaceutical
used to get high
Psychoactive
pharmaceutical
drugs used to
get high include
tranquillizers or
sedatives
(tranqs,
downers);
stimulants
(uppers,
bennies) or
ADHD treatment;
pain relievers
(such as
Percocet,
Percodan,
Demerol,
OxyContin or any
pain reliever with
codeine)
Past 12-months
prescription drug
use
Prescription
drugs included
using their own
prescription to
get high or
someone else’s,
and use of
Ritalin to get
high
Past 12-months
use of drug
without a
prescription or a
doctor’s
supervision
Prescription
drugs included
stimulants (diet
pills, stay awake
pills), pain relief
pills/opiates
(Percocet,
Percodan,
Tylenol #3,
Demerol,
Oxycontin,
codeine) and
tranquilizers-
sedatives
Compared yes to
no
Past 12-months
use of drug
without a
prescription or a
doctor’s
supervision.
Prescription
drugs included
stimulants (diet
pills, stay awake
pills), pain relief
pills/opiates
(Percocet,
Percodan,
Tylenol #3,
Demerol,
Oxycontin,
codeine) and
tranquilizers-
sedatives
Compared yes to
no

Urban and Rural Student Substance Use
Canadian Centre on Substance Abuse • Centre canadien de lutte contre les toxicomanies 30
Appendix D: Survey Design Variables of Contributing Surveys Table 4. Additional Information on methods used across surveys
National National QC BC AB
YSS
MB NL NB
Name of
Survey
Health
Behaviour in
School-aged
Children (HBSC)
Youth Smoking
Survey
Quebec Survey
of Smoking,
Alcohol, Drugs,
and Gambling
in High School
Students
Adolescent
Health Survey
Youth Smoking
Survey
Alcohol and
other Drugs:
Students in
Manitoba
Student Drug
Use Survey in
the Atlantic
Provinces
Student Drug
Use Survey in
the Atlantic
Provinces
Date of Data
Collection
2010 2012–2013 Nov. to Dec.
2013
2013 2012–2013 2007 May and June,
2012
May and June,
2012
Sample Size 26,078 from
436 Schools
47,203 4,943 students
in 153 Schools
29,832 5,743 4,992 students
in 55 schools
2,530 students
in 72 schools
3,465 students
in 110 schools
Clusters Two-stage
(school and
class) cluster
sampling
Two-stage
(school and
class) cluster
sampling
Two-stage
(school and
class) cluster
sampling
Classes Two-stage
(school and
class) cluster
sampling
Classes Two-stage
(school and
class) cluster
sampling
Two-stage
(school and
class) cluster
sampling
Link to
Report
http://www.pha
c-aspc.gc.ca/hp-
ps/dca-
dea/publication
s/hbsc-mental-
mentale/assets
/pdf/hbsc-
mental-mentale-
eng.pdf
http://www.hc-
sc.gc.ca/hc-
ps/tobac-
tabac/research-
recherche/stat/
_survey-
sondage_2012-
2013/table-
eng.php
http://www.stat
.gouv.qc.ca/sta
tistiques/sante
/enfants-
ados/alcool-
tabac-drogue-
jeu/tabac-
alcool-drogue-
jeu-2013.pdf
http://www.mc
s.bc.ca/pdf/Fro
m_Hastings_Str
eet_To_Haida_
Gwaii.pdf
https://uwaterlo
o.ca/canadian-
student-tobacco-
alcohol-drugs-
survey/sites/ca.
canadian-
student-tobacco-
alcohol-drugs-
survey/files/upl
oads/files/yss1
2_ab_provincial
_profile_final_en
_20150304.pdf
http://afm.mb.
ca/wp-
content/upload
s/woocommerc
e_uploads/201
3/10/2007-
Manitoba-
School-Student-
Survey-
Nov08.pdf
Newfoundland
Report:
http://www.hea
lth.gov.nl.ca/he
alth/publication
s/Drug_Survey.
New Brunswick
Report:
http://www.gnb.
ca/0378/pdf/2
013/9230e.pdf

Urban and Rural Student Substance Use
Canadian Centre on Substance Abuse • Centre canadien de lutte contre les toxicomanies 31
Appendix E: Odds Ratios with 95% Confidence Intervals for Bivariate
and Multivariate Models Table 5. Bivariate (Grey) and multivariate (black) odds ratios with 95% confidence intervals for the common model when assessing urban-rural differences in substance use
HBSC YSS QC BC AB (YSS) MB NL NB
Alcohol
Use5
1.43 (1.13-
1.82)*
1.44 (1.13-
1.84)*
2.44 (1.92-
3.09)*
2.95 (1.80-
4.10)*
1.33 (0.90-
1.96)
1.71 (1.28-
2.29)*
2.01 (1.83-
2.22)*
3.35 (2.18-
5.14)*
2.71 (1.69-
3.73)*
1.39 (1.16-
1.65)*
1.45 (1.20-
1.74)*
1.1 (0.7-1.7)
1.6 (1.1-2.2)*
1.21 (0.80,
1.82)
1.02 (0.81-
1.30)
Consump-
tion of 5+
Drinks on a
Single
Occasion
1.67 (1.24-
2.25)*
1.68 (1.25-
2.27)*
2.30 (1.85-
2.86)*
2.60 (1.69-
3.50)*
1.09 (0.74-
1.60)
1.23 (0.85-
1.76)
1.88 (1.67-
2.12)*
3.30 (2.18-
5.01)*
2.49 (1.80-
3.18)*
1.68 (1.44-
1.95)*
1.73 (1.48-
2.03)*
0.9 (0.6-1.5)
1.2 (0.9-1.7)
1.17 (0.74,
1.85)
1.08 (0.72-
1.62)
Drinking
and Driving
Data not
available
Data not
available
Data not
available
2.12 (1.77-
2.68)*
Data not
available
1.93 (1.53-
2.43)*
1.93 (1.53-
2.43)*
1.9 (1.0-3.4)*
2.0 (1.1-3.5)*
1.29 (0.80-
1.92)
1.29 (0.86-
1.96)
Cannabis
Use5
1.08 (0.79-
1.48)
1.08 (0.79-
1.49)
1.58 (1.24-
2.00)*
1.58 (1.20-
1.96)*
0.92 (0.64-
1.32)
1.00 (0.72-
1.40)
1.71 (1.52-
1.92)*
1.69 (1.12-
2.54)*
1.48 (1.06-
1.89)*
1.09 (0.95-
1.26)
1.09 (0.95-
1.27)
0.7 (0.5-1.1)
0.8 (0.6-1.1)
0.88 (0.66-
1.81)
0.77 (0.56-
1.04)
Daily or
almost Daily
Cannabis
Use
1.18 (0.80-
1.75)
1.19 (0.80-
1.76)
1.50 (1.10-
2.04)*
1.28 (0.88-
1.68)
0.79 (0.49-
1.28)
0.86 (0.55-
1.34)
1.76 (1.51-
2.06)*
1.86 (0.99-
3.51)
1.56 (0.80-
2.31)
1.74 (1.30-
2.34)*
1.77 (1.31-
2.38)*
0.6 (0.3-1.1)
0.7 (0.3-1.3)
0.73 (0.42-
1.27)
0.59 (0.35-
1.02)
Driving after
Cannabis
Use
Data not
available
Data not
available
Data not
available
1.75 (1.46-
2.11)*
Data not
available
1.89 (1.44-
2.48)*
1.93 (1.47-
2.54)*
0.9 (0.5-1.6)
1.0 (0.7-1.6)
1.39 (0.97-
1.98)
1.42 (1.05-
1.92)*
5 All surveys assessed past-year use, with the exception of British Columbia, which assessed past-month use.

Urban and Rural Student Substance Use
Canadian Centre on Substance Abuse • Centre canadien de lutte contre les toxicomanies 32
HBSC YSS QC BC AB (YSS) MB NL NB
Illicit Drug
Use6
0.83 (0.58-
1.20)
0.83 (0.58-
1.20)
1.84 (1.35-
2.50)*
1.84 (1.18-
2.49)*
0.73 (0.46-
1.16)
0.81 (0.54-
1.21)
1.53 (1.35-
1.74)*
1.80 (1.07-
3.02)*
1.84 (1.17-
2.50)*
1.03 (0.82-
1.31)
1.03 (0.81-
1.31)
1.0 (0.6-1.5)
1.1 (0.7-1.6)
0.88 (0.61-
1.28)
0.77 (0.55-
1.08)
Prescription
Drug Abuse6
1.02 (0.72-
1.45)
1.02 (0.72-
1.47)
1.41 (1.05-
1.89)*
1.42 (1.06-
1.78)*
Data not
available
0.98 (0.87-
1.10)
1.56 (0.98-
2.48)
1.45 (0.65-
2.24)
1.04 (0.81-
1.33)
1.05 (0.82-
1.34)
1.1 (0.8-1.5)
1.1 (0.8-1.6)
1.30 (0.98-
1.72)
1.19 (0.88-
1.62)
Bivariate values are represented in grey and multivariate values in black. Multivariate results represent values when taking into account age (or grade level), sex and
socioeconomic status. Quebec also accounted for the weekly amount of money students reported having, as well as participants’ self-reported school performance.
*Indicates a significant odds ratio for urban-rural environment and the outcome (referent group=urban).
6 British Columbia assessed lifetime use.