Embed Size (px)
Citation preview

Urban Accessibility and Affordability: A Case Study for
Istanbul
Prof. Dr. Haluk GERÇEK 1 and Research Ass. Sabahat TOPUZ KİREMİTÇİ 2
Abstract
With 14 million population in 2013, Istanbul is not only the centre of economic and
social activities in Turkey, but also is one of the largest and highly urbanized cities in
the world. As a result, Istanbul is now overwhelmed by a flood of people and vehicles,
an inadequate road network and a public transport system that has been slow and
expensive to develop. Thus, recently sustainable transportation policies have gained
considerable importance to plan the future transport infrastructure in this megacity.
This study focuses on economic and social goals of sustainable transportation by
searching relations between urban accessibility and affordability. Accessibility refers
to the ease of reaching goods, services, activities and destinations, which together are
called opportunities. Transportation affordability means that user financial costs of
transport are not excessive, particularly for basic access.
A joint logit model using a utility based accessibility measure is proposed to analyse
mode and destination choices of individuals for home-to-work trips. The aim of this
study is to investigate the combined role of affordability and accessibility to make an
emphasis on transport related equity by means of income distribution and to present
an accessibility measure for comparing different transportation infrastructure schemes
in Istanbul. Transportation budgets and monthly household incomes of public
transportation and private car users are taken into consideration in the utility function.
Home-to-work trips data were gathered from the Household Travels Surveys
conducted by the Istanbul Metropolitan Municipality in 2006.
1. Introduction
Transport and infrastructure development enables economic and social development
but is often detrimental to sustainable development due to congestion, accidents, air
pollution as well as greenhouse gas emissions. (Bakker at al., 2014). Thus, decisions
and policies about transport and transport related infrastructure investments should be
made with great precision, especially in developing countries with tighter budgets.
However, there are no specific or solid indicators to measure how these investments
can contribute to promoting better access to opportunities particularly for the most
vulnerable segments of the population (Bocarejo & Aviedo, 2012).
1. Istanbul Technical University, Istanbul, Turkey, [email protected] 2. Istanbul Technical University, Istanbul, Turkey, [email protected]

This paper aims at presenting a new approach (perspective) to accessibility in
evaluation of transport investments, focusing on sustainability related social elements
such as equity and transportation affordability.
Within this scope, Istanbul is chosen as the case city because of it is a megacity trying
to cope with income inequalities, irrepressible transport related problems and
extensive transport infrastructure investments.
The next section of the paper gives brief information about the study area. Section 3,
describes accessibility and transportation affordability, and explains data and method
used in the analysis. Concluding section discusses the results and further studies that
have to be done.
2. About Istanbul
Istanbul is a unique megacity with over 14 million inhabitants spread both Asian and
European sides of the Bosporus. North of the city is mostly rural and forest areas.
Population densities are higher on the southern of the city (Figure 1). On the other
hand, distribution of working people seems more widespread (Figure 2). Districts with
highest number of working people are close to the districts with highest number of
employment, which are generally industrial areas (Figure 3).
Distribution of household income does not present a distinctive geographical pattern
(Figure 4). It is often possible to spot a high income zone surrounded by low income
zones and vice versa. Car ownership distribution (Figure 5) of the city has shown
similar characteristics with income distribution, i.e., zones with highest car ownership
values are the zones of higher income groups.
Despite its relatively large area and massive population, mostly road-based public
transportation system is not sufficient to meet the demand and this causes one of the
most significant problems of the city. As shown in Figure 6 and Figure 7,
transportation network of the city is road dominated. Railway system is inadequate
and although city is divided by the Bosporus, the share of sea transport is dramatically
low.
Currently two highway bridges crossing the Bosporus Strait carry road traffic between
Asian and European sides of the city. Relatively higher number of job places are
located in the European side (73 % of jobs and 65 % of inhabitants) and this creates a
high travel demand in the east-west direction in the morning and opposite direction in
the evening peak hours. The bottlenecks created by the bridges and unbalanced travel
demand causes long queues and traffic congestion not only in morning and evening
peaks but almost all day long.

Figure 1. Population density in Istanbul
Figure 2. Number of working people in Istanbul
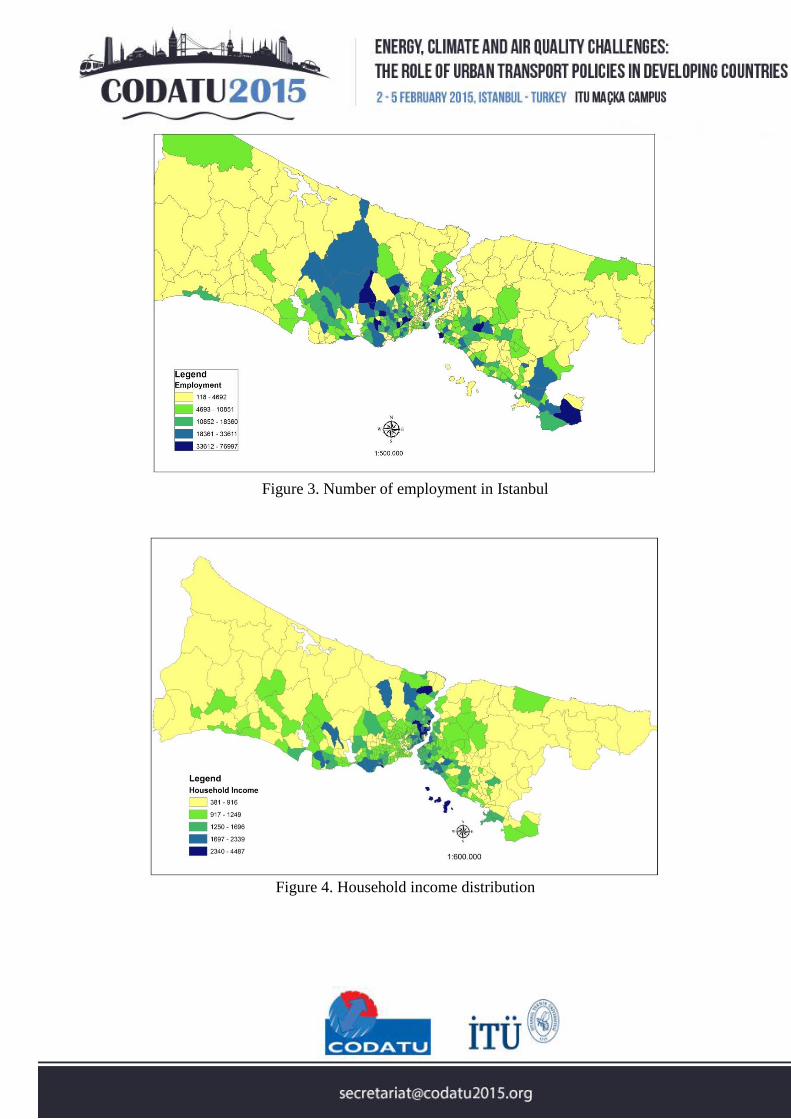
Figure 3. Number of employment in Istanbul
Figure 4. Household income distribution

Figure 5. Car ownership distribution
Figure 6. Road network of Istanbul

Figure 7. Public transportation network of Istanbul
3. Methodology
Transportation affordability means that user financial costs of transport are not
excessive, particularly for basic access. The terms, sustainability and affordability
require improving public transport, cycling and walking. Affordability is also
important for transport related social exclusion and transport equity, especially for low
income groups.
On the other hand, accessibility is a term often used by transportation experts from
both academic and practical backgrounds. It has many definitions in literature such as:
the potential of opportunity for interaction (Hansen, 1959), overall benefits provided
by a given transport system (Ben-Akiva & Lerman, 1985) and, the ease of reaching
goods, services, activities and destinations, which together are called opportunities
(DfT, 2004). (For more detailed information about accessibility concept, see Geurs &
van Wee, 2004). According to Geurs and Van Wee (2004) accessibility measures can
be categorized according to their components which are land-use, transport and
individual elements. A utility based approach is used in this study because of its
capability of representing all these three components.
There are several utility based accessibility measures available in the literature such as
multinomial logit, joint logit (Anas, 1981; Niemeier, 1997; Limanond & Niemeier,
2002) and nested logit models (Daly, 1987). In order to estimate both destination and
mode choices of travellers, joint logit models and nested logit models are applicable.
Nested logit has a sequential tree structure but joint logit model estimates destination

and mode choices together. A joint logit model has been preferred in this study due to
its relatively simpler choice structure.
3.1 Data
Home-based work trips data from household travel surveys that were carried out in
2006 have been provided by Transportation Planning Department of Istanbul
Metropolitan Municipality. The data contains information of approximately 20,000
home-based work trips from 451 traffic analysis zones of Istanbul. In this study,
private car and public transport trips of about 8,000 individuals have been used.
3.2 Joint Logit Model
Suppose that a multidimensional choice set Cn for individual n, whose elements are
defined as mode and destinations. Let us define Udm as the total utility of the element
of Cn consisting of mode m and destination d. It is assumed that some elements Cn
share common observed elements as a consequence of their sharing the same mode or
destination. By extension of the partition of the total utility into systematic and random
components, it can be written as,
𝑈𝑑𝑚 = 𝑉𝑑 + 𝑉𝑚 + 𝑉𝑑𝑚 + 𝜀𝑑𝑚 ,∀(d,m)∈C_n (1)
where,
Vd=the systematic component of utility common to all elements of Cn using destination d,
Vm= the systematic component of utility common to all elements of Cn using mode m,
Vdm= remaining systematic component of utility specific to the combination (d,m),
εdm= the random utility component.
Our model has the following variables for alternative i∈ Cn
xi1 =travel time for mode/destination combination i,
xi2= the out-of-pocket cost for mode mode/destination combination i diveded by monthly
household income,
xi3= the employment ratio at the destination included in alternative i,
xi4= a gender-specific constant defined as 𝑥𝑖4 = {1 𝑖𝑓 𝑚𝑎𝑙𝑒
0 𝑜𝑡ℎ𝑒𝑟𝑤𝑖𝑠𝑒
xi5= car availability defined as 𝑥𝑖5 = {1 𝑖𝑓 ℎ𝑜𝑢𝑠𝑒ℎ𝑜𝑙𝑑 𝑜𝑤𝑛𝑠 1 𝑎𝑢𝑡𝑜
0 𝑜𝑡ℎ𝑒𝑟𝑤𝑖𝑠𝑒
xi6= car availability defined as 𝑥𝑖6 = {1 𝑖𝑓 ℎ𝑜𝑢𝑠𝑒ℎ𝑜𝑙𝑑 𝑜𝑤𝑛𝑠 𝑚𝑜𝑟𝑒 𝑡ℎ𝑎𝑛 1 𝑎𝑢𝑡𝑜
0 𝑜𝑡ℎ𝑒𝑟𝑤𝑖𝑠𝑒
xi7 = mode specific constant

Here, first two variables xi1 and xi2 would be part of Vdm because they vary across both
the mode and destination. Variable xi3 would be part of Vd because its value do not
vary across elements of Cn using d; any mode and destination combinations having the
same destination have the same values of xi3. Finally xi4, xi5 and xi6 vary only across
modes.
Thus,
Vdm=β1 xi1+β2 xi2 (2)
Vd=β3 xi3 (3)
Vm=β4 xi4+β5 xi5+β6 xi6+β7 (4)
The distribution of the εdm’s across the alternatives and across the population defines
the choice probabilities. Multinomial logit model has been used for the joint choice of
destination and modes, assuming these disturbances are independent and identically
Gumbel distributed (with the scale parameter normalized to 1) as follows:
𝑃𝑛(𝑑, 𝑚) =𝑒𝑉𝑚+𝑉𝑑+𝑉𝑑𝑚
∑ 𝑒𝑉𝑚+𝑉𝑑+𝑉𝑑𝑚(𝑚,𝑑)∈𝐶𝑛
(5)
Equation above is called the joint logit model.
Let i denote (d,m) destination/mode choice combination, natural logarithm of equation
(5)’s denominator is used as accessibility measure for individual n.
𝐴𝑛 = 𝑙𝑛 ∑ 𝑒𝑉𝑚+𝑉𝑑+𝑉𝑑𝑚𝑖∈𝐶𝑛
(6)
4.1. Results of the Joint Logit Model
N-logit software has been used to estimate the coefficients of the joint logit model.
Estimated coefficients and t-statistics of the joint logit model are given in Table 1.
According to t-statistics, the variables are significant and the pseudo-R2 (2) value,
which is 0.21, for the model also suggests a moderate model on the basis of averall
goodness-of-fit.
Table.1. Estimation results of Joint Logit Model

Variable Coefficient t-stats
𝛽1 -0.04504802 -37.402*
𝛽2 -5.26844073 -20.415*
𝛽3 4.53209045 16.245*
𝛽4 0.95696531 13.712*
𝛽5 2.40162860 42.050*
𝛽6 2.80048098 29.593*
𝛽7 -3.32058474 -40.286* *Significant at 95% confidence level
4.2 Elasticities
A disaggregate elasticity represents the responsiveness of an individual’s choice
probability to a change in the value of the selected attribute (Ben-Akiwa & Lerman,
1985).
Let 𝐸𝑥𝑖
𝑃𝑛(𝑖) be the elasticity of the probability of an individual choosing alternative i
with respect to a change in some attribute xi which is an independant variable in the
model.
𝐸𝑥𝑖
𝑃𝑛(𝑖) =𝜕𝑃𝑛(𝑖)
𝜕𝑥𝑖.
𝑥𝑖
𝑃𝑛(𝑖)=
𝜕𝑙𝑛𝑃𝑛(𝑖)
𝜕𝑙𝑛𝑥𝑖= [1 − 𝑃𝑛(𝑖)]𝑥𝑖𝛽𝑘 (7)
Likewise, the disaggregate cross elasticity of the probability of an individual choosing
alternative i that is selected with respect to a change in alternative j is,
𝐸𝑥𝑗
𝑃𝑛(𝑖)=
𝜕𝑙𝑛𝑃𝑛(𝑖)
𝜕𝑙𝑛𝑥𝑗= −𝑃𝑛(𝑗)𝑥𝑗𝛽𝑘 (8)
In order to calculate elasticities, individuals have been categorized into 18 groups
according to their gender (male, female), houshold income level (low, middle, high),
and car availability of the household (no car available, one car available, more than
one car available). An origin-destination zone pair is selected and changes in utilities
are calculated for each of 18 categories and for 2 cases: In Case 1, private car users
costs are increased 10 % and 15 %. In Case 2, public transportation travel times are
reduced 10 %.
In Base Case (no change in auto travel cost and in public transport travel time),
categories 5, 6, 8 and 9 choose private car. People in these categories are male, in
middle or high income groups, and own one or more than one auto. In Case 1, private
car users costs are increased 10 % at first and as a result none of the categories changed
their choices. Then private car users costs are increased 15 % and only the people in
Category 5 shifted from private car to public transportation. Elasticities for Case 1
and 2 are shown in Table 2. For Case 2, individuals in Category 5 chose to shift from
private car to public transportation.

As it can be seen from the elasticities of Category 5, 6, 8 and 9, private car users are
inelastic to travel cost increase (Case 1). Effect of travel time changes on mode choice
is higher (even elastic for Category 5) than the effect of the travel cost.
Table 2. Elasticities for Case 1 and for Case 2
Category Gender Income Car
Ownership
Base Case Case 1 Case 2
PA PPT PA PPT E PA PPT E
1 Male Low 0 0,01 0,99 0,01 0,99 -2,87 0,01 0,99 2,23
2 Male Low 1 0,13 0,87 0,08 0,92 -2,67 0,10 0,90 1,97
3 Male Low 1+ 0,18 0,82 0,11 0,89 -2,57 0,15 0,85 1,85
4 Male Middle 0 0,09 0,91 0,08 0,92 -0,81 0,08 0,92 2,05
5 Male Middle 1 0,53 0,47 0,49 0,51 -0,45 0,47 0,53 1,06
6 Male Middle 1+ 0,63 0,37 0,59 0,41 -0,36 0,57 0,43 0,84
7 Male High 0 0,13 0,87 0,12 0,88 -0,40 0,10 0,90 1,97
8 Male High 1 0,61 0,39 0,60 0,40 -0,18 0,56 0,44 0,87
9 Male High 1+ 0,70 0,30 0,69 0,31 -0,14 0,65 0,35 0,67
10 Female Low 0 0,01 0,99 0,00 1,00 -2,88 0,00 1,00 2,24
11 Female Low 1 0,05 0,95 0,03 0,97 -2,80 0,04 0,96 2,14
12 Female Low 1+ 0,08 0,92 0,05 0,95 -2,76 0,06 0,94 2,08
13 Female Middle 0 0,04 0,96 0,03 0,97 -0,85 0,03 0,97 2,17
14 Female Middle 1 0,30 0,70 0,27 0,73 -0,64 0,26 0,74 1,57
15 Female Middle 1+ 0,39 0,61 0,36 0,64 -0,57 0,34 0,66 1,37
16 Female High 0 0,05 0,95 0,05 0,95 -0,43 0,04 0,96 2,14
17 Female High 1 0,38 0,62 0,36 0,64 -0,29 0,33 0,67 1,40
18 Female High 1+ 0,48 0,52 0,46 0,54 -0,25 0,42 0,58 1,18
4. Conclusions
The role of transport policies for sustainable living environment is undeniable. Policies
such as improving public transportation, promoting walking and cycling, managing
travel demand not only reduce the share of private cars, traffic congestion and air
pollution, but also increase accessibility and create more liveable cities.
There are several outcomes of this study which can be summarised as follows:
Effects of gender, income and car availabilities on mode choices are
significant.
A small portion of people, which are male, belong to middle or high income
groups and own one or more private cars choose to travel by car on their home-
based-work trips. It is difficult to change their mode choices by only reducing
public transportation travel time or increasing costs of private car. Improving
public transportation network, creating more convenient and comfortable
systems may be a better option.
Despite the fact that most people prefer public transport system for home-based
work trips, public transport network, particularly rail transit system, is still far
from being sufficient to meet the increasing demand.
As a continuation of this study, accessibility and affordability measures will be
aggregated on zonal basis to make spatial analyses of Istanbul’s districts.
5. References
Anas, A. (1981). "The Estimation of Multinomial Logit Models of Joint Location and
Travel Mode Choice from Aggregated Data" Journal of Regional Science 21(2):223-
242
Bakker, S., et al. (2014). "Transport, Development and Climate Change Mitigation:
Towards an Integrated Approach." Transport Reviews 34(3): 335-355.
Ben-Akiva, M., Lerman, S. (1985) "Discrete Choice Analysis" The MIT Press,
Cambridge, MA
Bocarejo, S. J. P. and H. D. R. Oviedo (2012). "Transport accessibility and social
inequities: a tool for identification of mobility needs and evaluation of transport
investments." Journal of Transport Geography 24: 142-154.
Daly, A. (1987). "Estimating Tree Logit-Models." Transportation Research Part B-
Methodological 21(4): 251-267.
DfT, Transport Analysis Guidance (2010). “Personal Affordability Sub-Objective.”
Available from: www.dft.gov.uk/webtag
Geurs, K. T., & van Wee, B. (2004). "Accessibility evaluation of landuse and transport
strategies: Review and research directions." Journal of Transport Geography, 12, 127–
140.
Hansen, W. G. (1959). "How accessibility shapes land use". Journal of the American
Planning Institute, 25, 73–76.
Limanond, T. and D. A. Niemeier (2003). "Accessibility and mode-destination choice
decisions: exploring travel in three neighborhoods in Puget Sound, WA." Environment
and Planning B-Planning & Design 30(2): 219-238.
Niemeier, D. A. (1997). "Accessibility: an evaluation using consumer welfare."
Transportation 24(4): 377-396.