Embed Size (px)
Citation preview

PII S0016-7037(98)00255-5
Uranium-thorium-protactinium dating systematics
H. CHENG,*,1 R. LAWRENCE EDWARDS,1 M. T. MURRELL,2 and T. M. BENJAMIN2
1Minnesota Isotope Laboratory, Department of Geology and Geophysics, University of Minnesota, Minneapolis, Minnesota 55455, USA2Chemical Science and Technology Division, J514, Los Alamos National Laboratory, Los Alamos, New Mexico 87545, USA
(Received October21, 1997;accepted in revised form July24, 1998)
Abstract—With precise234U, 230Th, and 231Pa data available,230Th and 231Pa ages can now be testedrigorously for concordancy. If the material is not concordant, the isotopic characteristics of this material maybe examined in some detail. Here, models similar to those used to describe the U-Pb system are evaluated foruse in U-Th-Pa studies, for the case in which initial230Th and231Pa concentrations are effectively zero. Thesystematics of concordia plots in relation to models of variation ind234U, episodic U loss or gain, continuousU loss or gain, and continuous234U, 230Th and231Pa gain or loss are considered for the case in which initialU concentration is significant (for example, in many carbonate deposits). We also examine linear U uptakemodels for the case in which initial U concentration is effectively zero (for example, in teeth and bones). Suchmodels should prove useful in interpreting data from materials that have behaved as open-systems. Inparticular, these models may help constrain the nature of diagenetic processes, and in some situations it maybe possible to determine or constrain true ages with materials that have behaved as open-systems.Copyright© 1998 Elsevier Science Ltd
1. INTRODUCTION
230Th is the second longest-lived intermediate daughter nuclide(half-life t1/2 5 75383 years, Meadows et al., 1980) in the238Udecay series, and231Pa is the longest-lived intermediate daugh-ter nuclide (t1/2 5 32760 y, Robert et al., 1969) in the235Udecay series. Because U, Th, and Pa have different valences(typically 41 and 61 for U, 41 for Th, and 51 for Pa) andchemical affinities, significant fractionation can occur betweenthese elements during various geological processes. For exam-ple, Th and Pa have very low solubilities compared to U inaqueous systems and are rapidly removed from fluids due totheir tendency to hydrolyze and sorb onto sinking particulates(Gascoyne, 1992). Thus, minerals precipitated from waters canhave very low initial230Th and 231Pa contents compared totheir parent U. The following return to equilibrium can then beused as a measure of time. As the two daughters have differentcharacteristic timescales of ingrowth, they can be used asindependent measures of time, over timescales as long as 550ka (230Th) and 200 ka (231Pa).
U-Th-Pa systematics have been used to obtain mineral for-mation ages since the 1950s. Barnes et al. (1956) measuredcoralline230Th and238U by alpha-counting. Sackett (1958) firstsuggested the use of both231Pa and230Th methods to datecarbonate samples. During the 1960s, the determinations of230Th, 231Pa, 234U, and 238U using alpha-counting methodswere applied to numerous dating applications (Alle´gre, 1964;Thurber et al., 1965; Kaufman and Broecker, 1965; Broeckerand Thurber, 1965; Sakanoue et al., 1967; Rosholt, 1967; Ku,1968; Szabo and Rosholt, 1969). In the 1970s and early 1980s,the application of such techniques slowed because the precisionof the alpha-counting methods was insufficient to resolve manydating problems, including the evaluation of the diageneticalteration of carbonate samples. In the late 1980s, thermal
ionization mass spectrometric (TIMS) methods for the measure-ment of 234U (Chen et al., 1986;234U half-life 5 244,500 y,Lounsbury and Durham, 1971, DeBievre et al., 1971) and230Th (Edwards et al., 1987a,b; Edwards, 1988) were devel-oped, leading to significant increases in analytical precision in230Th dating. The use of TIMS for230Th dating has resulted inthe establishment of precise chronologies for sea level changes,continental climate shifts, and an absolute14C calibration (e.g.,Edwards et al., 1987a,b, 1993; Bard et al., 1990a,b; Ludwig etal., 1992; Stein et al., 1993; Gallup et al., 1994). In addition,precise initiald234U values (([234U/238U] 2 1) 3 1000, wherebrackets indicate activity ratios) of marine samples have beenused to test for diagenetic alteration based on the assumptionthat thed234U value of seawater is constant with location andthrough time. However,230Th studies still suffer from uncer-tainty about possible open-system behavior. For example,many old coral samples have initiald234U values higher thanthe modern marine value. Thus, it would be desirable to haveanother chronometer available to test for age concordancy. The231Pa method, as first suggested by Sackett (1958), is a likelychoice, however, this method does not yield the required pre-cision with decay-counting techniques. We have, therefore,begun using TIMS techniques for231Pa measurements in car-bonates (Cheng et al., 1996; Edwards et al., 1997) using aprocedure originally developed at Los Alamos (Pickett et al.,1994). This method provides data with precisions comparableto the230Th TIMS method, which makes it possible to use theU-Th-Pa system to test for age concordancy and diageneticprocesses.
Up until now, there has been little motivation to establish thebasic systematics for U-Th-Pa dating with the same rigor asseen for the U/Pb system, although these dating systems wereboth developed during the 1950s to 1960s and share manysimilarities. A number of previous studies have discussed U-Th-Pa concordancy and applications to alpha-counting datafrom coral, phosphorite, and U ore samples (Alle´gre, 1964; Ku,1968; Szabo and Vedder, 1971; Ku et al., 1974; Szabo, 1979;
*Author to whom correspondence should be addressed([email protected]).
Pergamon
Geochimica et Cosmochimica Acta, Vol. 62, No. 21/22, pp. 3437–3452, 1998Copyright © 1998 Elsevier Science LtdPrinted in the USA. All rights reserved
0016-7037/98 $19.001 .00
3437
Roe et al., 1982; Veeh, 1982; Birch et al., 1983; Burnett andKim, 1986; O’Brien et al., 1986; Veeh and France, 1988;Kaufman and Ku, 1989; Kaufman et al., 1995). In general, thediffering effects of diagenesis were not considered in the detailthat is now necessary, because, in most cases, the availableprecision was insufficient to resolve these differences. Beforethis work, Allegre(1964) studied the equations for episodic Ugain for the case where initial [234U/238U] was unity andKaufmann and Ku (1989) and Kaufmann et al. (1995) studiedthe case of continuous U gain and loss, also for the case inwhich initial [234U/238U] was unity. In both cases these modelswere used to interpret data from U-rich minerals. In a thirdstudy, Rosholt (1967) found, and later confirmed (Szabo andRosholt, 1969), excess231Pa relative to235U in a molluscanshell. They proposed a open-system model with two reservoirsof U to explain this231Pa excess (see Kaufman et al. (1971) fora critical evaluation of this model).
Possible open-system behavior of U and Th isotopes hasbeen evaluated with TIMS230Th data (Edwards et al., 1987a,b;Edwards, 1988; Chen et al., 1991; Bard et al., 1991; Hamelin etal., 1991; Henderson et al., 1993; Gallup et al., 1994). WithTIMS 231Pa data now available (Pickett et al., 1994; Cheng etal., 1996; Goldstein et al., 1996; Holden et al., 1996; Pickettand Murrell, 1997; Edwards et al., 1997), it is critical toexamine U-Th-Pa systematics in more detail. In this paper, wepresent several basic models for the U-Th-Pa system using[231Pa/235U] vs. [230Th/238U] or [231Pa/235U] vs. [230Th/234U]diagrams which are analogous to206Pb/238U vs. 207Pb/235Uconcordia diagrams. This framework can potentially improveour understanding of U-series dating results and lead to betterconstraints for Quaternary chronology. It may also help usunderstand the nature of diagenetic processes in various set-tings.
2. MODELS
2.1. Assumptions and Conventions
In the following models, a number of initial conditions andconventions are adopted. (1) Initial230Th and 231Pa are as-sumed to be zero. This is an important assumption that simpli-fies our theoretical treatment but also limits the use of ourmodels to materials for which this assumption is valid. Studiesof initial 231Pa levels, how one might correct for initial231Pa,relationships among initial231Pa, initial230Th, and232Th con-centrations, as well as the theoretical basis for interpretingU/Th/Pa isotopic data for materials with significant initial230Th and231Pa represent a class of problems which remain tobe studied and are beyond the scope of this contribution.Although many materials may contain significant initial230Thor 231Pa (Kaufman and Broecker 1965; Ku et al., 1979;Schwarcz, 1980), many calcite, aragonite, phosphorite, andtooth or bone samples have been shown to contain trivial initial230Th or 231Pa (e.g., Edwards, 1988; Edwards et al., 1988;Cheng et al., 1996; Goldstein et al., 1996; Edwards et al.,1997). Our analysis aims to aid in the interpretation of datafrom the latter types of materials. (2)231Th, 234Th and234Pa areassumed to be in secular equilibrium at the time of sampleformation. (3)li 2 l238 5 li; li 2 l235 5 li; e2l238t 5e2l235t 5 1, whereli is the decay constant for nuclide i and tis time. (4) Ratios in square brackets are activity ratios where
activity is defined as ai 5 liNi, whereli and Ni are the decayconstant and the number of atoms for nuclide i, respectively.
2.2. Concordia Diagrams
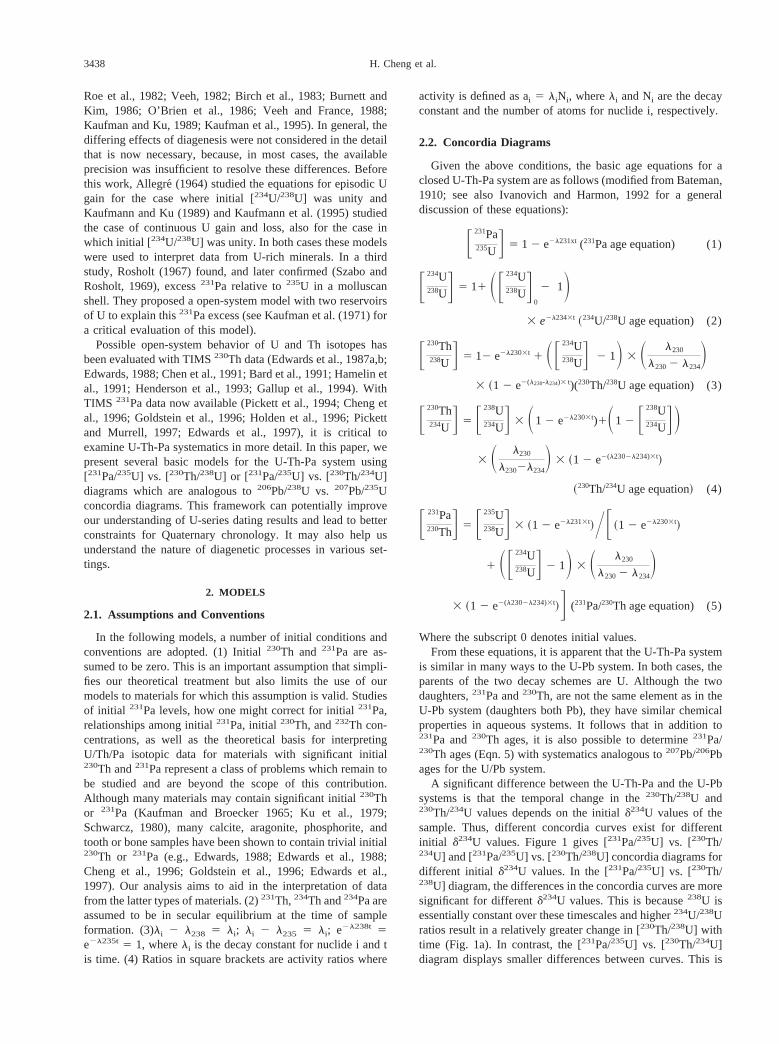
Given the above conditions, the basic age equations for aclosed U-Th-Pa system are as follows (modified from Bateman,1910; see also Ivanovich and Harmon, 1992 for a generaldiscussion of these equations):
F 231Pa235UG 5 1 2 e2l231xt (231Pa age equation) (1)
F 234U238UG 5 11 SF 234U
238UG0
2 1D3 e2l2343t ~234U/238U age equation) (2)
F 230Th238U G 5 12 e2l2303t 1 SF 234U
238UG 2 1D 3 S l230
l230 2 l234D
3 ~1 2 e2(l230-l234)3 t)(230Th/238U age equation) (3)
F 230Th234U G 5 F 238U
234UG 3 S1 2 e2l2303t)1S1 2 F 238U234UGD
3 S l230
l2302l234D 3 ~1 2 e2(l2302l234)3t!
~230Th/234U age equation! (4)
F 231Pa230ThG 5 F 235U
238UG 3 ~1 2 e2l2313t!YF ~1 2 e2l2303t!
1 SF 234U238UG 2 1D 3 S l230
l230 2 l234D
3 ~1 2 e2(l2302l234)3t!G (231Pa/230Th age equation) (5)
Where the subscript 0 denotes initial values.From these equations, it is apparent that the U-Th-Pa system
is similar in many ways to the U-Pb system. In both cases, theparents of the two decay schemes are U. Although the twodaughters,231Pa and230Th, are not the same element as in theU-Pb system (daughters both Pb), they have similar chemicalproperties in aqueous systems. It follows that in addition to231Pa and230Th ages, it is also possible to determine231Pa/230Th ages (Eqn. 5) with systematics analogous to207Pb/206Pbages for the U/Pb system.
A significant difference between the U-Th-Pa and the U-Pbsystems is that the temporal change in the230Th/238U and230Th/234U values depends on the initiald234U values of thesample. Thus, different concordia curves exist for differentinitial d234U values. Figure 1 gives [231Pa/235U] vs. [230Th/234U] and [231Pa/235U] vs. [230Th/238U] concordia diagrams fordifferent initial d234U values. In the [231Pa/235U] vs. [230Th/238U] diagram, the differences in the concordia curves are moresignificant for differentd234U values. This is because238U isessentially constant over these timescales and higher234U/238Uratios result in a relatively greater change in [230Th/238U] withtime (Fig. 1a). In contrast, the [231Pa/235U] vs. [230Th/234U]diagram displays smaller differences between curves. This is
3438 H. Cheng et al.

because the more similar half-lives for234U and230Th result insmaller changes in the230Th/234U ratios (Fig. 1b). Both dia-grams have distinct advantages. For example, if the effects ond234U due to diagenesis are of interest, Fig. 1a will maximizethe sensitivity to variations ind234U. Alternatively, in order tominimize the effect of initiald234U values on age determina-tions, Fig. 1b may prove useful. It will allow for age estimatesof marine samples using a single concordia curve, because theinitial d234U value for marine samples should be close to 150,and the possible variations are indistinguishable in this dia-gram.
Uncertainties in the decay constants of230Th and231Pa leadto uncertainties in the location of concordia. Direct measure-ments of the decay constants currently yield the following 2sfractional errors: for230Th, 68‰ (Meadows et al., 1980), andfor 231Pa,67‰ (Robert et al., 1969). Recent measurements onmaterials assumed to be in secular equilibrium (Cheng et al.,1997) give a230Th decay constant within error of that reportedby Meadows et al. (1980), but constrain the error to63‰. Thepropagation of errors in decay constants depends on the typesof standards used for each nuclide. For instance, if gravimetricU and Th standards are used, the fractional error in230Th agedue to error in the230Th decay constant is less than thefractional error in the decay constant for ages significantly lessthan 105 y, but greater than the fractional error in the decayconstant for ages significantly larger than 105 y (Edwards et al.,1987). However, if materials assumed to be in secular equilib-rium are used for U and Th standards, the fractional error in agedue to error in the230Th decay constant is similar to thefractional error in the decay constant regardless of age (Ludwiget al., 1992). For U and Th, both gravimetric and secularequilibrium standards are used by the scientific community
today. However, for Pa only secular equilibrium standards areused as, to the best of our knowledge, gravimetric Pa standardsdo not exist. For this type of standardization, the fractionalerror in 231Pa age due to error in the231Pa decay constant isexactly equal to the fractional error in the decay constantregardless of age.
In Fig. 2, the thickness of the curve reflects the maximumuncertainty in the position of the concordia curves due to theuncertainties in the decay constants of230Th and231Pa, giventhat analytical measurements of both abscissa and ordinate arebased on secular equilibrium standards. In the y-direction([231Pa/235U]), the error in the position of concordia variesfrom 67‰ (the fractional error in the231Pa decay constant) atzero age to less than62‰ at .100 ka. In the x-direction([230Th/238U] or [230Th/234U]) the error in the position ofconcordia ranges from63‰ (the fractional error in the230Thdecay constant) at zero age to less than61‰ at .250 ka. Inboth abscissa and ordinate, the error in the position of concor-dia approaches zero as age approaches infinity and as theactivity ratios approach unity.
Figure 3 is analogous to Fig. 2, except that the error in thex-direction is calculated assuming standardization to gravimet-ric Th and U standards. As the standardization is essentially toa known atomic ratio of Th to U (as opposed to a knownactivity ratio of Th to U as illustrated in Fig. 2), we use atomicratios on the abscissa of Fig. 3. In these diagrams, the uncer-tainties in the position of concordia in the ordinate ([231Pa/235U]) are as same as in Fig. 2. In the abscissa, uncertainties inthe position of concordia, increase from less than 1‰ at ages,60 ka to 3‰ at ages. 500 ka. The error in the location ofconcordia due to the uncertainty in the230Th decay constantvanishes as age approaches zero. As age approaches infinity,
Fig. 1. [230Th/238U] vs. [231Pa/235U] (a) and [230Th/234U] vs. [231Pa/235U] (b) concordia diagrams using half-lives of75,383 years and 32,760 years for230Th and231Pa, respectively. The curves describe the evolution of the U-230Th-231Pasystem with initial activity ratios of [230Th/238U] (or [230Th/234U]) 5 0 and [231Pa/235U] 5 0, contoured with different initiald234U values ranging from 0 to 1500. The horizontal lines are isochrons and the associated numbers indicate the ages inthousands of years (ka). Diagram (a) is much more sensitive to initiald234U values than diagram (b). For evaluatingvariations ind234U, diagram (a) may be more useful. For minimizing the effect of variations ind234U on age determinations,diagram (b) may prove more useful.
3439U-Th-Pa dating

the fractional error in the location of concordia in the x-direc-tion approaches the fractional error in the230Th decay constant.As the error in the position of concordia as well as the error inassigning times to points on concordia (see captions for Figs. 2and 3) are in some cases comparable to analytical errors, it maybe necessary to consider these sources of uncertainty in appli-cations using concordia plots.
Theoretically, all measured231Pa and230Th ages representapparent mean ages of samples which have been deposited oversome period of time. These apparent ages are a little youngerthan the true mean ages. This phenomenon occurs because therates of231Pa and230Th accumulation slow with time. Thus,ages calculated from average231Pa/235U and 230Th /238U (or230Th /234U) ratios do not correspond exactly to true mean ages.Furthermore, the offset between the231Pa and true mean ageand that between the230Th and true mean age are in generaldifferent. Measured mean231Pa ages are younger than corre-sponding230Th ages. The231Pa and230Th mean age differ-ences are generally much smaller than the analytical errors.However, if the sample has been deposited over a large (.50ka) time interval (for example, if the sample growth rate isextremely low), the difference in mean ages may need to beconsidered for concordia problems.
d234U vs. [231Pa/235U] and d234U vs. [230Th/238U] (or[230Th/234U]) are other examples of concordia diagrams for theU-Th-Pa system (Fig. 4a,b). Thed234U vs. [230Th/238U] dia-
gram has been widely used to evaluate possible diagenesis forcoral samples (i.e., Edwards, 1988; Ku et al., 1990; Bard et al.,1991; Chen et al., 1991; Gallup et al., 1994). With the avail-ability of TIMS data for231Pa, thed234U vs. [231Pa/235U] plotcan now also be used to check for diagenesis.
Although the231Pa dating method has a shorter time range(;200 ka) than that of the230Th dating method (;550 ka), itstill can be used to test for concordia and evaluate diagenesisprocesses for samples older than 200 ka. For samples older thanabout 200 ka, the [231Pa /235U] ratio must equal one, withinpresent analytical errors, if the sample has behaved as a closed-system. Values other than one suggest gain or loss of either Uor 231Pa (see following discussion).
2.3. Episodic Uranium Loss or Gain Relative to230Thand 231Pa
Allegre (1964) first provided an episodic model for theU-Th-Pa system for the case in which [234U/238U] equals one.This is similar to the episodic model for the U-Pb systematicsintroduced by Wetherill (1965a,b). The basic assumption is thatthe sample experienced open-system conditions for a very shortperiod (compared to true age of the sample) which resulted inPb loss or U gain. Minerals of the same age but experiencingdifferent degrees of Pb loss or U gain will fall on a straight linewith the upper intercept with the concordia curve correspond-
Fig. 2. [230Th/238U] vs. [231Pa/235U] (a) and [230Th/234U] vs. [231Pa/235U] (b) concordia diagrams similar to Figs. 1a and1b, showing the effect of the half-life uncertainties for230Th and231Pa. The initiald234U is assumed to be 150. The thicknessin the curve represents the maximum variation in the concordia curve positions due to the half-life uncertainties. The whitecircles around 50 ka in (a) and (b) represent the uncertainty at this age caused by the uncertainties in the half-lives of230Th(75383 years with 2s error of 63‰) and231Pa (32,760 years with 2s error of67 ‰). 2301, 2311, and 2302, 2312indicate230Th and231Pa half-lives 3‰ and 7‰ higher than the nominal values, and230Th and231Pa half-lives 3‰ and 7‰lower than the nominal values, respectively. For example, using 2301 and 2312, the concordia curve will be shifted to theupper left; using 2302 and 2311, the curve will be shifted to the lower right. When 2301 and 2311 or 2302 and 2312are used, the position of concordia curve is close to the position of a curve using the nominal230Th half-life of 75383 y and231Pa half-life of 32760 y; however, ages along the curve will be shifted to the lower left or the upper right, respectively.The arrows indicate the direction of these variations. The uncertainty of the concordia positions in ordinate ([231Pa/235U])decreases from 7‰ (the fractional error in the231Pa decay constant) at zero age to less than 2‰ for ages.100 ka, and inabscissa ([230Th/238U] or [230Th/234U]), from 3‰ (the fractional error in the230Th decay constant) at zero age to less than1‰ for ages.250 ka.
3440 H. Cheng et al.

ing to the time of crystallization and the lower intercept corre-sponding to the time of the secondary open-system event.
The U-Th-Pa system has very similar features. The followingdiscussion refers to episodic U loss or gain, for the case where
U isotopes are not fractionated during loss and where anygained U has the same isotopic composition as the sample. Inthe discussion, we refer to U loss or gain, but these processesare mathematically equivalent (and equally applicable) to Pa
Fig. 3.230Th/238U vs. [231Pa/235U] (a) and230Th/234U vs. [231Pa/235U] (b) concordia diagrams. All notations and legendsare as same as those in Fig. 2, except the abscissas,230Th/238U and230Th/234U, which are atomic ratios instead of activityratios. As opposed to Fig. 2, which illustrates how errors in decay constants propagate if secular equilibrium standards areused for both Pa/U and Th/U, this figure illustrates how errors in decay constants propagate if secular equilibrium standardsare used for Pa/U, but gravimetric standards are used for Th/U. The uncertainty of the concordia positions in ordinate,([231Pa/235U]) is as same as Fig. 2. However, in this case, the error in the position of concordia in the abscissa (230Th/238Uor 230Th/234U), increases from less than 1‰ for ages,60 ka to up to 3‰ (the fractional error in the230Th decay constant)for ages. 500 ka.
Fig. 4. Plots ofd234U vs. [231Pa/235U] (a) andd234U vs. [230Th/238U] (b), contoured in231Pa age and230Th age (verticaland subvertical lines in (a) and (b), respectively) and initiald234U (subhorizontal curves in (a) and (b)). Diagram (b) hasbeen used previously to evaluate diagenesis. With231Pa TIMS data now available, a similar plot for [231Pa/235U] may beuseful (a).
3441U-Th-Pa dating

and Th gain or loss, subject to the condition that Pa and Th aregained in the same proportion as they are present in the sampleor that Pa and Th are lost without fractionation. If U loss or gainoccurs over a very short period (tD years ago, D for diagenesis),samples of the same primary age (tP years, P for primary) withvarying degrees of U loss or gain will also fall on a straight linein a [231Pa/235U] vs. [230Th/238U] or [231Pa/235U] vs. [230Th/234U] concordia plot. The upper intercept with the concordiacurve corresponds to their true primary age (tP). A majordifference between this system and the U-Pb system is that thelower intercept does not theoretically correspond to the exactage of the secondary event (tD) unless initiald234U is zero (i.e.,[234U/238U] 5 1). The basic equations for the episodic modelfor U-Th-Pa evolution are:
F 231Pa235UG 5 ~1 2 e2l2313(tP2tD)) 3 e2l2313tD
3 F 1 ~1 2 e2l2313tD! (6)
F 230Th238U
G 5 F ~1 2 e2l2303(tP2tD)! 1 SF 234U238U
G0
2 1D3 e2l2343(tP2tD) 3 S l230
l230 2 l234D 3 ~1 2 e2(l2302l234)3(tP2tD)!G
3 e2l2303tD 3 F 1 ~1 2 e2l2303tD! 1 SF 234U238UG
0
2 1D3 e2l2343tP 3 S l230
l2302l234D 3 ~1 2 e2(l2302l234)3tD! (7)
F 234U238UG 5 1 1 SF 234U
238UG0
2 1D 3 e2l2343tP (8)
F 230Th234U G 5 F 230Th
238U GY F 234U238UG
5 F 230Th238U GYF1 1 SF 234U
238UG0
2 1D 3 e2l2343tPG (9)
Where at time tD, U loss or gain follows: Uold/Unew5 F. WhereUold and Unew are U atoms per unit sample before and after tD,respectively. tP is the sample’s primary age. F is related to thefraction of U lost (.1) or gained (,1) during the diageneticevent at time, tD.
Using these equations, it can be shown that the derivativesd[231Pa/235U]/d[230Th/238U], d[231Pa/235U]/d[230Th/234U],d[234U/238U]/[231Pa/235U] and d[234U/238U]/[230Th/238U] areall independent of F. Therefore, samples of the same age withdifferent degrees of U loss or gain occurring at tD will plotalong straight lines in diagrams of [231Pa/235U] vs. [230Th/238U] (Fig. 5a), [231Pa/235U] vs. [230Th/234U] (Fig. 5b), d234Uvs. [231Pa/235U] (Fig. 6a), andd234U vs. [230Th/238U] (Fig. 6b).The upper intersection of the line with the concordia curvecorresponds to F5 1 (no U loss or gain) and indicates thesample’s primary age (tP). If d234U 5 0, the lower intersectionof the line with the concordia curve corresponds to F5 0 (all230Th and231Pa lost or infinite addition of U) and indicates thetime of open-system behavior (tD). Whend234U is negative, the
point corresponding to tD and F5 0 will actually lie to theupper right of the lower intercept. Whend234U is positive, thispoint will lie to lower left of the lower intercept. The larger theinitial d234U offset from 0, the larger the distance between thepoint corresponding to tD and F5 0 and the lower intercept.However, in many cases the age of most interest is the true age(tP, the upper intercept point). Furthermore, if initiald234U isclose to 0, for example between 0 and 200 (the case for marinesamples), the lower intercept will be indistinguishable from theF 5 0 point in a [231Pa/235U] vs. [230Th/234U] diagram (Fig.5b). Other graphical methods common to the episodic modelfor the U-Pb system can also be applied to the U-Th-Pa system.For example, the distance of the data points from the upperintercept point represents the fractional U loss or gain relativeto 230Th and231Pa.
For the case of relative U loss, the different ages have thefollowing relationship:231Pa age. 230Th age. 231Pa/230Thage . true age. For the case of relative U gain,231Pa age, 230Th age, 231Pa/230Th age, true age. Thus, in these typesof open systems, if analytical imprecision is negligible, the231Pa/230Th age is closest to the true age. In practice, con-straints from231Pa/230Th ages are most useful for samplesolder than about 10 ka years as231Pa/230Th ages are signifi-cantly less precise than either231Pa or230Th ages for samplesyounger than 10 ka (because the fractional change in231Pa/230Th ratio with time is very small in this interval).
We can estimate a sample’s230Th, 231Pa, and231Pa/230Thages through graphical methods using concordia plots (Fig. 1).Note that if a sample has been altered these ages will not ingeneral be identical to the true age of the sample. In either a[231Pa/235U] vs. [230Th/238U] plot (Fig. 1a) or a [231Pa/235U]vs. [230Th/234U] plot (Fig. 1b), the231Pa age is given by theintersection between concordia and a horizontal line through asample point. For estimating230Th and230Th/231Pa ages, theinitial d234U must be known, either independently or by usingthe estimated age from a concordia plot to calculate an initiald234U from a measured value. One can then select the concor-dia curve that corresponds to the initiald234U value. Given thiscurve in either a [231Pa/235U] vs. [230Th/238U] plot (Fig. 1a) ora [231Pa/235U] vs. [230Th/234U] plot (Fig. 1b), the230Th age isgiven by the intersection between concordia and a vertical linethrough a sample point and the231Pa/230Th age is given by theintersection between concordia and a line between a samplepoint and the origin. [231Pa/235U] vs. [230Th/234U] plots aregenerally the most useful for graphically estimating230Th and231Pa/230Th ages as the position of concordia is not stronglydependent on initiald234U value in this type of plot.
2.4. Continuous Uranium Loss or Gain Relative to230Thand 231Pa
If U loss or gain occurs as a continuous process with nochange in the U isotopic composition, the behavior of theU-Th-Pa system is graphically similar to the diffusion modelfor U-Pb systematics (Nicolaysen, 1957; Tilton, 1960; Wass-erburg, 1963). Kaufmann and Ku (1989) and Kaufmann et al.(1995) examined this process for the case that the initiald234Uvalue and thed234U value of added U were both zero. Weexamine this process with initiald234U as a variable, butstipulate that gained or lost U may not change the U isotopic
3442 H. Cheng et al.

composition of the material. In our model, we refer to U loss orgain, however, these processes are mathematically equivalentto gain of both231Pa and230Th or loss of both231Pa and230Thif the gain or loss causes no shift in the231Pa/230Th ratio in thesample. The equations for our model are given in the nextsection. Samples of the same age will lie along a curve,instead of a straight line, in [231Pa/235U] vs. [230Th/238U]and [231Pa/235U] vs. [230Th/234U] diagrams (Fig. 7a and 7b).However, this curve is nearly linear near its upper interceptwith concordia. In plots ofd234U vs. [231Pa/235U] andd234Uvs. [230Th/238U], samples of the same age will lie on lines(Fig. 8a and 8b). In diagrams of [231Pa/235U] vs. [230Th/238U] and [231Pa/235U] vs. [230Th/234U], the lower interceptnow has no temporal significance; however, the upper inter-cept still corresponds to the primary age. Because the curveis indistinguishable from a straight line near the upper in-tercept (Fig. 7a,b), it may be possible to estimate the primaryage by graphical methods. In this model, the230Th, 231Pa
and 231Pa/230Th ages have the same relationship as in theepisodic model described above for both U loss and gaincases.
2.5. Continuous Addition or Loss of234U, 230Thand 231Pa
Gallup et al. (1994) formulated a230Th and234U continuousinput model to explain U-series results obtained for Barbadoscorals. We present here a general model for continuous234U,230Th, and231Pa input together with continuous loss or gain ofU. The basic differential equations for this model are:
d238U
dt5 2l238 3 238U 1 Ru3 238U (10)
d235U
dt5 2l235 3 235U 1 Ru3 235U (11)
Fig. 5. [230Th/238U] vs. [231Pa/235U] (a) and [230Th/234U] vs. [231Pa/235U] (b) concordia diagrams showing the effect ofepisodic U loss or gain relative to230Th and231Pa 20 ka ago (tD) for a suite samples with the same crystallization age of100 ka (tP). Upon initial precipitation 100 ka ago, the whole suite of samples lie on the origin. Over the next 80 ka, theisotopic composition of the suite is assumed to evolve through closed-system radioactive decay and ingrowth, followingconcordia to the 80 ka point. At that time (20 ka ago, tD), the suite of samples undergoes episodic diagenesis. Some samplesgain U (F, 1) and some lose U (F. 1). The squares represent the isotopic composition of the suite of samples immediatelyafter the open-system episode 20 ka ago (tD). The square on concordia at 80 ka represents a sample in the suite that has notgained or lost any U. The squares above concordia show the isotopic compositions samples that have lost U (20% for thefirst square above concordia (F5 1.2), 40% for the second square above concordia (F5 1.4). The squares below concordiashow the isotopic composition of samples that have gained U. The first square below concordia shows the isotopiccomposition of a sample, which after the episode has 80% primary U and 20% diagenetic U (F5 0.8). The second squarebelow concordia shows the isotopic composition of a sample that has 60% primary U and 40% diagenetic U (F5 0.6), andso on. The square that plots on the origin has 0% primary U (infinite addition of diagenetic U, F5 0). The dashed line ineach diagram connects the squares and is mathematically linear. After this episode of U loss and gain, the suite is assumedto again behave as a closed-system. The square points evolve by radioactive decay and ingrowth along the dotted lines tothe corresponding circles over a period of 20 ka. At all times in the intervening 20 ka, the points lie on a line that intersectsconcordia at a time that represents the primary age of the suite (upper intercept with concordia) and a time that is generallyclose to the time of the diagenetic episode (if initiald234U is reasonably close to zero; see text, lower intercept withconcordia). The circles represent the isotopic composition of the suite of samples after the intervening 20 ka ofclosed-system behavior. In each diagram, the fine solid line connects the open circles and intersects concordia at the timeof primary crystallization and close to the time of episodic diagenesis. In this model, samples that plot above concordia,represent samples that lost U relative to both230Th and231Pa at tD, and samples that plot below concordia, gained U relativeto both230Th and231Pa at tD. The distance between a sample point and upper intercept point is proportional to the degreeof its U loss, for samples that plot above concordia, or to the fraction of diagenetic U contained in the sample, for samplesthat plot below concordia.
3443U-Th-Pa dating

d231Pa
dt5 l235 3 235U 2 l231 3 231Pa1 R231 (12)
d234U
dt5 l238 3 238U 2 l234 3 234U 1 Ru3 234U 1 R234 (13)
d230Th
dt5 l234 3 234U 2 l230 3 230Th 1 R230 (14)
Using the following initial and boundary conditions,
230Tho 5 Pao 5 0,
238U0 5 137.883 235Uo,
F 234U238U
G0
5 constant,
we obtain the following analytical solutions to Eqns. 10214:
238Ut 5 238Uo 3 e(Ru2l238)3t 5 238Uo 3 eRu3t (15)
235Ut 5 235Uo 3 e(Ru2l235)3t 5 235Uo 3 eRu3t (16)
231Pat 5l235 3 235Uo
Ru1 l2313 eRu3t 2 SR231
l2311
l235 3 235Uo
Ru1 l231D
3 e2l2313t 1R231
l231(17)
234Ut 5l238 3 238Uo
l2343 eRu3t 1 FF 234U
238UG0
3l238 3 238U
l234.
2R234
l234 2 Ru2
l238 3 238Uo
l234G 3 e2(l2342Ru)3t 1
R234
l234 2 Ru
(18)
234Tht 5l238 3 238Uo
l2343 eRu3t 1 FF 234U
238UG0
3l238 3 238Uo
l234
2R234
l234 2 Ru2
l238 3 238Uo
l234G 3
l234
Ru2 l234 1 l230
3 e2(l2342Ru)3t 2 Fl238 3 238Uo
(Ru1 l2301 SF 234U
238UGo
3l238 3 238Uo
l2342
R234
l234 2 Ru2
l238 3 238Uo
l234D
3l234
Ru2 l234 1 l2301
R230
l2301
l234 3 R234
l230 3 (l234 2 Ru)G3 e2l2303t 1
R230
l2301
l234 3 R234
l230 3 (l234 2 Ru)(19)
Wherel230, l231, l234, l235, andl238 are the decay constants(with units of inverse time) for230Th, 231Pa,234U, 235U, and238U. R230, R231, and R234 are input rates (with units of atoms/
Fig. 6. Plots ofd234U vs. [231Pa/235U] (a) and d234U vs. [230Th/238U] (b). (See caption for Fig. 4). The episodicassumptions, symbols and lines are same as in Fig. 5. Each of the squares and open circles in this figure correspond to ananalogous square or circle in Fig. 5. The intercept of the horizontal fine solid line with the concordia curve (initiald234U 5 150) gives the true crystallization age for a suite of samples of the same age. Points that lie to the right of theconcordia curve indicate U loss (F. 1) or gain of both230Th and231Pa. Points that lie to the left of concordia curve indicateU gain (F, 1) or loss of both230Th and231Pa. No information about the time of U loss or gain can be obtained in diagramssuch as these. In addition, the initiald234U must be known in order to select the correct concordia curve to be used for asuite samples.
3444 H. Cheng et al.

time) of 230Th, 231Pa,234U from outside of the system. Ru isthe fraction (per unit time) of U loss (negative) or gain (posi-tive) relative to230Th and231Pa, and it is assumed to be muchgreater thanl235 andl238 (Ru .. l235 and Ru.. l238). t isthe age of sample.230Th, 231Pa,234U, 235U, and238U representatoms of230Th, 231Pa,234U, 235U, and238U. Subscripts t and oindicate time t and t5 0, respectively.
If R231 5 R230 5 R234 5 0 and RuÞ 0, the equationsdescribe the continuous U loss (negative Ru) and gain (positiveRu) model (see Figs. 7 and 8). If R230 ' R234, and Ru andR2315 0, the equations describe the230Th and234U continuousinput model of Gallup et al., 1994.
If R231, R230, and R234 Þ 0, and Ru5 0, the equationsdescribe the234U, 230Th and 231Pa continuous input modelshown in Figs. 9 and 10. Data for samples of the same age willlie along a curve. The intercept between this curve and theconcordia curve is the primary age of the sample set. Theportion of curve near the upper intercept with concordia is veryclose to a straight line with a slope dependent on the R231, R230,and R234 values. In this continuous addition model, the231Paage will be greater than the true age, the230Th age and the231Pa/230Th age could be greater or less than true age, depend-ing on the input ratios of R230/R234 and R231/R230. Here, the231Pa age provides the best upper limit on the true crystalliza-tion age.
This model can be extended to models for231Pa,230Th, and234U continuous losses (R231, R230, and R234 are negative) asshown in Figs. 9 and 10 (the very short curves from concordia
curve down to lower left). For this case, the231Pa age will beless than the sample’s true age. As with the addition model, the230Th and the231Pa/230Th ages also could be greater or lessthan the true age, depending on the relative loss rates, i.e.,R230/R234 and R231/R230.
2.6. Linear Uptake of Uranium, with No Initial Uranium
Ikeya (1982) suggested two U-accumulation models basedon electron spin resonance (ESR) analysis of teeth, which startwith essentially no U, but pick up U diagenetically. Suchmodels could be equally applicable to other materials such asmollusks and bones, which also start with essentially no U. Thetwo models are (1) early uptake (EU) of U in which U accu-mulated within a short time span after it was buried, (2) linearuptake (LU) of U in which U addition was continuous andconstant. He favored the LU model. Ku (1982) outlined the230Th age,231Pa age and true age differences for the LU modelusing a plot of the true age vs. the average apparent age.Subsequently, the LU model has been discussed and applied tomany tooth and bone U-series and ESR dating studies (e.g.,Grun et al., 1988; Chen et al., 1994; Gru¨n and McDermott1994; Swisher et al., 1996). These studies focused mainly onESR dating and corrections. Kaufmann et al. (1995) examinedthe LU model with respect to U-Th-Pa systematics, under theassumption thatd234U is constant and equal to zero. Here, wedescribe the basic behavior of the U-Th-Pa system in the LUmodel, with thed234U of added U as a constant not equal to
Fig. 7. [230Th/238U] vs. [231Pa/235U] (a) and [230Th/234U] vs. [231Pa/235U] (b) concordia diagrams representing continuousU loss or gain. Suites of 150 ka and 80 ka age samples with different U loss or gain rates plot along the fine solid and dashedcurves, respectively. The upper intercept of each curve with concordia represents the true age of the suite. Samples thatfollow this model and plot on the portion of each dashed or fine solid line above concordia have undergone continuous Uloss relative to Pa and Th and samples that plot on the portion of each curve below concordia have undergone continuousU gain relative to Pa and Th. The rate of U gain is greatest for samples that plot on the portion of each curve near the origin,whereas the rate of U loss is greatest for samples that plot on the portion of each curve furthest from the origin. The diagramis graphically similar to the diffusion model for the U-Pb system. It is important to note that the curve near the upperintercept is close to a straight line, which may allow the use of graphical methods to obtain the true age of a set of samplesof the same age by extrapolation to its upper intercept with concordia. However, the extrapolation of the near linear portionof each curve to its lower intercept with concordia will yield a meaningless age, as has been demonstrated for the U-Pbsystem (Tilton, 1960).
3445U-Th-Pa dating

zero. Thed234U of the material is a variable, which is allowedto change as a function of time following mass balance andradioactive decay constraints. The basic differential equationsare
d238U
dt5 a (20)
d235U
dt5 b (21)
d231Pa
dt5 l2353
235U 2 l231 3 231Pa (22)
d230Th
dt5 l2343
234U 2 l230 3 230Th (23)
d234U
dt5 l238 3 238U 2 l234 3 234U 1 a3 c (24)
Using the following initial and boundary conditions,
At t 5 0: 230Tho 5 231Pao 5 238Uo 5 235Uo 5 234Uo 5 0
238U 5 137.883 235U (or a5 137.883 b)
S 234U238U
Dinput
5 c
we obtain the following analytical solutions to Eqns. 20224:
238Ut 5 a3 t (25)
235Ut 5 b 3 t (26)
231Pat 5b 3 l235
l2312 3 (e2l2313t 1 l231 3 t 2 1) (27)
234Ut 5 Sl238 3 a
l2342 2
a3 c
l234D 3 e2l2343t 1 Sl238 3 a
l234D
3 t 1a3 c
l234) 2
l238 3 a
l2342 (28)
230Tht 5 S l238 3 a
l234 3 (l230 2 l234)2
a3 c
(l230 2 l234)D 3 e2l2343t
1 F a3 c
l230 2 l2342
l238 3 a
l234 3 (l230 2 l234)1
l238 3 a
l2302
1l238 3 a
l230 3 l2342
a3 c
l230G 3 e2l2303t 1 Sl238 3 a
l230D
3 t 1a3 c
l2302
l238 3 a
l230 3 l2342
l238 3 a
l2302 (29)
Where a and b are constant rates of238U and235U accumula-tion; c is the234U/238U atomic ratio of the input U; t is the truedepositional age of the sample.
If U uptake has been linear, the standard231Pa, 230Th and231Pa/230Th ages, which are equivalent to EU ages, will all beyounger than the true age of a sample. In [231Pa/235U] vs.[230Th/238U], [231Pa/235U] vs. [230Th/234U] plots, d234U vs.[231Pa/235U], and d234U vs. [230Th/238U] plots (Figs. 11 and12), the data points lie below the concordia curves. This ten-dency becomes large when true ages are greater than about 20ka. This deviation from concordia can be used to check the
Fig. 8. Plots ofd234U vs. [231Pa/235U] (a) andd234U vs. [230Th/238U] (b) (see caption for Fig. 4), showing continuous Uloss or gain relative to230Th and231Pa. Suites of 150 ka and 80 ka age samples with different U loss or gain rates lie alongthe fine solid and dashed horizontal lines, respectively. Each of the dotted curves illustrates how the isotopic compositionof a sample with a specific U loss or gain rate changes with time.
3446 H. Cheng et al.

Fig. 9. [230Th/238U] vs. [231Pa/235U] (a) and [230Th/234U] vs. [231Pa/235U] (b) concordia diagrams. When230Th, 231Pa and234U are added to (or lost from) samples continuously, the data for samples of the same age will lie along a curve (the shortsolid or dotted curves). The intercept of this curve with concordia will indicate the true crystallization age. These curvesare indistinguishable from straight lines near the intercepts, and their slopes depend on the relative addition rates of230Th,231Pa and234U (R230, R234, and R231). In these two diagrams, two examples are given: R2305 R2345 20 * R231(short dottedcurves) and R230 5 R234 5 50 * R231(short solid curves). These ratios were chosen because 20 is close to the productionratio of 230Th to 231Pa and would be the approximate isotope ratio of a young carbonate (,10 ka). 50 is close to the230Th/231Pa ratio of secular equilibrium materials. The upper end and lower end of each short line represent 200,000atom/year/g gain and 100,000 atom/year/g loss of230Th for a sample with a 3 ppm 238U concentration, a typicalconcentration for a coral. For reference, a coral with this238U concentration produces about 1.3 million atoms of230Th/year/g by radioactive decay. Graphical methods can be used to obtain the true age for a suite of the samples of thesame age.
Fig. 10. Continuous230Th, 231Pa and234U addition models for plots ofd234U vs. [231Pa/235U] (a) and d234U vs.[230Th/238U] (b). The symbols are same as in Fig. 8. The dashed curves (b) represent the condition of R230 5 R234. All ofthe thin dashed, dotted, and solid curves are indistinguishable from straight lines. It is possible to get information for a suiteof samples of the same age using graphical methods; however, the initiald234U values must be known. In this model, thecurves are generally not subhorizontal, which is different from simple U loss and gain models.
3447U-Th-Pa dating

applicability of the LU model. In addition, Eqns. 20, 23, and 24can be used to solve for a, c, and t; and Eqns. 21 and 22 willprovide b and t. In this way, age and input rate can be checkedfor concordancy.
If the sample follows the LU model, the different standard
ages of a sample have the following pattern: true age$ appar-ent 231Pa/230Th age. apparent230Th age$ apparent231Paage. When the true age is less than 20 ka, the true age is nearlytwice that of the apparent231Pa or230Th ages (Figs. 11 and 12)and about 1.5; 1.6 times that of the apparent231Pa/230Th age.
Fig. 11. [230Th/238U] vs. [231Pa/235U] (a) and [230Th/234U] vs. [231Pa/235U] (b) concordia plots. Solid curves are concordiacurves (initiald234U 5 150 and 1500) as in Fig. 1. Dashed curves are concordia plots assuming linear U (LU) uptake (initiald234U 5 150 and 1500). The ages on LU model curves correspond to the true ages of samples for which uptake of U hasbeen constant with time.230Th and231Pa ages calculated assuming linear U uptake are older than those calculated assumingclosed-system behavior for the same measured [230Th/238U], [230Th/234U], and [231Pa/235U] values. Diagrams such as thesecan be used to test for LU model behavior (isotopic compositions should lie on the dashed linear uptake concordia curves).
Fig. 12. Plots ofd234U vs. [231Pa/235U] (a) andd234U vs. [230Th/238U] (b). The concordia curves of the LU model (initiald234U 5 150) are shown as dashed curves. They are below close-system concordia curves with the same initiald234U value(solid curves). The offset increases with the age.
3448 H. Cheng et al.
The differences between true and apparent ages increase withage (Figs. 11 and 12).
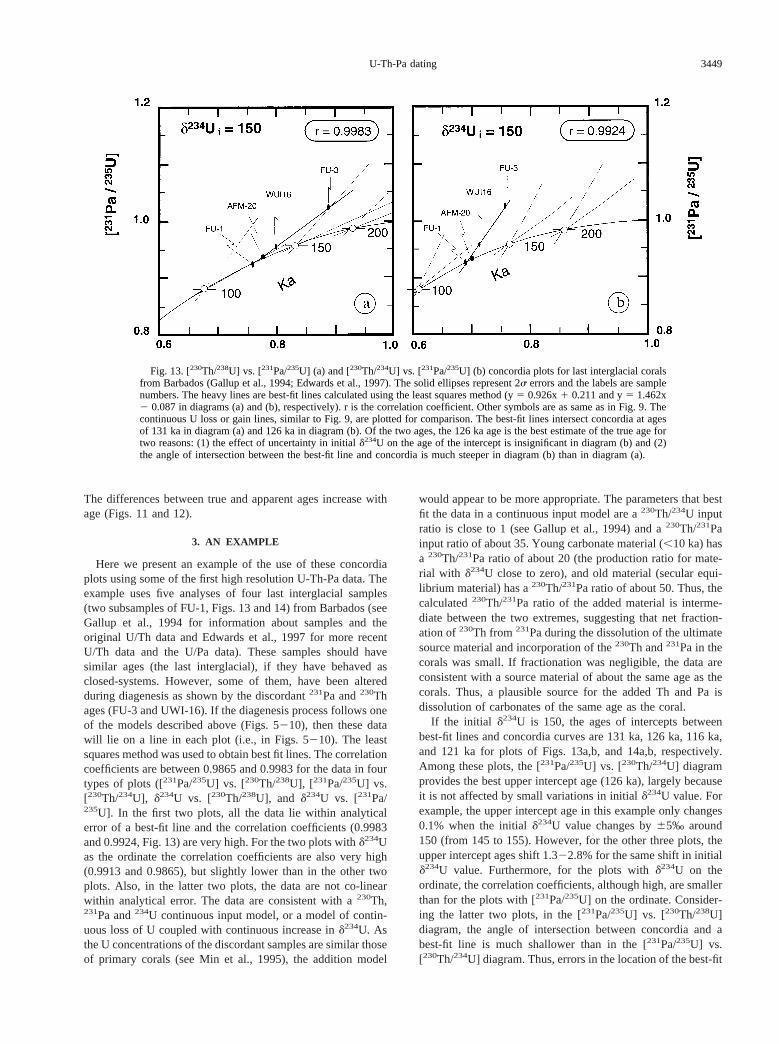
3. AN EXAMPLE
Here we present an example of the use of these concordiaplots using some of the first high resolution U-Th-Pa data. Theexample uses five analyses of four last interglacial samples(two subsamples of FU-1, Figs. 13 and 14) from Barbados (seeGallup et al., 1994 for information about samples and theoriginal U/Th data and Edwards et al., 1997 for more recentU/Th data and the U/Pa data). These samples should havesimilar ages (the last interglacial), if they have behaved asclosed-systems. However, some of them, have been alteredduring diagenesis as shown by the discordant231Pa and230Thages (FU-3 and UWI-16). If the diagenesis process follows oneof the models described above (Figs. 5210), then these datawill lie on a line in each plot (i.e., in Figs. 5210). The leastsquares method was used to obtain best fit lines. The correlationcoefficients are between 0.9865 and 0.9983 for the data in fourtypes of plots ([231Pa/235U] vs. [230Th/238U], [231Pa/235U] vs.[230Th/234U], d234U vs. [230Th/238U], and d234U vs. [231Pa/235U]. In the first two plots, all the data lie within analyticalerror of a best-fit line and the correlation coefficients (0.9983and 0.9924, Fig. 13) are very high. For the two plots withd234Uas the ordinate the correlation coefficients are also very high(0.9913 and 0.9865), but slightly lower than in the other twoplots. Also, in the latter two plots, the data are not co-linearwithin analytical error. The data are consistent with a230Th,231Pa and234U continuous input model, or a model of contin-uous loss of U coupled with continuous increase ind234U. Asthe U concentrations of the discordant samples are similar thoseof primary corals (see Min et al., 1995), the addition model
would appear to be more appropriate. The parameters that bestfit the data in a continuous input model are a230Th/234U inputratio is close to 1 (see Gallup et al., 1994) and a230Th/231Painput ratio of about 35. Young carbonate material (,10 ka) hasa 230Th/231Pa ratio of about 20 (the production ratio for mate-rial with d234U close to zero), and old material (secular equi-librium material) has a230Th/231Pa ratio of about 50. Thus, thecalculated230Th/231Pa ratio of the added material is interme-diate between the two extremes, suggesting that net fraction-ation of230Th from 231Pa during the dissolution of the ultimatesource material and incorporation of the230Th and231Pa in thecorals was small. If fractionation was negligible, the data areconsistent with a source material of about the same age as thecorals. Thus, a plausible source for the added Th and Pa isdissolution of carbonates of the same age as the coral.
If the initial d234U is 150, the ages of intercepts betweenbest-fit lines and concordia curves are 131 ka, 126 ka, 116 ka,and 121 ka for plots of Figs. 13a,b, and 14a,b, respectively.Among these plots, the [231Pa/235U] vs. [230Th/234U] diagramprovides the best upper intercept age (126 ka), largely becauseit is not affected by small variations in initiald234U value. Forexample, the upper intercept age in this example only changes0.1% when the initiald234U value changes by65‰ around150 (from 145 to 155). However, for the other three plots, theupper intercept ages shift 1.322.8% for the same shift in initiald234U value. Furthermore, for the plots withd234U on theordinate, the correlation coefficients, although high, are smallerthan for the plots with [231Pa/235U] on the ordinate. Consider-ing the latter two plots, in the [231Pa/235U] vs. [230Th/238U]diagram, the angle of intersection between concordia and abest-fit line is much shallower than in the [231Pa/235U] vs.[230Th/234U] diagram. Thus, errors in the location of the best-fit
Fig. 13. [230Th/238U] vs. [231Pa/235U] (a) and [230Th/234U] vs. [231Pa/235U] (b) concordia plots for last interglacial coralsfrom Barbados (Gallup et al., 1994; Edwards et al., 1997). The solid ellipses represent 2s errors and the labels are samplenumbers. The heavy lines are best-fit lines calculated using the least squares method (y5 0.926x1 0.211 and y5 1.462x2 0.087 in diagrams (a) and (b), respectively). r is the correlation coefficient. Other symbols are as same as in Fig. 9. Thecontinuous U loss or gain lines, similar to Fig. 9, are plotted for comparison. The best-fit lines intersect concordia at agesof 131 ka in diagram (a) and 126 ka in diagram (b). Of the two ages, the 126 ka age is the best estimate of the true age fortwo reasons: (1) the effect of uncertainty in initiald234U on the age of the intercept is insignificant in diagram (b) and (2)the angle of intersection between the best-fit line and concordia is much steeper in diagram (b) than in diagram (a).
3449U-Th-Pa dating
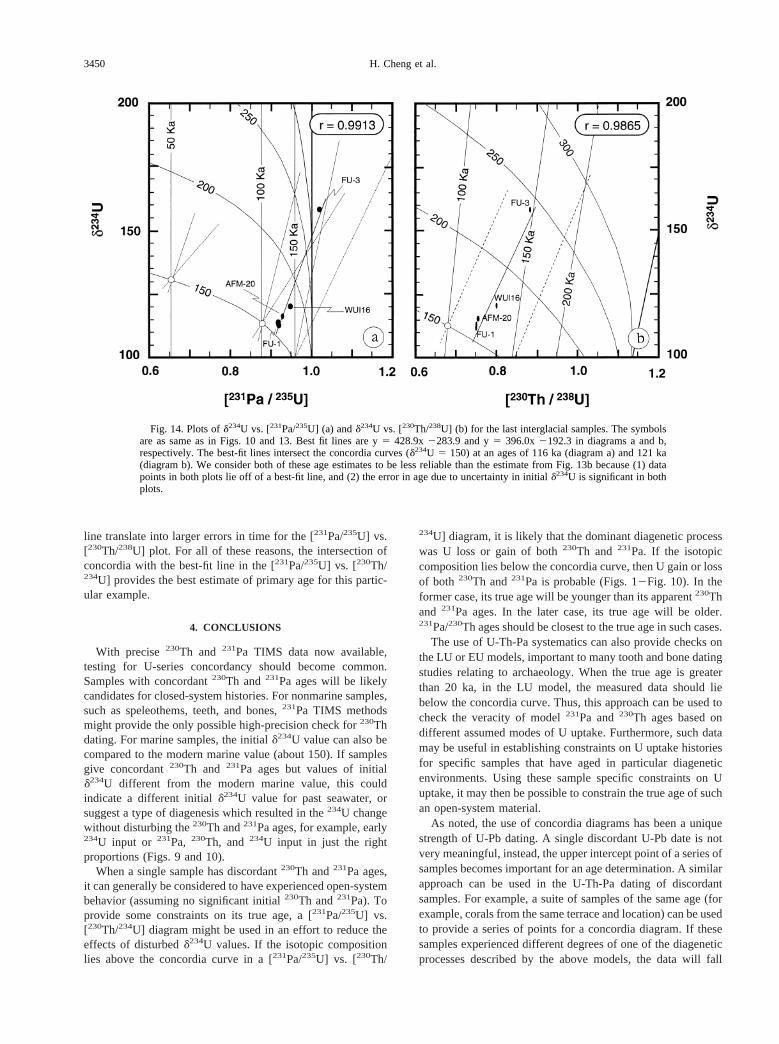
line translate into larger errors in time for the [231Pa/235U] vs.[230Th/238U] plot. For all of these reasons, the intersection ofconcordia with the best-fit line in the [231Pa/235U] vs. [230Th/234U] provides the best estimate of primary age for this partic-ular example.
4. CONCLUSIONS
With precise230Th and 231Pa TIMS data now available,testing for U-series concordancy should become common.Samples with concordant230Th and231Pa ages will be likelycandidates for closed-system histories. For nonmarine samples,such as speleothems, teeth, and bones,231Pa TIMS methodsmight provide the only possible high-precision check for230Thdating. For marine samples, the initiald234U value can also becompared to the modern marine value (about 150). If samplesgive concordant230Th and 231Pa ages but values of initiald234U different from the modern marine value, this couldindicate a different initiald234U value for past seawater, orsuggest a type of diagenesis which resulted in the234U changewithout disturbing the230Th and231Pa ages, for example, early234U input or 231Pa, 230Th, and 234U input in just the rightproportions (Figs. 9 and 10).
When a single sample has discordant230Th and231Pa ages,it can generally be considered to have experienced open-systembehavior (assuming no significant initial230Th and231Pa). Toprovide some constraints on its true age, a [231Pa/235U] vs.[230Th/234U] diagram might be used in an effort to reduce theeffects of disturbedd234U values. If the isotopic compositionlies above the concordia curve in a [231Pa/235U] vs. [230Th/
234U] diagram, it is likely that the dominant diagenetic processwas U loss or gain of both230Th and 231Pa. If the isotopiccomposition lies below the concordia curve, then U gain or lossof both 230Th and231Pa is probable (Figs. 12Fig. 10). In theformer case, its true age will be younger than its apparent230Thand 231Pa ages. In the later case, its true age will be older.231Pa/230Th ages should be closest to the true age in such cases.
The use of U-Th-Pa systematics can also provide checks onthe LU or EU models, important to many tooth and bone datingstudies relating to archaeology. When the true age is greaterthan 20 ka, in the LU model, the measured data should liebelow the concordia curve. Thus, this approach can be used tocheck the veracity of model231Pa and230Th ages based ondifferent assumed modes of U uptake. Furthermore, such datamay be useful in establishing constraints on U uptake historiesfor specific samples that have aged in particular diageneticenvironments. Using these sample specific constraints on Uuptake, it may then be possible to constrain the true age of suchan open-system material.
As noted, the use of concordia diagrams has been a uniquestrength of U-Pb dating. A single discordant U-Pb date is notvery meaningful, instead, the upper intercept point of a series ofsamples becomes important for an age determination. A similarapproach can be used in the U-Th-Pa dating of discordantsamples. For example, a suite of samples of the same age (forexample, corals from the same terrace and location) can be usedto provide a series of points for a concordia diagram. If thesesamples experienced different degrees of one of the diageneticprocesses described by the above models, the data will fall
Fig. 14. Plots ofd234U vs. [231Pa/235U] (a) andd234U vs. [230Th/238U] (b) for the last interglacial samples. The symbolsare as same as in Figs. 10 and 13. Best fit lines are y5 428.9x2283.9 and y5 396.0x2192.3 in diagrams a and b,respectively. The best-fit lines intersect the concordia curves (d234U 5 150) at an ages of 116 ka (diagram a) and 121 ka(diagram b). We consider both of these age estimates to be less reliable than the estimate from Fig. 13b because (1) datapoints in both plots lie off of a best-fit line, and (2) the error in age due to uncertainty in initiald234U is significant in bothplots.
3450 H. Cheng et al.

along a straight line or a curve that is very close to a straightline near the upper intercept, in a concordia diagram. The upperintercept will be the true crystallization age.
Acknowledgments—We thank J. A. Hoff for discussions on this re-search. This work was supported by NSF grants OCE-9402693, OCE-9500647, EAR-9512334, EAR-9406183, and EAR-9702137 to RLE,the Donors of the Petroleum Research Fund, administered by theAmerican Chemical Society, and a grant to MTM from the GeosciencesResearch Program, Office of Basic Energy Sciences, U.S. Departmentof Energy.
REFERENCES
Allegre M. C. (1964) De l’extension de la me´thode de calcul graphiqueConcordia aux mesures d’aˆges absolus effectue´s a l’aide du dese-quilibre radioactif. Cas des mine´ralisations secondaires d’uranium.Note (*) de.C. R. Acad. Sci. Paris, 259,408624089.
Bard E., Hamelin B., and Fairbanks R. G. (1990a) U/Th ages obtainedby mass spectrometry in corals from Barbados: Sea level during last130,000 years.Nature346,4562458.
Bard E., Hamelin B., Fairbanks R. G., and Zindler A. (1990b) Cali-bration of the14C time-scale over the past 30,000 years using massspectrometric U-Th ages from Barbados corals.Nature 31,4052409.
Bard E., Fairbanks R. G., Hamelin B., Zindler A., and Hoang C. T.(1991) Uranium-234 anomalies in corals older than 150,000 years.Geochim. Cosmochim. Acta55, 228522390.
Barnes J. W., Lang E. J., and Potratz H. A. (1956) The ratio of ioniumto uranium in coral limestone.Science124,1752176.
Birch G. F., Thomson J., McArthur J. M., and Burnett W. C. (1983)Pleistocene phosphorites off the west coast of South Africa.Nature302,6012603.
Broecker W. S. and Thurber D. L. (1965) Uranium series dating ofcorals and oolites from Bahaman and Florida Key limestones.Sci-ence149,58260.
Burnett W. C. and Kim K. H. (1986) Comparison of radiocarbon anduranium-series dating methods as applied to marine apatite.Quat.Res. 25, 3692379.
Chen J. H., Edwards R. L., and Wasserburg G. J. (1986)238U, 234U and232Th in seawater.Earth Planet. Sci. Lett. 80, 2412251.
Chen J. H., Curran H. A., White B., and Wasserburg G. J. (1991)Precise chronology of the last interglacial period234U-230Th datafrom fossil coral reefs in the Bahamas.Geol. Soc. Amer. Bull. 103,82297.
Chen T., Yang Q., and Wu E. (1994) Antiquity of Homo sapiens inChina.Nature368,55256.
Cheng H., Edwards R. L., Murrell M. T., and Goldstein S. J. (1996)Pa-231 Dating of Carbonates Using TIMS Techniques.EOS Trans.AGU, 1996 Spring Meeting, S168.
Cheng H., Edwards R. L., and Wang Y. (1997) U/Th and U/Pa datingof Nanjing Man.EOS Trans. AGU,1997 Fall Meeting, F787.
De Bievre P. et al. (1971) The half-life of U-234. InProc. Intl. Conf.Chem. Nucl. Data, Measurement and Applications, Canterbury(ed.M. L. Hurrell), pp. 2212225. Inst. Civil Eng.
Edwards R. L. (1988) High precision thorium-230 ages of corals andthe timing of sea level fluctuations in the late Quaternary.Ph.Dthesis,California Institute of Technology.
Edwards R. L., Chen J. H., and Wasserburg G. J. (1987a)238U-234U-230Th-232Th systematics and the precise measurement of time overthe past 500,000 y.Earth Planet. Sci. Lett.. 81, 1752192.
Edwards R. L., Chen J. H., Ku T.-L., and Wasserburg G. J. (1987b)Precise timing of the last inter-glacial period from mass spectromet-ric analysis of230Th in corals.Science236,154721553.
Edwards R. L., Taylor F. W., and Wasserburg G. J. (1988) Datingearthquakes with high precision thorium-230 ages of very youngcorals.Earth Planet. Sci. Lett. 90, 3712381.
Edwards R. L. et al. (1993) A Large Drop in Atmospheric14C/12C andReduced Melting in the Younger Dryas, Documented with230ThAges of Corals.Science260,9622968.
Edwards R. L., Cheng H., Murrell M. T., and Goldstein S. J. (1997)
Protactinium-231 dating of carbonates by thermal ionization massspectrometry: Implications for Quaternary climate change.Science276,7822786.
Gallup C. D., Edwards R. L., and Johnson R. G. (1994) The timing ofhigh sea levels over the past 200,000 years.Science263,7962800.
Gascoyne M. (1992) Geochemistry of The Actinides And Their Daugh-ters. InUranium-series Disequilibrium: Applications to Earth, Ma-rine, and Environmental Sciences(ed. M. Ivanovich and R. S.Harmon), pp. 34261. Clarendon Press.
Goldstein S. J., Murrell M. T., Lea D., Chakraborty S., and KashgarianM. (1996) 231Pa and230Th dating of deep sea coral.EOS Trans.AGU, 1996 Spring Meeting, F291.
Grun R. and McDermott F. (1994) Open-system modeling for U-seriesand ESR dating of teeth.Quat. Geochronol. Quat. Sci. Rev.3,1212125.
Grun R., Schwarcz H. P., and Chadam J. M. (1988) ESR dating of toothenamel, Coupled correction for U-uptake and U-series disequilib-rium. Nuclear Tracks14, 2372241.
Hamelin B., Bard E., Zindler A., and Fairbanks R. G. (1991)234U/238Umass spectrometry of corals: How accurate is the U-Th age of thelast interglacial period?Earth Planet. Sci. Lett. 106,1692180.
Henderson G. M., Cohen A. S., and O’Nions R. K. (1993)234U/238Uratios and230Th ages for Hateruma Atoll corals: Implications forcoral diagenesis and seawater234U/238U ratios. Earth Planet. Sci.Lett. 115,65273.
Holden P., Lundstrom C. C., Zachos J., and Jacobson A. D. (1996)Combined234U-230Th and235U-231Pa dating of a central Californiaspeleothems: implications for improved temporal resolution in pa-leoclimatology.EOS Trans. AGU,1996 Spring Meeting, F384.
Ikeya M. (1982) A model of linear uranium accumulation for ESR ageof Heidelberg, Mauer and Tautavel bones.Japanese J. Appl. Phys.21, L6902L692.
Ivanovich M. and Harmon R. S. ed. (1992)Uranium Series Disequi-librium: Applications to Earth, Marine, and Environmental Sci-ences. 2nd ed. Oxford Univ. Press.
Kaufman A. and Broecker W. S. (1965) Comparison of230Th and14Cages for carbonate materials from Lakes Lahontan and Bonneville.J.Geophys. Res. 70, 403924054.
Kaufman A., Broecker W. S., Ku T.-L., and Thurber D. L. (1971) Thestatus of U-series methods of mollusk dating.Geochim. Cosmochim.Acta 35, 11552 1183.
Kaufman A. and Ku T.-L. (1989) The U-series ages of carnotites andimplications regarding their formation.Geochim. Cosmochim. Acta53, 267522681.
Kaufman A., Ku T.-L., and Luo S. (1995) Uranium-series dating ofcarnotites: Concordance between Th-230 and Pa-231 ages.Chem.Geol.120,1752181.
Ku T.-L. (1968) Protactinium-231 method of dating coral from Barba-dos Island.J. Geophys. Res. 73, 227122276.
Ku T.-L. (1982) Progress and Perspectives. InUranium-series Disequi-librium: Applications to Earth, Marine, and Environmental Sciences(ed. M. Ivanovich and R. S. Harmon), pp. 3972506. ClarendonPress.
Ku T.-L., Kimmel M. A., Easton W. H., and O’Neil T. J. (1974)Eustatic sea level 120,000 years ago on Oahu Hawaii.Science183,9592962.
Ku T.-L., Bull W. E., Freeman S. T., and Knauss K. G. (1979)230Th/234U dating of pedogenic carbonates in gravelly deserts ofVidal Valley, Southwestern California.Bull. Geol. Soc. Amer. 90,106321073.
Ku T.-L., Ivanovich M., and Luo S. (1990) U-series Dating of LastInterglacial High Sea Stands: Barbados Revisited.Quat. Res. 33,1292147.
Lounsbury M. and Durham R. W. (1971) The alpha half-life of U-234.In Proc. Intl. Conf. Chem. Nucl. Data, Measurement and Applica-tions, Canterbury(ed. M. L. Hurrell), pp. 2152219. Inst. Civil Eng.
Ludwig K. R. et al. (1992) Mass-Spectrometric230Th-234U-238U Datingof the Devils Hole Calcite Vein.Science258,2842287.
Meadows J. W., Armani R. J., Callis E. L., and Essling A. M. (1980)Half-life of 230Th. Phys. Rev. C 22, 7502754.
Min G. R., Edwards R. L., Taylor F. W., Recy J., Gallup C. D., andBeck J. W. (1995) Annual cycles of U/Ca in corals and U/Cathermometry.Geochim. Cosmochim. Acta59, 202522042.
3451U-Th-Pa dating
Nicolaysen L. O. (1957) Solid diffusion in radioactive minerals and themeasurement of the absolute age.Geochim. Cosmochim. Acta11,41259.
O’Brien G. W., Veeh H. H., Cullen D. J., and Milnes A. R. (1986)Uranium-series isotopic studies of marine phosphorites and associ-ated sediment from the East Australian continental margin.EarthPlanet. Sci. Lett. 80, 19235.
Pickett D. A. and Murrell M. T. (1997) Observations of231Pa Disequi-librium in Volcanic Rocks.Earth Planet. Sci. Lett. 148,2592271.
Pickett D. A., Murrell M. T., and Williams R. W. (1994) Determinationof Femtogram Quantities of Protactinium in Geologic Samples byThermal Ionization Mass Spectrometry.Anal. Chem. 66,104421049.
Robert J., Miranda C. F., and Muxart R. (1969) Mesure de la pe´riodedu protactinium-231 par microcalorime´trie. Radiochim. Acta11,1042108.
Roe K. K. Burnett W., Kim K. H., and Beers M. J. (1982) Excessprotactinium in phosphate nodules from as coastal upwelling zone.Earth Planet. Sci. Lett. 60, 39246.
Rosholt N. J. (1967) Open system model for uranium-series dating ofPleistocene samples. Radioactive Dating Methods Low-LevelCounting, Proc. Symp. Monaco, IAEA. Proc. Ser. Publ., SM-87/50.
Sackett W. M. (1958) Ionium-uranium ratios in marine depositedcalcium carbonates and related materials. Ph.D. Thesis, WashingtonUniv.
Sakanoue M., Konishi K., and Komura K. (1967) Stepwise determi-nations of thorium, protactinium, and uranium isotopes and theirapplications in geochronological studies, in: Radioactive DatingMethods Low-Level Counting, Proc. Symp. Monaco, IAEA. Proc.Ser. Publ., SM287/28.
Schwarcz H. P. (1980) Absolute age determination of archaeological
sites by uranium series dating of travertines.Archaeometry22,3224.
Stein M. et al. (1993) TIMS U-series dating and stable isotopes of thelast interglacial event in Papua New Guinea.Geochim. Cosmochim.Acta 57, 254122554.
Swisher III C. C. et al. (1996) Latest home erectus of Java: Potentialcontemporaneity with home sapiens in Southeast Asia.Science274,187021874.
Szabo B. J. (1979)230Th, 231Pa and open system dating of fossil coralsand shells. J. Geophys. Res.84, 492724930.
Szabo B. J. and Rosholt J. N. (1969) Uranium-Series Dating of Pleis-tocene Molluscan Shell from Southern California-An open-systemModel. J. Geophys. Res. 74, 325323260.
Szabo B. J. and Vedder J. D. (1971) U-series dating of some Pleisto-cene marine deposits in Southern California.Earth Planet. Sci. Lett.11, 2832290.
Thurber D. L., Broecker W. S. Blanchard R. L., and Potratz H. A.(1965) Uranium-series ages of pacific atoll coral.Science149,55258.
Tilton G. R. (1960) Volume diffusion as a mechanism for discordantlead ages.J. Geophys. Res. 65, 293322945.
Veeh H. H. (1982) Concordant230Th and231Pa ages of marine phos-phorites.Earth Planet. Sci. Lett. 57, 2782284.
Veeh H. H. and France R. E. (1988) Uranium-Series Ages of Coralsand Coexisting Phosphate Deposits on Pelsaert Reef Complex, Hout-man-Abrolhos Islands, Western Australia.Quat. Res. 30, 2042209.
Wasserburg G. J. (1963) Diffusion processes in lead-uranium systems.J. Geophys. Res. 68, 482324846.
Wetherill G. S. (1956a) An interpretation of the Rhodesia and Witwa-tersrand age patterns.Geochim. Cosmochim. Acta9, 2902292.
Wetherill G. S. (1956b) Discordant U-lead ages. I.Trans. Amer.Geophys. Union37, 3202326.
3452 H. Cheng et al.