Embed Size (px)
Citation preview
Impact Evaluation of the Massachusetts Upstream Lighting Program FINAL REPORT
Massachusetts Energy Efficiency Program Administrators Massachusetts Energy Efficiency Advisory Council Prepared by KEMA, Inc. February 19, 2014

Table of Contents
KEMA, Inc. February 19, 2014 i
1. Executive Summary ........................................................................................................................... 1-1 1.1 Introduction ............................................................................................................................. 1-1
1.1.1 Program Description ................................................................................................... 1-1 1.1.2 Purpose of Study ......................................................................................................... 1-1 1.1.3 Scope .......................................................................................................................... 1-3
1.2 Results ..................................................................................................................................... 1-3 1.2.1 LED Results ................................................................................................................ 1-3 1.2.2 Fluorescent Results ..................................................................................................... 1-4 1.2.3 Program Observations and Savings Adjustments ....................................................... 1-6
1.3 Conclusions and Recommendations ........................................................................................ 1-8 1.3.1 LED Savings Assumptions ......................................................................................... 1-8 1.3.2 Fluorescent Savings Assumptions .............................................................................. 1-9 1.3.3 Program Tracking Documentation ........................................................................... 1-10 1.3.4 Future Impact Evaluation ......................................................................................... 1-10
2. Introduction ...................................................................................................................................... 2-12 2.1 Program Description .............................................................................................................. 2-12 2.2 Purpose of Study .................................................................................................................... 2-12 2.3 Scope ..................................................................................................................................... 2-14
3. Evaluation Approach ........................................................................................................................ 3-15 3.1 Preliminary Sampling Strategy for the Impact Evaluation .................................................... 3-15
3.1.1 Determining the Customer Sample Frame ............................................................... 3-15 3.2 Initial Sample Design ............................................................................................................ 3-16 3.3 Customer Recruitment and Sample Re-Design ..................................................................... 3-17 3.4 Final Sample .......................................................................................................................... 3-19 3.5 Measurement, Verification and Analysis Methodology ........................................................ 3-20
3.5.1 Verification ............................................................................................................... 3-20 3.5.2 Monitoring ................................................................................................................ 3-21 3.5.3 Site Analysis ............................................................................................................. 3-21 3.5.4 HVAC Interactive Effects......................................................................................... 3-22
4. Results .............................................................................................................................................. 4-23 4.1 LED Results ........................................................................................................................... 4-25 4.2 Fluorescent Results ................................................................................................................ 4-27 4.3 Combined Results .................................................................................................................. 4-30 4.4 Outliers .................................................................................................................................. 4-31 4.5 Program Observations and Savings Adjustments .................................................................. 4-33
4.5.1 Installation Rate ........................................................................................................ 4-33 4.5.2 Delta Watts ............................................................................................................... 4-34

Table of Contents
KEMA, Inc. February 19, 2014 ii
4.5.3 Hours of Use ............................................................................................................. 4-34 5. Conclusions and Recommendations ................................................................................................ 5-34
5.1 LED Savings Assumptions .................................................................................................... 5-35 5.2 Fluorescent Savings Assumptions ......................................................................................... 5-36 5.3 Program Tracking Documentation ........................................................................................ 5-36 5.4 Future Impact Evaluation ...................................................................................................... 5-37
A. Description of Results and Factors ................................................................................................... A-1 A.1 Realization Rates .................................................................................................................... A-1 A.2 Savings Factors ....................................................................................................................... A-1
B. Site Level Results .............................................................................................................................. B-4 B.1 LED B-4 B.2 Fluorescent ............................................................................................................................ B-10
C. Site Summaries ............................................................................................................................... C-12 D. Post-Report Analysis of Lighting Distributor/Contractor Interviews, Final Revised MemorandumD-36
D.1 Background ........................................................................................................................... D-36 D.2 The Scope of the Post-Analysis ............................................................................................ D-36 D.3 Findings ................................................................................................................................ D-37
List of Exhibits
Table 1: Summary of LED Energy Realization Rate ................................................................................. 1-3 Table 2: Summary of LED Savings Factors .............................................................................................. 1-4 Table 3: Summary of Fluorescent Energy Realization Rate ...................................................................... 1-5 Table 4: Summary of Fluorescent Savings Factors.................................................................................... 1-6 Table 5: Building Type .............................................................................................................................. 1-7 Table 6: Per Lamp Savings Assumptions by Product Type ..................................................................... 3-16 Table 7: Distribution of Upstream Lighting Projects by Product Group ................................................. 3-16 Table 8: Population for Impact Evaluation .............................................................................................. 3-17 Table 9: Proposed Sample Design for Impact Evaluation ....................................................................... 3-17 Table 10: Anticipated Precisions for Impact Evaluation ......................................................................... 3-17 Table 11: Additional Per Lamp Savings Assumptions by Type .............................................................. 3-18 Table 12: Phase II Population .................................................................................................................. 3-18 Table 13: Phase II Sample Design ........................................................................................................... 3-19 Table 14: Combined Population Phase I + Phase II ................................................................................. 3-19 Table 15: Combined Sample Phase I + Phase II ...................................................................................... 3-19 Table 16: General Heating and Cooling COP Assumptions .................................................................... 3-22
Table of Contents
KEMA, Inc. February 19, 2014 iii
Table 17: Summary of LED Energy Realization Rate ............................................................................. 4-26 Table 18: Summary of LED Savings Factors .......................................................................................... 4-27 Table 19: Summary of Fluorescent Energy Realization Rate .................................................................. 4-28 Table 20: Summary of Fluorescent Savings Factors................................................................................ 4-29 Table 21: Summary of Combined Energy Realization Rate .................................................................... 4-30 Table 22: Summary of Combined Savings Factors ................................................................................. 4-31 Table 23: Building Type .......................................................................................................................... 4-33 Table 24: Summary of Results and Factors .............................................................................................. A-3 Table 25: LED Tracking and Evaluation Savings Estimates ................................................................... B-4 Table 26: LED Realization Rates and Reasons for Discrepancies ............................................................ B-7 Table 27: Fluorescent Tracking and Evaluation Savings Estimates ....................................................... B-10 Table 28: Fluorescent Realization Rates and Reasons for Discrepancies ............................................... B-11 Table 29: LEDs as Percent of Floodlight Sales by State ........................................................................ D-40 Figure 1: Scatter Plot of Evaluation Results for Systems for Annual MWh Savings .............................. 4-25 Figure 2: Scatter Plot of Evaluation Results for Fluorescents for Annual MWh Savings ....................... 4-28 Figure 3: Standard Deviation and Tolerance Intervals ............................................................................ 4-32 Figure 1: LEDs as Percent of Floodlight Sales by State ......................................................................... D-39 Figure 2: Participating Lighting Distributor 2012 LED Sales, Program vs. Non-Program .................... D-42 Figure 3: Why Participating Lighting Distributors Did Not Sell All LED Bulbs Through Program ..... D-43 Figure 4: LED Floodlight/Spotlight Market Penetration Over Time ...................................................... D-44 Figure 5: Factors Influencing LED Floodlight/Spotlight Market Penetration Over Time ...................... D-45
DNV KEMA Energy & Sustainability
KEMA, Inc. February 19, 2014 1-1
1. Executive Summary
1.1 Introduction
This report documents DNV KEMA’s impact evaluation of the Massachusetts Upstream Lighting Program, which is known as the Bright Opportunities Program. This impact evaluation was performed by DNV KEMA under the Massachusetts Large C&I Evaluation Contract (MA-LCIEC). This report represents the impact component of a broader evaluation effort, which also included a process evaluation completed in June 20131. This impact evaluation was completed for the Massachusetts electric Program Administrators (PA) under the guidance of the Massachusetts Energy Efficiency Advisory Council (EEAC).
1.1.1 Program Description
The Massachusetts Bright Opportunities Program is a program which attempts to increase the market penetration of energy-efficient lighting technologies through the use of upstream incentives that are used to buy down the cost of these lighting technologies at the lighting distributor level. All five electric PAs in the state are participating in the program. The program began offering upstream incentives on linear fluorescent lighting technologies in September 2011 and incentives for LED lighting technologies in November 2011. In the case of the LED lighting technologies the upstream incentives take the place of the downstream incentives that the Massachusetts C&I programs previously offered for these technologies.
The lighting distributors who participate in the program are obligated to collect sales data on the type and quantity of lamps they sold, as well as the name, location, and contact information of the customers to whom they sold the discounted lighting products. Every month the distributors submit their sales data to the Massachusetts electric PAs and to a third-party program manager. This third-party program manager combines the sales data from the various participating distributors and then allocates the energy savings and incentives to each participating PA. They then issue invoices to each PA for that particular month. The program also conducts quality control inspections for about 10 percent of the sites to make sure that they can verify on-site the lighting quantities and types claimed in the distributor sales reports.
1.1.2 Purpose of Study
The research objectives of the impact evaluation for the Upstream Lighting Program include updating the following assumptions with Massachusetts-specific research: 1 Process Evaluation of the 2012 Bright Opportunities Program, Final Report, June 14, 2013, Prepared by DNV KEMA. A post-analysis of the process evaluation was completed in August, 2013 following the finalization of the process evaluation report. This analysis is included in this report in Appendix D.

DNV KEMA Energy & Sustainability
KEMA, Inc. February 19, 2014 1-2
Application of purchased lamps by facility and space type;
Hours of use of purchased lamps;
Baseline replaced lamps for estimating delta watts;
Gross savings realization rates to be applied to 2012 results; and
Estimates of delta watts and hours of use to be applied prospectively.
This report presents the following realization rates at the statewide level using metered data collected from each site:
Annual KWh – This result is the gross annual kWh realization rate including additional savings due to HVAC interactive effects. This realization rate is the evaluation gross annual kWh savings divided by the tracking gross annual kWh savings.
Connected KW – This result is the gross connected kW realization rate, which includes any documentation, quantity, and technology adjustments. This realization rate is the evaluation gross connected kW savings divided by the tracking gross connected kW savings.
Connected kWh – This result is the gross connected kWh realization rate, which includes only the documentation, quantity, and technology adjustments. This realization rate is the evaluation gross connected kWh savings divided by the tracking gross connected kWh savings.
Installation Rate – This represents the percentage of the tracking connected kW savings based on the quantity of installed lamps found during the on-site evaluation. This rate is embedded in the Annual KWh, Connected KW, and Connected kWh realization rates above.
Delta Watts – This result represents the percentage of the tracking connected kW savings based on the difference in the delta watts (pre minus post installation wattage) as found during the on-site evaluation. This rate is embedded in the Annual KWh, Connected KW, and Connected kWh realization rates above.
Hours of Use – This result is the hours of use realization rate, which represents the evaluation estimate of hours of use divided by the tracking estimate of hours of use. This rate is embedded in the Annual kWh realization rate above.
The evaluation sample for this study was designed in consideration of the 90% confidence level for energy (kWh) and on-peak and seasonal demand savings.
DNV KEMA Energy & Sustainability
KEMA, Inc. February 19, 2014 1-3
1.1.3 Scope
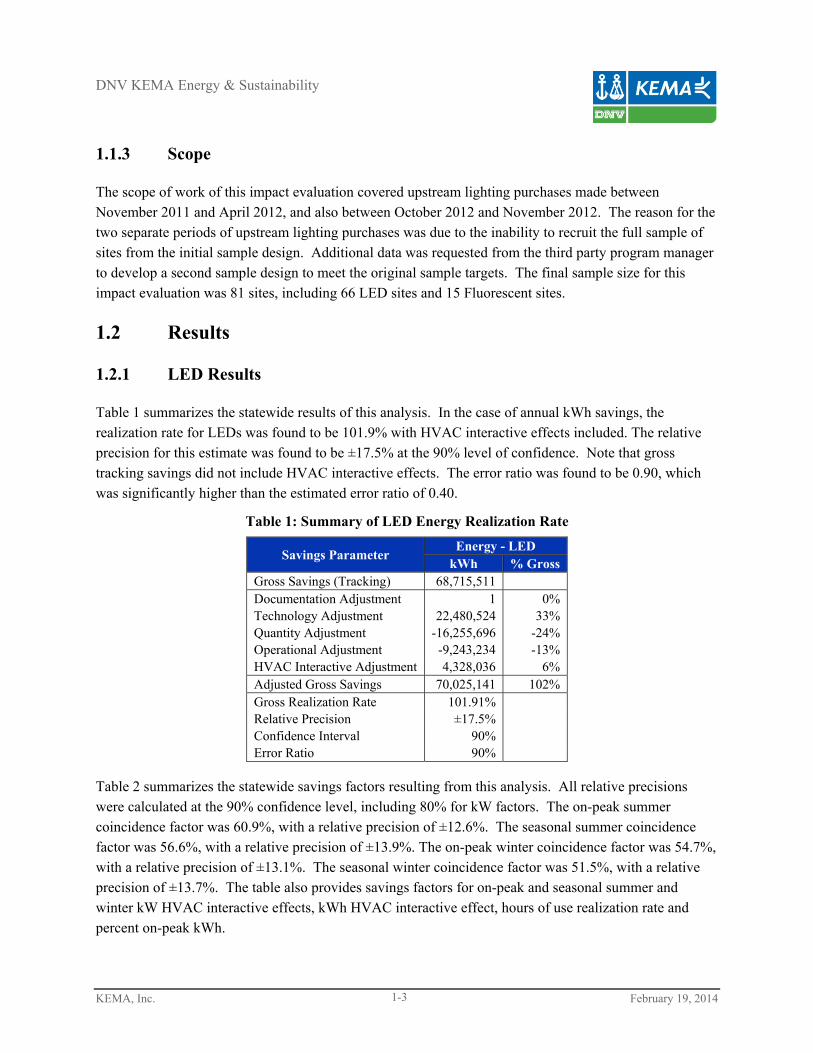
The scope of work of this impact evaluation covered upstream lighting purchases made between November 2011 and April 2012, and also between October 2012 and November 2012. The reason for the two separate periods of upstream lighting purchases was due to the inability to recruit the full sample of sites from the initial sample design. Additional data was requested from the third party program manager to develop a second sample design to meet the original sample targets. The final sample size for this impact evaluation was 81 sites, including 66 LED sites and 15 Fluorescent sites.
1.2 Results
1.2.1 LED Results
Table 1 summarizes the statewide results of this analysis. In the case of annual kWh savings, the realization rate for LEDs was found to be 101.9% with HVAC interactive effects included. The relative precision for this estimate was found to be ±17.5% at the 90% level of confidence. Note that gross tracking savings did not include HVAC interactive effects. The error ratio was found to be 0.90, which was significantly higher than the estimated error ratio of 0.40.
Table 1: Summary of LED Energy Realization Rate
Savings Parameter Energy - LED
kWh % Gross Gross Savings (Tracking) 68,715,511 Documentation Adjustment 1 0% Technology Adjustment 22,480,524 33% Quantity Adjustment -16,255,696 -24% Operational Adjustment -9,243,234 -13% HVAC Interactive Adjustment 4,328,036 6% Adjusted Gross Savings 70,025,141 102% Gross Realization Rate 101.91% Relative Precision ±17.5% Confidence Interval 90% Error Ratio 90%
Table 2 summarizes the statewide savings factors resulting from this analysis. All relative precisions were calculated at the 90% confidence level, including 80% for kW factors. The on-peak summer coincidence factor was 60.9%, with a relative precision of ±12.6%. The seasonal summer coincidence factor was 56.6%, with a relative precision of ±13.9%. The on-peak winter coincidence factor was 54.7%, with a relative precision of ±13.1%. The seasonal winter coincidence factor was 51.5%, with a relative precision of ±13.7%. The table also provides savings factors for on-peak and seasonal summer and winter kW HVAC interactive effects, kWh HVAC interactive effect, hours of use realization rate and percent on-peak kWh.

DNV KEMA Energy & Sustainability
KEMA, Inc. February 19, 2014 1-4
Table 2: Summary of LED Savings Factors
Savings Factors and Realization Rates
LED
Value Precision at 90% Confidence
Precision at 80% Confidence
Installation Rate (Quantity Adjustment - kW) 82.1% ±8.7% ±6.8%
Delta Watts (Technology Adjustment - kW) 133.2% ±8.5% ±6.6%
Connected kW Realization Rate2 109.4% ±13.2% ±10.3%
Summer Coincidence Factor
On Peak Hours 60.9% ±12.6% ±9.8%
Seasonal Hours 56.6% ±13.9% ±10.8%
Winter Coincidence Factor
On Peak Hours 54.7% ±13.1% ±10.2%
Seasonal Hours 51.5% ±13.7% ±10.7%
Summer kW HVAC Interactive Effect
On Peak Hours 119.8% ±2.0% ±1.6%
Seasonal Hours 120.2% ±2.1% ±1.6%
Winter kW HVAC Interactive Effect
On Peak Hours 96.6% ±4.1% ±3.2%
Seasonal Hours 97.0% ±3.3% ±2.6%
KWh Factors (Precisions at 90% confidence)
Connected kWh Realization Rate 109.1% ±13.3%
KWh HVAC Interactive Effect 106.6% ±1.8%
Hours of Use Realization Rate 87.7% ±14.0%
% On Peak KWh 59.2% ±5.1%
Non-Electric
Heating HVAC Interaction Effect (MMBtu/kWh)
-0.00112
1.2.2 Fluorescent Results
Table 3 summarizes the statewide results of this analysis. In the case of annual kWh savings, the realization rate for Fluorescent lamps was found to be 89.1% with HVAC interactive effects included. The relative precision for this estimate was found to be ±26.9% at the 90% level of confidence. The error ratio was found to be 0.62.
2 The Connected kW Realization Rate is the product of the Documentation Adjustment, Installation Rate and Delta Watts factors.

DNV KEMA Energy & Sustainability
KEMA, Inc. February 19, 2014 1-5
Table 3: Summary of Fluorescent Energy Realization Rate
Savings Parameter Energy - FLR
kWh %
Gross Gross Savings (Tracking) 23,600,503 Documentation Adjustment 0 0% Technology Adjustment 6,783 0% Quantity Adjustment -4,644,999 -20% Operational Adjustment 563,107 2% HVAC Interactive Adjustment 1,494,622 6% Adjusted Gross Savings 21,020,016 89% Gross Realization Rate 89.07% Relative Precision ±26.9% Confidence Interval 90% Error Ratio 62%
Table 4 summarizes the statewide savings factors resulting from this analysis. All relative precisions were calculated at the 90% confidence level, including 80% for kW factors. The on-peak summer coincidence factor was 66.2%, with a relative precision of ±21.0%. The seasonal summer coincidence factor was 59.3%, with a relative precision of ±24.2%. The on-peak winter coincidence factor was 51.4%, with a relative precision of ±22.1%. The seasonal winter coincidence factor was 45.9%, with a relative precision of ±20.9%. The table also provides savings factors for on-peak and seasonal summer and winter kW HVAC interactive effects, kWh HVAC interactive effect, hours of use realization rate and percent on-peak kWh.

DNV KEMA Energy & Sustainability
KEMA, Inc. February 19, 2014 1-6
Table 4: Summary of Fluorescent Savings Factors
Savings Factors and Realization Rates
FLR
Value Precision at 90% Confidence
Precision at 80% Confidence
Installation Rate (Quantity Adjustment - kW) 80.3% ±13.1% ±10.2%
Delta Watts (Technology Adjustment - kW) 100.0% ±0.1% ±0.1%
Connected kW Realization Rate3 80.3% ±13.1% ±10.2%
Summer Coincidence Factor
On Peak Hours 66.2% ±21.0% ±16.4%
Seasonal Hours 59.3% ±24.2% ±18.9%
Winter Coincidence Factor
On Peak Hours 51.4% ±22.1% ±17.2%
Seasonal Hours 45.9% ±20.9% ±16.3%
Summer kW HVAC Interactive Effect
On Peak Hours 118.9% ±5.0% ±3.9%
Seasonal Hours 119.2% ±5.2% ±4.0%
Winter kW HVAC Interactive Effect
On Peak Hours 100.0% ±0.0% ±0.0%
Seasonal Hours 100.0% ±0.0% ±0.0%
KWh Factors (Precisions at 90% confidence) Connected kWh Realization Rate 80.3% ±13.1% KWh HVAC Interactive Effect 107.7% ±2.4% Hours of Use Realization Rate 103.0% ±18.5% % On Peak KWh 71.0% ±5.8% Non-Electric
Heating HVAC Interaction Effect (MMBtu/kWh)
-0.00076
1.2.3 Program Observations and Savings Adjustments
One of the goals of the evaluation was to identify where the upstream lamps were being installed. The PAs and EEAC were interested to find out what types of buildings and space types that the lamps ended up in. Table 5 presents a list of building types where the upstream lighting purchases were installed. The building type with the most installations was School/University. This represented 28% of the entire sample, including 27% of the LED sample and 33% of the Fluorescent sample. In schools, LEDs were primarily installed in common areas such as corridors. The “Other” building type contained a mix of buildings that only had one or two sites in the sample. Additional prominent building types included Retail, Office, Hospital, Hotel, Religious Buildings and Multi-Family.
3 The Connected kW Realization Rate is the product of the Documentation Adjustment, Installation Rate and Delta Watts factors.

DNV KEMA Energy & Sustainability
KEMA, Inc. February 19, 2014 1-7
Table 5: Building Type
Building Type Fluorescent LED Total
School/University 5 18 23
Other 5 8 13
Retail 11 11
Office 2 8 10
Dining 6 6
Hospital/Healthcare 2 4 6
Hotel 5 5
Religious Building 4 4
Multi-Family 1 2 3
Total 15 66 81
1.2.3.1 Installation Rate
This evaluation found that approximately 82% of all purchased lamps were found to have been installed at the time of the on-site visits. LED and Fluorescent lamps had almost the same installation rates of 82% and 80%, respectively. These numbers represent the percentage of all lamps that were in operation at the time of the evaluation. In many cases, the missing lamps were identified in storage, and expected to be installed as other lamps burned out. In other situations, lamps were said to have been sent to a different location. When this occurred, evaluators attempted to verify these lamps by visiting these separate locations. However, they were not always identified as having been installed. In this evaluation, any lamps that were found in storage or not found at all were counted as zero in the installation rate calculation.
1.2.3.2 Delta Watts
The delta Watts factor was determined to be 123% for the overall impact evaluation. However, this was entirely driven by the LED category, which had a delta Watts factor of 133%. The Fluorescent category had a delta Watts factor of 100%. Delta Watts are defined as the pre-installation, or baseline wattage, minus the post-installation wattage. The factor represents the difference between the tracking delta Watts and the evaluation delta Watts as a percentage. For LED, this factor was mostly driven by the pre-existing or baseline wattages.
Tracking savings were based on an estimated baseline and installed wattage for each lamp type. These baseline wattages were developed by the PAs based on historical information, and manufacturer data. For LEDs, it was assumed that the baseline wattage would have been a mix of CFL and incandescent lamps corresponding to the installed LED lamp. To determine the pre-existing, or baseline wattage as part of this evaluation, engineers asked site personnel to identify what type and wattage bulb was there prior to the installation of the new lamps. In most cases, site personnel were very confident in their answers, were able to identify other sockets or fixtures that still had the “old” lamps installed, or still had some of the

DNV KEMA Energy & Sustainability
KEMA, Inc. February 19, 2014 1-8
older lamps in storage. The evaluation estimated savings based on these reported baseline wattages. One thing that the evaluation found was that there were very few cases where LEDs were replacing either existing LEDs or CFLs. The majority of the replaced lamps were incandescent/halogen lamps of higher wattage. The site summaries in Appendix C describe the findings at each of the sites.
1.2.3.3 Hours of Use
The overall hours of use realization rate was found to be 91% based on the monitoring of hours of use. The LED hours of use realization rate was 88%, while the Fluorescent hours of use realization rate was 108%. The differences in realization rates could be attributed to the tracking estimates of hours of use. LED hours of use were expected to be higher than Fluorescent hours of use based on the tracking savings estimates. The tracking estimates were based on PA assumptions regarding usage of each different lamp type. The majority of LED lamps were expected to operate 4,500 hours per year, while Fluorescent lamps were expected to operate 3,380 hours per year. The analysis found that the evaluated hours of use for LEDs were approximately 3,979 hours per year, and 3,559 hours of use for Fluorescent
1.3 Conclusions and Recommendations
Overall, the Bright Opportunities program appears to be successfully delivering energy savings, especially with respect to the LED category. LEDs were found to have a realization rate of 102%, which was driven by several adjustments. Fluorescents were found to have a realization rate of 89%, which was primarily driven by the quantity adjustment. Based on the results of this study, it is recommended that realization rates for connected kW and kWh, and adjusted savings estimates for hours of use should be applied at the category level (LED and FLR). This study does not have enough data points to disaggregate results at the building type or LED lamp type level with acceptable estimates of precision.
The following are some conclusions and recommendations for the program, and future evaluations of the program.
1.3.1 LED Savings Assumptions Delta Watts. This study produced an estimate of delta Watts that was approximately 33% higher
than tracking estimates. Almost this entire discrepancy was due to the finding that the baseline
bulbs/lamps were of higher wattage than the tracking estimates. The tracking estimates were
based on an assumption that there would be a mix of CFL and incandescent in the existing case.
However, it was found that the majority of the lamps that were replaced were incandescent, with
a very small percentage of CFL/LEDs. Additionally, as market penetration increases, the
replacement of CFL/LEDs likely increases, which will result in lower baseline wattages. A
follow-up evaluation should consider this shifting baseline as a factor in deciding when the next
one should take place. Note that the study connected kW and kWh realization rates include this

DNV KEMA Energy & Sustainability
KEMA, Inc. February 19, 2014 1-9
adjustment factor, so the adjustment factor should not be applied if the realization rates are being
used as recommended.
Quantity. This study found that approximately 82% of the purchased LED lamps were installed
at the time of the evaluation. It was common to find many of these not yet installed lamps in
storage at each of the facilities. Customers expect that they will eventually install each of these
bulbs as soon as their existing lamps burn out. It is unclear what the lag time will be for the
installation of these remaining lamps, and therefore, a follow-up study should be designed to
revisit sites from this study that had a large number of units still in storage or not yet installed.
Note that the study connected kW and kWh realization rates include this adjustment factor, so the
adjustment factor should not be applied if the realization rates are being used as recommended.
Hours of Use. This study found that the hours of use realization rate was 88% for LEDs. This is
a relatively low hours of use realization rate as compared to other lighting impact evaluations. As
mentioned above, the assumed hours of use for the majority of LED lamps was 4,500 hours per
year. Based on lighting logger data at each of the sites, the average hours of use for LED lamps
were found to be 3,979 hours per year. It is recommended that the hours of use be adjusted
downward to account for this finding for the near term. Note that the study connected kW and
connected kWh realization rates do not include this adjustment for hours, which means that
program savings estimates can be updated with the new hours estimates from this study.
1.3.2 Fluorescent Savings Assumptions Quantity. This study found that approximately 80% of the purchased Fluorescent lamps were
installed at the time of the evaluation. It was common to find many of these not yet installed
lamps in storage at each of the facilities. Customers expect that they will eventually install each
of these bulbs as soon as their existing lamps burn out. It is unclear what the lag time will be for
the installation of these remaining lamps, and therefore, a follow-up study should be designed to
revisit sites from this study that had a large number of units still in storage or not yet installed.
Note that the study connected kW and kWh realization rates include this adjustment factor, so the
adjustment factor should not be applied if the realization rates are being used as recommended.
Hours of Use. This study found that the hours of use realization rate was 103% for Fluorescent
lamps. This is in line with other impact evaluations of Fluorescent lighting systems. As
mentioned above, the assumed hours of use for the majority of Fluorescent lamps was 3,380
hours per year. Based on lighting logger data at each of the sites, the average hours of use for
Fluorescent lamps were found to be 3,559 hours per year. It is recommended that the hours of
use be adjusted downward to account for this finding for the near term. Note that the study
connected kW and connected kWh realization rates do not include this adjustment for hours,

DNV KEMA Energy & Sustainability
KEMA, Inc. February 19, 2014 1-10
which means that program savings estimates can be updated with the new hours estimates from
this study.
1.3.3 Program Tracking Documentation Consider Efforts to Increase the Customer’s Awareness of the Program. Many customers
were aware that they had received discounted lamps from this program, but not all were aware
that the discounts came from the PAs. Many customers were under the impression that their
electrical contractors were offering the deep discounts. It is recommended that the PAs consider
utilizing a program sticker or label that participating distributors would attach to a customers’
shipping/purchase order. This may help the program gain recognition and will help the end-users
recall the Upstream lighting purchases. It should not be overlooked how good the program
discounted LED bulbs make the electricians look to their customers. Their customers, in many
cases, know the longevity and energy savings of LED bulbs but they can’t come to purchasing
them at regular cost. For example, site L2796 is a restaurant that would not have paid full price
for the LED bulbs that were installed. The electricians who oversee the building dealt with the
program and the credit for the financial discount is lost. In some cases, it’s the electricians who
appear as though they are selling or giving the company (restaurant in this case) a great deal. The
managers at this site allowed us to conduct our study but at first they didn’t know the program
bulbs were offered by the utilities.
Consider Additional Supporting Information for Large Purchases. One of the major
discrepancies found during this evaluation was that in some cases, large quantities of lamps were
being stored for future use by end users. There are several sites, the most extreme being L1505,
in which evaluators identified pallets of program bulbs being stockpiled by customers. In the
case of L1505, which was a school district, the large quantity of bulbs was considered so that they
wouldn’t have to worry about purchasing replacement lamps for several years. It is
recommended that electrical contractors or end users be required to provide more information to
support extremely large purchases so that it would be more likely that the program bulbs are
installed earlier.
1.3.4 Future Impact Evaluation Consider a Follow-up Impact Evaluation. This impact evaluation provides important feedback
to the PAs for reporting savings, and improving savings estimates. However, due to the relatively
large error ratios found in this study, the targeted 90/10 precision was not achieved. Depending
on PA needs, a follow-up study may be considered to improve the evaluation results, or to obtain
statistically valid factors for some of the building types where a majority of LED and Fluorescent
lamps are being installed. The PAs and EEAC may want to consider performing a third phase of
impact evaluation, which could be designed in consideration of the error ratios that were found

DNV KEMA Energy & Sustainability
KEMA, Inc. February 19, 2014 1-11
with this study to try to achieve a combined 90/10 precision at the measure category, or targeted
at a measure category and building type. Alternatively, the PAs and EEAC may consider
following up on those sites with lower installation rates. Follow-up discussion and long-term
planning should take place to determine what the evaluation needs are on an ongoing basis, and
also what the target precision levels should be based on the needs of the PAs and EEAC.
DNV KEMA Energy & Sustainability
KEMA, Inc. February 19, 2014 2-12
2. Introduction
This report documents DNV KEMA’s impact evaluation of the Massachusetts Upstream Lighting Program, which is known as the Bright Opportunities Program. This impact evaluation was performed by DNV KEMA under the Massachusetts Large C&I Evaluation Contract (MA-LCIEC). This report represents the impact component of a broader evaluation effort, which also included a process evaluation completed in June 20134. This impact evaluation was completed for the Massachusetts electric Program Administrators (PA) under the guidance of the Massachusetts Energy Efficiency Advisory Council (EEAC).
2.1 Program Description
The Massachusetts Bright Opportunities Program is a program which attempts to increase the market penetration of energy-efficient lighting technologies through the use of upstream incentives that are used to buy down the cost of these lighting technologies at the lighting distributor level. All five electric PAs in the state are participating in the program. The program began offering upstream incentives on linear fluorescent lighting technologies in September 2011 and incentives for LED lighting technologies in November 2011. In the case of the LED lighting technologies the upstream incentives take the place of the downstream incentives that the Massachusetts C&I programs previously offered for these technologies.
The lighting distributors who participate in the program are obligated to collect sales data on the type and quantity of lamps they sold, as well as the name, location, and contact information of the customers to whom they sold the discounted lighting products. Every month the distributors submit their sales data to the Massachusetts electric PAs and to a third-party program manager. This third-party program manager combines the sales data from the various participating distributors and then allocates the energy savings and incentives to each participating PA. They then issue invoices to each PA for that particular month. The program also conducts quality control inspections for about 10 percent of the sites to make sure that they can verify on-site the lighting quantities and types claimed in the distributor sales reports.
2.2 Purpose of Study
The research objectives of the impact evaluation for the Upstream Lighting Program include updating the following assumptions with Massachusetts-specific research:
Application of purchased lamps by facility and space type;
4 Process Evaluation of the 2012 Bright Opportunities Program, Final Report, June 14, 2013, Prepared by DNV KEMA. A post-analysis of the process evaluation was completed in August, 2013 following the finalization of the process evaluation report. This analysis is included in this report in Appendix D.
DNV KEMA Energy & Sustainability
KEMA, Inc. February 19, 2014 2-13
Hours of use of purchased lamps;
Baseline replaced lamps for estimating delta watts;
Gross savings realization rates to be applied to 2012 results; and
Estimates of delta watts and hours of use to be applied prospectively.
This report presents the following realization rates at the statewide level using metered data collected from each site:
Annual KWh – This result is the gross annual kWh realization rate including additional savings due to HVAC interactive effects. This realization rate is the evaluation gross annual kWh savings divided by the tracking gross annual kWh savings.
Connected KW – This result is the gross connected kW realization rate, which includes any documentation, quantity, and technology adjustments. This realization rate is the evaluation gross connected kW savings divided by the tracking gross connected kW savings.
Connected kWh – This result is the gross connected kWh realization rate, which includes only the documentation, quantity, and technology adjustments. This realization rate is the evaluation gross connected kWh savings divided by the tracking gross connected kWh savings.
Installation Rate – This represents the percentage of the tracking connected kW savings based on the quantity of installed lamps found during the on-site evaluation. This rate is embedded in the Annual KWh, Connected KW, and Connected kWh realization rates above.
Delta Watts – This result represents the percentage of the tracking connected kW savings based on the difference in the delta watts (pre minus post installation wattage) as found during the on-site evaluation. This rate is embedded in the Annual KWh, Connected KW, and Connected kWh realization rates above.
Hours of Use – This result is the hours of use realization rate, which represents the evaluation estimate of hours of use divided by the tracking estimate of hours of use. This rate is embedded in the Annual kWh realization rate above.
This report also provides the following savings factors:
Summer Coincidence Factor
On Peak Hours –This is the percentage of the connected kW savings coincident with the summer on-peak period, as defined in Section 4.
DNV KEMA Energy & Sustainability
KEMA, Inc. February 19, 2014 2-14
Seasonal Hours –This is the percentage of the connected kW savings coincident with the summer seasonal peak period, as defined in Section 4.
Winter Coincidence Factor
On Peak Hours –This is the percentage of the connected kW savings coincident with the winter on-peak period, as defined in Section 4.
Seasonal Hours –This is the percentage of the connected kW savings coincident with the winter seasonal peak period, as defined in Section 4.
Summer kW HVAC Interactive Effect
On Peak Hours – This is the percentage of gross connected kW savings that are due to interactive effects during the summer on-peak period.
Seasonal Hours – This is the percentage of gross connected kW savings that are due to interactive effects during the summer seasonal peak period.
Winter kW HVAC Interactive Effect
On Peak Hours – This is the percentage of gross connected kW savings that are due to interactive effects during the winter on-peak period.
Seasonal Hours – This is the percentage of gross connected kW savings that are due to interactive effects during the winter seasonal peak period.
KWh HVAC Interactive Effect – This is the percentage of the gross kWh savings that are due to interactive effects.
% On Peak KWh – This is the percentage of energy savings that occur during on-peak hours.
A listing of all realization rates and savings factors with descriptions and algorithms is presented in Appendix A. The savings factors presented in this report are developed so that they may be applied to future program assumption updates.
The evaluation sample for this study was designed in consideration of the 90% confidence level for energy (kWh) and on-peak and seasonal demand savings.
2.3 Scope
The scope of work of this impact evaluation covered upstream lighting purchases made between November 2011 and April 2012, and also between October 2012 and November 2012. The reason for the
DNV KEMA Energy & Sustainability
KEMA, Inc. February 19, 2014 3-15
two separate periods of upstream lighting purchases was due to the inability to recruit the full sample of sites from the initial sample design. Additional data was requested from the third party program manager to develop a second sample design to meet the original sample targets. This is further explained in the sampling section below.
3. Evaluation Approach
3.1 Preliminary Sampling Strategy for the Impact Evaluation
The Upstream Lighting Program evaluation included both process and impact evaluations. The on-site sample for the impact evaluation was selected first, and then excluded from the sample frame for the process surveys.
One complication in the sampling strategy that we discovered after the submission of our initial work plan was that many of the companies that were listed in the program tracking database under the “Customer Installation Name” appeared to be lighting contractors rather than end use customers. In these cases we also checked a sample of the entries for “Customer Installation Address” and “Customer Installation City” on the Internet and found out that these street addresses and cities were those of the lighting contractors. While it is possible that these lighting contractors installed the discounted lighting products on their own premises, we think this is unlikely and that a more likely scenario is that they installed these lighting products at an end user address that is not captured by the program tracking database. So our strategy was to remove these lighting contractors from the end user sample frame. We did this by looking for words like “lighting” or “electric” in the company name. The population frame for the initial impact evaluation was the tracking data provided by a third party data collector. It includes customers who participated in the upstream lighting program between November 2011 and April 2012. For each purchase, some limited data were provided about the customers (whether end users or lighting contractors), distributors, manufacturers, as well as the quantity and type of product installed.
3.1.1 Determining the Customer Sample Frame
In May 2012 we were provided with program tracking data which covered the November 2011 to April 2012 period. We used these data to determine the sample frames discussed in this subsection. The Program data included information about the types and quantities of products installed, customer names and addresses, distributor names and addresses, and equipment manufacturers. The product types identified in the data were LEDs (MR16, PAR20, PAR30 and PAR38) and Fluorescents (T5 and T8). Since no estimates of savings were provided, standard formulas were applied to calculate annual kWh savings by product type and wattage. The per lamp savings estimates for each product type are presented

DNV KEMA Energy & Sustainability
KEMA, Inc. February 19, 2014 3-16
in Table 6. One of the goals of the impact evaluation was to produce new estimates of delta watts and hours of use.
Table 6: Per Lamp Savings Assumptions by Product Type
Product Type
Baseline Fixture Wattage
Baseline Ballast Factor
Baseline Wattage
Installed Fixture Wattage
Installed Ballast Factor
Installed Wattage
Delta Watts
Annual Hours
kWh Savings
T8 32 0.88 28 28 0.88 25 3.5 3,380 12 T5 54 1.00 54 50 1.00 50 4.0 3,380 14 PAR20 38 1.00 38 8 1.00 8 29.8 4,500 134 PAR30 55 1.00 55 15 1.00 15 40.4 4,500 182 PAR38 61 1.00 61 14 1.00 14 46.8 4,500 211 MR16 31 1.00 31 8 1.00 8 23.4 4,500 105
The sample frame for the impact evaluation was defined as unique rows for each customer location and product type. For purposes of designing and selecting the sample, the level of detail for product types was the two major groups: LEDs and Fluorescents. The tracking data were aggregated by customer name, address and group. The initial 6,343 records produced 3,365 unique combinations. However, we noticed that there were many instances where names and addresses were spelled, abbreviated, or punctuated differently, creating multiple records. Software tools and manual review reduced the number of unique combinations of name, address and product group to 3,077. After eliminating a few records where the sales quantity was less than or equal to zero, the number of records is 3,070. The distribution of savings and quantities installed across the product groups follows in Table 7.
Table 7: Distribution of Upstream Lighting Projects by Product Group
Product Group Savings (kWh)
% of Savings
Quantity Installed
% of Quantity Installed
Number of Customer Locations
% of Customer Locations
LED 37,478,740 93.21% 219,691 49.04% 2,513 81.86% Fluorescent 2,728,501 6.79% 228,295 50.96% 557 18.14%
Total 40,207,241 100.00% 447,986 100.00% 3,070 100.00%
3.2 Initial Sample Design
One of the goals of the impact evaluation was to estimate energy and peak demand realization rates and
other factors with 10% relative precision at a 90% confidence interval. In light of the fact that LEDs
make up such a large percentage of the program savings, it was most important that these results achieved the precision targets. Since fluorescents made up less than 7% of the total program savings, the 90/10 criteria was relaxed somewhat for that sample to 90/20.
The population for the impact evaluation included only the sites that had previously been identified as end use customers. Summary statistics about the population frame for the impact evaluation are provided in Table 8.

DNV KEMA Energy & Sustainability
KEMA, Inc. February 19, 2014 3-17
Table 8: Population for Impact Evaluation
Customer Group
Product Group Sites
Total KWh Savings
Average Savings Minimum Maximum StdDev CV
End User LED 2,407 36,430,888 15,135 105 631,688 35,681 2.36 End User Fluorescent 522 2,591,251 4,964 12 362,924 18,904 3.81
Total 2,929 39,022,139
In order to estimate the sample sizes required to produce estimates that meet the precision targets described above, we made an assumption about the level of variability in the results (error ratio). Other studies of lighting impact evaluations have found an error ratio of 0.4 to be realistic. The sample design was stratified by size, based on the total savings at each location, using Model-Based Statistical Sampling techniques. The process assigns a higher selection probability to larger installations to maximize the efficiency of the sample. After reviewing alternatives, the evaluation team decided on the sample design described in Table 9.
Table 9: Proposed Sample Design for Impact Evaluation
Product Group Stratum
Maximum KWh
Savings Sites Total KWh
Savings Sample Inclusion
Probability LED 1 7,796 1459 4,756,134 14 0.00960 2 15,171 493 5,950,855 14 0.02840
3 34,806 259 6,954,547 13 0.05019 4 85,497 141 8,120,784 13 0.09220 5 412,639 55 10,648,569 13 0.23636 Fluorescent 1 2,213 432 505,501 5 0.01157 2 14,872 65 747,486 5 0.07692 3 35,693 24 975,339 4 0.16667
4 362,924 1 362,924 1 1.00000
Based on the information available at the current time regarding the distribution of customer locations by size (total savings) and assumed error ratio, this design was anticipated to produce estimates of realization rates and other factors with the precisions indicated in Table 10.
Table 10: Anticipated Precisions for Impact Evaluation
Product Group Sites
Total Savings
Assumed Error Ratio
Confidence Level
Planned Sample Size
Anticipated Relative Precision
LED 2,407 36,430,888 0.4 90% 67 ±8.17% Fluorescent 522 2,591,251 0.4 90% 15 ±18.13% Total 2,929 39,022,139 0.4 90% 82 ±7.71%
3.3 Customer Recruitment and Sample Re-Design
In September 2012, following the decision to move forward on the above sample design of 82 sites from

DNV KEMA Energy & Sustainability
KEMA, Inc. February 19, 2014 3-18
the initial set of program data (Nov-11 to Apr-12) DNV KEMA began scheduling site visits. Since this is an upstream program, which meant that customers were purchasing lamps directly from their electrical contractor or distributor, there were several recruiting issues. The primary issue with the recruitment was that there was little information available on customer contact person and phone number. Recruiters had to rely on internet searches to identify customer phone numbers, and then conduct cold calls to identify the appropriate person to speak to regarding this study. This resulted in several attempts to contact primary sample points, and when those attempts were exhausted (usually after five or six unreturned voicemails or messages) back-up sites were selected. Ultimately, DNV KEMA was unable to complete site visits for the original 82 site sample using the original set of program data. A total of 35 sites were completed as part of this original sample, designated as Phase I.
In January 2013, DNV KEMA obtained a second set of program data from the third party program manager, which included the months of October and November, 2012. This new set of program data included additional offerings as shown in Table 11. These lamp types were again split into LED and Fluorescent categories for purposes of sampling.
Table 11: Additional Per Lamp Savings Assumptions by Type
Product Type
Baseline Fixture Wattage
Baseline Ballast Factor
Baseline Wattage
Installed Fixture Wattage
Installed Ballast Factor
Installed Wattage
Delta Watts
Annual Hours
kWh Savings
F32T8/25W 28 1.00 28 22 1.00 22 6.2 3,380 21
FB32T8/25W U-Bend 28 1.00 28 22 1.00 22 6.2 3,380 21
FB28T8 U-Bend 28 1.00 28 25 1.00 25 3.5 3,380 12
LED A-Lamp 55 1.00 55 17 1.00 17 38.6 2,800 108
LED Decorative Lamp 27 1.00 27 5 1.00 5 21.1 4,000 84
From this new set of program data, DNV KEMA developed a second sample, which was referred to as Phase II, to complete the data collection. The Phase II population data is presented in Table 12. The evaluation team performed data collection for both phases of the study in a consistent manner.
Table 12: Phase II Population
Customer Group
Product Group Sites
Total KWh Savings
Average Savings Minimum Maximum StdDev CV
End User LED 3,561 32,284,623 9,066 105 1,215,643 29,492 3.25 End User Fluorescent 1,680 21,009,251 12,506 12 1,570,483 69,427 5.55
Total 5,241 53,293,874
The Phase II sample, which included 47 sites, is presented in Table 13. We selected 47 sites, which would result in a combined sample size of 82 when added to the Phase I sites.
DNV KEMA Energy & Sustainability
KEMA, Inc. February 19, 2014 3-19
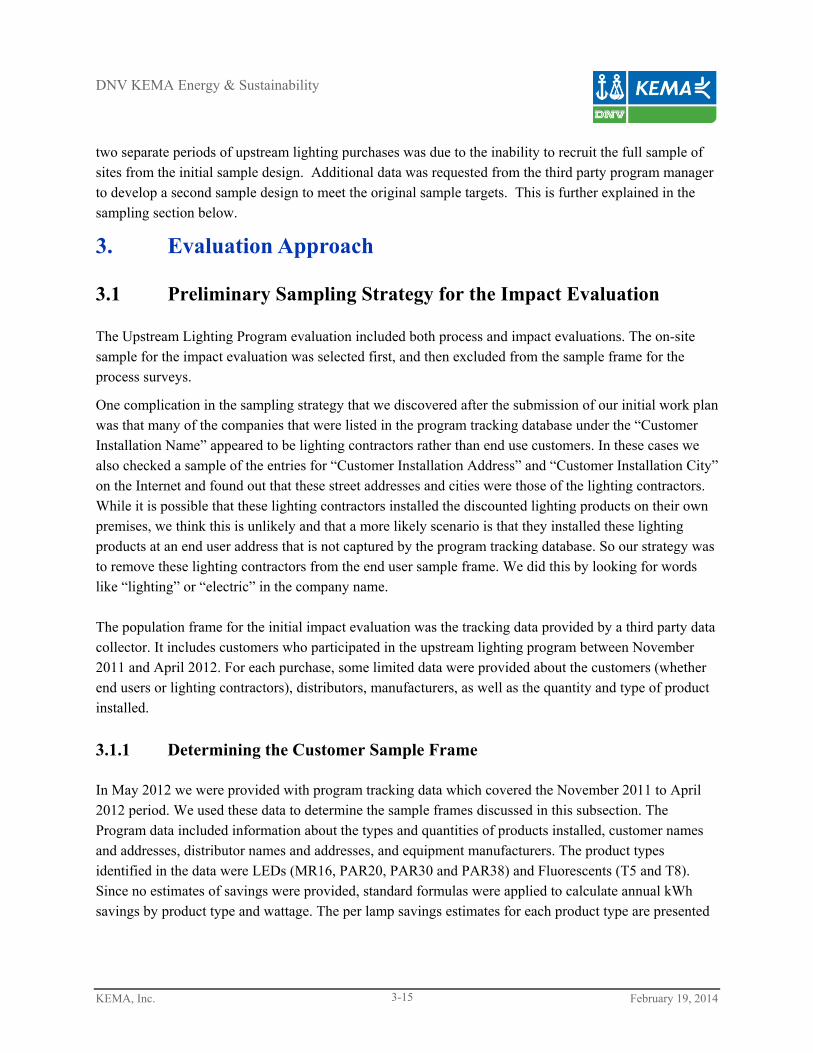
Table 13: Phase II Sample Design
Product Group Stratum
Maximum KWh
Savings Sites Total KWh
Savings Sample Inclusion
Probability LED 1 6,321 2,431 5,351,977 9 0.00370 2 16,273 690 6,940,064 10 0.01449 3 43,828 329 8,333,138 10 0.03030 4 1,215,643 111 11,659,444 10 0.09009 Fluorescent 1 35,693 1,590 7,066,270 4 0.00252 2 1,570,483 90 13,942,981 4 0.04444
3.4 Final Sample
Table 14 presents the final combined population, which includes all Phase I and II end users in the impact evaluation sample frame.
Table 14: Combined Population Phase I + Phase II
Customer Group
Product Group Sites
Total KWh Savings
Average Savings Minimum Maximum StdDev CV
End User LED 5,968 68,715,511 11,514 105 1,215,643 32,270 2.80 End User Fluorescent 2,202 23,600,503 10,718 12 1,570,483 61,420 5.73
Total 8,170 92,316,013
The final sample resulted in 81 sites according to the breakdown in Table 15. The reason that there were only 81 sites in the final sample as opposed to 82 was that there was one site that was completed, but was unable to be monitored by evaluators due to customer refusal. At the time of this discovery, it was too late to do additional metering at a new site, and the on-site effort was completed.
Table 15: Combined Sample Phase I + Phase II
Product Group Stratum
Maximum KWh
Savings Sites Total KWh
Savings Sample Case Weight LED 1 6,360 3,751 9,104,188 16 234.44 2 14,162 1,130 10,879,462 12 94.17 3 29,852 630 13,011,314 16 39.38 4 74,359 333 15,341,761 9 37.00 5 1,215,643 124 20,378,785 13 9.54 Fluorescent 1 30,696 2,079 7,960,567 10 207.90 2 1,570,484 123 15,639,935 5 24.60
The combined sample case weights were provided in the table above based on the stratified design. However, two of the sample sites were later identified as being outliers based on the results of the statistical analysis. Therefore these two sites were given a weight of one and the stratum from which

DNV KEMA Energy & Sustainability
KEMA, Inc. February 19, 2014 3-20
these sites were pulled had their weights adjusted accordingly. A more detailed explanation of the outlier detection test, and which sites were involved is provided in Section 4.4.
3.5 Measurement, Verification and Analysis Methodology
A key task in the on-site engineering assessment is the installation of measurement equipment to aid in the development of independent estimates of savings. The type of measure influences the measurement strategy used. Time-of-use (TOU) lighting loggers were utilized to inform the savings calculations with a direct measurement of hours of operation. For this study, most sites included a minimum of three months of data collection, while the remaining sites included at least 4 weeks of data.
In the context of an energy analysis, most efficiency measures can be characterized as either time-dependent or load-dependent. Time-dependent equipment typically runs at constant load according to a time-of-day operating schedule. Mathematically, hour-of-day and day-of-week are usually the most relevant variables in the energy savings analysis of these measures. Lighting is the most prevalent time-dependent measure.
3.5.1 Verification
Each site visit consisted of a verification of installed equipment, a discussion with facility personnel regarding the baseline characteristics of the measure, and the collection and analysis of monitored data. Once on-site, data was collected for calculating savings estimates for all LED and fluorescent lamps that were purchased through the program; including an inventory of the measures installed. If measure(s) have been removed, we attempted to gather the reason(s) for removal. If measures have not yet been installed, we have tried to understand when they are planning on being installed.
Program measure operating characteristics and general building operation characteristics were also gathered; including information on heating and cooling systems to assess interactive effects. Information on the pre-existing or baseline conditions was also collected to increase the accuracy of savings calculations. To gather this, the field auditor tried to identify the person who is most knowledgeable about the lighting at each facility to ask questions such as:
What type and wattage fixtures were replaced by the program fixtures?
Do you have any of these old bulbs/fixtures in storage for us to look at?
Is there a part of your facility that still has similar old bulbs/fixtures in place?
For new installations, the on-site protocol was to explore what the customer would have installed in the absence of the program. There was one such site in the sample, and the customer was not able to say what bulb type would have been installed. Therefore, the evaluation reverted to the tracking savings assumption for baseline lamp type specific to this site and installed bulb.

DNV KEMA Energy & Sustainability
KEMA, Inc. February 19, 2014 3-21
3.5.2 Monitoring
Time-dependent measures typically call for the installation of (TOU) loggers to measure hours of use. These small devices use specialized sensors – photocells in the case of lighting measures – to sense and record the dates and times that a device turns on and off. This TOU data was used to support the evaluation in two key ways:
1. To develop peak coincidence factors, and
2. To develop annual hours of use.
The measure scope influences the appropriate number of loggers and systems monitored for each site. Factors that drive the number of installed loggers include the number of unique schedules at the site, and the anticipated level of variation among the schedules within a particular space type.
3.5.3 Site Analysis
Data collected from TOU lighting loggers were used to develop time-of-use load profiles and estimate total run-times during the monitoring period. Short-term metered data, like that obtained from the typical three month period performed for this study, pose challenges in accurately expanding the data from the monitored period to a typical year or to specific periods of interest that do not coincide with the monitoring period, e.g., peak demand. In determining lighting schedules from time-of-use data, annual trends such as seasonal effects (e.g., daylight savings), production, and occupancy swings (such as vacations, business cycles, etc.) were accommodated to the extent supported by the data. As a general rule, visual inspection of time-of-use data should reveal explicable patterns that agree with other data sources, such as the information gathered from on-site interviews. Each site included an interview with the site contact to gather information that was used to assist in the expansion of the short-term metered data.
The data gathered from the on-sites were compiled into spreadsheets for analysis. The savings were calculated as line-by-line comparisons of pre- and post-retrofit electrical use. Pre- and post-retrofit energy estimates were developed for each line item within each measure. Interactive cooling and heating effects of the installed measures were also calculated utilizing engineering algorithms where applicable. This component of the savings is described in further detail in the following section.
All analyses were calculated so as to identify discrepancies between the tracked and gross savings according to each adjustment phase, including Documentation, Technology, Quantity, Operation, HVAC Interaction. These adjustments are further defined in Section 4 Results.
In addition to these adjustments, DNV KEMA also provides measure-specific estimates for the following savings input parameters, based on the data collected on-site:
Installation Rate;

DNV KEMA Energy & Sustainability
KEMA, Inc. February 19, 2014 3-22
Delta Watts; and
Annual Hours of Use.
3.5.4 HVAC Interactive Effects
When lighting equipment converts electrical energy to light, a significant amount of that energy is dissipated in the form of heat. Energy efficient lighting measures convert more electrical energy to light and less to heat. Since installing energy efficient lighting adds less heat to a given space, a complete estimation of energy savings considers the associated impacts on the heating and cooling systems or “interactive effects.”
The interactive effects take into account the effect of the energy efficient lighting measures on their corresponding heating and cooling systems. Energy efficient lighting serves to reduce the heat gain to a given space and accordingly reduces the load on cooling equipment. But this reduced heat gain has the added consequence of increasing the load on the heating system.
As part of the on-site methodology, evaluators interviewed facility personnel to ascertain the cooling and heating fuel, system type, and other information with which to approximate the efficiency of the HVAC equipment serving the space of each lighting installation. The DNV KEMA team expresses HVAC system efficiency in dimensionless units of Coefficient of Performance (COP), which reflects the ratio of work performed by the system to the work input of the system. Table 16 details the COP assumptions for general heating and cooling equipment types encountered in this study. Where site specific information yields improved estimates of system efficiency, these were used in place of the general assumptions below.
Table 16: General Heating and Cooling COP Assumptions
Cooling System Type COP Heating System Type COP
Packaged DX 2.9 Air to Air Heat Pump 1.5
Window DX 2.7 Electric Resistance 1
Chiller <200 Ton 4.7 Water to Air Heat Pump 2.8
Chiller >200 Ton 5.5
Air to Air Heat Pump 3.9
Water to Air Heat Pump 4.4
Refrigerated Area (high temp) 1.4
Refrigerated Cases (low temp) 1.9
Interactive effects are calculated at all sites where heating or cooling systems are in use. Leveraging the 8,760 profile of hourly demand impacts, the DNV KEMA team computes electric interactive effects during the hours that lighting and HVAC are assumed to operate in unison.

DNV KEMA Energy & Sustainability
KEMA, Inc. February 19, 2014 4-23
DNV KEMA utilizes Typical Meteorological Year 3 (TMY3) hourly dry-bulb temperatures for Worcester, Massachusetts as the balance point criteria in this analysis. For each hour in a typical year, DNV KEMA computes HVAC interaction according to the following equations:
Cooling kW Effects = 80% * Lighting kW Savings / Cooling System COP
Heating kW Effects = -80% * Lighting kW Savings / Heating System COP
The 80% values represent the assumed percentage of the lighting energy that translates to heat which either must be removed from the space by the air conditioning system or added to the space by the heating system during the aforementioned HVAC hours. This assumption is consistent with those established and employed in previous impact evaluations of custom lighting measures. Also, heating factors are negative because heating interaction erodes gross lighting savings, while cooling interactive boosts it.
4. Results
The results presented in the following section include statewide level realization rates (and associated precision levels) for annual kWh savings, percent on-peak kWh savings, and on-peak and seasonal demand (kW) coincidence factors at the times of the winter and summer peaks, as defined by the ISO New England Forward Capacity Market (FCM). All coincident summer and winter peak reductions were calculated using the following FCM definitions:
Coincident Summer On-Peak kW Reduction is the average demand reduction that occurs over all
hours between 1 PM and 5 PM on non-holiday weekdays in June, July and August.
Coincident Winter On-Peak kW Reduction is the average demand reduction that occurs over all
hours between 5 PM and 7 PM on non-holiday weekdays in December and January.
Seasonal Peak: Non-holiday week days when the Real-Time System Hourly Load is equal to or
greater than 90% of the most recent “50/50” System Peak Load Forecast for the summer and
winter seasons.
The adjusted gross energy savings and connected kW demand reduction are presented with their associated realization rate and relative precision for each lighting measure. These tables present results as adjustments to tracking savings. Each of these adjustments, or discrepancies, is described below:
Documentation Adjustment: The Documentation Adjustment reflects any change in savings due to discrepancies in project documentation. Evaluators recalculated the tracking estimates of savings using all quantities, fixture types/wattages, and hours documented in the project file. All tracking system discrepancies and documentation errors are reflected in this adjustment.

DNV KEMA Energy & Sustainability
KEMA, Inc. February 19, 2014 4-24
Technology Adjustment: The Technology Adjustment reflects the change in savings due to the identification of a different lighting technology (fixture type and wattage) at the site than represented in the tracking system estimate of savings.
Quantity Adjustment: The Quantity Adjustment reflects the change in savings due to the identification of a different quantity of lighting fixtures at the site than presented in the tracking system estimate of savings.
Operational Adjustment: The Operational Adjustment reflects the change in savings due to the observation or monitoring of different lighting operating hours at the site than represented in the tracking system estimate of savings.
HVAC Interactive Adjustment: The HVAC Interactive Adjustment reflects changes in savings due to interaction between the lighting and HVAC systems among the sampled sites. Generally, these impacts cause a heating penalty and a cooling credit. This adjustment reflects impacts from electric heating and/or cooling, not other fuels.
Also included in the results are savings factors for summer and winter on-peak and seasonal coincidence factors, summer and winter kW HVAC interactive effect factors, kWh HVAC interactive effect factor, percent of energy savings during on-peak periods, and a non-electric heating HVAC Interaction effect, which is presented in MMBTU/kWh saved. Relative precision levels and error bounds are calculated at the 80% and 90% confidence level for demand savings factors and values. For all kWh realization rates, the standard 90% confidence level is used.
A summary of site level results are also presented in Appendix B.
DNV KEMA Energy & Sustainability
KEMA, Inc. February 19, 2014 4-25
4.1 LED Results
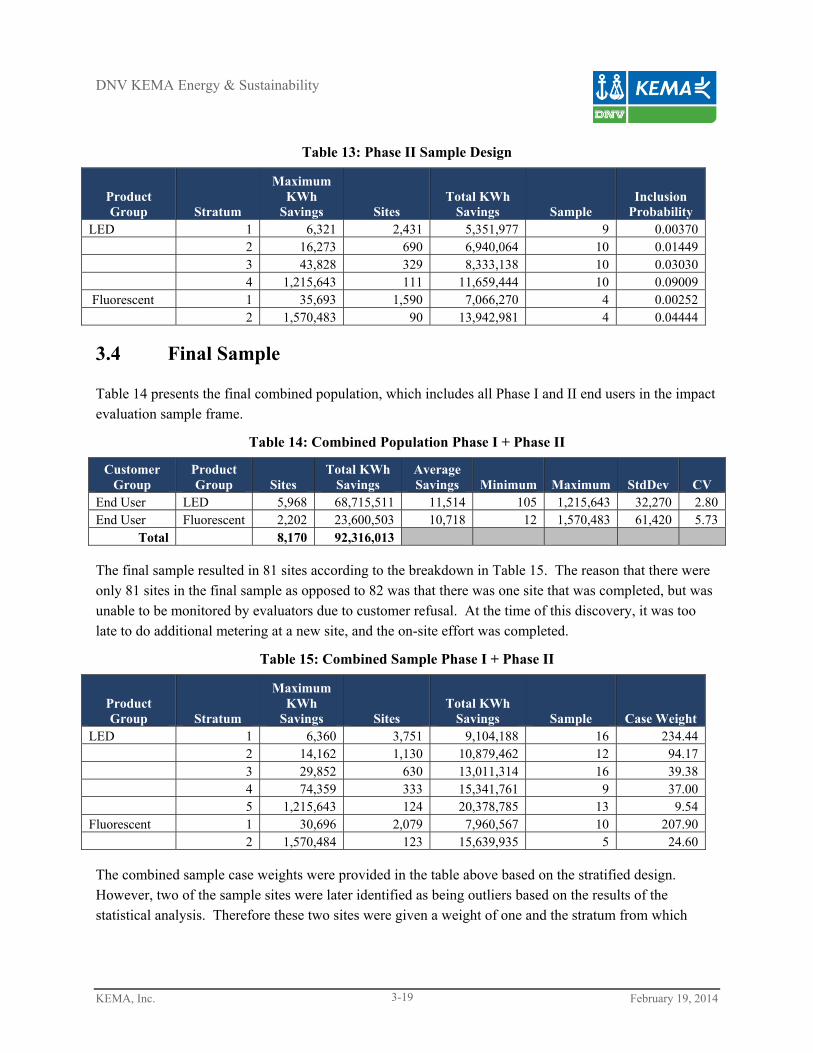
Figure 1 presents a scatter plot of evaluation results for LEDs for annual energy savings using all 66 PA sample points. The dashed line in this graph represents a realization rate of 100%. The slope of the solid line in this graph is an indication of the overall realization rate, and can be seen to be slightly greater than 100%. These sample data vary widely from the trend line, which indicates that the error ratio would be relatively high. Site level realization rates ranged from 0% to 774% in this measure category. The evaluation found that discrepancies were not limited to one particular area, but a mix of quantity, technology, operational and interactive adjustments.
Figure 1: Scatter Plot of Evaluation Results for Systems for Annual MWh Savings
DNV KEMA Energy & Sustainability
KEMA, Inc. February 19, 2014 4-26
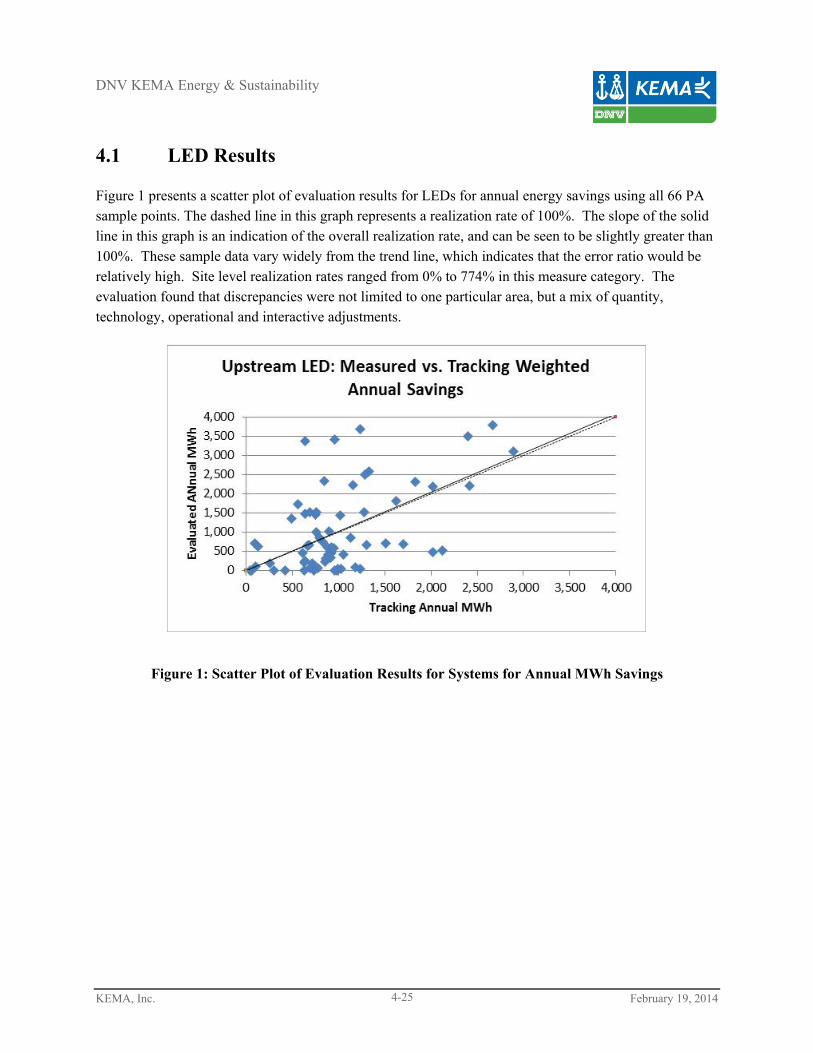
Table 17 summarizes the statewide results of this analysis. In the case of annual kWh savings, the realization rate for LEDs was found to be 101.9% with HVAC interactive effects included. The relative precision for this estimate was found to be ±17.5% at the 90% level of confidence. Note that gross tracking savings did not include HVAC interactive effects. The error ratio was found to be 0.90, which was significantly higher than the estimated error ratio of 0.40.
Table 17: Summary of LED Energy Realization Rate
Savings Parameter Energy - LED
kWh % Gross Gross Savings (Tracking) 68,715,511 Documentation Adjustment 1 0% Technology Adjustment 22,480,524 33% Quantity Adjustment -16,255,696 -24% Operational Adjustment -9,243,234 -13% HVAC Interactive Adjustment 4,328,036 6% Adjusted Gross Savings 70,025,141 102% Gross Realization Rate 101.91% Relative Precision ±17.5% Confidence Interval 90% Error Ratio 90%
Table 18 summarizes the statewide savings factors resulting from this analysis. All relative precisions were calculated at the 90% confidence level, including 80% for kW factors. The on-peak summer coincidence factor was 60.9%, with a relative precision of ±12.6%. The seasonal summer coincidence factor was 56.6%, with a relative precision of ±13.9%. The summer peak coincidence factors from this study are lower than what would be expected from a typical lighting evaluation (75% to 85%). It is unclear exactly why the coincidence factors are lower, but one reason could be due the high number of schools that turned up in the sample as shown below in Section 4.5. The on-peak winter coincidence factor was 54.7%, with a relative precision of ±13.1%. The seasonal winter coincidence factor was 51.5%, with a relative precision of ±13.7%. The values for winter peak coincidence factor are more in line with traditional lighting evaluations. The table also provides savings factors for on-peak and seasonal summer and winter kW HVAC interactive effects, kWh HVAC interactive effect, hours of use realization rate and percent on-peak kWh.

DNV KEMA Energy & Sustainability
KEMA, Inc. February 19, 2014 4-27
Table 18: Summary of LED Savings Factors
Savings Factors and Realization Rates
LED
Value Precision at 90% Confidence
Precision at 80% Confidence
Installation Rate (Quantity Adjustment - kW) 82.1% ±8.7% ±6.8%
Delta Watts (Technology Adjustment - kW) 133.2% ±8.5% ±6.6%
Connected kW Realization Rate5 109.4% ±13.2% ±10.3%
Summer Coincidence Factor
On Peak Hours 60.9% ±12.6% ±9.8%
Seasonal Hours 56.6% ±13.9% ±10.8%
Winter Coincidence Factor
On Peak Hours 54.7% ±13.1% ±10.2%
Seasonal Hours 51.5% ±13.7% ±10.7%
Summer kW HVAC Interactive Effect
On Peak Hours 119.8% ±2.0% ±1.6%
Seasonal Hours 120.2% ±2.1% ±1.6%
Winter kW HVAC Interactive Effect
On Peak Hours 96.6% ±4.1% ±3.2%
Seasonal Hours 97.0% ±3.3% ±2.6%
KWh Factors (Precisions at 90% confidence) Connected kWh Realization Rate 109.1% ±13.3% KWh HVAC Interactive Effect 106.6% ±1.8% Hours of Use Realization Rate 87.7% ±14.0% % On Peak KWh 59.2% ±5.1% Non-Electric
Heating HVAC Interaction Effect (MMBtu/kWh)
-0.00112
4.2 Fluorescent Results
Figure 2 presents a scatter plot of evaluation results for Fluorescent lamps for annual energy savings using all 15 PA sample points. The slope of the solid line in this graph is an indication of the overall realization rate, and can be seen to be less than one. These sample data spread from the trend line, which is indicative of a higher error ratio. Site level realization rates ranged from 1% to 247% in this measure category. The evaluation found that majority of the discrepancies between the tracking and evaluated savings estimates were due to quantity differences.
5 The Connected kW Realization Rate is the product of the Documentation Adjustment, Installation Rate and Delta Watts factors.

DNV KEMA Energy & Sustainability
KEMA, Inc. February 19, 2014 4-28
Figure 2: Scatter Plot of Evaluation Results for Fluorescents for Annual MWh Savings
Table 19 summarizes the statewide results of this analysis. In the case of annual kWh savings, the realization rate for Fluorescent lamps was found to be 89.1% with HVAC interactive effects included. The relative precision for this estimate was found to be ±26.9% at the 90% level of confidence. The error ratio was found to be 0.62.
Table 19: Summary of Fluorescent Energy Realization Rate
Savings Parameter Energy - FLR
kWh %
Gross Gross Savings (Tracking) 23,600,503 Documentation Adjustment 0 0% Technology Adjustment 6,783 0% Quantity Adjustment -4,644,999 -20% Operational Adjustment 563,107 2% HVAC Interactive Adjustment 1,494,622 6% Adjusted Gross Savings 21,020,016 89% Gross Realization Rate 89.07% Relative Precision ±26.9% Confidence Interval 90% Error Ratio 62%
Table 20 summarizes the statewide savings factors resulting from this analysis. All relative precisions were calculated at the 90% confidence level, including 80% for kW factors. The on-peak summer coincidence factor was 66.2%, with a relative precision of ±21.0%. The seasonal summer coincidence factor was 59.3%, with a relative precision of ±24.2%. The summer peak coincidence factors from this study are lower than what would be expected from a typical lighting evaluation (75% to 85%). It is

DNV KEMA Energy & Sustainability
KEMA, Inc. February 19, 2014 4-29
unclear exactly why the coincidence factors are lower, but one reason could be due the high number of schools that turned up in the sample as shown below in Section 4.5. The on-peak winter coincidence factor was 51.4%, with a relative precision of ±22.1%. The seasonal winter coincidence factor was 45.9%, with a relative precision of ±20.9%. The values for winter peak coincidence factor are more in line with traditional lighting evaluations. The table also provides savings factors for on-peak and seasonal summer and winter kW HVAC interactive effects, kWh HVAC interactive effect, hours of use realization rate and percent on-peak kWh.
Table 20: Summary of Fluorescent Savings Factors
Savings Factors and Realization Rates
FLR
Value Precision at 90% Confidence
Precision at 80% Confidence
Installation Rate (Quantity Adjustment - kW) 80.3% ±13.1% ±10.2%
Delta Watts (Technology Adjustment - kW) 100.0% ±0.1% ±0.1%
Connected kW Realization Rate6 80.3% ±13.1% ±10.2%
Summer Coincidence Factor
On Peak Hours 66.2% ±21.0% ±16.4%
Seasonal Hours 59.3% ±24.2% ±18.9%
Winter Coincidence Factor
On Peak Hours 51.4% ±22.1% ±17.2%
Seasonal Hours 45.9% ±20.9% ±16.3%
Summer kW HVAC Interactive Effect
On Peak Hours 118.9% ±5.0% ±3.9%
Seasonal Hours 119.2% ±5.2% ±4.0%
Winter kW HVAC Interactive Effect
On Peak Hours 100.0% ±0.0% ±0.0%
Seasonal Hours 100.0% ±0.0% ±0.0%
KWh Factors (Precisions at 90% confidence) Connected kWh Realization Rate 80.3% ±13.1% KWh HVAC Interactive Effect 107.7% ±2.4% Hours of Use Realization Rate 103.0% ±18.5% % On Peak KWh 71.0% ±5.8% Non-Electric
Heating HVAC Interaction Effect (MMBtu/kWh)
-0.00076
6 The Connected kW Realization Rate is the product of the Documentation Adjustment, Installation Rate and Delta Watts factors.

DNV KEMA Energy & Sustainability
KEMA, Inc. February 19, 2014 4-30
4.3 Combined Results
Table 21 summarizes the statewide results of combined program, including LED and Fluorescent lamps. In the case of annual kWh savings, the realization rate for was found to be 98.5% with HVAC interactive effects included. The relative precision for this estimate was found to be ±14.9% at the 90% level of confidence. The error ratio was found to be 0.86
Table 21: Summary of Combined Energy Realization Rate
Savings Parameter Energy - Combined
kWh %
Gross Gross Savings (Tracking) 92,316,013 Documentation Adjustment 1 0% Technology Adjustment 22,299,484 24%
Quantity Adjustment -
20,877,856 -23%
Operational Adjustment -8,589,122 -9% HVAC Interactive Adjustment 5,822,856 6% Adjusted Gross Savings 90,971,376 99% Gross Realization Rate 98.54% Relative Precision ±14.6% Confidence Interval 90% Error Ratio 86%
Table 22 summarizes the statewide savings factors resulting from this analysis. All relative precisions were calculated at the 90% confidence level, including 80% for kW factors. The on-peak summer coincidence factor was 62.2%, with a relative precision of ±11.0%. The seasonal summer coincidence factor was 57.3%, with a relative precision of ±12.1%. The on-peak winter coincidence factor was 53.9%, with a relative precision of ±11.2%. The seasonal winter coincidence factor was 50.1%, with a relative precision of ±11.5%. The table also provides savings factors for on-peak and seasonal summer and winter kW HVAC interactive effects, kWh HVAC interactive effect, hours of use realization rate and percent on-peak kWh

DNV KEMA Energy & Sustainability
KEMA, Inc. February 19, 2014 4-31
Table 22: Summary of Combined Savings Factors
Savings Factors and Realization Rates
Combined
Value Precision at 90% Confidence
Precision at 80% Confidence
Installation Rate (Quantity Adjustment - kW) 81.6% ±7.3% ±5.7%
Delta Watts (Technology Adjustment - kW) 122.8% ±7.3% ±5.7%
Connected kW Realization Rate7 100.2% ±10.5% ±8.2%
Summer Coincidence Factor
On Peak Hours 62.2% ±11.0% ±8.6%
Seasonal Hours 57.3% ±12.1% ±9.5%
Winter Coincidence Factor
On Peak Hours 53.9% ±11.2% ±8.7%
Seasonal Hours 50.1% ±11.5% ±9.0%
Summer kW HVAC Interactive Effect
On Peak Hours 119.5% ±2.0% ±1.5%
Seasonal Hours 119.9% ±2.0% ±1.6%
Winter kW HVAC Interactive Effect
On Peak Hours 97.4% ±3.1% ±2.5%
Seasonal Hours 97.7% ±2.6% ±2.0%
KWh Factors
Connected kWh Realization Rate 101.5% ±11.0% KWh HVAC Interactive Effect 106.8% ±1.5% Hours of Use Realization Rate 90.8% ±12.0% % On Peak KWh 62.0% ±4.8% Non-Electric Heating HVAC Interaction Effect (MMBtu/kWh)
-0.001025
4.4 Outliers
It is important to determine how much influence that one sample point has in the determination of the relationship between the tracking and evaluation savings. The observations should be tested to determine if they are outliers. Since we are examining and expecting a linear relationship between the tracking and evaluation savings, the assumption that the residuals are normally distributed is a valid assumption. Calculating the residuals and then standardizing them (called Studentized Residuals) will determine if any of the sample points are outliers. Studentized residuals will be normally distributed with a mean of zero and a standard deviation of 1. When we standardize them, it is easier to determine what observations are outliers. For example, a studentized residual of 2 means that the residual is 2 standard
7 The Connected kW Realization Rate is the product of the Documentation Adjustment, Installation Rate and Delta Watts factors.

DNV KEMA Energy & Sustainability
KEMA, Inc. February 19, 2014 4-32
deviations away from the mean of zero. Table 2 contains the Studentized Residuals for the relationship between the tracking and evaluated savings for two of the 81 sites.
Table 2: Studentized Residuals
Site Group Tracking Savings Evaluated Savings Studentized Residual
L1505 FLR 1,370,603.52 11,926.93 -3.04339
I2675 LED 132,631.88 633,790.34 6.49972
The Studentized Residuals represent the number of standard deviations away from the mean (in the case of a residual, the mean is 0). Since they are assumed to be normally distributed any site that contains a Studentized Residual greater than 3 or less than -3 would be considered an outlier. The reason that -3 and 3 is considered a good cut point is because in a normal distribution, residuals at this level are only 1% likely to occur. The graph below shows this.
Figure 3: Standard Deviation and Tolerance Intervals
For the residuals, the average, represented by the symbol µ (mu), is zero. Anything within 1 standard deviation is 68.2% to occur. If the value is greater than 1 and less than 2 (or less than -1 and greater than -2) standard deviations from the mean is 27.2% likely to occur. So anything that is greater than 2 standard deviations away from the mean is only 4.4% likely to occur. While this seems like very small percentages, these observations would be considered potential outliers. Any Studentized residuals that are greater than 3 standard deviations away from the mean is only .2% likely to occur. These would be considered extreme outliers and would be very unusual to occur. It is up to the user to determine what the outliers are, but to ensure pulling out the extreme outliers, using a Studentized residual less than -3 or greater than 3 will be the best method.
In this study, both sites above (L1505 and I2675) were identified by this test as likely outliers. Therefore, these two sample points were each given a weight of one, and the rest of the sample was re-stratified. By assigning these a weight of one, the assumption is that these are unique cases that are not representative of the overall population. Rather than removing these observations from the sample, this weighting

DNV KEMA Energy & Sustainability
KEMA, Inc. February 19, 2014 4-33
approach keeps them in, but doesn’t compound the extreme result by multiplying by a case weight that is greater than one. A summary of these two sites is provided, along with the other site summaries, in Appendix C.
4.5 Program Observations and Savings Adjustments
One of the goals of the evaluation was to identify where the upstream lamps were being installed. The PAs and EEAC were interested to find out what types of buildings and space types that the lamps ended up in. Table 23 presents a list of building types where the upstream lighting purchases were installed. The building type with the most installations was School/University. This represented 28% of the entire sample, including27% of the LED sample and 33% of the Fluorescent sample. In schools, LEDs were primarily installed in common areas such as corridors. The “Other” building type contained a mix of buildings that only had one or two sites in the sample. Additional prominent building types included Retail, Office, Hospital, Hotel, Religious Buildings and Multi-Family.
Table 23: Building Type
Building Type Fluorescent LED Total
School/University 5 18 23
Other 5 8 13
Retail 11 11
Office 2 8 10
Dining 6 6
Hospital/Healthcare 2 4 6
Hotel 5 5
Religious Building 4 4
Multi-Family 1 2 3
Total 15 66 81
4.5.1 Installation Rate
This evaluation found that approximately 82% of all purchased lamps were found to have been installed at the time of the on-site visits. LED and Fluorescent lamps had almost the same installation rates of 82% and 80%, respectively. These numbers represent the percentage of all lamps that were in operation at the time of the evaluation. In many cases, the missing lamps were identified in storage, and expected to be installed as other lamps burned out. In other situations, lamps were said to have been sent to a different location. When this occurred, evaluators attempted to verify these lamps by visiting these separate locations. However, they were not always identified as having been installed.

DNV KEMA Energy & Sustainability
KEMA, Inc. February 19, 2014 5-34
4.5.2 Delta Watts
The delta Watts factor was determined to be 123% for the overall impact evaluation. However, this was entirely driven by the LED category, which had a delta Watts factor of 133%. The Fluorescent category had a delta Watts factor of 100%. Delta Watts are defined as the pre-installation, or baseline wattage, minus the post-installation wattage. The factor represents the difference between the tracking delta Watts and the evaluation delta Watts as a percentage. For LED, this factor was mostly driven by the pre-existing or baseline wattages.
As shown earlier in Table 6 and Table 11, all tracking savings were based on an estimated baseline and installed wattage for each lamp type. These baseline wattages were developed by the PAs based on historical information, and manufacturer data. For LEDs, it was assumed that the baseline wattage would have been a mix of CFL and incandescent lamps corresponding to the installed LED lamp. To determine the pre-existing, or baseline, baseline wattage as part of this evaluation, engineers asked site personnel to identify what type and wattage bulb was there prior to the installation of the new lamps. In most cases, site personnel were very confident in their answers, were able to identify other sockets or fixtures that still had the “old” lamps installed, or still had some of the older lamps in storage. The evaluation estimated savings based on these reported baseline wattages. One thing that the evaluation found was that there were very few cases where LEDs were replacing either existing LEDs or CFLs. The majority of the replaced lamps were incandescent/halogen lamps of higher wattage. The site summaries in Appendix C describe the findings at each of the sites.
4.5.3 Hours of Use
The overall hours of use realization rate was found to be 91% based on the monitoring of hours of use. The LED hours of use realization rate was 88%, while the Fluorescent hours of use realization rate was 108%. The differences in realization rates could be attributed to the tracking estimates of hours of use. LED hours of use were expected to be higher than Fluorescent hours of use based on the tracking savings estimates. The tracking estimates were based on PA assumptions regarding usage of each different lamp type. The majority of LED lamps were expected to operate 4,500 hours per year, while Fluorescent lamps were expected to operate 3,380 hours per year. The analysis found that the evaluated hours of use for LEDs were approximately 3,979 hours per year, and 3,559 hours of use for Fluorescent
5. Conclusions and Recommendations
Overall, the Bright Opportunities program appears to be successfully delivering energy savings, especially with respect to the LED category. LEDs were found to have a realization rate of 102%, which was driven by several adjustments. Fluorescents were found to have a realization rate of 89%, which was primarily driven by the quantity adjustment. Based on the results of this study, it is recommended that realization rates for connected kW and kWh, and adjusted savings estimates for hours of use should be

DNV KEMA Energy & Sustainability
KEMA, Inc. February 19, 2014 5-35
applied at the category level (LED and FLR). This study does not have enough data points to disaggregate results at the building type or LED lamp type level with acceptable estimates of precision.
The following are some conclusions and recommendations for the program, and future evaluations of the program.
5.1 LED Savings Assumptions
Delta Watts. This study produced an estimate of delta watts that was approximately 33% higher
than tracking estimates. Almost this entire discrepancy was due to the finding that the baseline
bulbs/lamps were of higher wattage than the tracking estimates. The tracking estimates were
based on an assumption that there would be a mix of CFL and incandescent in the existing case.
However, it was found that the majority of the lamps that were replaced were incandescent, with
a very small percentage of CFL/LEDs. Additionally, as market penetration increases, the
replacement of CFL/LEDs likely increases, which will result in lower baseline wattages. A
follow-up evaluation should consider this shifting baseline as a factor in deciding when the next
one should take place. Note that the study connected kW and kWh realization rates include this
adjustment factor, so the adjustment factor should not be applied if the realization rates are being
used as recommended.
Quantity. This study found that approximately 82% of the purchased LED lamps were installed
at the time of the evaluation. It was common to find many of these not yet installed lamps in
storage at each of the facilities. Customers expect that they will eventually install each of these
bulbs as soon as their existing lamps burn out. It is unclear what the lag time will be for the
installation of these remaining lamps, and therefore, a follow-up study should be designed to
revisit sites from this study that had a large number of units still in storage or not yet installed.
Note that the study connected kW and kWh realization rates include this adjustment factor, so the
adjustment factor should not be applied if the realization rates are being used as recommended.
Hours of Use. This study found that the hours of use realization rate was 88% for LEDs. This is
a relatively low hours of use realization rate as compared to other lighting impact evaluations. As
mentioned above, the assumed hours of use for the majority of LED lamps was 4,500 hours per
year. Based on lighting logger data at each of the sites, the average hours of use for LED lamps
were found to be 3,979 hours per year. It is recommended that the hours of use be adjusted
downward to account for this finding for the near term. Note that the study connected kW and
connected kWh realization rates do not include this adjustment for hours, which means that
program savings estimates can be updated with the new hours estimates from this study. In this
instance the kWh realization rate would be based on the product of the Connected kWh RR
(109.1%) and the kWh HVAC Interactive Effect (106.1%), which results in a factor of 115.8%.

DNV KEMA Energy & Sustainability
KEMA, Inc. February 19, 2014 5-36
The assumed Hours of Use (4,500) used in the savings algorithms would need to be replaced with
the evaluated Hours of Use (3,979). The combination of these two adjustments would result in
the evaluated savings.
5.2 Fluorescent Savings Assumptions
Quantity. This study found that approximately 80% of the purchased Fluorescent lamps were
installed at the time of the evaluation. It was common to find many of these not yet installed
lamps in storage at each of the facilities. Customers expect that they will eventually install each
of these bulbs as soon as their existing lamps burn out. It is unclear what the lag time will be for
the installation of these remaining lamps, and therefore, a follow-up study should be designed to
revisit sites from this study that had a large number of units still in storage or not yet installed.
Note that the study connected kW and kWh realization rates include this adjustment factor, so the
adjustment factor should not be applied if the realization rates are being used as recommended.
Hours of Use. This study found that the hours of use realization rate was 103% for Fluorescent
lamps. This is in line with other impact evaluations of Fluorescent lighting systems. As
mentioned above, the assumed hours of use for the majority of Fluorescent lamps was 3,380
hours per year. Based on lighting logger data at each of the sites, the average hours of use for
Fluorescent lamps were found to be 3,559 hours per year. It is recommended that the hours of
use be adjusted upward to account for this finding for the near term. Note that the study connected
kW and connected kWh realization rates do not include this adjustment for hours, which means
that program savings estimates can be updated with the new hours estimates from this study. In
this instance the kWh realization rate would be based on the product of the Connected kWh RR
(80.3%) and the kWh HVAC Interactive Effect (107.7%), which results in a factor of 86.5%. The
assumed Hours of Use (3,380) used in the savings algorithms would need to be replaced with the
evaluated Hours of Use (3,559). The combination of these two adjustments would result in the
evaluated savings.
5.3 Program Tracking Documentation
Consider Efforts to Increase the Customer’s Awareness of the Program. Many customers
were aware that they had received discounted lamps from this program, but not all were aware
that the discounts came from the PAs. Many customers were under the impression that their
electrical contractors were offering the deep discounts. It is recommended that the PAs consider
utilizing a program sticker or label that participating distributors would attach to a customers’
shipping/purchase order. This may help the program gain recognition and will help the end-users
recall the Upstream lighting purchases. It should not be overlooked how good the program
discounted LED bulbs make the electricians look to their customers. Their customers, in many

DNV KEMA Energy & Sustainability
KEMA, Inc. February 19, 2014 5-37
cases, know the longevity and energy savings of LED bulbs but they can’t come to purchasing
them at regular cost. For example, site L2796 is a restaurant that would not have paid full price
for the LED bulbs that were installed. The electricians who oversee the building dealt with the
program and the credit for the financial discount is lost. In some cases, it’s the electricians who
appear as though they are selling or giving the company (restaurant in this case) a great deal. The
managers at this site allowed us to conduct our study but at first they didn’t know the program
bulbs were offered by the utilities.
Consider Additional Supporting Information for Large Purchases. One of the major
discrepancies found during this evaluation was that in some cases, large quantities of lamps were
being stored for future use by end users. There are several sites, the most extreme being L1505,
in which evaluators identified pallets of program bulbs being stockpiled by customers. In the
case of L1505, which was a school district, the large quantity of bulbs was considered so that they
wouldn’t have to worry about purchasing replacement lamps for several years. It is
recommended that electrical contractors or end users be required to provide more information to
support extremely large purchases so that it would be more likely that the program bulbs are
installed earlier.
5.4 Future Impact Evaluation
Consider a Follow-up Impact Evaluation. This impact evaluation provides important feedback
to the PAs for reporting savings, and improving savings estimates. However, due to the relatively
large error ratios found in this study, the targeted 90/10 precision was not achieved. Depending
on PA needs, a follow-up study may be considered to improve the evaluation results, or to obtain
statistically valid factors for some of the building types where a majority of LED and Fluorescent
lamps are being installed. The PAs and EEAC may want to consider performing a third phase of
impact evaluation, which could be designed in consideration of the error ratios that were found
with this study to try to achieve a combined 90/10 precision at the measure category, or targeted
at a measure category and building type. Alternatively, the PAs and EEAC may consider
following up on those sites with lower installation rates. Follow-up discussion and long-term
planning should take place to determine what the evaluation needs are on an ongoing basis, and
also what the target precision levels should be based on the needs of the PAs and EEAC.
DNV KEMA Energy & Sustainability
KEMA, Inc. February 19, 2014 A-1
A. Description of Results and Factors
This section presents a listing of realization rate and savings factors that were produced as part of this study. Each entry contains a description of that savings variable.
A.1 Realization Rates
Annual KWh – This result is the gross annual kWh realization rate including additional savings due to HVAC interactive effects. This realization rate is the evaluation gross annual kWh savings divided by the tracking gross annual kWh savings.
Connected KW – This result is the gross connected kW realization rate, which includes any documentation, quantity, and technology adjustments. This realization rate is the evaluation gross connected kW savings divided by the tracking gross connected kW savings.
Connected kWh – This result is the gross connected kWh realization rate, which includes only the documentation, quantity, and technology adjustments. This realization rate is the evaluation gross connected kWh savings divided by the tracking gross connected kWh savings.
Installation Rate – This represents the percentage of the tracking connected kW savings based on the quantity of installed lamps found during the on-site evaluation. This rate is embedded in the Annual KWh, Connected KW, and Connected kWh realization rates above.
Delta Watts – This result represents the percentage of the tracking connected kW savings based on the difference in the delta watts (pre minus post installation wattage) as found during the on-site evaluation. This rate is embedded in the Annual KWh, Connected KW, and Connected kWh realization rates above.
Hours of Use – This result is the hours of use realization rate, which represents the evaluation estimate of hours of use divided by the tracking estimate of hours of use. This rate is embedded in the Annual KWh realization rate above.
A.2 Savings Factors
Summer Coincidence Factor
On Peak Hours –This is the percentage of the connected kW savings coincident with the summer on-peak period.
Seasonal Hours –This is the percentage of the connected kW savings coincident with the summer seasonal peak period.
Winter Coincidence Factor

DNV KEMA Energy & Sustainability
KEMA, Inc. February 19, 2014 A-2
On Peak Hours –This is the percentage of the connected kW savings coincident with the winter on-peak period.
Seasonal Hours –This is the percentage of the connected kW savings coincident with the winter seasonal peak period.
Summer kW HVAC Interactive Effect
On Peak Hours – This is the percentage of gross connected kW savings that are due to interactive effects during the summer on-peak period.
Seasonal Hours – This is the percentage of gross connected kW savings that are due to interactive effects during the summer seasonal peak period.
Winter kW HVAC Interactive Effect
On Peak Hours – This is the percentage of gross connected kW savings that are due to interactive effects during the winter on-peak period.
Seasonal Hours – This is the percentage of gross connected kW savings that are due to interactive effects during the winter seasonal peak period.
KWh HVAC Interactive Effect – This is the percentage of the gross kWh savings that are due to interactive effects.
% On Peak KWh – This is the percentage of energy savings that occur during on-peak hours.

DNV KEMA Energy & Sustainability
KEMA, Inc. February 19, 2014 A-3
Table 24: Summary of Results and Factors
Tracking System Values Evaluation Values
(a) Annual kWh (j) Annual kWh
(b) kWh HVAC Factor (k) kWh HVAC Factor
(c) On-Peak % Annual kWh (l) On-Peak % Annual kWh
(d) Connected kW (m) Connected kW
(e) Summer kW Coincidence Factor (n) Summer kW Coincidence Factor
(f) Summer kW HVAC Factor (o) Summer kW HVAC Factor
(g) Winter kW Coincidence Factor (p) Winter kW Coincidence Factor
(h) Winter kW HVAC Factor (q) Winter kW HVAC Factor
(i) Average Hours of Use (r) Average Hours of Use
Realization Rates
(s) Annual kWh
(t) Connected kW
(u) Connected kWh
(v) Hours of Use
Savings Algorithms
Evaluated Annual kWh Savings (a) x (s) or (a) x (u) x (v) x (k)
Evaluated Connected kW (d) x (t)
Evaluated Summer Peak kW Reduction (d) x (t) x (n) x (o)
Evaluated Winter Peak kW Reduction (d) x (t) x (p) x (q)

DNV KEMA Energy & Sustainability
KEMA, Inc. February 19, 2014
B-4
B. Site Level Results
B.1 LED
Table 25: LED Tracking and Evaluation Savings Estimates
Tracking Evaluation
KEMA ID Facility Type
Annual kWh Savings
Connected kW Savings
Average Hours of Use
Annual kWh Savings
kWh HVAC Factor
On-Peak % Annual kWh
Connected kW Savings
Summer kW Coincidence Factor
Summer kW HVAC Factor
Winter kW Coincidence Factor
Winter kW HVAC Factor
Average Hours of Use
I0648 Multi-Family 10,204 2.3 4,500 36,307 1.07 46% 3.9 0.99 1.17 1.00 1.00 8,679
I0682 School/University 23,410 5.2 4,500 11,843 1.00 57% 7.7 0.18 1.00 0.16 1.00 1,548
I0699 Healthcare-Clinic 3,634 0.8 4,500 996 0.81 69% 0.3 1.00 1.27 0.78 0.21 4,632
I0776 Hospital 147,344 32.7 4,500 69,066 1.06 49% 9.5 0.85 1.14 0.85 1.00 6,887
I0786 Office 421 0.1 4,500 445 1.12 98% 0.2 0.85 1.27 0.47 1.00 2,312
I0891 Multi-Family 268 0.1 4,500 0 0.00 0% 0.0 0.00 1.00 0.00 1.00 N/A
I0909 Office 234,052 52.0 4,500 340,964 1.06 68% 71.9 0.93 1.14 0.85 1.00 4,483
I1160 Retail 46,002 10.2 4,500 18,754 1.12 70% 6.7 0.77 1.27 0.77 1.00 2,502
I1216 School/University 92,898 20.6 4,500 57,437 1.08 73% 16.0 0.71 1.17 0.36 1.00 3,332
I1243 School/University 96,562 21.5 4,500 5,726 1.06 46% 1.0 0.55 1.14 0.55 1.00 5,407
I1348 School/University 127,400 28.3 4,500 65,766 1.06 83% 38.2 0.47 1.14 0.12 1.00 1,619
I1418 Other 20,991 4.7 4,500 19,023 1.12 78% 5.6 0.78 1.27 0.73 1.00 3,045
I1419 Other 11,196 2.5 4,500 4,465 1.12 67% 3.0 0.37 1.27 0.12 1.00 1,313
I1428 Office 77,412 17.2 4,500 83,262 1.07 67% 16.4 0.96 1.17 0.69 1.00 4,731
I1476 School/University 54,506 12.1 4,500 59,301 0.84 58% 14.2 0.63 1.00 0.81 0.48 4,979
I1626 School/University 23,150 5.1 4,500 8,878 1.12 94% 4.7 0.64 1.27 0.28 1.00 1,684
I1628 Museum 129,916 28.9 4,500 252,326 1.07 67% 49.7 0.97 1.17 0.45 1.00 4,729
I1629 School/University 2,393 0.5 4,500 7,371 1.11 47% 0.8 1.00 1.27 1.00 1.00 8,633
I1674 Court House 2,725 0.6 4,500 1,078 1.11 85% 0.5 0.47 1.27 0.03 1.00 1,844

DNV KEMA Energy & Sustainability
KEMA, Inc. February 19, 2014
B-5
Tracking Evaluation
KEMA ID Facility Type
Annual kWh Savings
Connected kW Savings
Average Hours of Use
Annual kWh Savings
kWh HVAC Factor
On-Peak % Annual kWh
Connected kW Savings
Summer kW Coincidence Factor
Summer kW HVAC Factor
Winter kW Coincidence Factor
Winter kW HVAC Factor
Average Hours of Use
I1679 Retail 8,262 1.8 4,500 650 1.09 88% 0.6 0.26 1.22 0.18 1.00 925
I1843 School/University 392 0.1 4,500 3,039 1.00 34% 1.6 0.13 1.00 0.21 1.00 1,911
I1997 School/University 7,796 1.7 4,500 0 1.00 82% 0.5 0.00 1.00 0.00 1.00 0
I2031 Office 1,809 0.4 4,500 0 1.00 0% 0.0 0.00 1.00 0.00 1.00 N/A
I2033 Retail 18,487 4.1 4,500 1,857 1.12 86% 0.8 0.73 1.27 0.24 1.00 1,971
I2056 Dining: Family 29,360 6.5 4,500 56,568 1.11 56% 9.6 0.80 1.27 0.80 1.00 5,298
I2186 Office 43,893 9.8 4,500 49,049 1.11 68% 8.1 1.00 1.27 0.96 1.00 5,463
I2274 School/University 182 0.0 4,500 0 0.00 0% 0.0 0.00 1.00 0.00 1.00 N/A
I2675 Hotel 132,632 29.5 4,500 633,790 1.11 50% 78.8 0.90 1.27 0.90 1.00 7,264
I2882 Hospital 282,046 62.7 4,500 301,983 1.07 49% 35.1 0.97 1.17 0.97 1.00 8,055
I2958 School/University 57,409 12.8 4,500 14,099 1.01 82% 17.7 0.18 1.01 0.37 1.00 792
I2978 Retail 23,515 5.2 4,500 15,283 1.12 70% 4.1 0.98 1.27 0.72 1.00 3,363
L1866 Dining: Bar Lounge/Leisure 3,815 0.8 4,500 4,419 1.10 33% 0.8 0.00 1.27 0.06 1.00 4,775
L1920 School/University 33,258 7.4 4,500 1,607 1.06 89% 4.3 0.07 1.10 0.08 1.00 354
L2113 Hotel 21,416 7.6 2,800 59,454 1.11 55% 10.9 0.54 1.27 0.72 1.00 4,932
L2142 School/University 19,142 4.4 4,365 37,211 1.06 66% 6.8 0.86 1.14 0.87 1.00 5,186
L2275 Retail 19,196 4.3 4,500 25,696 1.12 74% 7.5 0.75 1.27 0.18 1.00 3,057
L2409 Religious Building 2,596 0.9 2,800 2,005 1.00 71% 1.2 0.41 1.00 0.13 1.00 1,740
L2529 Retail 99,143 22.0 4,500 140,369 1.12 75% 36.9 1.00 1.27 0.72 1.00 3,387
L2658 Religious Building 1,090 0.2 4,500 818 1.13 81% 0.4 0.17 1.30 0.28 1.00 1,917
L2719 Office 26,163 5.8 4,500 1,035 1.07 47% 0.1 1.00 1.19 1.00 1.00 8,760
L2771 Workshop 2,950 0.7 4,500 293 1.00 73% 0.5 0.12 1.00 0.21 1.00 643
L2796 Dining: Bar Lounge/Leisure 13,627 3.0 4,500 26,475 1.11 60% 3.8 1.00 1.27 1.00 1.00 6,347
L2869 Dining: Cafeteria/Fast Food 2,725 0.6 4,500 6,367 1.11 63% 0.9 1.00 1.27 0.98 1.00 6,356
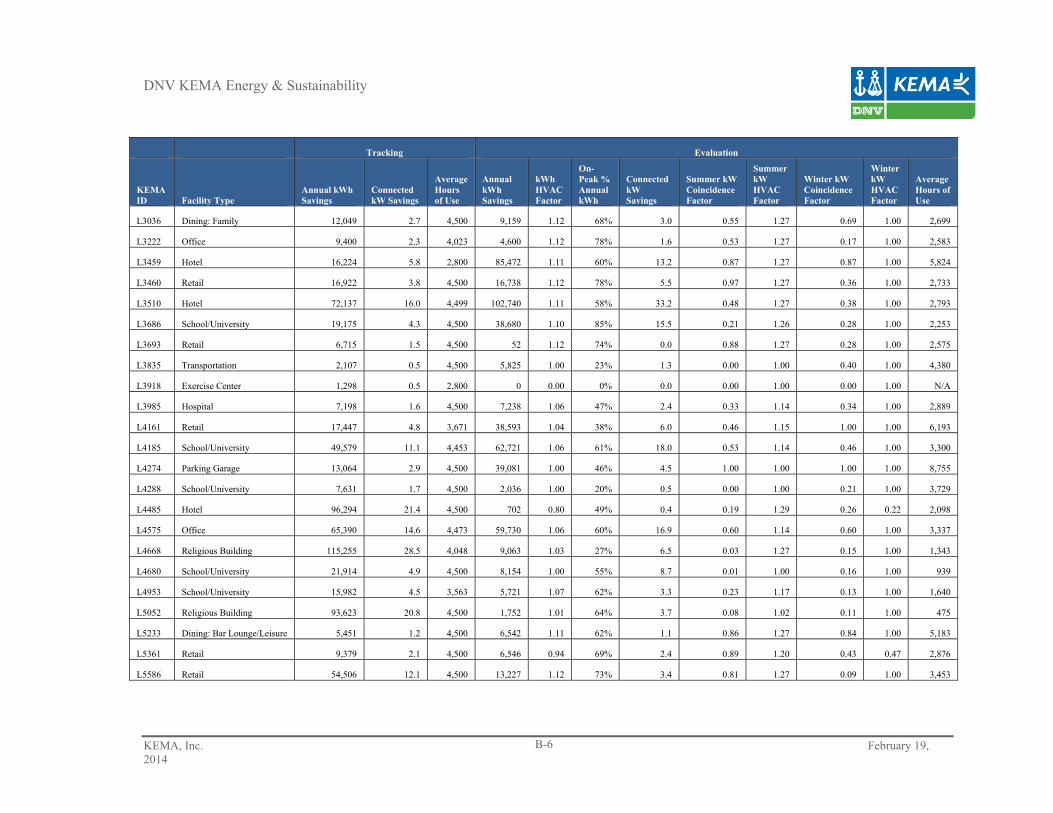
DNV KEMA Energy & Sustainability
KEMA, Inc. February 19, 2014
B-6
Tracking Evaluation
KEMA ID Facility Type
Annual kWh Savings
Connected kW Savings
Average Hours of Use
Annual kWh Savings
kWh HVAC Factor
On-Peak % Annual kWh
Connected kW Savings
Summer kW Coincidence Factor
Summer kW HVAC Factor
Winter kW Coincidence Factor
Winter kW HVAC Factor
Average Hours of Use
L3036 Dining: Family 12,049 2.7 4,500 9,159 1.12 68% 3.0 0.55 1.27 0.69 1.00 2,699
L3222 Office 9,400 2.3 4,023 4,600 1.12 78% 1.6 0.53 1.27 0.17 1.00 2,583
L3459 Hotel 16,224 5.8 2,800 85,472 1.11 60% 13.2 0.87 1.27 0.87 1.00 5,824
L3460 Retail 16,922 3.8 4,500 16,738 1.12 78% 5.5 0.97 1.27 0.36 1.00 2,733
L3510 Hotel 72,137 16.0 4,499 102,740 1.11 58% 33.2 0.48 1.27 0.38 1.00 2,793
L3686 School/University 19,175 4.3 4,500 38,680 1.10 85% 15.5 0.21 1.26 0.28 1.00 2,253
L3693 Retail 6,715 1.5 4,500 52 1.12 74% 0.0 0.88 1.27 0.28 1.00 2,575
L3835 Transportation 2,107 0.5 4,500 5,825 1.00 23% 1.3 0.00 1.00 0.40 1.00 4,380
L3918 Exercise Center 1,298 0.5 2,800 0 0.00 0% 0.0 0.00 1.00 0.00 1.00 N/A
L3985 Hospital 7,198 1.6 4,500 7,238 1.06 47% 2.4 0.33 1.14 0.34 1.00 2,889
L4161 Retail 17,447 4.8 3,671 38,593 1.04 38% 6.0 0.46 1.15 1.00 1.00 6,193
L4185 School/University 49,579 11.1 4,453 62,721 1.06 61% 18.0 0.53 1.14 0.46 1.00 3,300
L4274 Parking Garage 13,064 2.9 4,500 39,081 1.00 46% 4.5 1.00 1.00 1.00 1.00 8,755
L4288 School/University 7,631 1.7 4,500 2,036 1.00 20% 0.5 0.00 1.00 0.21 1.00 3,729
L4485 Hotel 96,294 21.4 4,500 702 0.80 49% 0.4 0.19 1.29 0.26 0.22 2,098
L4575 Office 65,390 14.6 4,473 59,730 1.06 60% 16.9 0.60 1.14 0.60 1.00 3,337
L4668 Religious Building 115,255 28.5 4,048 9,063 1.03 27% 6.5 0.03 1.27 0.15 1.00 1,343
L4680 School/University 21,914 4.9 4,500 8,154 1.00 55% 8.7 0.01 1.00 0.16 1.00 939
L4953 School/University 15,982 4.5 3,563 5,721 1.07 62% 3.3 0.23 1.17 0.13 1.00 1,640
L5052 Religious Building 93,623 20.8 4,500 1,752 1.01 64% 3.7 0.08 1.02 0.11 1.00 475
L5233 Dining: Bar Lounge/Leisure 5,451 1.2 4,500 6,542 1.11 62% 1.1 0.86 1.27 0.84 1.00 5,183
L5361 Retail 9,379 2.1 4,500 6,546 0.94 69% 2.4 0.89 1.20 0.43 0.47 2,876
L5586 Retail 54,506 12.1 4,500 13,227 1.12 73% 3.4 0.81 1.27 0.09 1.00 3,453

DNV KEMA Energy & Sustainability
KEMA, Inc. February 19, 2014
B-7
Table 26: LED Realization Rates and Reasons for Discrepancies
Realization Rates
KEMA ID Facility Type
Annual kWh (Including HVAC) Connected kW
Average Hours of Use Primary Reasons for Discrepancies
I0648 Multi-Family 356% 173% 193% Hours of use 193% of tracking. Baseline lamps are 50w rather than 38w and 31w. HVAC interaction added. (2) MR16 lamps not installed.
I0682 School/University 51% 147% 34% Hours of use 34% of tracking. (19) more PAR20 and (9) less PAR30. Baseline lamps were 65w rather than 55w and 38w.
I0699 Healthcare-Clinic 27% 33% 103% Baseline lamps were 35w rather than 55w. (6) PAR30 not installed. Electric heat HVAC penalty. I0776 Hospital 47% 29% 153% Baseline lamps were 2 lamp 11w CFL. Hours of use 153% of tracking. I0786 Office 106% 184% 51% Hours of use 51% of tracking. Baseline lamps 100w rather than 61w. I0891 Multi-Family 0% 0% N/A Lamps not installed yet. I0909 Office 146% 138% 100% Baseline lamps were 50w and 75w. HVAC interaction added.
I1160 Retail 41% 66% 56% Hours of use 56% of tracking. (48) PAR30 not installed and (9) PAR38 not installed. Baseline lamps were 50w rather than 55w and 61w.
I1216 School/University 62% 78% 74% Several baseline lamps were CFLs. Hours of operation 74% of tracking. I1243 School/University 6% 5% 120% Baseline lamps were 13w and 18w CFL.
I1348 School/University 52% 135% 36% Hours of use 36% of tracking. Baseline lamps were 50w rather than 31w and 38w for majority of spaces.
I1418 Other 91% 120% 68% Baseline lamps were 50w and 75w rather than 38w and 55w. Hours of use were 68% of tracking. (27) PAR20 not installed.
I1419 Other 40% 122% 29% Hours of use 29% of tracking. Baseline lamps were 50w rather than 38w and 55w. (6) PAR30 and (1) PAR20 not installed.
I1428 Office 108% 96% 105% Hours of operation 105% of tracking. I1476 School/University 109% 117% 111% Baseline lamps were 75w rather than 55w. (60) PAR30 not installed. Electric heat penalty. I1626 School/University 38% 92% 37% Hours of use 37% of tracking. Purchased PAR20 rather than PAR30.
I1628 Museum 194% 172% 105% Baseline lamps were 65w, 75w and 50w rather than 31w, 38w, 55w and 61w. Hours of operation 105% of tracking. HVAC interaction added.
I1629 School/University 308% 145% 192% Hours of use 193% of tracking. Baseline lamps are 50w rather than 38w and 31w. HVAC interaction added. (2) MR16 lamps not installed.
I1674 Court House 40% 87% 41% Hours of use 41% of tracking. Baseline lamps were 50w rather than 55w.
I1679 Retail 8% 35% 21% Hours of use 21% of tracking. (9) PAR30 and (14) PAR38 not installed. Baseline lamps were 50w rather than 55w and 61w.
I1843 School/University 774% 1823% 42% Evaluators found (15) PAR38 installed rather than (1) PAR30 and (1) PAR38. Baseline lamps were 120w rather than 55w and 61w. Hours of use 42% of tracking.
I1997 School/University 0% 26% 0% (29) PAR38 not installed. (8) PAR38 have zero hours of use. I2031 Office 0% 0% N/A Lamps not installed.
I2033 Retail 10% 20% 44% (73) PAR30 and (2) PAR20 not installed. (18) PAR20 not received. Baseline lamps were 75w rather than 55w. Hours of use 44% of tracking.
I2056 Dining: Family 193% 147% 118% Baseline lamps were 75w rather than 55w and 61w. Hours of use 118% of tracking.
I2186 Office 112% 83% 121%
The evaluated savings were 21% higher than the tracking documentation. The reason for this discrepancy was a increase in annual operation hours based on metered data. Additional savings are due to HVAC interactions and 48 uninstalled LED lamps.
I2274 School/University 0% 0% N/A Lamp not installed.
I2675 Hotel 478% 267% 161% Hours of use 161% of tracking. Baseline lamps were 120w rather than 55w. Installed lamps were 12w rather than 15w.
I2882 Hospital 107% 56% 179% Increase in annual hours of use and 846 fixtures in storage

DNV KEMA Energy & Sustainability
KEMA, Inc. February 19, 2014
B-8
Realization Rates
KEMA ID Facility Type
Annual kWh (Including HVAC) Connected kW
Average Hours of Use Primary Reasons for Discrepancies
I2958 School/University 25% 139% 18% Hours of use 18% of tracking. Baseline lamps were 75w rather than 55w and 61w. I2978 Retail 65% 78% 75% Hours of use 75% of tracking. Baseline lamps were 50w rather than 55w. (7) PAR30 not installed.
L1866 Dining: Bar Lounge/Leisure 116% 99% 106% Increase in annual hours of use and 12W PAR30s onsite not 15W PAR30s as per tracking. (2) lamps burned out and were not replaced.
L1920 School/University 5% 58% 8% Reduction in annual hours of use. 12 PAR30 and 90 PAR38 in storage
L2113 Hotel 278% 142% 176% Existing lamps were 90 watt incandescent. Increase in Annual hours of use, (49) A-Lamps in storage, not installed.
L2142 School/University 194% 154% 119% Higher wattage baseline lamps and lower wattage installed lamps resulted in technology adjustment. Hours of use were 119% of tracking.
L2275 Retail 134% 177% 68% Higher wattage baseline lamps and lower wattage installed lamps resulted in technology adjustment. Hours of use were 68% of tracking. (4) PAR 30 not yet installed.
L2409 Religious Building 77% 124% 62% Hours of use 62% of tracking. Baseline lamps were 60 watt incandescent rather than 55 watt.
L2529 Retail 142% 168% 75% Higher wattage baseline lamps and lower wattage installed lamps resulted in technology adjustment. Hours of use were 75% of tracking.
L2658 Religious Building 75% 156% 43% Higher wattage baseline lamps and lower wattage installed lamps resulted in technology adjustment. Hours of use were 43% of tracking.
L2719 Office 4% 2% 195% New LEDs replaced 15 watt CFLs, which resulted in a -98% technology adjustment.
L2771 Workshop 10% 70% 14% (8) PAR38 not installed yet. Baseline bulbs were 90 watt incandescent. Hours of use were 14% of tracking estimate.
L2796 Dining: Bar Lounge/Leisure 194% 124% 141% Hours of use 41% greater than tracking estimates. Baseline lamps were 65 watt rather than 55 watt. Additional HVAC savings.
L2869 Dining: Cafeteria/Fast Food 234% 149% 141% Baseline lamps were 75 watts rather than 55 watts. Hours of use were 41% higher than tracking estimates.
L3036 Dining: Family 76% 113% 60% Baseline lamps were 75w rather than 55w and 31w. Hours of use 60% of tracking. (18) PAR30 not installed.
L3222 Office 49% 68% 64% 17 of 56 bulbs not installed. Hours of use 64% of tracking estimates. This was a new construction situation, so baseline is assumed tracking wattages.
L3459 Hotel 527% 228% 208% Baseline lamps were 100 watt rather than 55 watt. Hours of use were more than twice the tracking estimate.
L3460 Retail 99% 145% 61% Baseline lamps were higher wattage (90 and 50 watts). Hours of use 61% of tracking. L3510 Hotel 142% 207% 62% Higher wattage baseline bulbs. Hours of use 62% of tracking.
L3686 School/University 202% 365% 50% Reduction in Annual hours of use and HVAC included. (48) PAR30s were found onsite rather than (48) PAR38s
L3693 Retail 1% 1% 57% (30) PAR30 not installed, (4) PAR38 not installed. Pre-retrofit lamps were all 23w LED instead of 55w and 61w. Hours of use were 57% of tracking.
L3835 Transportation 276% 284% 97% Baseline lamp was a 150 watt halogen rather than 61 watt. L3918 Exercise Center 0% 0% N/A New lamps not installed. Baseline 60 watt incandescent found on-site. L3985 Hospital 101% 148% 64% Baseline lamps are higher wattage than tracking estimates. Hours of use 64% of tracking estimates.
L4161 Retail 221% 126% 169% Annual hours of use doubled from tracking. (29) fixtures ON 24x7. 8W LED A-lamps were found on site rather than 17W LED A-lamps.
L4185 School/University 127% 161% 74% (8) 12W LED A-lamps were installed onsite instead of 18W LED A-lamps and (176) 18W PAR38s installed onsite instead of 14W PAR38s as per tracking. 41% decrease in average annual hours of use.
L4274 Parking Garage 299% 154% 195% (62) 18W LED PAR38s were installed rather than (62) 14W LED PAR38s per tracking.
L4288 School/University 27% 32% 83% Reduction in annual hours of use based on darkness hours by month calculations as the lights operate on photo sensors
L4485 Hotel 1% 2% 47% 391 of 530 lamps not installed. Baseline lamps were 15 watt CFL, which were lower wattage than
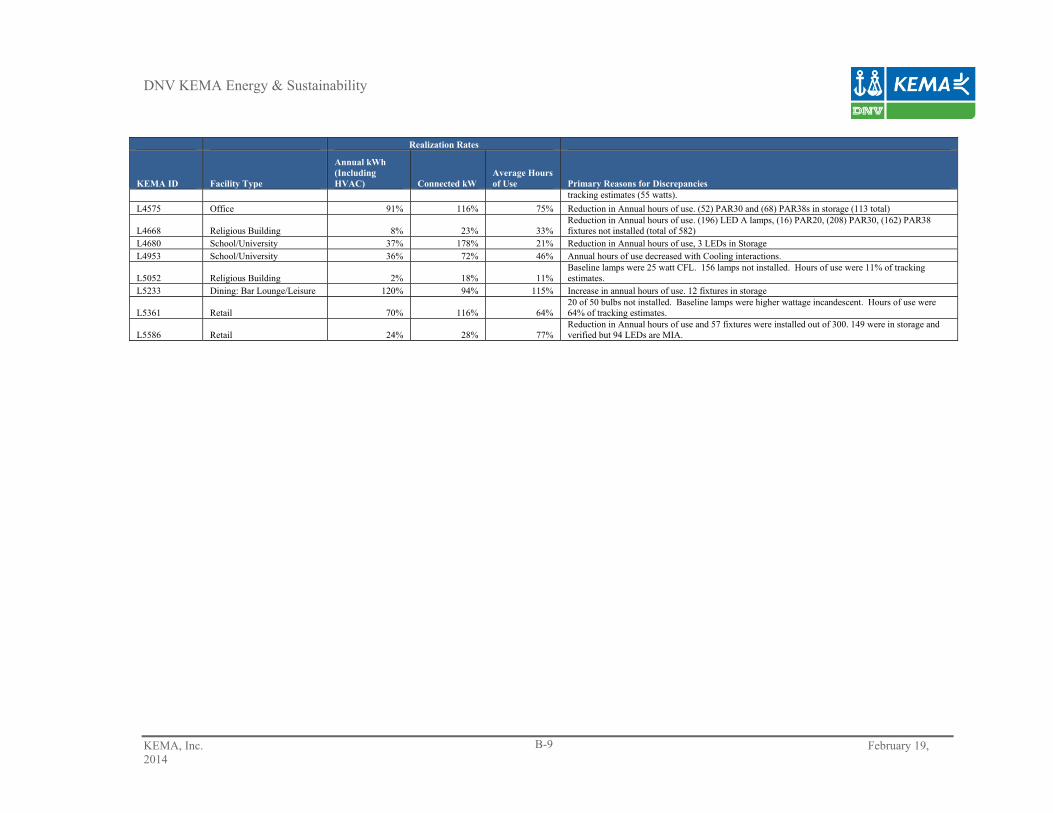
DNV KEMA Energy & Sustainability
KEMA, Inc. February 19, 2014
B-9
Realization Rates
KEMA ID Facility Type
Annual kWh (Including HVAC) Connected kW
Average Hours of Use Primary Reasons for Discrepancies
tracking estimates (55 watts).
L4575 Office 91% 116% 75% Reduction in Annual hours of use. (52) PAR30 and (68) PAR38s in storage (113 total)
L4668 Religious Building 8% 23% 33% Reduction in Annual hours of use. (196) LED A lamps, (16) PAR20, (208) PAR30, (162) PAR38 fixtures not installed (total of 582)
L4680 School/University 37% 178% 21% Reduction in Annual hours of use, 3 LEDs in Storage L4953 School/University 36% 72% 46% Annual hours of use decreased with Cooling interactions.
L5052 Religious Building 2% 18% 11% Baseline lamps were 25 watt CFL. 156 lamps not installed. Hours of use were 11% of tracking estimates.
L5233 Dining: Bar Lounge/Leisure 120% 94% 115% Increase in annual hours of use. 12 fixtures in storage
L5361 Retail 70% 116% 64% 20 of 50 bulbs not installed. Baseline lamps were higher wattage incandescent. Hours of use were 64% of tracking estimates.
L5586 Retail 24% 28% 77% Reduction in Annual hours of use and 57 fixtures were installed out of 300. 149 were in storage and verified but 94 LEDs are MIA.

DNV KEMA Energy & Sustainability
KEMA, Inc. February 19, 2014
B-10
B.2 Fluorescent
Table 27: Fluorescent Tracking and Evaluation Savings Estimates
Tracking Evaluation
KEMA ID Facility Type
Annual kWh Savings
Connected kW Savings
Average Hours of Use
Annual kWh Savings
kWh HVAC Factor
On-Peak % Annual kWh
Connected kW Savings
Summer kW Coincidence Factor
Summer kW HVAC Factor
Winter kW Coincidence Factor
Winter kW HVAC Factor
Average Hours of Use
I0025 Other 2,213 0.7 3,380 345 1.03 94% 0.3 0.26 1.06 0.01 1.00 1,002 I0030 Multi-Family 6,853 2.0 3,380 7,392 1.11 51% 2.0 0.41 1.27 0.48 1.00 3,276 I0140 Other 10,351 3.1 3,380 9,073 1.11 67% 2.4 0.74 1.27 0.57 1.00 3,459 I0244 Hospital 14,872 4.4 3,380 24,576 1.04 69% 4.4 0.96 1.09 0.87 1.00 5,379 I0438 Other 23,795 7.0 3,380 27,401 1.11 72% 7.0 0.74 1.25 0.52 1.00 3,512 L0029 Workshop 71 0.0 3,380 22 1.00 94% 0.0 0.25 1.00 0.02 1.00 1,405 L0082 School/University 40,690 12.0 3,380 22,599 1.00 86% 8.6 0.43 1.00 0.46 1.00 2,634 L0114 School/University 571 0.2 3,380 40 1.00 41% 0.0 0.00 1.00 0.26 1.00 2,492 L0135 Healthcare-Clinic 10,470 3.1 3,380 14,678 1.11 75% 3.1 0.94 1.27 0.57 1.00 4,260 L0649 Office 77,810 23.0 3,380 35,086 1.06 69% 11.4 0.60 1.14 0.29 1.00 2,907 L0667 School/University 47,828 14.2 3,380 9,983 1.00 82% 8.7 0.21 1.00 0.15 1.00 1,145 L1191 School/University 78,524 19.7 3,976 39,771 1.00 90% 20.9 0.24 1.00 0.27 1.00 1,900 L1482 Gymnasium 357 0.1 3,380 881 1.11 49% 0.1 1.00 1.27 0.99 1.00 8,403 L1505 School/University 1,370,604 405.5 3,380 11,927 1.00 95% 6.9 0.22 1.01 0.07 1.00 1,729 L1532 Office 714 0.2 3,380 222 1.12 93% 0.1 0.54 1.27 0.02 1.00 1,761

DNV KEMA Energy & Sustainability
KEMA, Inc. February 19, 2014
B-11
Table 28: Fluorescent Realization Rates and Reasons for Discrepancies
Realization Rates
KEMA ID Facility Type
Annual kWh (Including HVAC) Connected kW
Average Hours of Use Primary Reasons for Discrepancies
I0025 Other 16% 51% 30% (91) T8 lamps not installed. Hours of use 30% of tracking. I0030 Multi-Family 108% 100% 97% HVAC interaction added. I0140 Other 88% 77% 102% (200) T8 Lamps not installed. HVAC interactive savings added. I0244 Hospital 165% 100% 159% Hours of use 159% of tracking. I0438 Other 115% 100% 104% Hours of use 104% of tracking. HVAC interaction added. L0029 Workshop 32% 76% 42% Hours of use 42% of tracking estimate. Two of six lamps not installed. L0082 School/University 56% 71% 78% (983) T8 Lamps not installed yet. Hours of use 78% of tracking. L0114 School/University 7% 9% 74% 44 of 48 lamps not yet installed. L0135 Healthcare-Clinic 140% 100% 126% Increase in annual hours of use and HVAC interaction savings L0649 Office 45% 49% 86% Reduction in Annual hours of use and 3390 out 6543 fixtures not installed L0667 School/University 21% 62% 34% (1,571) T8 Lamps not installed. Hours of use 34% of tracking. L1191 School/University 51% 106% 48% Reduction in annual hours of use and 653 fixtures in storage L1482 Gymnasium 247% 90% 249% Annual hours of use tripled from tracking or ON 24x7 L1505 School/University 1% 2% 51% 113,250 out of 115,200 fixtures in storage, and reduction in annual hours of use for rest of them L1532 Office 31% 53% 52% Reduction in annual hours of use.

DNV KEMA Energy & Sustainability
KEMA, Inc. February 19, 2014 C-12
C. Site Summaries
Site I0244 Facility type: Hospital
Tracking: (1,250) 28 watt T8 lamps, (50) PAR20 8 watt LED, (12) PAR30 15 watt LED, (62) PAR38 14 watt LED
Onsite Actual: (1,250) 28 watt T8 lamps, (50) PAR20 8 watt LED, (12) PAR30 15 watt LED, (62) PAR38 14 watt LED
Baseline bulbs: (1,250) 32 watt T8 lamps, 90W incandescent, and 50W incandescent
T8 bulbs were mainly installed in the general areas, private offices, hallways, and maintenance areas throughout the facility. LED bulbs were installed in the lobby and gift shop. The assumption for tracking hours of use are (3380) and the logged average hours of use are (5379).
Site I0648 Facility type: Apartment complex Tracking: (74) MR16 8 watt LED, (18) PAR20 8 watt LED
Onsite Actual: (72) MR16 8 watt LED, (18) PAR20 8 watt LED
Baseline: (74) 50 watt halogen, (18) 50 watt halogen
Building is a 3-year old apartment complex. The bulbs were installed in common spaces throughout the facility including lobbies, hallways and elevators. Six PAR20 bulbs were installed at three elevators, and MR16 bulbs were installed at ten elevator lobbies and the main entrance lobby space. Two bulbs were not replaced and still had MR16 halogen bulbs installed. The assumption for tracking hours of use are (4500) and the logged average hours of use are (8679).
Site I1843
Facility type: Educational facility
Tracking: (200) PAR30 15 watt LED, (100) PAR20 8watt LED; (200) PAR38 14 watt LED
Onsite Actual: (15) PAR30 15 watt LED
Baseline: (500) 120 watt incandescent
This is a middle school consisting of typical school spaces. The LED bulbs were installed in the exterior doorways. There are five doorways in total, including two front doorways, two rear doorways and one side doorway. Each doorway has three recessed can fixtures where PAR38 bulbs were
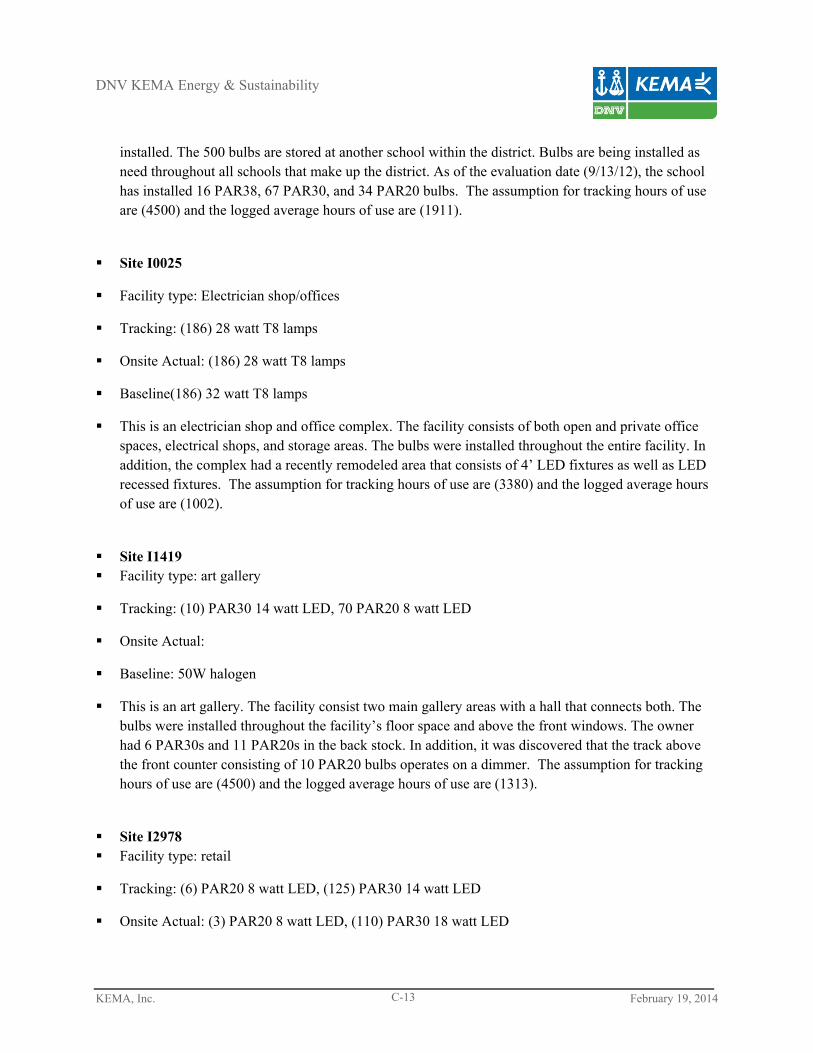
DNV KEMA Energy & Sustainability
KEMA, Inc. February 19, 2014 C-13
installed. The 500 bulbs are stored at another school within the district. Bulbs are being installed as need throughout all schools that make up the district. As of the evaluation date (9/13/12), the school has installed 16 PAR38, 67 PAR30, and 34 PAR20 bulbs. The assumption for tracking hours of use are (4500) and the logged average hours of use are (1911).
Site I0025
Facility type: Electrician shop/offices
Tracking: (186) 28 watt T8 lamps
Onsite Actual: (186) 28 watt T8 lamps
Baseline(186) 32 watt T8 lamps
This is an electrician shop and office complex. The facility consists of both open and private office spaces, electrical shops, and storage areas. The bulbs were installed throughout the entire facility. In addition, the complex had a recently remodeled area that consists of 4’ LED fixtures as well as LED recessed fixtures. The assumption for tracking hours of use are (3380) and the logged average hours of use are (1002).
Site I1419 Facility type: art gallery
Tracking: (10) PAR30 14 watt LED, 70 PAR20 8 watt LED
Onsite Actual:
Baseline: 50W halogen
This is an art gallery. The facility consist two main gallery areas with a hall that connects both. The bulbs were installed throughout the facility’s floor space and above the front windows. The owner had 6 PAR30s and 11 PAR20s in the back stock. In addition, it was discovered that the track above the front counter consisting of 10 PAR20 bulbs operates on a dimmer. The assumption for tracking hours of use are (4500) and the logged average hours of use are (1313).
Site I2978 Facility type: retail
Tracking: (6) PAR20 8 watt LED, (125) PAR30 14 watt LED
Onsite Actual: (3) PAR20 8 watt LED, (110) PAR30 18 watt LED

DNV KEMA Energy & Sustainability
KEMA, Inc. February 19, 2014 C-14
Baseline: 50W halogens
This is a home retail store, consisting of three main sales floor areas. The bulbs are installed in standard tracking fixtures along the store ceiling. 110 PAR30s are installed throughout the sales floor. Three of the six PAR20s are installed over the counter area by the front door. There are 7 PAR30s in back stock. The facility owner also owns a similar store across town, where possibly the other 8 PAR30s were installed. The assumption for tracking hours of use are (4500) and the logged average hours of use are (3363).
Site I0140 Facility type: publishing
Tracking: (870) 28 watt T8 lamps
Onsite Actual: (640) 28 watt T8 lamps
Baseline: (870) 32W T8 bulbs
This is a newspaper printing facility, mainly consisting of open and private office spaces. Along with departments of graphics, advertising, printing and accounting. It also has commonly used office areas such as cafeteria, restrooms and break rooms. The entire facility was upgraded according to the head custodian (primary contact). During the on-site visit, the entire facility was inventoried. There were a few spaces, mainly private offices that were locked and not seen. Based on similar types of rooms, the inventory was estimated for each of the locked spaces. Bulbs were counted and totaled. The on-site produced 664 out of 870 Sylvania T8 bulbs through the program. The assumption for tracking hours of use are (3380) and the logged average hours of use are (3459).
Site I1160 Facility type: retail
Tracking: (230) PAR30 14 watt LED, (20) PAR38 15 watt LED
Onsite Actual: (182) PAR30 15 watt LED, (11) PAR38 18 watt LED
Baseline: A mixture of halogen and CFL bulbs. Halogen bulbs were likely 50 watts and some were still installed. The CFL bulbs were a mixed batch consisting of various types of bulbs that were used to replace burned-out bulbs before the upstream program. (90-95% confident)
This is a retail facility that consists mainly of sales floor space. The facility also has exterior fixtures that were involved in the program. There are 3 PAR38s installed above the main entrance in recessed can fixtures, and 8 PAR38s installed on single bulb fixtures along the store front. The exterior fixtures are controlled by a timer based on the season of the year. The season schedule is as follows: summer season 7:30pm-12:30am; winter season 4:00pm-12:30am. Inside the facility throughout the sales
DNV KEMA Energy & Sustainability
KEMA, Inc. February 19, 2014 C-15
space, the bulbs were installed into track lights along the store ceiling. There are 17 individual tracks, containing multiple bulbs in the entire space. There were 182 PAR30s installed, and there was no track of the remaining 48 bulbs. The facility did not have extra LED bulbs in back stock. The facility contact ensured that what was installed is what they received through the program. This is also the case for the remaining 9 PAR38 bulbs that were not found. The assumption for tracking hours of use are (4500) and the logged average hours of use are (2502).
Site I0682 Facility type: educational Tracking: (12) PAR20 8 watt LED, (120) PAR30 14 watt LED
Onsite Actual: (10) PAR20 8 watt LED, (99) PAR30 12 watt LED
Baseline: 65W incandescent floods
This is an educational facility. The bulbs through the program were installed in the auditorium and hall by the front office. The front hall/lobby consisted of 31 PAR20 bulbs that are controlled by a timer. The timer schedule is from 6am to 6pm. The entire space is controlled by one circuit. There are 99 PAR30 bulbs throughout the entire auditorium, 16 of which are powered by the facility’s backup generator and are only operational if the facility loses power. There are 19 12W Phillips PAR30 bulbs in back stock along with 2 8W Sylvania PAR20. The assumption for tracking hours of use are (4500) and the logged average hours of use are (1548).
Site I0438 Facility type: municipalities - fire house, police station, DPW, public library Tracking: (2000) 28 watt T8 lamps
Onsite Actual:
526 bulbs installed in one-lamp, two-lamp, and three-lamp fixtures in the fire house
351 bulbs installed in one-lamp and two-lamp fixtures in the DPW facility
319 bulbs installed in the police station
804 bulbs installed in the library
Baseline: (2000) 32 watt T8 lamps
This facility consisted of multiple facility types spreading throughout the town. The primary contact (a city electrician) identified that 2,000 bulbs were installed throughout the town, primarily in the fire house, police station, DPW, and the public library. Inventories were completed in the fire house, police station and DPW. Library was rescheduled due to operating hours. There are possibly more
DNV KEMA Energy & Sustainability
KEMA, Inc. February 19, 2014 C-16
facilities that received this type of bulbs, but we could not identify the locations of these facilities. The assumption for tracking hours of use are (3380) and the logged average hours of use are (3512).
Issue: The walk through of the police station was very limited due to security reasons. There might be more bulbs in the facility than observed. Police staffs were very enigmatic on what was actually installed through the program. We were not able to get access to all spaces where bulbs were installed, therefore, there might be fixtures that were not accounted for.
Site I1216 Facility type: educational – boarding/prep school Tracking: (133) MR16 8 watt LED, (22) PAR20 8 watt LED, (222) PAR30 15 watt LED, (169)
PAR38 14 watt LED
Onsite Actual: (133) MR16 6 watt LED, (22) PAR20 8 watt LED, (222) PAR30 15 watt LED, (169) PAR38 14 watt LED
Baseline:13W/26W CFLs for main admissions building, 60W/20W halogen for visual arts hall, 20W halogens, 13W CFLs, and 65W incandescent bulbs for survey/dining hall
This is a boarding school. The LED lights for this program were installed in four separate locations on campus, including the main admissions building, visual arts hall, survey/dining hall, and hockey rink facility. The assumption for tracking hours of use are (4500) and the logged average hours of use are (3332).
Site I1629 Facility type: Educational Tracking: (10) MR16 8 watt LED, (10) PAR20 8 watt LED
Onsite Actual: (10) MR16 6 watt LED, (10) PAR20 8 watt LED
Baseline: 50W halogens
This is an engineering and science building. The 180 T8 bulbs were installed in the building hallways throughout the six floors. The 10 PAR20 bulbs were installed on certain floors above the exterior elevators. Eight of the 10 MR16 bulbs were installed in track lights in the hallway, with four on each of the two tracks. The contact also mentioned that there were two halogen bulbs installed on each track to eliminate the “flickering” of the new MR16s. The assumption for tracking hours of use are (4500) and the logged average hours of use are (8633).
Site I1628 Facility type: Educational

DNV KEMA Energy & Sustainability
KEMA, Inc. February 19, 2014 C-17
Tracking: (200) MR16 8 watt LED, (100) PAR20 8 watt LED, (42) PAR30 15 watt LED, (202) PAR38 14 watt LED
Onsite Actual: (166) MR16 8 watt LED, (346) PAR20 8 watt LED, (155) PAR30 15 watt LED, (169) PAR38 14 watt LED
Baseline: 50W halogens, and 75 watt incandescent
This is a museum. Bulbs were installed throughout the entire museum in track lighting and display cases in all exhibit rooms and gift shop. The museum has classrooms and offices, but no LED bulbs were installed in those spaces, and field staff was not permitted into those spaces due to being locked. The assumption for tracking hours of use are (4500) and the logged average hours of use are (4729).
Site I1679 Facility type: Manufacturing/retail
Tracking: (28) PAR38 14 watt LED, (13) PAR30 15 watt LED
Onsite Actual: (14) PAR38 14 watt LED, (4) PAR30 15 watt LED
Baseline: 50W halogens
This is a manufacturing and retail facility. The bulbs were installed in the showroom and the warehouse. Fourteen of the 28 PAR38 bulbs were installed in movable loading dock lights in the warehouse, and into track lights in the showroom. Five of the 13 PAR30 bulbs were installed in the showroom. The site contact informed the field staff that they would wait to replace the burned-out halogen bulbs with the new ones. The assumption for tracking hours of use are (4500) and the logged average hours of use are (925).
Site I3036 Facility type: Restaurant
Tracking: (4) MR16 8 watt LED, (64) PAR30 LED 15 watt LED
Onsite Actual: (4) PAR20 8 watt LED, (64) PAR30 LED 15 watt LED
Baseline: 75W floods
This is a restaurant. The facility did not receive the MR16 bulbs, but instead received and installed 4 PAR20 bulbs. The model number for these bulbs was LED8PAR20/DIM/827/FL36. The site did receive the PAR30 bulbs and installed 46 of them at the time of the site visit. All PAR30 bulbs are on dimmable switches. The restaurant has a bar area with 11 recessed can fixtures that currently installed Sylvania 75W flood bulbs that are also on dimmers. The site contact expressed that the bar area did

DNV KEMA Energy & Sustainability
KEMA, Inc. February 19, 2014 C-18
not change out bulbs because the LED bulbs were too bright even with the dimmers. The assumption for tracking hours of use are (4500) and the logged average hours of use are (2699).
Site I1476
Facility type: school
Tracking: (300) PAR38 14 watt LED
Onsite Actual: (267) installed, see below. (96) in storage
Baseline: not available
This is a school. There were 267 SHARP DL-L16P3830A lamps found installed, different from what was expected to be found. There were 96 more of these bulbs in storage. The site contact was the janitor and the purchasing contact. The site contact was 80% certain that the SHARP bulbs are the upstream LEDs. Eight lighting loggers were installed in various space types with the understanding that the bulb make and model was most likely incorrectly recorded or a change was made to the order. The assumption for tracking hours of use are (4500) and the logged average hours of use are (4979).
Site I1997
Facility type: school
Tracking: (37) PAR38 14 watt LED
Onsite Actual: (8) PAR38 18 watt LED
Baseline: 75 watt halogen
This is a school. Eight of the 37 PAR38 bulbs were found in the auditorium, and two lighting loggers were installed. The site contact, who is the school janitor, pointed out that the remaining LED bulbs were different from what we have on file. These bulbs are Sylvania LED8PAR20/DIM/830/FL36, and the quantity found was 49. He also said there is a good chance that the other PAR38 bulbs went to different schools. The purchasing contact, who is also the school electrician, was on leave for two months. The assumption for tracking hours of use are (4500) and the logged average hours of use are (0).
Site I2031
Facility type: Machine engineering
Tracking: (3) PAR30 15 watt LED, (6) PAR38 14 watt LED
DNV KEMA Energy & Sustainability
KEMA, Inc. February 19, 2014 C-19
Onsite Actual: Not installed
Baseline: not available
This is a company that designs robotic machinery. Forty-two FO28/841/XV/SS/ECO bulbs were installed in two different buildings, mostly in the office areas. The remaining 168 FO28/841/XV/SS/ECO bulbs are stored for later use. The site contact replaced burned out lamps with the upstream lamps. The LED PAR bulbs have not yet been installed. Four loggers were installed, two in each building. The assumption for tracking hours of use are (4500) and the logged average hours of use are (X).
Site I1418
Facility type: Retail
Tracking: (97) PAR20 8 watt LED, (44) PAR30 15 watt LED
Onsite Actual: (97) PAR20 8 watt LED, (44) PAR30 15 watt LED
Baseline: 50W halogen spots (100% confidence); 20W halogen spots (80% confidence)
This is a large hair salon. Seventy PAR20 bulbs were installed on site, 18 bulbs were found in storage, and 9 bulbs were not found. It is not likely that these bulbs burned out and were discarded, and were possibly used elsewhere. The 44 LED15PAR300LN/DIM were installed in the main room. The site contact, who is in charge of the salon lighting, mentioned that most of the program bulbs were installed in the main salon room and a small quantity was installed in the basement therapeutic rooms. The assumption for tracking hours of use are (4500) and the logged average hours of use are (3045).
Site I1626
Facility type: university
Tracking: (30) PAR30 15 watt LED, (84) PAR38 14 watts LED
Onsite Actual: (30) PAR20 8 watt LED, (84) PAR38 15 watts LED
Baseline: 50 watt halogen, 67 watt halogen
This is a university. There are 72 PAR38 bulbs installed in the lecture room. The remaining 12 bulbs were most likely spread throughout the campus in various test locations. The site contact said he did not know the exact location of the 12 bulbs. The LED15PAR30LN/DIM/830/FL40 bulbs were not found. The site contact said that he is very confident that these 30 bulbs are the LED8PAR20/DIM/827/FL36 bulbs, of which 24 were installed. He based his rational on the bulb

DNV KEMA Energy & Sustainability
KEMA, Inc. February 19, 2014 C-20
quantity and the rooms where they could be installed. The remaining 6 bulbs were not found. The assumption for tracking hours of use are (4500) and the logged average hours of use are (1684).
Site I0909
Facility type: Office/research/design building
(30) MR16 8 watt LED, (490) PAR20 8 watt LED, (485) PAR30 15 watt LED, (366) PAR38 14 watt LED
Onsite Actual: (30) MR16 8 watt LED, (490) PAR20 8 watt LED, (485) PAR30 15 watt LED, (366) PAR38 18 watt LED
Baseline: (520) 50 watt halogen, (851) 75 watt halogen
The program bulbs are spread throughout various buildings. The contact explained that all the T8s were installed in the corporate office building, and that most of the LED bulbs were installed in the R&D building. The corporate and R&D buildings are located another location. The site contact mentioned that the program bulbs were installed in three additional buildings, but he was confident that most of the bulbs were installed in the corporate and R&D buildings. The site contact also mentioned that this order is small compared to the bulb quantity in all their company buildings, and that they purchased other orders of the same bulbs as well. The site contact was highly knowledgeable of the bulbs listed for this site. He stated an estimate of 200 PAR20 bulbs were installed at a different building in another location and that an estimated of 250 PAR30 bulbs were installed in a building in yet another location. The assumption for tracking hours of use are (4500) and the logged average hours of use are (4483).
Corporate office building: this building consists of five floors and the ground floor. The 480 T8 bulbs were installed throughout the six floors. Eighteen lighting loggers were installed in this building.
R&D building: this building has the following LED bulbs installed: 30 MR16s, 265 PAR20s and PAR20s (SKU#78803) combined, 166 PAR30s, and 265 PAR38s. Parts of this building were not accessible and might account for the missing bulbs. Twelve lighting loggers were installed in the R&D building.
Site I2882
Facility type: medical school
Tracking: (100) PAR20 8 watt LED, (1176) PAR38 14 watt LED, (198) MR16 8 watt LED
Onsite Actual: (100) PAR20 8 watt LED, (330) PAR38 14 watt LED, (198) MR16 8 watt LED
DNV KEMA Energy & Sustainability
KEMA, Inc. February 19, 2014 C-21
Baseline: 75W incandescent, 50W halogens
This site consists of two different buildings: one building and a library. The building is part of a medical center, and the PAR20 bulbs were installed on tracks throughout the building. The track lighting is primarily located in the lobbies and waiting areas, and there are approximately 200 of them installed within the Lakeside Building. The 198 MR16 bulbs were installed in the lobbies and general open areas throughout the Lakeside building. (846) PAR38 lamps are in storage and will be installed at a later time.
The Library is comprised of two sections: the main entry and the main library. The main entry has 80 PAR38 fixtures installed that run approximately 8760 hours. Students and staff have access to this area 24/7. There are approximately 250 PAR38 bulbs installed throughout the three levels of the main library. The library also runs approximately 8760 hours. The remaining 846 PAR38 bulbs were installed in the various amphitheaters throughout the campus. The facility personnel did a test trail with the LED bulbs in one of the amphitheaters to determine necessary foot candle output. The assumption for tracking hours of use are (4500) and the logged average hours of use are (8055).
Site I1348
Facility type: college
Tracking: (555) MR16 8 watt LED, (100) PAR20 8 watt LED, (300) PAR30 15 watt LED, (5) PAR38 14 watt LED
Onsite Actual: (555) MR16 8 watt LED, (100) PAR20 8 watt LED, (300) PAR30 15 watt LED, (5) PAR38 14 watt LED
Baseline: (960) 50 watt halogen
This site had four buildings retrofitted on campus. The onsite visit counted 555 MR16 bulbs installed, and approximately 35 PAR38 bulbs installed. However, it was difficult to find all 300 PAR30 and 100 PAR20 bulbs. The facility contact was very knowledgeable about the project and mentioned that more buildings might have these bulbs installed because a lot of classrooms had a combination of PAR20 and PAR30 bulbs. The assumption for tracking hours of use are (4500) and the logged average hours of use are (1619).
Site I2186
Facility type: Office building
Tracking: (20) PAR20 8 watt LED, (34) PAR30 15 watt LED, (38) PAR38 14 watt LED
Onsite Actual: (20) PAR20 8 watt LED, (34) PAR30 15 watt LED, (38) PAR38 14 watt LED
DNV KEMA Energy & Sustainability
KEMA, Inc. February 19, 2014 C-22
Baseline: (221) 32 watt T8 lamps
This site was split between two buildings and was a change from T8 lamps to LED lamps: The first building has 78 PAR38 bulbs installed including 48 unused extra ones. The rest 143 bulbs were installed in the second building. The first building runs on a timer (7am to 11 pm) excluding the restrooms on the third floor which will be turned off at 11pm as well by the janitor during the weekdays. The timer for the second building runs from 6am to 10pm. All lights are turned off during the weekends except for the five emergency lamps (PAR38s). The assumption for tracking hours of use are (4500) and the logged average hours of use are (5462).
Site I2274
Facility type: High school
Tracking (1) PAR30 15 watt LED
Onsite Actual: (0)
Baseline: Not available
One LED PAR30 bulb was purchased through the program. However, this bulb could not be found installed or in storage. Site contact was not aware of any LED purchases through the listed distributor.
Site I0776
Facility type: Hospital
Tracking: (39) MR16 8 watt LED, (28) PAR20 8 watt LED, (414) PAR30 15 watt LED, (305) PAR38 14 watt LED.
Onsite Actual: (39) MR16 6 watt LED, (28) PAR20 8 watt LED, (414) PAR30 15 watt LED, (305) PAR38 14 watt LED.
Baseline: (786) 2x11 watt CFL
The site contact was not familiar with the installation but was in charge of facilitating the purchase of the bulbs. The main building had LED PAR30 bulbs installed in common areas such as lobbies, hallways, and conference rooms. Two lighting loggers were installed in these areas. Some PAR30 bulbs were found on site. The site contact said that there were over 30 buildings on campus that had a fixture upgrades and was not sure of the exact locations. The site electrician verified that there were over 800 LED bulbs purchased through the program. The assumption for tracking hours of use are (4500) and the logged average hours of use are (6887).
DNV KEMA Energy & Sustainability
KEMA, Inc. February 19, 2014 C-23
Site I2958
Facility type: high school
Tracking: (200) PAR30 15 watt LED, (100) PAR38 14 wall LED
Onsite Actual: (200) PAR30 15 watt LED, (100) PAR38 18 wall LED
Baseline: (300) 75W halogen
The site contact verified that approximately 300 bulbs were purchased through the program and they were in storage. He also mentioned that these LED bulbs were not rebated and he had paid full price. The PAR30 bulbs will be distributed through the rest of the school district as needed. However, the site contact was unsure if and where the PAR38 bulbs would be used due to their size. The site was retrofitted with 16 LED PAR30 bulbs in the school’s auditorium. The assumption for tracking hours of use are (4500) and the logged average hours of use are (792).
Site I0891
Facility type: ski resort/condo association
Tracking: (2) PAR20 8 watt LED
Onsite Actual: (2) PAR38 LED not installed
Baseline: Not available
The two LED bulbs in storage were actually PAR38s, not PAR20s according to tracking. The two bulbs were not installed because they were not compatible with the fixture type on track lighting. Only two bulbs were purchased at this time because the facility was trying them out first. The resort has a plan to replace all 25W CFLs with LED lights. No loggers were installed.
Site I1243
Facility type: boarding high school
Tracking: (100) PAR20 8 watt LED, (300) PAR30 15 watt LED, (136) PAR38 14 watt LED
Onsite Actual: (100) PAR20 8 watt LED, (300) PAR30 15 watt LED, (136) PAR38 14 watt LED
Baseline: (100) 13 watt CFL, (436) 18 watt CFL
Multiple buildings on campus were retrofitted with LED. The assumption for tracking hours of use are (4500) and the logged average hours of use are (5407).

DNV KEMA Energy & Sustainability
KEMA, Inc. February 19, 2014 C-24
Site I2056
Facility type: restaurant
Tracking: (150) PAR30 15 watt LED, (10) PAR38 14 watt LED
Onsite Actual: (150) PAR30 15 watt LED, (10) PAR38 18 watt LED
Baseline: (160) 75 watt halogen
All bulbs were installed. The assumption for tracking hours of use are (4500) and the logged average hours of use are (5298).
Site I1428
Facility type: building management
Tracking: (202) MR16 8 watt LED, (205) PAR30 15 watt LED, (104) PAR30 15 watt LED
Onsite Actual: (202) MR16 8 watt LED, (205) PAR30 15 watt LED, (104) PAR30 15 watt LED
Baseline: (202) 2x13 watt CFL, (205) 55 watt halogen, (104) 55 watt halogen
This site consists of 11 buildings that are occupied by businesses. Most buildings are offices and some are residences. The site contact was only able to show three buildings where lighting loggers was installed (one in each building). The PAR30s were installed in lobbies and hallways where operation hours are usually 24/7. The MR16s were installed in some conference rooms and other random track lightings. The exact number of bulbs purchased and installed could not be verified, nor could the type or wattage of the previous bulbs installed. The assumption for tracking hours of use are (4500) and the logged average hours of use are (4731).
Site I3686 Facility type: school
Tracking: (91) PAR38 14 watt LED
Onsite Actual: (48) PAR30 14 watt LED, (43) PAR38 15 watt LED
Baseline: (48) 250 watt metal halide, (43) 2x4’ T5 28 watt
According to site contact, they actually bought 43 PAR38s and 48 PAR30s. Among them, 26 PAR38s were installed in C240 LRG GRP INSTRUCTION room, and 17 PAR38s were installed in the library. The 48 PAR30s were installed in auditorium but could not be verified due to limited access. There are two HVAC units on site, and both are rooftop, DX cooling, single zone, and natural gas

DNV KEMA Energy & Sustainability
KEMA, Inc. February 19, 2014 C-25
fired. Model numbers are respectively SFHFC30E and SFHFC20E. The assumption for tracking hours of use are (4500) and the logged average hours of use are (2253).
Site L1482
Facility Type: Health Club
Tracking: 30 – GE 72866 F28T8/XL/SPX41/ECO
Baseline: T8’s and T12’s
Health care facility purchased 30 bulbs through upstream program. Bulbs were installed as needed in different areas of the building. It is unknown for sure where these model bulbs were installed. Found on site were 25W and 32W T8’s, no 28W. Facility consists of workout areas, private offices, hallways, class rooms, tennis courts and basketball courts. Unable to confirm bulbs in high ceiling areas (tennis courts, basketball courts). General counts were 72-32W 2L fixtures and 56 – 25W 2L fixtures. The 32W fixtures were in workout areas and the 25W were in lobby hallways. Packaged RTU/NG Heating. Open Monday through Friday 5am – 10pm, Saturday 6:30am – 8pm and Sunday 7am – 6pm. Cleaning services stay later. Closed Christmas, New Years, Fourth of July and reduced holiday hours on other major holidays.
Site I2033 Facility Type: Retail Store Tracking: (87) PAR30 15 watt LED, and (20) PAR20 8 watt LED Onsite Actual: (87) PAR30 15 watt LED, and (20) PAR20 8 watt LED Baseline: 75 watt Incandescent Retail store, program bulbs installed in general sales area. (14) Par 30s installed, (73) Par 30s not
installed. (2) Par20s installed and the remaining (18) were never received by the retail store.
Site I0786 Facility Type: Office Tracking: (2) PAR38 14 watt LED Onsite Actual: (2) PAR38 14 watt LED Baseline: 100 watt Halogen Open office area, program bulbs installed in track light fixtures. The site contact purchased more of
the same bulbs to replace the rest of the 100 watt halogens in the office. All together (65) were purchased because it is good quality light and impressive to their clients. The assumption for tracking hours of use are (4500) and the logged average hours of use are (2312).
Site I0699 Facility Type: Healthcare-Clinic Tracking: (20) PAR30 15 watt LED Onsite Actual: (16) PAR30 16 watt LED, (4) of the baseline bulbs still installed. Baseline: 35 watt Halogen

DNV KEMA Energy & Sustainability
KEMA, Inc. February 19, 2014 C-26
Healthcare facility, the program bulbs are installed in the activity room. There are (4) program bulbs not installed. The assumption for tracking hours of use are (4500) and the logged average hours of use are (4632).
Site I0030 Facility Type: Multi Family/Apartment complex Tracking: (576) 28 watt T8 bulbs Onsite Actual: (576) 28 watt T8 bulbs Baseline: (576) 32 watt T8 bulbs Apartment complex with (274) units, each unit has (2) program bulbs in the kitchen. The total
installed in kitchens is (548). The remaining (28) are installed in the maintenance storage area, kitchen, and bathroom. The assumption for tracking hours of use are (3380) and the logged average hours of use are (3276).
Site I1674 Facility Type: Court House Tracking: (15) PAR30 15 watt LED Onsite Actual: (15) PAR30 15 watt LED Baseline: (15) Halogen 50 watt Court House, the program bulbs are primarily installed in offices, open office areas, and one in a
office closet. The assumption for tracking hours of use are (4500) and the logged average hours of use are (1844).
Site L3036 Facility Type: Dining/Family Tracking: (4) MR16 8 watts LEDs, (64) PAR30 15 watt LED Onsite Actual: (4) PAR20 5.5 watt LED, (64) PAR30 15 watt LED Baseline: (48) 75 watt incandescent. Restaurant, the program bulbs are installed primarily in the dining area of the restaurant, and one in
the foyer. The MR16s in tracking were not found and the correct quantity of PAR20s replaced the MR16s. The assumption for tracking hours of use are (4500) and the logged average hours of use are (2699).
Site L3686 Facility Type: School/University Tracking: (91) PAR38 14 watt LED Onsite Actual: (43) PAR38 14 watt LED, (48) PAR30 15 watt LED Baseline: (43) 60 watt incandescent, (48) 250 watt metal halide School, the program bulbs are installed in classrooms, the library, and the auditorium. The quantities
match up but PAR30 LED bulbs were included with the PAR38 LED bulbs. The PAR38 LED bulbs are installed in the classrooms and library. The PAR30 LED lamps are installed in the auditorium. The assumption for tracking hours of use are (4500) and the logged average hours of use are (2569).
Site L3693 Facility Type: Retail Tracking: (6) PAR38 14 watt LED, (30) PAR30 15 watt LED Onsite Actual: (2) PAR38 14 watt LED Baseline: (36) 23 watt LED

DNV KEMA Energy & Sustainability
KEMA, Inc. February 19, 2014 C-27
Retail store, two of the program PAR38 bulbs are installed in the retail section. The remaining of the program bulbs are not installed. The assumption for tracking hours of use are (4500) and the logged average hours of use are (2575).
Site L0029 Facility Type: Workshop Tracking: (6) 28 watt T8 lamps Onsite Actual: (4) 28 watt T8 lamps Baseline: (4) 32 watt T8 lamps Airport hangar, the site received six 28 watt T8 bulbs and installed four in a hangar. They replaced 32
watt T8 bulbs. The assumption for tracking hours of use are (3380) and the logged average hours of use are (1405).
Site L0082 Facility Type: School/University Tracking: (3420) 28 watt T8 bulbs Onsite Actual: (2437) 28 watt T8 bulbs Baseline: (3420) 32 watt T8 bulbs School, the program bulbs are primarily installed in classrooms. (1648) T8 bulbs are installed in
classrooms, (242) in hallways, and the remaining (547) are installed in offices, teacher’s lounge, maintenance areas, and the library. (459) are in storage onsite and (524) are stored at a different school. The assumption for tracking hours of use are (3380) and the logged average hours of use are (2634).
Site L0114 Facility Type: School/University Tracking: (48) 28 watt T8 bulbs Onsite Actual: (4) 28 watt T8 bulbs Baseline: (48) 32 watt T8 bulbs School, (4) of the program bulbs are installed in a hallway. The hallway has (48) sockets and the
program bulbs are intended for this space. The site contact is using the program bulbs on an as needed basis which explains why (4) have been used. The remaining (44) are in storage and will be used in the future. The assumption for tracking hours of use are (3380) and the logged average hours of use are (2492).
Site L0135 Facility Type: Healthcare-Clinic Tracking: (880) 28 watt T8 Onsite Actual: (880) 28 watt T8 Baseline: (880) 32 watt T8 Healthcare facility, the program bulbs are installed throughout the 4th, 5th, and 6th floor of the
building. The assumption for tracking hours of use are (3380) and the logged average hours of use are (4260).
Site L0649 Facility Type: Office Tracking: (6540) 28 watt T8 bulbs Onsite Actual: (3235) 28 watt T8 bulbs

DNV KEMA Energy & Sustainability
KEMA, Inc. February 19, 2014 C-28
Baseline: (6540) 32 watt T8 bulbs Office, (3235) of the tracking (6540) bulbs are installed. The contractor that installed the bulbs claims
he only purchased the (3235). There was extensive time spent going through invoices to come to this result. This is an office building, most of the program bulbs are installed in open office areas, private offices, and conference rooms. The remaining bulbs are installed in hallways, kitchens, and mechanical rooms. The assumption for tracking hours of use are (3380) and the logged average hours of use are (2907).
Site L1191 Facility Type: School/University Tracking: (6600) 28 watt T8 lamps Onsite Actual: (5947) 28 watt T8 lamps Baseline: (6600) 32 watt T8 lamps This site is two schools connected. (5947) of the (6600) program bulbs are installed in the schools.
The remaining (653) are in storage. The majority (3286) of the installed program bulbs are installed in classrooms. (1215) program bulbs are installed in offices, bathrooms, lobbies, closets, stairwells, and halls. (1226) programs bulbs are installed in libraries, kitchen, teacher’s lounges, and cafes. The assumption for tracking hours of use are (3976) and the logged average hours of use are (1900).
Site 0667 Facility Type: Schools/University Tracking: (4020) 28 watt T8 bulbs Onsite Actual: (2449) 28 watt T8 bulbs Baseline: (4020) 32 watt T8 bulbs This school has (1760) of the program bulbs installed in classrooms. (120) of the program bulbs are
installed throughout the cafe, teacher’s lounge, and kitchen. The library has (68) of the program bulbs installed. The offices in total have (63) of the program bulbs installed. (438) of the program bulbs are installed in maintenance areas, hallways, and bathrooms. (1571) of the program bulbs are not installed. The assumption for tracking hours of use are (3380) and the logged average hours of use are (1145).
Site L1505 Facility Type: Schools/University Tracking: (115200) 28 watt T8 bulbs Onsite Actual: (1950) 28 watt T8 bulbs Baseline: (115200) 32 watt T8 bulbs This school has program bulbs for this site have been divided amongst different buildings and most of
the program bulbs are in storage. (1160) program bulbs are installed in classrooms, (736) in halls, and (54) in the main office. There are (1680) stored in the maintenance building, (110,880) stored in the town municipal warehouse, and (736) stored in the high school.
Site L1532 Facility Type: Office Tracking: (60) 28 watt T8 bulbs Onsite Actual: (60) 28 watt T8 bulbs Baseline: (60) 32 watt T8 bulbs Office with open area space and private offices. All (60) of the program bulbs are installed. The
assumption for tracking hours of use are (3380) and the logged average hours of use are (1761).

DNV KEMA Energy & Sustainability
KEMA, Inc. February 19, 2014 C-29
Site L1866 Facility Type: Dining/Bar Tracking: (21) PAR30 15 watt LED Onsite Actual: (3) PAR30 15 watt LED, (16) PAR30 12 watt LED Baseline: (21) 60 watt incandescent This site is a bar and the actual onsite program bulbs were found to be 15 watt and 12 watt LED
PAR30s. Two of the 15 watt PAR30 lamps burned out before the on-site visit. (3) PAR30 15 watt LED, (16) PAR30 12 watt LED are installed in the bar seating area. The assumption for tracking hours of use are (4500) and the logged average hours of use are (4775).
Site L1920 Facility Type: School/University Tracking: (52) PAR30 15 watt LED, (113) PAR38 14 watt LED Onsite Actual: (40) PAR30 15 watt LED, (23) PAR38 18 watt LED Baseline: (52) 75 watt halogen, (113) 100 watt halogen Notes: (12) of the PAR30 LED and (90) of the PAR28 LED program bulbs are in storage. The site
contact had issues with using them with dimmers. (40) PAR30 program bulbs are installed in the auditorium and (23) of the PAR38 LED bulbs are installed in the art room, bathroom, and lobby. The assumption for tracking hours of use are (4500) and the logged average hours of use are (354).
Site L2113 Facility Type: Hotel Tracking: (198) 17 watt LED A bulbs Onsite Actual: (149) 8 watt LED A bulbs Baseline: (198) 90 watt halogen This hotel has (31) of the program lamps installed in the lobby area and cafe. (118) of the program
bulbs are installed in salons and meeting rooms. (49) Program bulbs are not installed. The assumption for tracking hours of use are (2800) and the logged average hours of use are (4932).
Site L2142 Facility Type: School/University Tracking: (9) 17 watt LED A bulbs, (100) PAR30 15 watt LED Onsite Actual: (9) 8 watt LED A bulbs, (100) PAR30 12 watt LED Baseline: (9) 60 watt incandescent bulbs, (100) 75 watt halogen The University has the program bulbs spread through the campus. Many buildings were visited to
find the program bulbs. The assumption for tracking hours of use are (4365) and the logged average hours of use are (5186).
Site L2275 Facility Type: Retail Tracking: (15) MR16 8 watt LED, (90) PAR30 15 watt LED, (6) PAR38 14 watt LED Onsite Actual: (15) MR16 5.6 watt LED, (86) PAR30 15 watt LED, (6) PAR38 20 watt LED Baseline: (15) 50 watt halogen, (96) 90 watt halogen This retail store has the program MR16 bulbs installed in the display windows. The PAR30 are
installed throughout the two showrooms. (4) program PAR30s are not installed. The (6) PAR38 bulbs are installed outside on the store sign. The assumption for tracking hours of use are (4500) and the logged average hours of use are (3057).

DNV KEMA Energy & Sustainability
KEMA, Inc. February 19, 2014 C-30
Site L2409 Facility Type: Religious building Tracking: (24) 17 watt LED A bulbs Onsite Actual: (24) 12 watt LED A bulbs Baseline: (24) 60 watt incandescent bulbs This religious building has all (24) 12 watt LED bulbs installed in the main room. The assumption for
tracking hours of use are (2800) and the logged average hours of use are (1740). Site L2529 Facility Type: Retail Tracking: (156) PAR30 15 watt LED, (336) PAR38 14 watt LED Onsite Actual: (156) PAR30 15 watt LED, (336) PAR38 18 watt LED Baseline: (156) 75 watt halogen, (336) 100 watt halogen This retail store has all program bulbs installed and they are located in the showroom. The assumption
for tracking hours of use are (4500) and the logged average hours of use are (3387). Site L2658 Facility Type: Religious building Tracking: (6) PAR30 15 watt LED Onsite Actual: (6) PAR30 12 watt LED Baseline: (6) 75 watt halogen This building has the program bulbs installed in the office hallway and the kitchen. The assumption
for tracking hours of use are (4500) and the logged average hours of use are (1917). Site L2719 Facility Type: Office Tracking: (144) PAR30 15 watt LED Onsite Actual: (110) PAR30 15 watt LED Baseline: (144) 13 watt CFL The program bulbs are installed in the foyer and hallway. They are on all day, seven days a week. The
assumption for tracking hours of use are (4500) and the logged average hours of use are (8760). Site L2771 Facility Type: Workshop Tracking: (14) PAR38 14 watt LED Onsite Actual: (6) PAR38 14 watt LED Baseline: (14) 90 watt halogen This workshop has (5) PAR38 14 watt LED installed in outside floodlights, and (1) installed in a
hallway. The assumption for tracking hours of use are (4500) and the logged average hours of use are (643).
Site L2796 Facility Type: Restaurant Tracking: (75) PAR30 15 watt LED Onsite Actual: (75) PAR30 15 watt LED Baseline: (75) 65 watt incandescent
DNV KEMA Energy & Sustainability
KEMA, Inc. February 19, 2014 C-31
This restaurant has the (75) program bulbs installed in the dining and bar area of the restaurant. They have experienced issues with the bulbs flickering when in use with dimmers. The assumption for tracking hours of use are (4500) and the logged average hours of use are (6347).
Site L2869 Facility Type: Fast food Tracking: (15) PAR30 15 watt LED Onsite Actual: (15) PAR30 15 watt LED Baseline: (15) 75 watt halogen This fast food store has the (15) program bulbs installed at the cashier and food line. The assumption
for tracking hours of use are (4500) and the logged average hours of use are (6356). Site L3222 Facility Type: Office Tracking: (6) decorative 5 watt LED, (16) 17 watt LED A lamps, (34) PAR38 14 watt LED Onsite Actual: (4) decorative 3 watt LED, (10) 12 watt LED A lamps, (25) PAR38 14 watt LED Baseline: New construction. This office area is new construction therefor the evaluation assumed the same baseline. (2) of the
decorative 5 watt LED, (6) 17 watt LED A lamps, and (9) PAR38 14 watt LED have not been installed. The PAR38 bulbs are located in three different offices and the remaining program bulbs are installed in the hallways/entry way. The assumption for tracking hours of use are (4023) and the logged average hours of use are (2583).
Site L3459 Facility Type: Hotel Tracking: (150) 17 watt LED A lamps Onsite Actual: (150) 12 watt LED A lamps Baseline: (150) 100 watt incandescent The program LED A lamps are all installed. (109) of the program bulbs are installed in the foyer and
hallways. The remaining (41) are installed in the banquet room and AV closet. The assumption for tracking hours of use are (2800) and the logged average hours of use are (5824).
Site L3460 Facility Type: Retail Tracking: (109) PAR20 8 watt LED, (11) PAR38 14 watt LED Onsite Actual: (109) PAR20 7 watt LED, (11) PAR38 20 watt LED Baseline: (109) 50 watt halogen, (11) 90 watt halogen This retail store has all program bulb installed. The bulbs are installed in the showroom area. The
assumption for tracking hours of use are (4500) and the logged average hours of use are (2733). Site L3510 Facility Type: Hotel Tracking: (220) PAR30 15 watt LED, (130) PAR20 8 watt LED, (40) MR16 8 watt LED, (50)
PAR38 14 watt LED. Onsite Actual: (220) PAR30 15 watt LED, (130) PAR20 8 watt LED, (40) MR16 8 watt LED, (50)
PAR38 14 watt LED.

DNV KEMA Energy & Sustainability
KEMA, Inc. February 19, 2014 C-32
Baseline: (220) 100 watt incandescent, (130) 75 watt halogen, (40) 50 watt metal halide, (50) 90 watt halogen.
This hotel has all the program bulbs installed. (210) program bulbs are installed in meeting rooms and suites. (230) program bulbs are installed in the lobby area, restaurant, and bathroom. The assumption for tracking hours of use are (4499) and the logged average hours of use are (2793).
Site L3835 Facility Type: Transportation Tracking: (10) PAR38 14 watt LED Onsite Actual: (10) PAR38 17 watt LED Baseline: (10) 150 watt halogen The program bulbs are installed outside. The assumption for tracking hours of use are (4500) and the
logged average hours of use are (4380). Site L3918 Facility Type: Exercise Center Tracking: (12) 12 watt LED A lamps Onsite Actual: (0) 12 watt LED A lamps Baseline: (12) 60 watt incandescent The program bulbs have not been installed. They will replace 60 watt incandescent A-lamps. The
assumption for tracking hours of use are (2800) and the logged average hours of use are (0). This site was not logged because the program bulbs have not been installed.
Site L3985 Facility Type: Hospital Tracking: (12) PAR30 15 watt LED, (6) PAR20 8 watt LED, (20) PAR38 14 watt LED Onsite Actual: (12) PAR30 15 watt LED, (6) PAR20 8 watt LED, (20) PAR38 14 watt LED Baseline: (12) 65 watt incandescent, (6) 50 watt incandescent, (20) 90 watt halogen The program bulbs are all installed. The PAR30 LED bulbs are installed in the doctors lounge. The
PAR20 LED bulbs are also installed in the doctor’s lounge. The PAR38 LED bulbs are installed in the radiology room. The assumption for tracking hours of use are (4500) and the logged average hours of use are (2889).
Site 4161 Facility Type: Retail Tracking: (60) 17 watt LED A lamps, (52) PAR38 14 watt LED Onsite Actual: (60) 8 watt LED A lamps, (52) PAR38 19.5 watt LED Baseline: (60) 60 watt incandescent, (52) 75 watt halogen The (31) A-lamps and (program bulbs are installed outside of this multi retail store establishment.
The assumption for tracking hours of use are (3671) and the logged average hours of use are (6193).
Site L4185 Facility Type: School/University Tracking: (176) PAR38 14 watt LED, (64) PAR30 15 watt LED, (6) 17 watt LED A-lamps Onsite Actual: (176) PAR38 18 watt LED, (30) PAR30 15 watt LED, (6) 12 watt LED A-lamps Baseline: (176) 100 watt incandescent, (64) 75 watt incandescent, (6) 100 watt incandescent This university has the PAR38s primarily installed in presentation room, halls, and classrooms. The
PAR30 LED lamps are installed in the lobby and hallways. The program bulbs are spread throughout

DNV KEMA Energy & Sustainability
KEMA, Inc. February 19, 2014 C-33
various buildings on the main campus and a satellite campus. The assumption for tracking hours of use are (4453) and the logged average hours of use are (3300).
Site L4274 Facility Type: Parking garage Tracking: (62) PAR38 14 watt LED Onsite Actual: (62) PAR38 18 watt LED Baseline: (62) 90 watt halogen This parking garage has the program bulbs installed outside but covered by the garage roof. This is
where the buses enter and exit and the bulbs are on all the time. The assumption for tracking hours of use are (4450) and the logged average hours of use are (8755).
Site L4288 Facility Type: School/University Tracking: (42) PAR30 15 watt LED Onsite Actual: (42) PAR30 15 watt LED Baseline: (42) 26 watt CFL This university has the program bulbs installed outside around the base of a building. They are
embedded into the ground to project up on the walls of the building. Unable to installed loggers due to surrounding environment. Photocell data was used since these program bulbs are controlled by a photocell lighting system. The assumption for tracking hours of use are (4500) and the logged average hours of use are (3729).
Site L4485 Facility Type: Hotel Tracking: (530) PAR30 15 watt LED Onsite Actual: (139) PAR30 15 watt LED Baseline: (530) 15 watt CFL This site consists of three hotels, a bowling alley, and a candy store. The original contact had moved
on to a different job before the audit. In one of the hotels the program bulbs were located in bathrooms. (139) program bulbs are installed. The remaining (391) were not found and multiple contacts at the various buildings did not know the location or if they had received the total quantity. The multiple contacts include the business department and the maintenance staff. The assumption for tracking hours of use are (4500) and the logged average hours of use are (2098).
Site L4575 Facility Type: Office Tracking: (216) PAR30 15 watt LED, (121) PAR38 14 watt LED, (6) 17 watt LED A-lamps Onsite Actual: (164) PAR30 15 watt LED, (60) PAR38 14 watt LED, (6) 17 watt LED A-lamps Baseline: (164) 90 watt halogen, (83) 90 watt halogen, (6) 100 watt incandescent This is a large office building. The majority of the program bulbs are installed. (52) Program PAR30
LED bulbs are not installed. (38) program PAR38 LED bulbs are not installed. The non-installed bulbs are in storage for later use. The (6) LED A-lamps are installed in the daycare. (112) PAR30 LED bulbs are installed in showrooms throughout the building. (52) PAR30 LED bulbs are installed in the main (spine) hallway. The assumption for tracking hours of use are (4473) and the logged average hours of use are (3337).
Site L4668

DNV KEMA Energy & Sustainability
KEMA, Inc. February 19, 2014 C-34
Facility Type: Religious building Tracking: (310) PAR30 15 watt LED, (196) 17 watt LED A-lamps, (16) PAR20 8 watt LED, (162)
PAR38 14 watt LED. Onsite Actual: (102) PAR30 11 watt LED Baseline: New construction being added to existing building. The majority of program bulbs were not installed at time of audit. This is a (old) church and a new
larger church is being added to the same building. There is a school that is located in the older part of the building. The installed program PAR30 LED bulbs are installed in the old church. (46) are located in the foyer of the old church,(22) in the old church, and (34) outside in ground fixtures that project towards landscape tree and the building. The non-installed program bulbs will be installed in the new church when it is completed. The assumption for tracking hours of use are (4048) and the logged average hours of use are (1343).
Site L4680 Facility Type: School/University Tracking: (104) PAR38 14 watt LED Onsite Actual: (101) PAR38 14 watt LED Baseline: (104) 100 watt halogen The program bulbs are installed in the two church rooms. (3) program bulbs are in storage for later
use. The assumption for tracking hours of use are (4500) and the logged average hours of use are (939).
Site L4953 Facility Type: School/University Tracking: (64) 17 watt LED A-lamp, (20) MR16 8 watt LED, (33) PAR38 14 watt LED Onsite Actual: (64) 17 watt LED A-lamp, (20) MR16 8 watt LED, (33) PAR38 14 watt LED Baseline: (64) 13 watt CFL, (20) 50 watt halogen, (33) 90 watt incandescent The (64) LED A-lamps are installed in a music/theatre. The (20) MR16 LED lamps are installed in a
gift shop. The (33) PAR38 lamps are installed in a different theatre than the A-lamps. The assumption for tracking hours of use are (3563) and the logged average hours of use are (1641).
Site L5052 Facility Type: School/University Tracking: (303) PAR30 15 watt LED, (136) PAR38 14 watt LED, (74) PAR20 8 watt LED Onsite Actual: (265) PAR30 15 watt LED, (92) PAR38 14 watt LED Baseline: (303) 23 watt CFL, (136) 23 watt CFL This site consists of two large rooms for worship, office areas, small school, and a large ballroom.
The program bulbs are installed throughout these areas. The following program bulbs are not installed, (74) PAR20s, (38) PAR30s, and (44) PAR38s. They are stored for later use. The school and the smaller of the two worship areas are used often and the large worship room is used on special holidays. The assumption for tracking hours of use are (4500) and the logged average hours of use are (475).
Site L5233 Facility Type: Dining/Bar - Manufacturing Tracking: (30) PAR30 15 watt LED Onsite Actual: (18) PAR30 15 watt LED Baseline: (30) 75 watt halogen

DNV KEMA Energy & Sustainability
KEMA, Inc. February 19, 2014 C-35
This site proved difficult. The program bulbs were purchased by an electrician and installed at various projects. (15) Program bulbs were installed in a restaurant/bar. (3) Program bulbs were installed at a manufacturing company; they are installed inside of robotic plastic molding machines. (12) Program bulbs were not found at either of the two sites visited. A third site was visited which had the correct quantity of PAR30s but they were not the program bulbs. The assumption for tracking hours of use are (4500) and the logged average hours of use are (5183).
Site L5586 Facility Type: Retail Tracking: (300) PAR30 15 watt LED Onsite Actual: (57) PAR30 15 watt LED Baseline: (300) 75 watt halogen This retail store has two display rooms. There is a mix of LED, halogen, and incandescent bulbs. The
bulbs are mixed throughout the two rooms. The idea is that the blend of the three bulb types is better quality than the LEDs alone. (57) are installed, (149) verified in the back room storage area, and the remaining (94) were not found and the manager did not know where they went. The assumption for tracking hours of use are (4500) and the logged average hours of use are (3453).
Site 5361 Facility Type: Retail Tracking: (70) PAR20 8 watt LED Onsite Actual: (70) PAR20 7 watt LED – (20 installed but not in use) Baseline: (20) 50 watt halogen, (20) 40 watt T12, (16) 60 watt incandescent The program bulbs are installed in the first floor of the store. There are (50) program bulbs installed
and in use. There are (20) that are installed in a new construction residential area on the second floor which were not in use at the time of the site visit. The program bulbs took the place of 50 watt halogen lamps and 40 watt T12 fluorescent tubes. The assumption for tracking hours of use are (4500) and the logged average hours of use are (2876).

DNV KEMA Energy & Sustainability
KEMA, Inc. February 19, 2014 D-36
D. Post-Report Analysis of Lighting Distributor/Contractor Interviews, Final Revised Memorandum
D.1 Background
In June 2013 DNV KEMA issued the Final Report for the Process Evaluation of the 2012 Bright Opportunities Program (Process Evaluation).8 Key sources of information for this process evaluation included in-depth interviews with both lighting distributors who participated in the Bright Opportunities program and those who did not, as well as participating lighting installation contractors. The evaluators interviewed the participating distributors during the November-December 2012 period, the nonparticipating distributors in December 2012 through February 2013 period, and the participating installation contractors during the February-March 2013 period.
In commenting on the draft process evaluation report, a couple of Energy Efficiency Advisory Council (EEAC) and Program Administrator (PA) representatives expressed interest in learning more about the sales characteristics of the lighting distributors than was available in the Process Evaluation report. Due to the time constraints imposed by the PA’s Annual Report deadlines, this additional analysis could not be completed in time for inclusion in the final version of the Process Evaluation report. However, evaluators proposed that this analysis be conducted after the Process Evaluation report and submitted as a separate “post analysis” memorandum. After this post-analysis memorandum had been reviewed and finalized, it would be submitted as an appendix to the Impact Evaluation Report for the Bright Opportunities Program. The EEAC and PA representatives who had requested this additional analysis accepted this proposal.
D.2 The Scope of the Post-Analysis
The EEAC and PA representatives who requested the additional analysis of lighting distributor interview responses posed the following researchable questions:
Among distributors with sales in multiple states, what sales figures did they report for each state? What are the differences between participants and nonparticipants in terms of products sold? For distributors who reported selling to other states, what is their MA market share?
DNV KEMA attempts to address these questions below.
8 Process Evaluation of the 2012 Bright Opportunities Program, Final Report, Massachusetts LCIEC Project 17
Prepared by KEMA, Inc., June 14, 2013

DNV KEMA Energy & Sustainability
KEMA, Inc. February 19, 2014 D-37
D.3 Findings
This section discusses the key findings from our post-report analysis of the lighting distributor and
lighting contractor interview responses.
D.3.1 Summary
Our post-report analysis of the lighting distributor and lighting contractor interview responses was only able to collect limited information to try to answer the questions posed by the EEAC and PA representatives. This was partly due to the fact that many lighting distributors were unable or unwilling to provide estimates of their annual sales revenue. Another factor was that the participating and nonparticipating distributor interview guides were not designed to answer some of the questions that EEAC and PA representatives were curious about. Finally, as indicated in the main report, the small sample of nonparticipating lighting distributor interviews closed off some possible paths of analysis.
Yet in the process of reanalyzing the lighting distributor and lighting contractor interview responses, we were able to collect some additional useful information about the Massachusetts lighting market which we did not cover in the main report. This additional information includes:
How lighting distributors who reported different levels of LED market penetration of their spotlight/floodlight sales in Massachusetts vs. other states explained these differences;
What percentage of lighting distributor LED sales in Massachusetts over the past year were through the Bright Opportunities program and what percentage were outside the program;
Why lighting distributors did not sell all their LED products through the Bright Opportunities Program;
What factors the lighting distributors thought caused the increase in LED spotlight/floodlight market share over the last couple of years; and
Whether participation in the Bright Opportunities program influenced the mix of lighting products that lighting contractors were selling.
Most of this new information lends support to the evidence already presented in the main report as to the importance of the Bright Opportunities Program in increasing LED sales in the Massachusetts C&I market.

DNV KEMA Energy & Sustainability
KEMA, Inc. February 19, 2014 D-38
D.3.2 Among distributors with sales in multiple states, what sales figures did they report for each state?
One of the follow-up researchable questions posed by the EEAC and PA representatives was among distributors with sales in multiple states, what sales figures they reported for each state. While we did ask the lighting distributors to estimate their company’s annual sales, we did not ask respondents to directly report sales figures by state. In addition, many respondents were unwilling to provide estimates of annual sales. Of the 25 participating distributors interviewed, only 14 provided estimates of annual sales. Of the eight nonparticipating distributors we interviewed, only two provided estimates of annual sales. The average response was over $40 million in sales per year for participating distributors, $915,000 for nonparticipants. We also asked the distributors to estimate what percentage of their annual sales was from lighting. The average estimate was 57 percent for the participating distributors (n=21) and 71 percent for nonparticipating distributors (n=4).
The evaluators also asked nonparticipating distributors if they sold lighting products outside of Massachusetts. Only four of the eight said that they did. When asked in what states, their responses were:
All of them (two respondents); New Hampshire, Rhode Island; and All of New England, plus New York, Florida, California and Georgia.
There was also a fifth nonparticipating lighting distributor who indicated that they very occasionally sell lighting products to Rhode Island, but this happened rarely enough that they did not think it qualified them as selling lighting products outside of Massachusetts.
While we did not ask lighting distributors to estimates their annual sales inside Massachusetts vs. other states, we did collect some comparative data on the market penetration of LEDs in the spotlight/floodlight market. We asked the lighting distributors to estimate what percentage of the flood lights/spotlights they sold in Massachusetts were LEDs. We also asked those who sold lighting products outside of Massachusetts to estimate what percentage of the flood lights/spotlights they sold in other states were LEDs.
Figure 1 shows their responses (this figure was listed in the Process Evaluation report as Figure 4-30). Yet due to the small sample sizes, only the difference between the Massachusetts and the New Hampshire estimates was statistically significant.

DNV KEMA Energy & Sustainability
KEMA, Inc. February 19, 2014 D-39
Figure 1: LEDs as Percent of Floodlight Sales by State
*Only NH is statistically significantly different from Massachusetts at the 90% confidence interval
If the lighting distributor had provided estimates of LED spotlight/floodlight sales penetration for both Massachusetts and another state and these estimates were different, we asked the follow up question:
You indicated that you are selling a [HIGHER/LOWER] percentage of your flood light/spotlights in Massachusetts compared to these other states. What factors do you think might explain these differences?
Ten respondents were asked this question due to a difference between their Massachusetts estimate and their estimate for another state. All of those respondents indicated that differences were due to rebates or “programs.”
Following an early draft of this memorandum, one commenter requested further clarification on the responses and distribution of individual participating distributors. The main intent of this inquiry was to determine if there were any compositional effects such as a state appearing to have higher LED market penetration simply because the distributors who sell in that state have a higher global market share. Table 29 shows this breakdown. Comparing the average market share with the sales-weighted market share shows that due to the small sample sizes, the impact of a single large distributor with a high LED market share had a larger effect on increasing the LED market share on New Jersey, New York, and Connecticut than it did for Massachusetts. Therefore on a straight average basis, Massachusetts has the larger LED market share of any northeastern state with the exception of New Jersey and its single data point.

DNV KEMA Energy & Sustainability
KEMA, Inc. February 19, 2014 D-40
Table 29: LEDs as Percent of Floodlight Sales by State
*Rows are blank where respondents did not know or were not able to respond to the question. **Weighted average was determined by using sales units in the program as the weighting proxy.
D.3.3 What are the differences between participants and nonparticipants in terms of products sold?
Another one of the follow-up researchable questions posed by the EEAC and PA representatives was what differences existed between the participating and nonparticipating distributors in terms of products sold. Unfortunately the lighting distributor interview guides, both for participating and nonparticipating lighting distributors, did not allow us to fully address this question. We did ask the nonparticipating lighting distributors to estimate what percentage of their total 2012 lighting sales were represented by the kind of lighting products (e.g., LED bulbs, low-wattage linear fluorescents) that were rebated by the
NJ NY CT MA RI VT ME NH
A 10%B 20% 75% 92%
C 0% 20% 0% 0%D 0%E 0% 0%F 65% 65% 20% 20%G 60% 30% 5% 5%
H 50%IJ 68%
K 10% 35% 10% 10%LM 60%N 65% 65% 65% 65%O 30% 10% 10%P 5% 25% 40%Q 50% 5%R 30%S 10% 10% 50%T 50%U 40%VW 90%X 15% 15%Average 65% 28% 23% 43% 32% 30% 12% 7%Weighted Average 65% 64% 62% 56% 48% 30% 14% 12%
DNV KEMA Energy & Sustainability
KEMA, Inc. February 19, 2014 D-41
program. Yet we did not ask the same question of participating lighting distributors. We instead asked the participating distributors to verify the quantities of LED bulbs and/or low-wattage linear fluorescents that the tracking data indicated that they sold through the Bright Opportunities program.
However, we did collect some information about the participating distributors’ non-program sales including:
1. We asked them to estimate what percentage of their LED sales in Massachusetts over the past year were through the Bright Opportunities program and outside the program; and
2. We asked them what percentage of the spotlights/floodlights they currently sell in Massachusetts, they sold a year ago, and they sold two years ago are/were LED bulbs.
The responses of participating distributors to the first set of questions indicated that the program-discounted LED bulbs have been dominating the Massachusetts LED sales of these participants. Figure 2 shows that participating lighting distributors reported, on average, that over three quarters (77%) of their LED sales were through the program in 2012. Only three of the nineteen respondents said they had more of their Massachusetts LED sales outside the program than through the program.
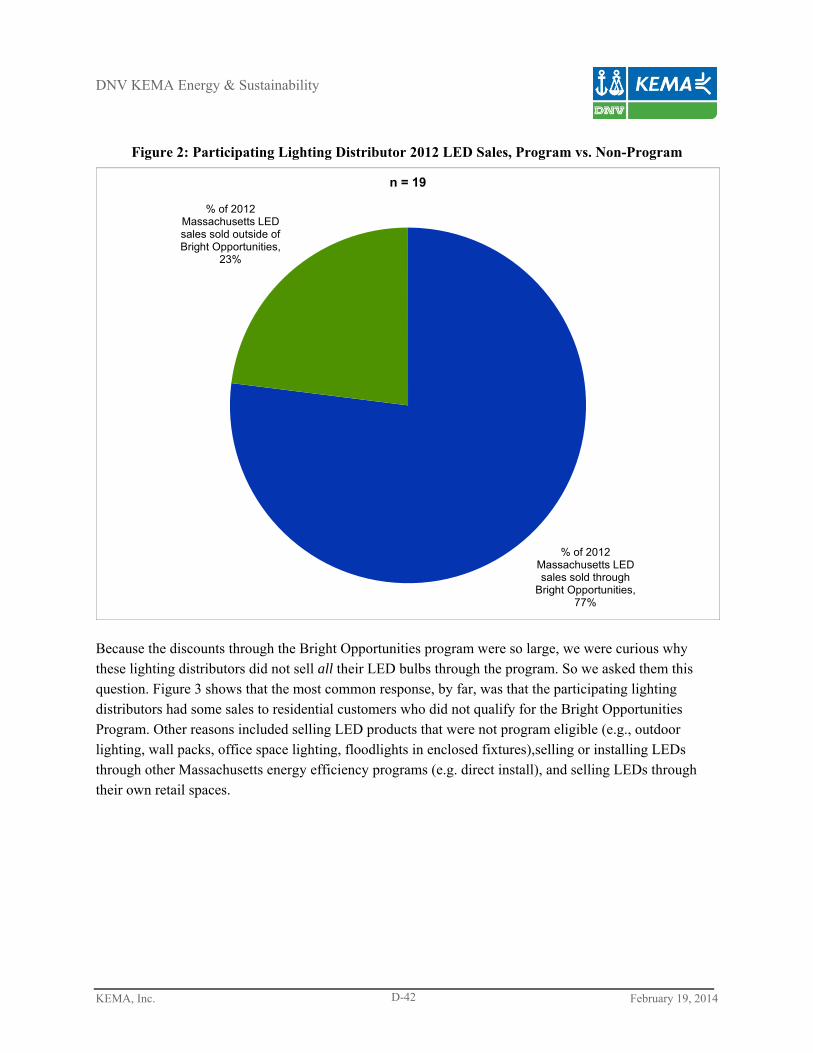
DNV KEMA Energy & Sustainability
KEMA, Inc. February 19, 2014 D-42
Figure 2: Participating Lighting Distributor 2012 LED Sales, Program vs. Non-Program
Because the discounts through the Bright Opportunities program were so large, we were curious why these lighting distributors did not sell all their LED bulbs through the program. So we asked them this question. Figure 3 shows that the most common response, by far, was that the participating lighting distributors had some sales to residential customers who did not qualify for the Bright Opportunities Program. Other reasons included selling LED products that were not program eligible (e.g., outdoor lighting, wall packs, office space lighting, floodlights in enclosed fixtures),selling or installing LEDs through other Massachusetts energy efficiency programs (e.g. direct install), and selling LEDs through their own retail spaces.
% of 2012 Massachusetts LED sales sold through
Bright Opportunities, 77%
% of 2012 Massachusetts LED sales sold outside of Bright Opportunities,
23%
n = 19
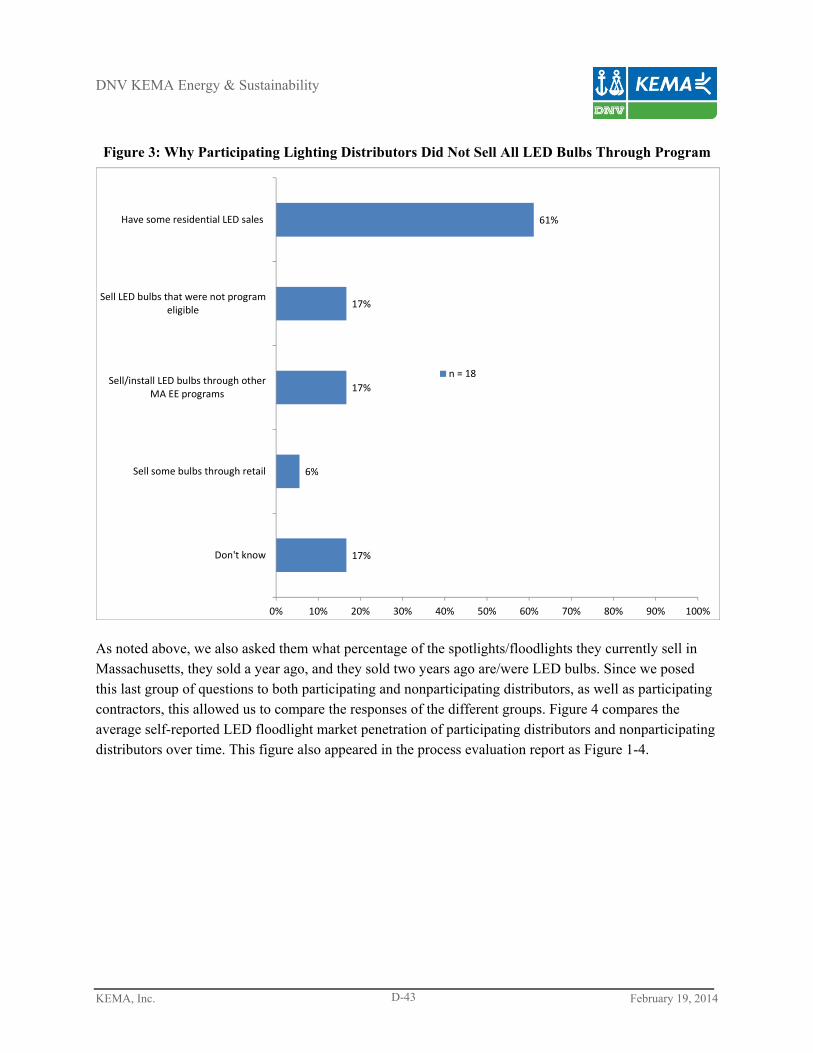
DNV KEMA Energy & Sustainability
KEMA, Inc. February 19, 2014 D-43
Figure 3: Why Participating Lighting Distributors Did Not Sell All LED Bulbs Through Program
As noted above, we also asked them what percentage of the spotlights/floodlights they currently sell in Massachusetts, they sold a year ago, and they sold two years ago are/were LED bulbs. Since we posed this last group of questions to both participating and nonparticipating distributors, as well as participating contractors, this allowed us to compare the responses of the different groups. Figure 4 compares the average self-reported LED floodlight market penetration of participating distributors and nonparticipating distributors over time. This figure also appeared in the process evaluation report as Figure 1-4.
17%
6%
17%
17%
61%
0% 10% 20% 30% 40% 50% 60% 70% 80% 90% 100%
Don't know
Sell some bulbs through retail
Sell/install LED bulbs through otherMA EE programs
Sell LED bulbs that were not programeligible
Have some residential LED sales
n = 18

DNV KEMA Energy & Sustainability
KEMA, Inc. February 19, 2014 D-44
Figure 4: LED Floodlight/Spotlight Market Penetration Over Time
One new finding, which we did not include in the process evaluation report, was how lighting distributors responded to the open-ended follow-up question:
[IF THE PERCENTAGE CHANGED OVER TIME] What factors do you think are influencing these changes in LED market share for these lighting technologies?
We posed this question to the seventeen participating and three nonparticipating lighting distributors who reported some change in their LED floodlight market penetration over time.
Figure 5 shows the factors which lighting distributors cited as influencing changes in their LED market share for floodlight/spotlight sales. Among participating lighting distributors the most-cited factor, by far, was the existence of the program and its rebates with over half of the respondents citing this as a factor. About a quarter of participating distributors also cited lower prices for LED bulbs (which may also be program-related, although nonparticipants also cited this factor) and the desire of customers to save energy/money with the LED bulbs. The participants also cited over a half dozen other reasons, with the EISA legislation’s phase-out of less efficient incandescent bulbs being one of them (12% of responding participants).
5%
21%
56%
1% 14%
54%
1% 1%3%0%
10%
20%
30%
40%
50%
60%
70%
80%
90%
100%
"Two Years Ago" "One Year Ago" "This Year"
%
of
total
floodlight
sales
Avg. LED sales % reported byparticipating Distributorsn=23
Avg. LED sales % reported byparticipating contractorsn=21
Avg. LED sales % reported bynonparticipating distributorsn=4
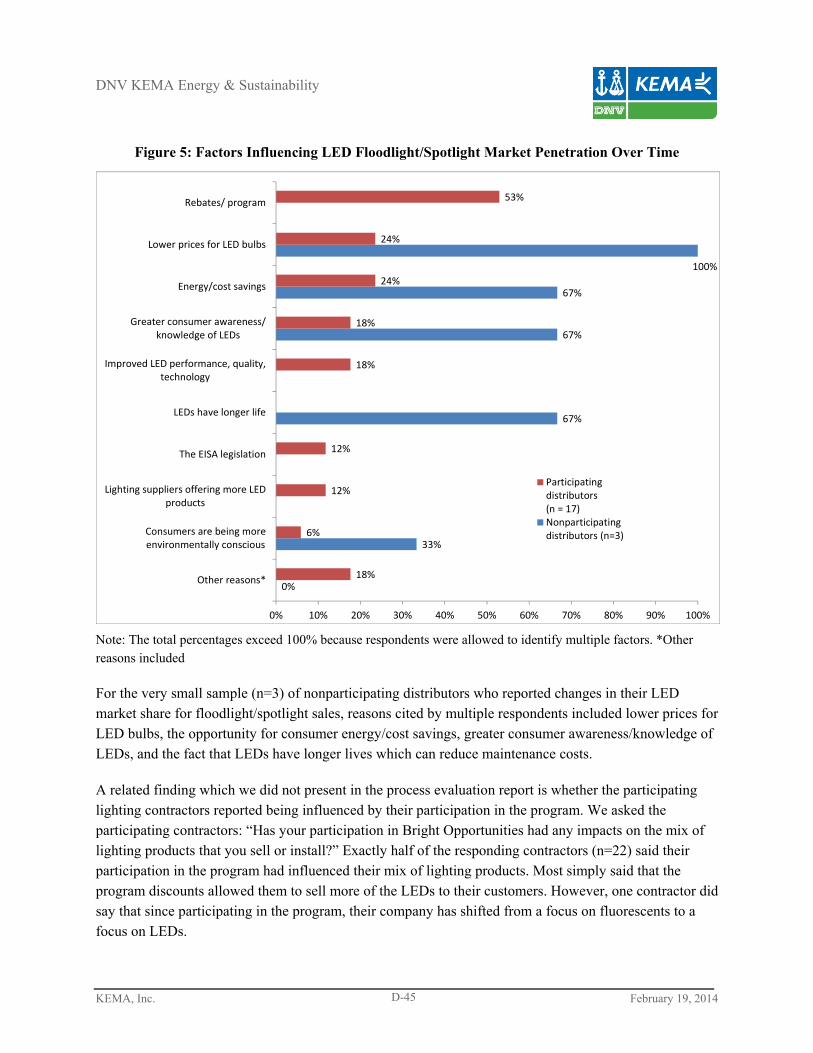
DNV KEMA Energy & Sustainability
KEMA, Inc. February 19, 2014 D-45
Figure 5: Factors Influencing LED Floodlight/Spotlight Market Penetration Over Time
Note: The total percentages exceed 100% because respondents were allowed to identify multiple factors. *Other reasons included
For the very small sample (n=3) of nonparticipating distributors who reported changes in their LED market share for floodlight/spotlight sales, reasons cited by multiple respondents included lower prices for LED bulbs, the opportunity for consumer energy/cost savings, greater consumer awareness/knowledge of LEDs, and the fact that LEDs have longer lives which can reduce maintenance costs.
A related finding which we did not present in the process evaluation report is whether the participating lighting contractors reported being influenced by their participation in the program. We asked the participating contractors: “Has your participation in Bright Opportunities had any impacts on the mix of lighting products that you sell or install?” Exactly half of the responding contractors (n=22) said their participation in the program had influenced their mix of lighting products. Most simply said that the program discounts allowed them to sell more of the LEDs to their customers. However, one contractor did say that since participating in the program, their company has shifted from a focus on fluorescents to a focus on LEDs.
0%
33%
67%
67%
67%
100%
18%
6%
12%
12%
18%
18%
24%
24%
53%
0% 10% 20% 30% 40% 50% 60% 70% 80% 90% 100%
Other reasons*
Consumers are being moreenvironmentally conscious
Lighting suppliers offering more LEDproducts
The EISA legislation
LEDs have longer life
Improved LED performance, quality,technology
Greater consumer awareness/knowledge of LEDs
Energy/cost savings
Lower prices for LED bulbs
Rebates/ program
Participatingdistributors(n = 17)Nonparticipatingdistributors (n=3)
DNV KEMA Energy & Sustainability
KEMA, Inc. February 19, 2014 D-46
.
D.3.4 For distributors who reported selling to other states, what is their MA market share?
Another one of the follow-up researchable questions posed by the EEAC and PA representatives concerned the Massachusetts market shares of distributor who reported selling LEDs to other states. There was only limited information we were able to gather to answer this question. Of the 18 participating distributors we interviewed who said they sold lighting products outside of Massachusetts, only 12 of them provided estimates of their annual revenue. Furthermore of the seven participating distributors who did not sell lighting products outside of Massachusetts, only two provided revenue estimates. So based on these small sample of 14 participating lighting distributors who reported their annual revenue, 12 of the 14 (85%) were selling lighting products outside of Massachusetts.
The participating distributors who sold lighting products outside of Massachusetts were on average larger than those who did not. Although they only accounted for 85 percent of those reporting annual revenue, the distributors who sold lighting products outside of Massachusetts accounted for 99 percent of the revenue reported by this group. They also accounted for 99 percent of the employees, which was another indicator of company size that we collected.


