Embed Size (px)
Citation preview

139
Bollettino di Geofisica teorica ed applicata Vol. 44, n. 2, pp. 139-154; June 2003
Upper thermal structure and intermediate currents in the Adriatic and Northern Ionian as measured
by a Lagrangian profiler in 1995 and 1996
p.-M. poulain(1, 2), e. Mauri(2) and p. Zanasca(3)
(1)Naval Postgraduate School, Monterey, California, USA (2)Istituto Nazionale di Oceanografia e Geofisica Sperimentale, Trieste, Italy
(3)SACLANT Undersea Research Centre, La Spezia, Italy
(Received, May 17, 2002; accepted February 3, 2003)
Abstract - A Profiling Autonomous Lagrangian Circulation Explorer (PALACE) was deployed twice in the Strait of Otranto (entrance of the Adriatic Sea) to measure intermediate currents and temperature profiles in the upper water column. The profiling instrument was programmed to stay immersed and drift at a neutral depth near 350 dbar for about 51 hours and then to float at the surface for about 21 hours in order to be located by, and relay data to, the Argos satellite system. Temperature data were collected during each ascent between 333 dbar and the surface with 3 dbar vertical resolution. The PALACE was first deployed on 18 May 1995 and was subsequently recovered in the northern Ionian Sea on 26 August 1996. After maintenance, the same float was redeployed at the same location in the Strait of Otranto in November 1995 and provided data in the Adriatic Sea until December 1996. Displacements at intermediate depths indicated that the typical mean speed at the float neutral depth is 5 cm/s, which is about four times smaller than the mean speeds of surface drifters in the same region. Over one hundred temperature profiles were acquired. The temperature profiles measured by the PALACE delineate clearly the seasonal development of the thermocline and upper mixed layer, with the former reaching a maximum depth near 50 m in late summer and fall. Superimposed on this seasonal trend, temperature variations at shorter time scales (5-10 days) can be seen. These variations are mostly related to mesoscale spatial structures observed in the float track and in satellite thermal images.
Corresponding author: P.-M. Poulain, Istituto Nazionale di Oceanografia e Geofisica Sperimentale, Borgo Grotta Gigante 42/c, 34010 Sgonico, Italy; phone: +39 0402140322; fax; +39 0402140266; e-mail: [email protected]
© 2003 OGS

140
Boll. Geof. Teor. Appl., 44, 139-154 poulain et al.
1. Introduction
Long-term measurements of seawater properties, such as temperature and salinity, are crucial in studies of low frequency variability of the ocean-atmosphere system, not to mention in climate change programs. Global and continuous monitoring of sea surface parameters can be made by means of satellite sensors, e.g., sea surface temperature and pigment concentration have been measured effectively over the last decades and satellite monitoring of surface salinity will hopefully become operational in a few years. In the water column, however, seawater properties can mostly be measured in-situ using instruments lowered from ships or autonomous probes.
Classical hydrographic surveys, using reversing thermometers and bottle water samples in the early days and starting in the 1960s utilizing conductivity-temperature-depth (CTD) instruments lowered from ships stopped at selected stations, have provided a wealth of temperature/salinity (T/S) data in the interior of all ocean basins and seas. In the Adriatic Sea, in particular, T/S observations collected between 1911 and 1983 (bottle casts) were compiled by Artegiani et al. (1997a) to study its water mass structure and temporal variability. More recently, CTD data were used to further explore the distribution of water mass properties and circulation in the Adriatic Sea (Artegiani et al., 1993; Manca et al., 2001). In short, all these observations revealed a strong seasonal variability of the seawater properties (mostly in temperature, with strong stratification in summer and vertical homogenization and deep convection in winter) and a basin-wide mean cyclonic circulation broken into two or three re-circulation cells (Orlic et al., 1992; Poulain and Cushman-Roisin, 2001).
Expandable bathythermographs (XBT) launched from moving ships have been used widely to obtain data on the vertical thermal structure in the water column. They were utilized to complement CTD surveys but also, and most importantly, just by themselves, to obtain temperature data along routes of ships-of-opportunity at relatively low cost. XBT data in the global ocean basins have been used by several authors (e.g., Roemmich and Cornuelle, 1990) to study large-scale thermal variability. XBT probes have also been operated in marginal seas such as the Mediterranean. An important example is the work of Horton et al. (1994) who used XBTs launched from aircraft to cover an extended area (most of the Eastern Mediterranean) in a relatively short time period. A quasi-synoptic description of the sub-basin scale thermal structure (including gyres and fronts) in the whole basin was thus possible. Very recently, a volunteer observing ship temperature data collection program was initiated in the entire Mediterranean Sea. This program provides temperature data every two weeks, or monthly, along specific sections, one of which crosses the Adriatic in an almost longitudinal direction (Fusco et al., 2003).
Profiling autonomous floats have been developed over the last two decades to measure mid-depth ocean currents and T/S profiles (Davis et al., 1992). These freely drifting instruments cycle between the surface where the data are telemetered to satellites and a prescribed depth, at regular programmable intervals. They have been successfully operated in large ocean basins (Davis et al., 1996; Davis, 1998). In this paper, we present the data of the first autonomous float used in the Mediterranean Sea. A Profiling Autonomous Lagrangian

Circulation Explorer (PALACE) was deployed twice at the entrance of the Adriatic Sea (Eastern Strait of Otranto) and was programmed/ballasted to measure the intermediate circulation near the core of the Levantine Intermediate Water (near a 300-400 dbar depth). The float data, i.e., trajectories, surface and deep velocities and temperature profiles, are presented in this paper. The temperature profiles are analyzed and interpreted using ancillary satellite temperature maps. The paper is organized as follows. Technical characteristics of the float system and details about its preparation, programming, and data collection are presented in section 2. The float trajectories and the mid-depth displacements are discussed in section 3. Section 4 includes a description of the temperature profile data and their interpretation in concert with contemporaneous satellite sea surface temperature maps. Conclusions are found in section 5.
2. The PALACE float
The PALACE is a freely-drifting system that cycles vertically from a pre-determined depth where it is neutrally buoyant to the surface where it is located by, and relays data to, the Argos satellite system. It changes its buoyancy by pumping hydraulic fluid from an internal reservoir to an external bladder, thereby increasing float volume and buoyancy (Davis et al., 1992).
The float is an aluminum cylinder (Fig. 1) about 1 m long and with a 17 cm diameter that weighs about 23 kg (Davis et al., 1992). A 70 cm-long antenna is mounted on the top. A 35-cm diameter plastic disk surrounds the pressure case, perpendicular to the float axis, and about 25 cm from the top cap. It provides resistance to relative flow past the float and damps heaving oscillations when the float is at the sea surface. The float has a hydraulic system to adjust buoyancy, a microprocessor to schedule and control various functions, and an Argos transmitter and antenna. The external bladder that receives hydraulic fluid is located at the bottom of the float. When the float has the minimum volume, the bladder retracts into an hemispheric cavity of approximately the same radius as the lower end cap. A small oil-filled tube mounted outside the endcap is ported to an internally mounted strain-gauge pressure transducer in order to measure the external pressure. An internal thermistor is cemented to the lower endcap to report at-depth temperature.
The float used in this experiment was equipped with a temperature probe in the top endcap (Fig. 1). This probe is manufactured from a stainless steel tube, 10 cm long and with a 0.5 cm outer diameter. It contains a thermistor packed in a thermally-conductive grease (Sherman, 1993). Temperature and pressure are sampled every 2.5 seconds while the float is ascending. The e-folding time response of the temperature sensor is 3.6 s, which combined with a typical ascent rate of 15 cm/s yields independent observations over 3 m vertical scales. The temperature is averaged in 108 bins of 3 dbar (this is constrained by the length of the message telemetered to Argos), ranging between 1.5 and 332.8 dbar depths, that is, spanning most of the water column between the surface and the nominal neutral depth of the float. The 3-dbar averaged temperatures have an accuracy better than 0.1 ºC (Sherman, 1993). The float was ballasted in laboratory to become neutrally buoyant at a depth of near 350 dbar. It was programmed to stay
141
Lagrangian profiler data in the Adriatic and Ionian seas Boll. Geof. Teor. Appl., 44, 139-154

142
Boll. Geof. Teor. Appl., 44, 139-154 poulain et al.
at the surface for about 21 hours and to perform a complete dive cycle in about 3 days (Fig. 2). This cycle is divided into a descending phase lasting 2-3 hours (Davis et al., 1992) but to be very conservative set to 5.7 hours, followed by a 42.7-hour long period during which pressure and temperature are measured and averaged (in two parts) while the instrument drifts at its neutral depth. After this, the pump is activated for 10 min and the float starts to ascend and measure temperature with the external probe. The pump is stopped for 1 hour and then operated for another 1.5 hours to provide maximum buoyancy to the float when it finally starts transmitting at the surface (after 51 hours from the initial dive time).
The oceanographic data telemetered to Argos include (1) the pressure and temperature (internal) averaged during the first half and second half of the time spent at depth and during the period spent at the surface, (2) the 3-dbar averaged temperature profile and (3) various engineering data specific to the float operation. Some of these data have been compiled in a data report (Poulain and Zanasca, 1998).
Fig. 1 - Photograph of the PALACE showing the Argos antenna, temperature probe and plastic disk. The external bladder used to modify the float buoyancy is located at the bottom of the cylinder.
Argos antenna
Temperatureprobe
Plastic disk
Externalbladder

3. Float trajectories and intermediate current speeds
The PALACE was first deployed on the eastern side of the Strait of Otranto on 18 May 1995 (#23589). Fig. 3 shows its trajectory with light gray and black segments representing surface and deep segments, respectively. It meandered for some time in the Strait region before exiting on the western side and entering the Ionian Sea. It finally entered the Gulf of Taranto where it was recovered on 26 August 1995. After maintenance and battery change the same float, re-numbered #23590, was re-deployed at the same location in the eastern Strait of Otranto on 20 November 1995 (Fig. 4). This time, due to the strong inflow of Ionian Surface Water and Levantine Intermediate Water into the Adriatic, the float moved to the north and completed about one-and-a-half loops in the southern Adriatic following the classical surface circulation known from hydrographic (Artegiani et al., 1997b) and drifter (Poulain, 1999, 2001) observations. Subsequently, the float progressed into the middle and northern Adriatic sub-basins where it stopped transmitting on 31 December 1996, off Ancona, Italy.
Figs. 2 and 3 show that, occasionally, the float drifted in water depths of less than 300-400 dbar, the target depths for which it was ballasted. During these periods, deep displacements were not used to estimate velocity since the float was most likely dragging on the bottom. In a few cases, float #23590 got trapped near the bottom and remained in the water for more than 10 days, performing 4 or 5 duty cycles.
Fig. 2 - Schematic diagram of the PALACE dive cycle.
143
Lagrangian profiler data in the Adriatic and Ionian seas Boll. Geof. Teor. Appl., 44, 139-154

144
Boll. Geof. Teor. Appl., 44, 139-154 poulain et al.
Fig. 3 - Track of PALACE #23589: surface (light gray) and deep (black) segments. Bathymetry is represented with light (deeper than 100 m) and dark (deeper than 300 m) gray shades.
ADRIATIC SEASTRAIT OF OTRANTO
30 May19 July
Deployment 18 May 1995
Recovery 26 August 1995
GULF OF TARANTO
IONIAN SEA
40° N
39° N17° E 18° E 19° E 20° E
Fig. 4 - Same as in Fig. 2 but for PALACE #23590.
44° N
43° N
42° N
41° N
40° N
13° E 14° E 15° E 16° E 17° E 18° E 19° E 20° E
STRAIT OF OTRANTO
ALB
AN
IACROATIA
ADRIATIC SEA
31 Dec
12 Nov
4 Feb
4 July
23 Aug
26 Mar
15 Apr16 Dec
ITALY
Deployment 20 Nov 1995

145
Lagrangian profiler data in the Adriatic and Ionian seas Boll. Geof. Teor. Appl., 44, 139-154
The bottom topography was interpolated at the locations following each ascent and it was plotted versus time along with the pressure values measured by the float during the first and second parts of the immersion at the neutral depth (Fig. 5). There is a good agreement between bottom pressure and interpolated topography. For PALACE #23589, the pressure at the neutral depth remained constant near 350 dbar during the entire period of operation of 3
Fig. 5 - Bottom topography interpolated at the float locations following each ascent (black solid curve). Pressure at depth during the first part (o) and second part (x) of drift at the neutral depth. Range of depths of raw (thin) and edited (thick) temperature profiles: (a) float #23589 and (b) float #23590.
PALACE 235890
-200
-400
-600
-800
-1000
-1200
0
-200
-400
-600
-800
-1000
-1200
150 200
350 400 450 500 550 600 650 700Time (days of 1995)
Time (days of 1995)
PALACE 23590
Dep
th (m
)
Dep
th (m
)
(a)
(b)

146
Boll. Geof. Teor. Appl., 44, 139-154 poulain et al.
months. In contrast, during the relatively long operating period of PALACE #23589, the float’s neutral depth increased from 389 to 763 dbar. This unusual result is presumably due to possible compression of the float, changes in the retraction shape of the bladder and bio-fouling after such a long time (more than a year) in the water.
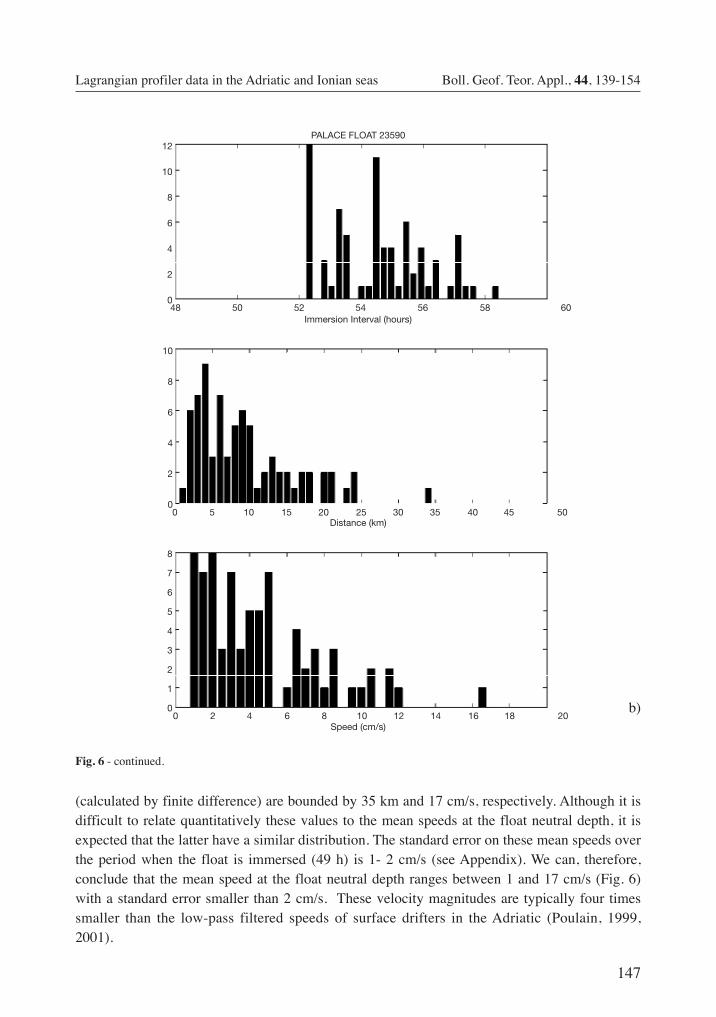
The time interval between the Argos fixes before immersion and after the successive emersion ranged between 52 and 58 hours (see histograms in Fig. 6), excluding the cases when the float got stuck on the sea bottom. The corresponding displacements and mean speeds
Fig. 6 - Histograms of time interval between Argos position fixes before immersion and after emersion when the bottom depth is larger than the float neutral depth. Histograms of the corresponding drift distances and speeds: (a) float #23589 and (b) float #23590.
a)
PALACE FLOAT 23589
Immersion Interval (hours)
Distance (km)
Speed (cm/s)
7
6
5
4
3
2
1
0
4
3.5
3
2.5
2
1.5
1
0.5
0
4
3.5
3
2.5
2
1.5
1
0.5
0
48 50 52 54 56 58 60
0 5 10 15 20 25 30 35 40 45 50
0 2 4 6 8 10 12 14 16 18 20
147
Lagrangian profiler data in the Adriatic and Ionian seas Boll. Geof. Teor. Appl., 44, 139-154
(calculated by finite difference) are bounded by 35 km and 17 cm/s, respectively. Although it is difficult to relate quantitatively these values to the mean speeds at the float neutral depth, it is expected that the latter have a similar distribution. The standard error on these mean speeds over the period when the float is immersed (49 h) is 1- 2 cm/s (see Appendix). We can, therefore, conclude that the mean speed at the float neutral depth ranges between 1 and 17 cm/s (Fig. 6) with a standard error smaller than 2 cm/s. These velocity magnitudes are typically four times smaller than the low-pass filtered speeds of surface drifters in the Adriatic (Poulain, 1999, 2001).
Fig. 6 - continued.
b)
PALACE FLOAT 23590
Immersion Interval (hours)
Distance (km)
Speed (cm/s)
12
10
8
6
4
2
0
10
8
6
4
2
0
8
7
6
5
4
3
2
1
0
48 50 52 54 56 58 60
0 5 10 15 20 25 30 35 40 45 50
0 2 4 6 8 10 12 14 16 18 20
148
Boll. Geof. Teor. Appl., 44, 139-154 poulain et al.
4. Temperature profiles and comparison with satellite maps
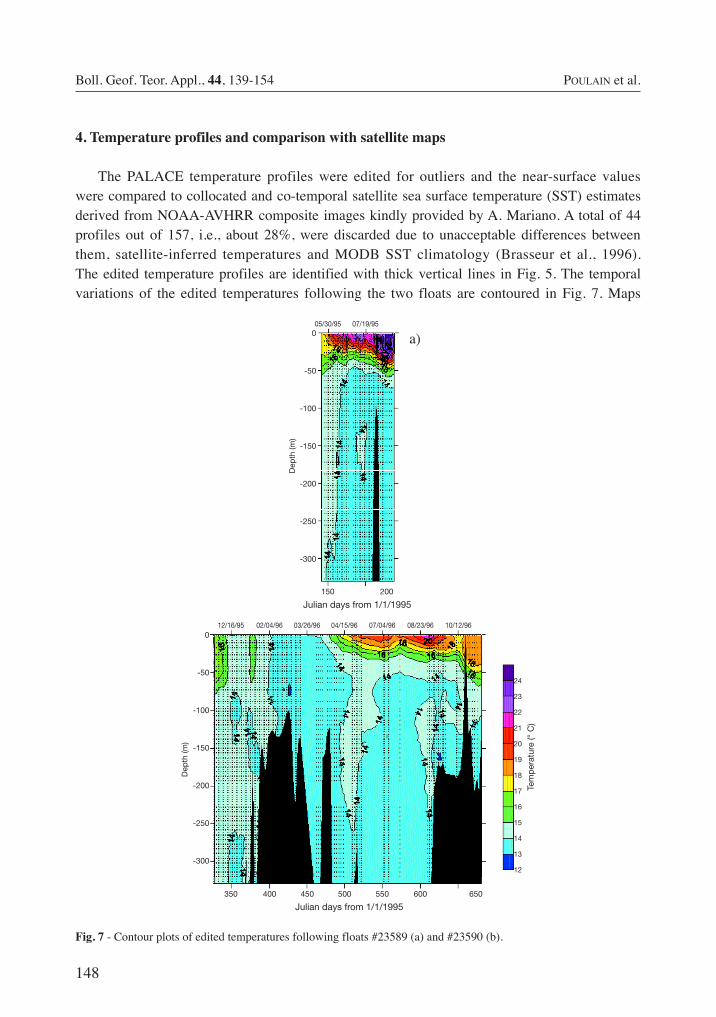
The PALACE temperature profiles were edited for outliers and the near-surface values were compared to collocated and co-temporal satellite sea surface temperature (SST) estimates derived from NOAA-AVHRR composite images kindly provided by A. Mariano. A total of 44 profiles out of 157, i.e., about 28%, were discarded due to unacceptable differences between them, satellite-inferred temperatures and MODB SST climatology (Brasseur et al., 1996). The edited temperature profiles are identified with thick vertical lines in Fig. 5. The temporal variations of the edited temperatures following the two floats are contoured in Fig. 7. Maps
b)
Fig. 7 - Contour plots of edited temperatures following floats #23589 (a) and #23590 (b).
a) 05/30/95 07/19/95
12/16/95 02/04/96 03/26/96 04/15/96 07/04/96 08/23/96 10/12/96
0
-50
-100
-150
-200
-250
-300
0
-50
-100
-150
-200
-250
-300
150 200
350 400 450 500 550 600 650
Julian days from 1/1/1995
Julian days from 1/1/1995
Dep
th (m
)
Dep
th (m
)
24
23
22
21
20
19
18
17
16
15
14
13
12
Tem
per
atur
e (°
C)

149
Lagrangian profiler data in the Adriatic and Ionian seas Boll. Geof. Teor. Appl., 44, 139-154
of mean SST (over about 2-month long periods) derived from satellite AVHRR data space-time interpolated by the procedure described (Mariano and Brown, 1992) are overlaid with float tracks in Figs. 8 and 9. They provide us with information on the spatial structure and the seasonal variability of SST in the vicinity of the floats.
Fig. 8 - Mean surface temperature fields derived from satellite AVHRR data (RSMAS products at 18 km resolution) for ~2 month long periods. The track of the PALACE (#23589 in panels a and b, #23590 in panels c to h) is superimposed: surface segment (black), depth segment (white) and first fix after profiling (red dot).
18-May-1995 to 31-Jun-1995 1-Jul-1995 to 26-Aug-1995
20-Nov-1995 to 31-Jan-1996 1-Feb-1996 to 31-Mar-1996
46°N
44°N
42°N
40°N
46°N
44°N
42°N
40°N
46°N
44°N
42°N
40°N
46°N
44°N
42°N
40°N
12°E 14°E 16°E 18°E 20°E Temperature (°C)
20 21 22 23
12°E 14°E 16°E 18°E 20°E Temperature (°C)
12 13 14 15 16 17
12°E 14°E 16°E 18°E 20°E Temperature (°C)
8 9 10 11 12 13 14 15
12°E 14°E 16°E 18°E 20°E Temperature (°C)
25 26 27 28
(a)
(c) (d)
(b)

150
Boll. Geof. Teor. Appl., 44, 139-154 poulain et al.
Temperatures at depths deeper than 50 m vary between 12 and 14 ºC. In contrast, strong seasonal variations ranging in 12-27 ºC appear in the upper water column. The near-surface temperatures of float #23589 are warmer than those of float #23590, during the 1995 and 1996 summers, respectively, because of their different locations (see Figs. 8b, 8f and 8g). The float data show the development of the seasonal thermocline starting in early April and its deepening
Fig. 8 - continued.
1-Apr-1996 to 31-May-1995 1-Jun-1996 to 31-Jul-1996
1-Aug-1996 to 31-Sep-1996 1-Oct-1996 to 30-Nov-199646°N
44°N
42°N
40°N
46°N
44°N
42°N
40°N
46°N
44°N
42°N
40°N
46°N
44°N
42°N
40°N
12°E 14°E 16°E 18°E 20°E Temperature (°C)
22 23 24 25 26
12°E 14°E 16°E 18°E 20°E Temperature (°C)
16 17 18 19 20
12°E 14°E 16°E 18°E 20°E Temperature (°C)
15 16 17 18
12°E 14°E 16°E 18°E 20°E Temperature (°C)
22 23 24 25
(g) (h)
(e) (f)

151
Lagrangian profiler data in the Adriatic and Ionian seas Boll. Geof. Teor. Appl., 44, 139-154
down to about 50 dbar, which continues until December, when stratification is destroyed and the water column becomes homogeneous. Superimposed on the seasonal trend, temperature variations at shorter time scales (10-30 days) can be seen in Fig. 7. They are mostly related to mesoscale spatial structures observed in the float track and in satellite thermal images (Figs. 8 and 9). The most striking example is in July 1996 when float #23590 got trapped by a cold-core cyclonic eddy in the southern Adriatic (near 42º.N, see Figs. 8f and 9). The sea surface temperature signal of this eddy is quite small (~.0.5.ºC) but at a 20 m depth, for instance, there is a cooling of more than 2.ºC (see doming of the isotherms in Fig. 7). It is interesting to note that the PALACE (especially #23590) generally follows the major surface thermal fronts. In the southern Adriatic (Figs. 8c and 8e), the float moved north and northwestward along the front separating relatively warm waters of Ionian origin (near the coast) from the cooler open sea waters.
5. Conclusions
A PALACE float was operated twice in the northern Ionian and Adriatic Seas to provide information on intermediate currents and temperature profiles in the upper water column. The profiling floats provided more than one hundred good temperature profiles between the surface
Fig. 9 - Mean sea surface temperature (RSMAS product derived from AVHRR imagery) and track of PALACE #23590 for July 1996 in the vicinity of a cyclonic mesoscale eddy.
1-Jul-1996 to 31-Jul-1996
42°N
16°E 18°E 20°E
Temperature (°C)
23 24 25

152
Boll. Geof. Teor. Appl., 44, 139-154 poulain et al.
and a 333 dbar depth, spanning the periods May-August 1995 and November 1995 – December 1996 with three day intervals. The temperature data delineate clearly the formation, deepening and erosion of the seasonal thermocline, reaching maximum depths near 50 m in late-summer and fall. Temperature variations at 10-30-day time scales are superimposed on the seasonal trend. Most of them correspond to spatial thermal structures observed by satellite. For example, in July 1996 the float was entrapped in a cold cyclonic eddy in the southern Adriatic basin. Although its surface signature was weak (0.5 ºC), the float revealed that temperatures were a few degrees cooler than the neighboring waters at a depth near 20 m. Mean float speeds (averaged over time intervals between 2 and 2.5 days) at depths between 300 and 800 m varied in 1-17 cm/s, with typical value near 5 cm/s which is about four times smaller than the mean speeds of surface drifters in the same region.
Acknowledgments. The authors would like to express their gratitude to all the people who helped to make the Adriatic PALACE experiment successful by contributing to the planning, float deployment and tracking, and data processing stages of the program. In particular, we would like to thank R. Della Maggiora and A. D'Agostino for their support with the float handling, tests and deployments. J. Sherman is acknowledged for his help in the planning and data interpretation phases of the PALACE experiment. The PALACE basic hardware was manufactured by Webb Research Corporation, East Falmouth, Massachusetts, USA. The float was equipped with a temperature sensor, was ballasted and was programmed at Scripps Institution of Oceanography, La Jolla, California, USA. Thanks to A. Mariano for making his satellite sea surface temperature products available to us and to C. Fragiacomo for extracting the data. Partial funding for this work was provided by the U.S. Office of Naval Research under grant N00014-01-WR-2-0147.

153
Lagrangian profiler data in the Adriatic and Ionian seas Boll. Geof. Teor. Appl., 44, 139-154
Appendix - Estimation of mean float velocity at neutral depth
Autonomous Lagrangian profilers, like the PALACE, are not only used to obtain profiles of water characteristics but also to measure currents at their neutral depth. A quantitative estimate of the float velocity while drifting at its neutral depth is not straightforward because the mean velocity is obtained by finite difference of the Argos-derived float positions before immersion and after the successive emersion. The corresponding displacement includes contributions from surface velocities and currents in the water column above the neutral depth. Vertical shear in the mean circulation and the presence of surface-intensified tidal and inertial currents can therefore affect significantly, the mean velocity estimates. For example, strong inertial oscillations seen in the surface trajectory of PALACE #23590 in July 1996 (Fig. 9) with speeds exceeding 50 cm/s can be a serious problem.
As depicted in Fig. 2, several time intervals have to be considered. First, there is an unknown period, Δt1, between the last Argos fix and the immersion (start of the dive cycle) during which the float is at the surface. This period is usually less that 1.5 h. Second, there is the period of descent from the surface to the neutral depth, Td. A good estimate for this time interval is 2.5 h to reach depths near 300-400 dbar. Then, the float drifts at its neutral depth for a programmable time period (Tnd.=.45.9 h in our case) before the pump is activated and the system rises and reaches the surface (after Ta.=.1.1 h for our floats). An extra time interval, Te, of 1.5 h follows, while the pump is active, to provide the system with maximum buoyancy. Transmissions to the satellite start after this and the first Argos location occurs after some time Δt2. Thus, the total time interval between the two Argos fixes is:
Δt = Δt1 + Td + Tnd + Ta + Te 2 + Δt2 = Δt1 + 49 h + 1.5 h + Δt2.
The time spent at the surface during this interval can also be written as Δt.-.49 h. Using the values of Δt shown in Fig. 6 (ranging between 52 and 58 h), we found it to vary between 3 and 9 hours.
Objective analysis techniques (Hansen and Poulain, 1996) can be used to interpolate the Argos positions to the exact times of immersion and emersion, using the statistics of the float surface displacements and of surface drifters in the same area (Poulain and Zanasca, 1998). These techniques provide estimates for the standard errors of the interpolated positions. Assuming that Δt1.=.Δt2, it was found that the total standard error, for the forward interpolation over Δt1 and the backward interpolation over 1.5 h.+.Δt2, corresponding to the total period ranging in 3-9 h, varies between 1.7 and 3.9 km. Taking into account the additional standard error due to the Argos Doppler positioning method (~.300 m), the standard error on the mean float speed while immersed amounts to 1 – 2 cm/s.

154
Boll. Geof. Teor. Appl., 44, 139-154 poulain et al.
References
Artegiani A., Bregant D., Paschini E., Pinardi N., Raicich F. and Russo A.; 1997a: The Adriatic Sea general circulation, Part I: Air-sea interactions and water mass structure. J. Phys. Oceanogr., 27, 1492-1514.
Artegiani A., Bregant D., Paschini E., Pinardi N., Raicich F. and Russo A.; 1997b: The Adriatic Sea general circulation, Part II: Baroclinic circulation structure. J. Phys. Oceanogr., 27, 1515-1532.
Artegiani A., Gacic M., Michelato A., Kovacevic V., Russo A., Paschini E., Scarazzato P. and Smircic A.; 1993: The Adriatic Sea hydrography and circulation in spring and autumn (1985-1987). Deep-Sea Res. 40, 1143-1180.
Brasseur P., Beckers J.-M., Brankart J.-M. and Schoenauen R.; 1996: Seasonal temperature and salinity fields in the Mediterranean Sea: climatological analyses of an historical data set. Deep-Sea Res., 43, 159-192.
Davis R.E.; 1998: Preliminary results from directly measuring middepth circulation in the tropical and South Pacific. J. Geophys. Res., 103, 24619-24639.
Davis R.E., Killworth P.D. and Blundell J.R.; 1996: Comparison of Autonomous Lagrangian Circulation Explorer and fine resolution Antarctic model results in the South Atlantic. J. Geophys. Res., 101, 855-884.
Davis R.E., Webb D.C., Regier L.A. and Dufour J.; 1992: The Autonomous Lagrangian Circulation Explorer (ALACE). J. of Atmospheric and Oceanic Technology, 9, 264-285.
Fusco G., Manzella G.M.R., Cruzado A., Gacic M., Gasparini G.P., Kovacevic V., Millot C., Tziavos C., Velasquez Z.R., Walne A., Zervakis V. and Zodiatis G.; 2003: Variability of mesoscale features in the Mediterranean Sea from XBT data analysis. Annales Geophysicae, 21, 21-32.
Hansen D.V. and Poulain P.-M.; 1996: Processing of WOCE/TOGA drifter data. Journal of Atmospheric and Oceanic Technology, 13, 900-909.
Horton C., Kerling J., Athey G., Schmitz J. and Clifford M.; 1994: Airborne expendable bathythermograph surveys of the eastern Mediterranean. J. Geophys. Res., 99, 9891-9905.
Manca B., Franco P. and Paschini E.; 2001: Seasonal variability of the hydrography in the Adriatic Sea: water mass properties and circulation. In: Faranda E.M., Guglielmo L. and Spezie G. (eds), Mediterranean Ecosystems: Structures and Processes, Springer-Verlag Italia, pp. 45-60.
Mariano A.J. and Brown O.B.; 1992: Efficient objective analysis of dynamically heterogeneous and nonstationary fields via the parameter matrix. Deep-Sea Res., 39, 1255-1271.
Orlic M., Gacic M. and La Violette P.E.; 1992: The currents and circulation of the Adriatic Sea. Oceanologica Acta, 15, 109-124.
Poulain P.-M.; 1999: Drifter observations of surface circulation in the Adriatic Sea between December 1994 and March 1996. J. of Marine Systems, 20, 231-253.
Poulain P.-M.; 2001: Adriatic Sea surface circulation as derived from drifter data between 1990 and 1999. J. of Marine Systems, 29, 3-32.
Poulain P.-M. and Cushman-Roisin B.; 2001: Chapter 3° Circulation. In: Cushman-Roisin et al. (eds), “Physical Oceanography of the Adriatic Sea: Past, present and future”, pp. 67-106.
Poulain P.-M. and Zanasca P.; 1998: Drifter and float observations in the Adriatic Sea (1994-1996). Data report, SACLANTCEN Memorandum, SM-340, SACLANT Undersea Research Centre, La Spezia, Italy, 46 pp.
Roemmich D. and Cornuelle B.; 1990: Observing the fluctuations of gyre-scale ocean circulation: a study of the subtropical South Pacific. J. Phys. Oceangr., 20, 1919-1934.
Sherman J.; 1993: Profiling ALACE instruments. Naval Research Laboratories Scripps Institution of Oceanography, La Jolla, CA (unpublished manuscript), 23 pp.