Embed Size (px)
Citation preview

Upgrading Feas
ibility Study on the Upper Seti Storage Hydroelectric Project in Nepal
Final Report
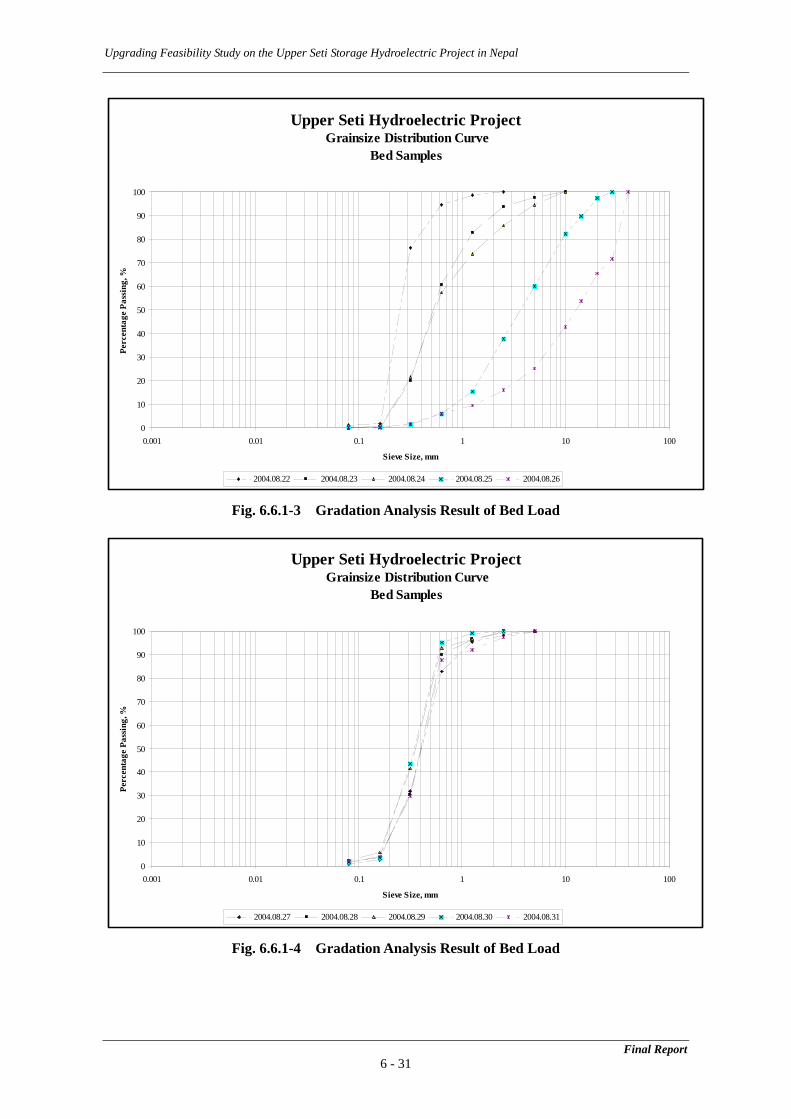
Suspended load sampling has been carried out at No. 430 gauging station from 1974 to 1978 by DHM, at No. 430.5 from June to December, 2000 by the Nepal Irrigation Sector Project (NISP), and at the Bhimad Bajar bridge on the Seti River, located 25km upstream of the Dam site, from June to September, 2001 and from July to October, 2004 by NEA, respectively. These records of suspended load concentration are attached in Appendix-6. Suspended and bed load samples are taken at the Bhimad Bajar bridge and gradation curves are exemplified as shown in Figs. 6.6.1-1 to 6.6.1-6.
6.6.1 Sediment Measurement
6.6 Sedimentation
(Unit: mm / day)
Evaporation is measured at No. 815 meteorological station, EL. 500 m, in the Seti River basin. The average monthly evaporation from 1977 to 1997 is as shown in Table 6.5-1.
6.5 Evaporation
Table 6.5-1 Average Monthly Pan Evaporation at No. 815 Meteorological Station
Month 1 2 3 4 5 6 7 8 9 10 11 12 Year 1977 NA NA NA 3.5 5.8 7.1 5.7 6.2 4.7 3.5 2.6 1.3 1978 1.6 2.1 4.8 3.7 6.2 5.0 5.9 4.7 3.9 3.2 2.3 1.6 1979 1.7 2.8 4.7 5.6 6.0 6.6 3.9 4.5 3.9 3.4 2.4 1.6 1980 1.4 2.7 4.4 5.9 5.3 5.1 4.8 4.6 4.4 3.4 2.3 1.9 1981 2.2 2.5 4.5 5.2 6.1 5.6 4.9 4.4 4.7 3.4 2.4 1.8 1982 2.3 2.5 3.8 6.9 5.6 6.0 5.3 5.1 3.9 2.9 2.1 1.7 1983 1.9 2.5 4.2 4.1 5.6 6.8 6.2 5.3 5.9 3.5 2.4 1.5 1984 1.5 2.7 4.4 4.7 6.4 3.3 7.2 4.4 3.7 3.1 2.8 NA 1985 1.5 2.3 4.2 4.3 4.9 5.2 4.1 3.7 3.4 2.8 1.9 1.6 1986 1.4 2.5 3.7 4.4 5.3 5.2 3.1 3.6 3.4 3.7 2.0 NA 1987 NA 2.9 4.1 4.3 5.5 5.8 5.2 3.9 3.5 2.6 1.9 1.2 1988 1.2 1.7 2.9 4.3 3.7 5.7 4.1 3.2 3.7 2.7 2.1 1.1 1989 1.8 1.6 3.1 5.1 4.9 4.8 2.7 3.1 3.1 3.0 2.0 1.8 1990 NA NA NA NA NA NA NA NA NA NA NA NA 1991 1.8 NA NA NA NA NA 4.4 3.7 3.9 2.6 1.7 1.4 1992 1.2 2.1 4.0 5.9 6.6 5.4 4.8 4.4 4.1 2.8 1.8 1.1 1993 1.1 2.0 3.8 5.4 5.2 6.4 5.5 4.4 3.2 2.8 1.7 1.2 1994 1.2 2.5 3.4 5.1 5.9 5.2 NA 4.5 3.7 2.3 1.7 0.9 1995 1.4 2.2 3.5 4.8 5.8 NA 4.5 4.7 3.4 2.6 1.6 0.6 1996 1.5 1.9 3.1 4.2 4.7 4.3 4.1 4.4 3.1 2.0 1.4 0.4 1997 0.9 1.8 3.0 4.5 NA NA NA NA NA NA NA NA Avg 1.5 2.3 3.9 4.8 5.5 5.5 4.8 4.4 3.9 3.0 2.1 1.3
6 - 29

Upgrading Feasibility Study on the Upper Seti Storage Hydroelectric Project in Nepal
Upper Seti Hydroelectric Project Grainsize Distribution Curve
Bed Samples
0
10
20
30
40
50
60
70
80
90
100
0.001 0.01 0.1 1 10 100
Sieve Size, mm
Perc
enta
ge P
assi
ng, %
2004.08.13 2004.08.14 2004.08.15 2004.08.16
Fig. 6.6.1-1 Gradation Analysis Result of Bed Load
Upper Seti Hydroelectric Project Grainsize Distribution Curve
Bed Samples
0
10
20
30
40
50
60
70
80
90
100
0.001 0.01 0.1 1 10 100
Sieve Size, mm
Perc
enta
ge P
assi
ng, %
2004.08.17 2004.08.18 2004.08.19 2004.08.20 2004.08.21
Fig. 6.6.1-2 Gradation Analysis Result of Bed Load
Final Report 6 - 30
Upgrading Feasibility Study on the Upper Seti Storage Hydroelectric Project in Nepal
Final Report 6 - 31
Upper Seti Hydroelectric Project Grainsize Distribution Curve
Bed Samples
0
10
20
30
40
50
60
70
80
90
100
0.001 0.01 0.1 1 10 100
Sieve Size, mm
Perc
enta
ge P
assi
ng, %
2004.08.22 2004.08.23 2004.08.24 2004.08.25 2004.08.26
Fig. 6.6.1-3 Gradation Analysis Result of Bed Load
Upper Seti Hydroelectric Project Grainsize Distribution Curve
Bed Samples
0
10
20
30
40
50
60
70
80
90
100
0.001 0.01 0.1 1 10 100
Sieve Size, mm
Perc
enta
ge P
assi
ng, %
2004.08.27 2004.08.28 2004.08.29 2004.08.30 2004.08.31
Fig. 6.6.1-4 Gradation Analysis Result of Bed Load

Upgrading Feasibility Study on the Upper Seti Storage Hydroelectric Project in Nepal
Upper Seti Hydroelectric Project Grainsize Distribution Curve
Bed Samples
0
10
20
30
40
50
60
70
80
90
100
0.001 0.01 0.1 1 10 100
Sieve Size, mm
Perc
enta
ge P
assi
ng, %
2004.09.01 2004.09.02 2004.09.03 2004.09.04
Fig. 6.6.1-5 Gradation Analysis Result of Bed Load
Upper Seti Hydroelectric Project Grainsize Distribution Curve
Suspended Samples
0
10
20
30
40
50
60
70
80
90
100
0.001 0.01 0.1 1 10 100
Sieve Size, mm
Perc
enta
ge P
assi
ng, %
2004, June-July 2004, July-August 2004, August-September 2004, September-October
Fig. 6.6.1-6 Gradation Analysis Result of Suspended Load
Final Report 6 - 32

Upgrading Feasibility Study on the Upper Seti Storage Hydroelectric Project in Nepal
6.6.2 Estimation of Reservoir Sedimentation
The Project is the first reservoir type hydropower development project planned on the Seti River basin, so sedimentation of the reservoir is estimated by the following three methods described in (1), (2) and (4) due to little information available to estimation of sedimentation of the Seti River and validity of those estimates are confirmed.
(1) Estimation of Specific Sediment Yield
NEA examined reports on hydropower projects in Nepal which have been studied up to this date and collected specific sediment yield as shown in Table 6.6.2-1.
Table 6.6.2-1 Specific Sediment Yield (1/2)
Project name Catchment
area (km2)
Average annual flow
(m3/s)
Specific sediment yield(m3/km2/year)
Remarks
Kulekhani-I 126 4.0
9,573 3,175 1,746 4,444 5,238 2,063
Based on survey result Average from1982 to 2000 1996 1997 1998 1999 2000
Andhi River 475 32.35
2,600 600
3,224 2,118
Based on measurement result of suspended load, including bed load 15% of suspended load 1995 1997 1998 1999
Sarada 832 14.0 2,014 Average of measurement result of suspended load from 1973 to 74, 76 to 78, 85 to 87
Marsyangdi 3,850 209
1,996 2,405 2,787 2,597 3,593 3,146 2,452 4,176
Measurement result of suspended load 1991 1992 1993 1994 1995 1996 1997 1998
Jhimruk 645 27.0 3,333 to 4,333
Estimation based on measurement result of suspended load from 1995 to 97, including bed load and unmeasured load 15 to 30% of suspended load
Final Report 6 - 33

Upgrading Feasibility Study on the Upper Seti Storage Hydroelectric Project in Nepal
Table 6.6.2-1 Specific Sediment Yield (2/2)
Project name Catchment
area (km2)
Average annual flow
(m3/s)
Specific sediment yield(m3/km2/year)
Remarks
Pancheswor 12,100
3,904 1,852
Measurement result of suspended load 1990 1991
Kaligandaki “A” ---- ---- 4,000 Feasibility study Kabeli River ---- ---- 2,700 Feasibility study Tamur River ---- ---- 1,693 Feasibility study Upper Karnali ---- ---- 1,213 Feasibility study Dudh Koshi ---- ---- 1,483 Feasibility study Karnali Chisapani ---- ---- 3,968 Feasibility study Arun III ---- ---- 880 Feasibility study
NEA calculates the average of suspended sediment load measured at No.430 gauging station, catchment area of 582 km2, from 1976 to 1978 out of those which have been measured there from 1974 to 1978 and estimates specific amount of suspended load at 6,497 t/km2/year as shown in Table 6.6.2-2.
Table 6.6.2-2 Suspended Sediment Yield at No.430 Gauging Station
Specific suspended sediment yield Year Remarks
(t/km2/year)
Final Report 6 - 34
1974 ---- Measured from December to middle of March, only concentration of low flow months
1975 > 909 Measurement not available for August and September1976 10,694 Measured all year round 1977 3,134 Measured all year round
1978 5,663 Measurement not available for September, October and November
Average 6,497 Average of 1976 to 78
Estimating the ratio of bed load to suspended load at 10 % as NEA describes in the Feasibility Study Report of 2001, specific sediment yield is calculated as 6,497×1.1=7,147
t/km2/year. Using the average density of sediment at 1.5 t/m3, specific sediment yield is calculated as 7,147 / 1.5=4,765 m3/km2/year in terms of volume.
As shown in Table 6.6.2-2, in 1977 specific amount of suspended load becomes less than in 1976 and increase in 1978. According to measurement records of sediment in reservoirs of Japan, sediment inflow shows a tendency to become less than an average in a year following a flood. The cause of this tendency is estimated that, when a flood erodes soil at a stretch in a certain year, a less amount of soil is washed away to a river in the next year.
NEA calculates specific amount of sediment load based on measurement records of suspended sediment load at No. 430.5 gauging station located 500 m downstream of the projected Dam axis assuming the ratio of bed load to suspended load at 15 % as shown in

Upgrading Feasibility Study on the Upper Seti Storage Hydroelectric Project in Nepal
Table 6.6.2-3.
Table 6.6.2-3 Specific Sediment Yield at No.430.5 Gauging Station
Specific sediment yield Year (t/km2/year) 2000 9,332 2001 9,966 2004 8,799
Average 9,366
Specific sediment yield in terms of volume assuming average density of sediment at 1.5 t/m3 is calculated as 9,366 / 1.5=6,244 m3/km2/year. This value is larger than that of the other
hydropower projects in Nepal shown in Table 6.6.2-1.
NEA sets FSL at EL.425.00 m in the Upgrading Feasibility Study Report in 2004 and the ratio of gross capacity of the Reservoir to annual inflow at the Dam site is calculated at 331.7 MCM / 3,380 MCM=0.10 and trap efficiency of the Reservoir is estimated at 85 % as
shown in Fig. 6.6.2-1 developed by Brune3.
Average sediment deposit of the Reservoir is 6,244×1,502×0.85=7.97 MCM / year, and
the necessary number of years when the Reservoir will be filled with sediment is calculated at 270.3 MCM / 7.97 MCM / year=34 years in terms of effective capacity and 331.7 MCM / 7.97 MCM / year=42 years in terms of gross capacity of the Reservoir respectively.
Final Report 6 - 35
Fig. 6.6.2-1 Trap Efficiency as Related to Capacity-Inflow ratio
3 Brune, Gunnar M., Trap Efficiency of Reservoirs, Trans. Am. Geophys. Union, vol 34, no. 3, June, 1953
Reservoir capacity / Annual inflow
Tap
effi
cien
cy (%
)
Maximum
Mean
r
Minimum
Upgrading Feasibility Study on the Upper Seti Storage Hydroelectric Project in Nepal
(2) Simulation of Reservoir Sedimentation
The sedimentation of the Reservoir is estimated as per the above paragraphs and the following indicates the results of simulation analysis to calculate the sedimentation with a program named EPDC/KCC FLOW 500 MODEL.
1) Calculation Process
a) Preparation of a calculation model, using river sections measured by NEA
b) Calculation of sediment inflow at the starting section of the model, using the formula which NEA developed based on the observation results of suspended load
c) Calculation of sediment load based on sediment formulae
d) Estimation of riverbed fluctuation by the equation of continuity and then estimation of the surface elevation of the deposit
e) Repeated calculation of the above on a daily basis
2) Prerequisite for Calculation
a) River sections
A topographic model of the Reservoir is made using 68 river sections from the Dam axis to the upstream end of the Reservoir out of which NEA measures in the Feasibility Study of 2001. The river sections used in this simulation are attached in Appendix-6.
b) Suspended load
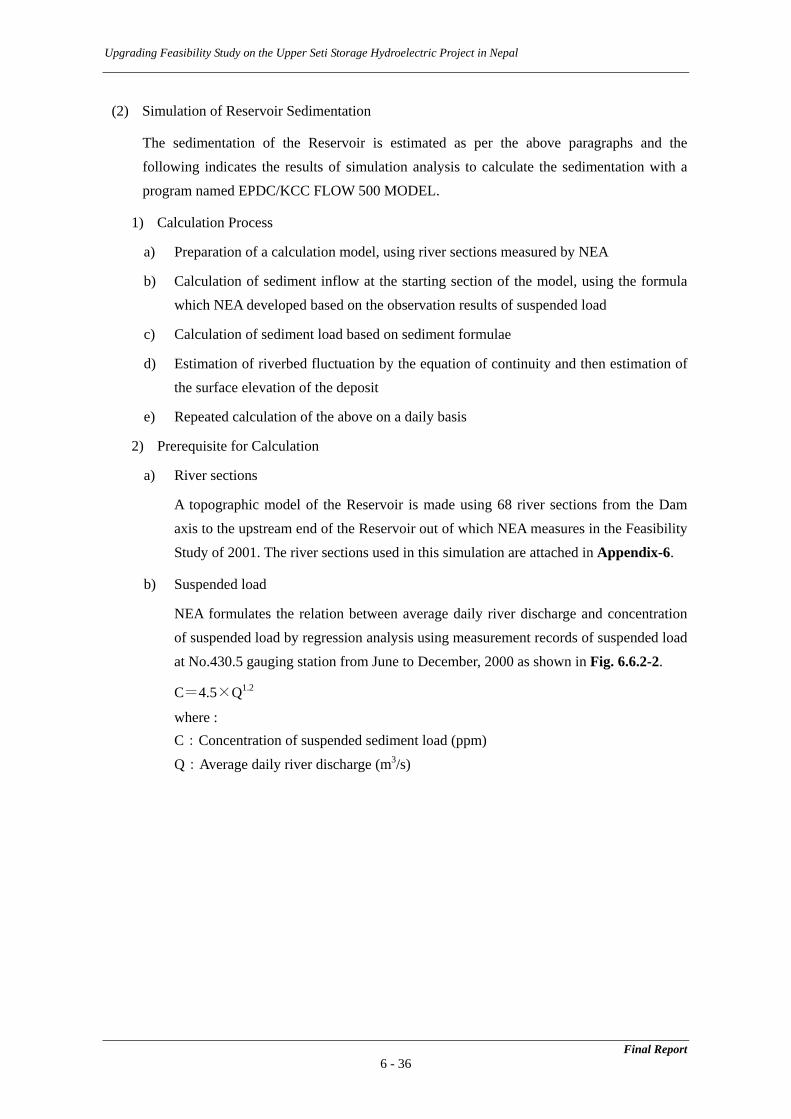
NEA formulates the relation between average daily river discharge and concentration of suspended load by regression analysis using measurement records of suspended load at No.430.5 gauging station from June to December, 2000 as shown in Fig. 6.6.2-2.
C=4.5×Q1.2
where : C:Concentration of suspended sediment load (ppm) Q:Average daily river discharge (m3/s)
Final Report 6 - 36

Upgrading Feasibility Study on the Upper Seti Storage Hydroelectric Project in Nepal
Final Report 6 - 37
1
10
1,00
10,00
100,000
100 1,000 10,000
River discharge (m3/sec)
Susp
ende
d se
dim
ent
concentr
atio
n (
ppm
)
0
10
0
0
0
2000
2001
2004
C=4.5*Q^1.2
Fig. 6.6.2-2 Rating Curve of Suspended Load Concentration
c) Particle diameter of sediment
NEA develops the gradation curves as shown in Fig. 6.6.2-3, based on those in Fig. 6.6.1-1 to Fig. 6.6.1-6, dividing the gradation into two classes. One curve shows a distribution of smaller particles in the section between the Dam and about 27 km upstream from it, described “Downstream” in the figure, and the other shows that of larger particles in the remaining section of 1 km long, described “Upstream.” The porosity of 0.5 is used for the simulation.

Upgrading Feasibility Study on the Upper Seti Storage Hydroelectric Project in Nepal
Final Report 6 - 38
0
20
40
60
80
100
0.01 0.1 1 10 100
Particle size (mm)
Perc
ent
pass
ing
(%)
DX-1~9,RX-1~56
RX-57~59
Fig. 6.6.2-3 Gradation Curve of Sediment used for Simulation Analysis
d) Bed load
It is quite difficult to measure quantity of bed load directly moving on a riverbed4 because its quantity varies greatly from time to time and with a place. Amount of bed load is measured using noise when bed load moves on a riverbed on an experimental basis. So amount of bed load is expressed by its ratio to that of suspended load, and the ratio hardly exceeds 25 %5. The ratio is estimated at 20% in this simulation.
e) River discharge
Average daily river discharge from 1964 to 1999 at the Dam site is used for this simulation as calculated in 6.3.
f) Reservoir water level
FSL is set at EL. 425.00 m and MOL at EL. 370.00 m, respectively, following the NEA’s Feasibility Study.
3) Simulation of Deposit Shape
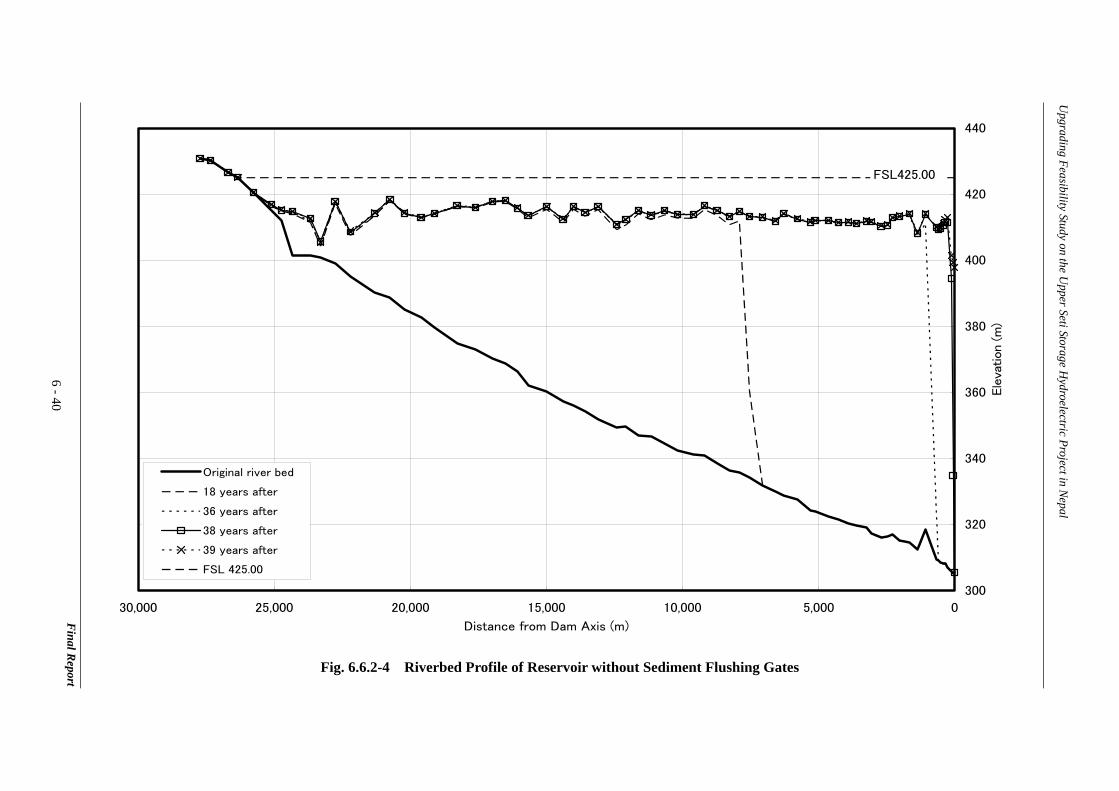
The riverbed profile is as shown in Fig. 6.6.2-4. The calculation result tells that foreset beds reach near the Dam and that the Reservoir is to be filled with sediment after 39 years from completion. That result is almost the same as the estimation developed by the Brune’s diagram, telling that the Reservoir will be filled with sediment after 42 years from completion, described in the previous paragraph, (1).
The average annual sediment yield corresponding to the average daily river discharge
4 Gregory L. Morris, Jiahua Fan, Reservoir Sedimentation Handbook, McGraw-Hill Books Company Inc., 1997 5 Calvin Victor Davis, Handbook of Applied Hydraulics, McGraw-Hill Books Company Inc., 1952

Upgrading Feasibility Study on the Upper Seti Storage Hydroelectric Project in Nepal
from 1964 to 1999 is 11.55 MCM, and this is converted into specific sediment yield as 11.55MCM / 1,502 km2 = 7,690 m3/km2/year. NEA calculates specific sediment yield
based on the measurement records of suspended sediment at No. 430.5 gauging station at 6,244 m3/km2/year and it almost equals to the Study team’s estimation.
Final Report 6 - 39
U
pgrading Feas
300
320
340
360
380
400
420
440
05,000
Ele
vation (m
)
FSL425.00 ibility Study on the Upper Seti Storage H
ydroelectric Project in Nepal
6-40
10,00015,00020,00025,00030,000
Distance from Dam Axis (m)
Original river bed
18 years after
36 years after
38 years after
39 years after
FSL 425.00
Final R
eport
Fig. 6.6.2-4 Riverbed Profile of Reservoir without Sediment Flushing Gates

Upgrading Feasibility Study on the Upper Seti Storage Hydroelectric Project in Nepal
Final Report 6 - 41
(3) Comparison with NEA’s Simulation Results
NEA estimates the riverbed fluctuation in the Feasibility Study of 2001 and the Upgrading Feasibility Study of 2004 using a simulation program named HEC-66. To compare both simulation results, the riverbed fluctuation is calculated by EPDC/KCC FLOW 500 MODEL using input and conditions of the simulation in the NEA’s Upgrading Feasibility Study of 2004.
The difference of input and conditions of the simulation between the NEA’s Upgrading Feasibility Study of 2004 and the Study Team as described in 6.6.2 (2) 2) is as follows.
a) Amount of suspended sediment load
NEA formulates the relation between average daily river discharge and concentration of suspended load by regression analysis using measurement records of suspended load from June to December, 2000 at No.430.5 gauging station and from June to September and from July to October, 2004 at the Bhimad Bajar bridge as shown in Fig. 6.6.2-5. FSL is set at EL. 425.00 m and MOL at EL. 370.00 m following the NEA’s Feasibility Study. C=0.0369*Q2.0686 (Q<100m3/s) C=15.939*Q0.8607 (Q>100m3/s)
10
100
1,000
10,000
100,000
10 100 1,000 10,000
River discharge (m3/sec)
Susp
ende
d s
edi
ment
concentr
atio
n (
ppm
)
2000
2001
2004
Q < 100m3/sec
Q > 100m3/sec
C=4.5*Q^1.2
Fig. 6.6.2-5 Rating Curve of Suspended Load Concentration
6 NEA does not estimate the riverbed fluctuation with sediment flushing operation

Upgrading Feasibility Study on the Upper Seti Storage Hydroelectric Project in Nepal
Final Report 6 - 42
where : C:Concentration of suspended sediment load (ppm) Q:Average daily river discharge (m3/s)
b) Particle diameter of sediment
NEA develops the gradation curve as shown in Fig. 6.6.2-6 based on a sediment sample collected in 2004. The porosity of 0.5 is used for the simulation.
0
20
40
60
80
100
0.01 0.1 1 10 100
Particle size (mm)
Perc
ent
pass
ing
(%)
Downstream
Upstream
Fig. 6.6.2-6 Gradation Curve of Sediment used for Simulation Analysis
c) Bed load
NEA estimates the ratio of bed load to suspended load at 10%. d) River discharge
NEA uses average daily river discharge at No. 430.5 gauging station from 2000 to 2004 ten times to simulate the riverbed fluctuation for 50 years.
e) Reservoir water level
NEA sets the Reservoir water level at the end of each month as shown in Table 6.6.2-4.
Table 6.6.2-4 Reservoir Water Level
Year /Month
Jan. Feb. Mar. Apr. May June July Aug. Sep. Oct. Nov. Dec.
2000 420.7 414.3 405.0 393.1 404.7 410.0 410.0 410.0 425.0 425.0 425.0 421.9
2001 415.6 407.1 391.7 370.5 370.5 421.1 410.0 410.0 425.0 425.0 425.0 423.2
2002 418.2 411.2 399.7 385.2 391.9 410.0 410.0 410.0 425.0 425.0 425.0 424.7
2003 422.5 418.8 412.4 405.0 399.7 413.6 410.0 410.0 425.0 425.0 425.0 422.8
2004 417.6 410.0 399.3 393.2 404.7 410.0 410.0 410.0 419.7 425.0 425.0 418.5

6 - 43 U
pgrading Feasibility Study on the Upper Seti Storage H
ydroelectric Project in Nepal
Final R
eport
0 15 10 52035 30 25
Fig. 6.6.2-7 Riverbed Profile of Reservoir Simulated by NEA with HEC-6

6 - 44 U
pgrading Feasibility Study on the Upper Seti Storage H
ydroelectric Project in Nepal
Final R
eport
300
320
340
360
380
400
420
440
05,00010,00015,00020,00025,00030,000
Distance from Dam Axis (m)
Ele
vation
(m)
Original river bed
10 year after
20 year after
FSL425.00
25 year after
30 year after
40 year after
50 year after
FSL 425.00
Fig. 6.6.2-8 Riverbed Profile of Reservoir with Same Conditions as HEC-6

Upgrading Feasibility Study on the Upper Seti Storage Hydroelectric Project in Nepal
Final Report 6 - 45
The riverbed profile simulated by NEA is as shown in Fig. 6.6.2-7 and by the Study team in Fig. 6.6.2-8, respectively. The figures tell as follows.
- There is difference in a slope of top-set beds between the both simulation results, and it considered that the difference is caused due to applying different formula for sediment transport;
- Foreset beds of the both simulation results make almost same progress; and - There is little difference between the both simulation results.
A decrease in effective storage capacity of the Reservoir is as shown in Table 6.6.2-5 and Fig. 6.6.2-9. A difference in a decrease rate of effective storage capacity by the both methods is estimated to be made by a difference in a slope of top-set beds.
Table 6.6.2-5 Decrease in Effective Storage Capacity of Reservoir
Years after Completion
Effective Storage Capacity (MCM)
HEC-6 (NEA) Study Team 0 270.30 270.30
25 163.21 197.40 50 93.59 134.81
0
50
100
150
200
250
300
0 10 20 30 40 50
Years
Eff
ective
Rese
rvoir C
apac
ity
(millio
n m
3) HEC-6(NEA)
Study Team
Fig. 6.6.2-9 Decrease in Effective Storage Capacity of Reservoir
(4) Geology in the Seti River Basin and Estimated Source of Sediment
Geology, a distribution and an estimated source of sediment in the Seti River basin are described below being divided into the following three areas;

Upgrading Feasibility Study on the Upper Seti Storage Hydroelectric Project in Nepal
1) from Dam site to the upstream end of the Reservoir, Bhimad Bajar;
2) from the upstream end of the Reservoir to Pokhara and its environs extending over 25 km; and
3) from Pokhara to the watershed of the basin
Details shall be referred to the separate volume of the Report, “Environmental and Social Considerations Study Report, Part B Physical Environmental Assessment, February 2007,” and “Feasibility Study Report on Upper Seti Project, Appendix-B, 2001, NEA.”
1) Area from Dam site to the upstream end of the Reservoir, Bhimad Bajar
This area is located in the Lesser Himalayan zone and consists of Pre-Cambrian to Paleozoic dolomite, slate and phyllite. Out of this area, a section between the Dam site and Geruwa shows a steep valley consisting of less weathered dolomite and slate. This area has no large-scale landslides and few sources of sediment yield. The area between Geruwa and Bhimad Bajar shows vertical cliffs consisting of terrace deposits, named the Pokhara formation, in the right bank. The Pokhara formation consists of low-cemented deposits of a matrix of calcareous silt and fine sand and fine to middle pebbles as described in the next paragraph, 2). Degradation caused by the Reservoir impoundment and erosion can demolish these cliffs, which can be a source of sediment.
2) Area from the upstream end of the Reservoir, Bhimad Bajar, to Pokhara
This area is located in the central part of the Lesser Himalayan zone and consists of the Kunchha formation composed of low-grade metamorphic rocks such as phyllite and quartzite. Quaternary deposits, the Ghachok formation and the Pokhara formation, range in the Pokhara valley with thickness of more than 100 m and the both banks of the Seti River show vertical cliffs with height of more than 60 m. The Ghachok formation consists of a matrix of calcareous silt and pebbles to boulders. The matrix containing much calcareous components is well cemented and has shows karst phenomena such as sinkholes and caves. The Pokhara formation ranging on the Ghachok formation consists of fine pebbles and is less-cemented. These Quaternary deposits can be a source of sediment if the river water erodes them. There are many landslides and gullies at Bijaipur Khola joining to the Seti River at downstream of Pokhara on the left bank and Phusre Khola joining to it on the right bank. These landslides and gullies yield sediment but these may not flow into the Reservoir at once because these are scattered in tributaries of the Seti River 25 to 35 km away from the upstream end of the Reservoir.
3) Area from Pokhara to the watershed of the basin
This area consists of low-grade metamorphic rocks of the Lesser Himalayan zone and high-grade metamorphic rocks, mainly composed of gneiss and partly containing quartzite and amphibolite, of the Higher Himalayan zone. The upstream part of this area shows
Final Report 6 - 46

Upgrading Feasibility Study on the Upper Seti Storage Hydroelectric Project in Nepal
many eroded slopes and gullies, which carries sediment in the downstream area. Satellite image analysis results show some small-scale glacier lakes less than 100 m in diameter in the area higher than EL. 3,500 m of the basin. Eroded slopes in this area and deposits under the slopes provide sediment to the Seti River, but this sediment may not be washed into the Reservoir at once because these sources of sediment is away more than around 50km from the upstream end of the Reservoir. There is little possibility that glacial lake outburst flood may carry a lot of sediment to the Reservoir at once because these lakes are small and far from the Reservoir.
Judging from geological conditions in the Seti River basin as stated above, the main sources of sediment in the Seti River basin is estimated as follows;
- Quaternary deposits ranging along the Seti River from the upstream end of the Reservoir to Pokhara;
- Slopes with landslides and gullies ranging along tributaries joining to the Seti River on the both banks downstream of Pokhara; and
- Deposits from eroded slopes ranging around the upstream end of the Seti River near the watershed.
Floods carry sediment from these sources down the Seti River. There is little possibility that a lot of sediment may be washed away into the Reservoir at once considering a positional relation between sources of sediment and the Reservoir.
(5) Result
Studies in the above paragraphs, (1), (2) and (4), conclude as follows;
- The Seti River basin is dotted with sources of sediment; - Specific sediment yield of the Seti River is larger than other project areas in Nepal; and - The Reservoir will be filled with sediment about 40 years after completion without
sediment measures.
Final Report 6 - 47

Upgrading Feasibility Study on the Upper Seti Storage Hydroelectric Project in Nepal
Final Report 6 - 48
6.6.3 Measures against Sedimentation of Reservoir
As studied in 6.6.2, the Reservoir is estimated to be filled with sediment in several decades, so some measures against sedimentation shall be taken. A degree of importance for sediment management is classified with the following two indexes as shown in Fig. 6.6.3-17.
Life of reservoir = Reservoir capacity(CAP)/ Average annual sediment inflow(MAS)
1 / Turnover rate of reservoir =Reservoir capacity(CAP)/ Average annual inflow(MAR)
Numerical values of the above indexes are calculated as follows for the Project.
Life of reservoir(CAP / MAS)= 331.7 MCM / 11.55 MCM = 28.72
1 / Turnover rate of reservoir(CAP / MAR)= 331.7 MCM / 3,381 MCM = 0.098
The values of the Project are placed in the lower middle of the figure, which means that the Reservoir will be filled with sediment in a short period of year without sediment management and that it has relatively large turnover rate.
Fig. 6.6.3-1 Relation between Turnover Rate of Reservoir and Life of Reservoir
7 Tetsuya Sumi, Research on Discharge Efficiency of Reservoir Flushing, Dam Engineering, Oct., 2000
1 / Turnover rate of reservoir = CAP / MAR (year)
(year)
Life
of r
eser
voir
= C
AP
/ MA
S
Flushing dam
Sakuma
Unazuki
Dashidaira
Kurobe
Upper Seti
Sluicing dam

Upgrading Feasibility Study on the Upper Seti Storage Hydroelectric Project in Nepal
The following measures against reservoir sedimentation are listed.
(1) Mitigation of sediment inflow
The mitigation of sediment inflow is one of the most effective measures against sedimentation if it is feasible to reduce yield and outflow of sediment in the upper reaches of the basin. This measure is especially feasible in a small basin.
A catchment area of the Project is 1,502 km2, so it is difficult to take measures to mitigate sediment inflow all over the Seti River basin as a part of the Project from economic point of view. As described in 2.2 of the separate-volume “Environmental and Social Consideration Study Report, Part B : Physical Environmental Impact Assessment,” no sediment management programs are carried out all over the basin but the District Forest Office and the District Soil Conservation Office carry out conservation programs of forest, soil and natural environment in small tributary basins. As feasible measures to mitigate sediment inflow, small-scale slope protection is planned in the basins between Pokhara and Bhimad Bajar as described in 2.3 of the above Report. Slope protection of the Seti River in Bhimad Bajar is planned as a part of the Project as described in 11.2.7.
(2) Measures to let sediment inflow pass through reservoir
The sediment management measures next to mitigation of sediment inflow are to let sediment flowing into a reservoir pass through it to prevent sediment from being piled up in it. The following methods are listed.
1) Sediment bypass
This method lets inflow of sediment pass through a reservoir and lets all or part of water containing high sediment detour around a reservoir and discharges it downstream of a dam. Applying this method to the Project, it is difficult to construct a bypass waterway which lets much amount of water detour around the Reservoir of about 25 km long from economic point of view.
2) Sluicing
This method lowers a reservoir water level less than a normal water level while water containing high sediment concentration flows into a reservoir so that tractive force which becomes more than critical value may transport sediment. Carrying out this method in the flood season, sediment inflow will be washed away to the downstream part of a reservoir and progress of sediment in the effective capacity will be decreased. If a dam has sediment flushing facilities, sediment washed away near a dam can be discharged out of a reservoir.
3) Reservoir on tributaries
If water of the main stream contains high sediment concentration, river water of the main
Final Report 6 - 49

Upgrading Feasibility Study on the Upper Seti Storage Hydroelectric Project in Nepal
stream is taken at an intake weir and conveyed to a reservoir constructed on a tributary. Sediment will not stored in a reservoir but only water, so progress of sediment in a reservoir will be prevented. The Kulekhani-I Project adopts this method.
(3) Removal of sediment deposited in reservoir
This method removes sediment deposited in a reservoir. The following methods are listed.
1) Excavation
Sediment deposited in a reservoir is excavated and removed by an excavator. Land excavation is possible if the reservoir water level is operationally reduced over a certain period of time, so this method is applicable only around the upper end of a reservoir. As described in 6.6.2 (2) 3), annual sediment inflow of the Project is estimated as 11.55 MCM, and it is difficult to excavate and remove such amount of sediment deposited in a reservoir economically considering excavation, transportation and disposal method etc., if this method is carried out around the upper end of the Reservoir.
2) Dredging
This method is to dredge sediment deposited in a reservoir under the water and to carry it out of the reservoir. Similar to the method described in the above paragraph, 1), it is difficult to remove sediment economically if a lot of sediment has to be dredged.
3) Flushing
In this method tractive force of flowing water is increased to more than critical value by lowering the reservoir water level, and sediment deposited in a reservoir downstream of a dam is carried through flushing facilities installed in a dam body or near it with such tractive force. It is generally difficult to apply excavation and dredging as described in the above paragraphs, 1) and 2), to a measure against reservoir sedimentation of high sediment inflow rate because many excavators, many trucks and a large disposal area shall be provided to cope with large amount of sediment. Flushing can be a permanent measure against reservoir sedimentation if a project site satisfies all requirements which enable flushing to be carried out in an economical way. Although flushing is evaluated as an effective measure against reservoir sedimentation as regards using tractive force of natural river flow, it is necessary to confirm that conditions of a project site such as river flow, sediment inflow, reservoir capacity, reservoir operation, etc. satisfy a requirement to apply this method. To make this method a success, sediment flushing facilities shall be installed at the lowest possible elevation, and sufficient amount of river inflow and a period of time for the sediment flushing operation shall be prepared. A lot of river water inflow is required so that a reservoir will go through the process of lowering the reservoir water level, flushing sediment and restoring the reservoir water level. This method can be applied to a project site with sufficient amount of annual inflow compared with reservoir
Final Report 6 - 50

Upgrading Feasibility Study on the Upper Seti Storage Hydroelectric Project in Nepal
Final Report 6 - 51
capacity.
Considering a sediment inflow, a river water inflow, reservoir capacity and a sediment flushing method as shown in Fig. 6.6.3-1, the Project does not have a high turnover rate of a reservoir compared with the reservoirs which discharge sediment by flushing. So a period of time for flushing shall be prepared as long as possible
Sediment flushing facilities may be installed in a dam body or in a diversion tunnel. If sediment flushing facilities are installed in a diversion tunnel, another gate shall be installed upstream of the facilities to empty the tunnel for inspection and repair works of the facilities. It costs higher to construct a gate shaft for the gate for inspection and repair works of the facilities at the inlet of the diversion tunnel. It is more economical to have a gate for inspection and repair works and sediment flushing facilities built in a dam body, so it is recommended that the sediment flushing facilities should be installed in the Dam body.
For example, the Dashidaira Dam and the Unazuki Dam in Japan, the Gebidem Dam and the Verbois Dam in Switzerland8, etc. have sediment flushing facilities built in a dam body and maintain reservoir capacity by discharging sediment periodically.
6.6.4 Sediment Discharge
The study described in 6.6.3 shows that the sediment flushing facilities shall be prepared in the Dam body. The riverbed fluctuation is estimated by the same simulation as described in 6.6.2 (2) when sediment is discharged by sediment flushing facilities.
Sediment flushing facilities shall be installed at the lowest possible elevation, as described in 6.6.3 (3) 3), so the sill elevation of the facilities is decided at EL. 320.00 m in this study. It is recommended that a hydraulic model test should be carried out during the detailed design stage to confirm the validity of the sill elevation of the facilities and to decide those detailed shapes. The riverbed fluctuation is estimated for FSL of the optimum development scale with another sill elevation of sediment flushing facilities in (2) of this section.
The Reservoir water level is lowered less than MOL during the sediment flushing operation which is carried out in the rainy season, so power generation is suspended during the operation. It is estimated that suspension of power generation of the Project in the rainy season does not affect electricity supply in Nepal because other run-of-river type hydropower plants supply sufficient electricity during the suspension. Considering effect of flushing, the Reservoir water level shall be lowered as long as possible.
The sediment flushing operation is to be carried out in the former half of the rainy season by the following reasons;
8 Proceedings, International Symposium on Sediment Management and Dams, the 2nd East Asia Dam Conference, Oct. 25-26, 2005

Upgrading Feasibility Study on the Upper Seti Storage Hydroelectric Project in Nepal
- Because a flood forecast network is not prepared in Nepal, the sediment flushing operation may not be completed within the rainy season if the operation is planned in the last period of the season in which inflow of river water decreases;
- According to the average daily river discharge record from 1964 to 1999, the average monthly river discharge gets to the maximum in August, so it is not desirable that the sediment flushing operation is carried out in August so that river water flows through sediment flushing facilities of the least possible total sectional area in an open channel condition;
- It is desirable that the sediment flushing operation is completed within July to restore the Reservoir water level to MOL and higher in the shortest possible period of time after the operation; and
- It is not desirable that the sediment flushing operation is carried out in August so that secondary electricity generation decreases due to flushing operation as little as possible.
Here, the Reservoir water level is estimated to be lowered in the first half of the rainy season as shown in Fig. 6.6.4-1.
1) The sediment flushing gates are fully opened on June 1, in the beginning of the rainy season, and the Reservoir water level is lowered from MOL to the sill elevation of sediment flushing gates.
2) It is assumed that it takes about 20 days to lower the Reservoir water level from MOL to the sill elevation of sediment flushing facilities as shown in Table 6.3-1 supposing that outflow from the gates is around 200 m3/s, twice as much as the average monthly river discharge in June, 113.3 m3/s.
3) The River flow is restored to its original state. Sediment deposited in the Reservoir is washed away to the Dam by flooding at the beginning of the rainy season and discharged from the Reservoir through sediment flushing gates, while water containing a high sediment concentration is allowed to flow out via the reservoir.
4) The sediment flushing gates are closed on July 31 and the Reservoir water level rises to the MOL.
Final Report 6 - 52

Upgrading Feasibility Study on the Upper Seti Storage Hydroelectric Project in Nepal
Final Report 6 - 53
Fig. 6.6.4-1 Reservoir Operation Curve
All of suspended load is assumed to be discharged from the reservoir and the bed load is also discharged at a ratio of 50% of the total amount washed away by tractive force, corresponding to the discharge from the sediment flushing facilities. The other input data are the same as in described in 6.6.2 (2).
(1) Riverbed Fluctuation for Various FSLs
The riverbed fluctuation is simulated for a combination of FSLs of EL.375.00 m, EL. 395.00 m, EL. 425.00 m and EL. 435.00 m, and MOL of EL.370.00 m so that the simulation results will be used for a study on optimization of the development plan implemented in Chapter 10. The simulation results are as shown in Figs. 6.6.4-2 to 6.6.4-5.
The results are interpreted as follows:
1) The shapes of a riverbed will remain almost constant after 72 years from completion, but there are small fluctuations because the sediment inflow changes every year.
2) No pivotal point of the sedimentation delta is found in any of the FSLs. Since river discharge data change every year and the sediment flushing operation is conducted every year, no such pivotal point is presumed to appear.
3) The riverbed shapes will not be in parallel with the original riverbed in the upstream area of the Reservoir, but rather parallel to the downstream area. Cumulative sediment volumes for each of the FSLs after 108 years from completion, and the maximum sediment volume in the course of 108 years, as well as the year in which the maximum sediment volume appears, are as shown in Table 6.6.4-1. The change in sediment volume for each FSL is as shown in Fig. 6.6.4-6. Because the sediment inflow varies year by year as the river discharge varies, the sediment volume of the Reservoir does not always peak at the 108 year interval.
Reservoir water level
Sediment flushing gate sill MOL
320
FSL
MOL
FSL
1/1 6/1 6/20 7/31 8/2 12/31

Upgrading Feasibility Study on the Upper Seti Storage Hydroelectric Project in Nepal
Table 6.6.4-1 Summary of the Sediment Volume in Reservoir
Sediment in Reservoir Maximum sediment volume After 108
years FSL Years in after Completion
Volume (1,000 m3) (1,000 m3)
375.00 106,772 115,918 73
395.00 117,257 130,829 89
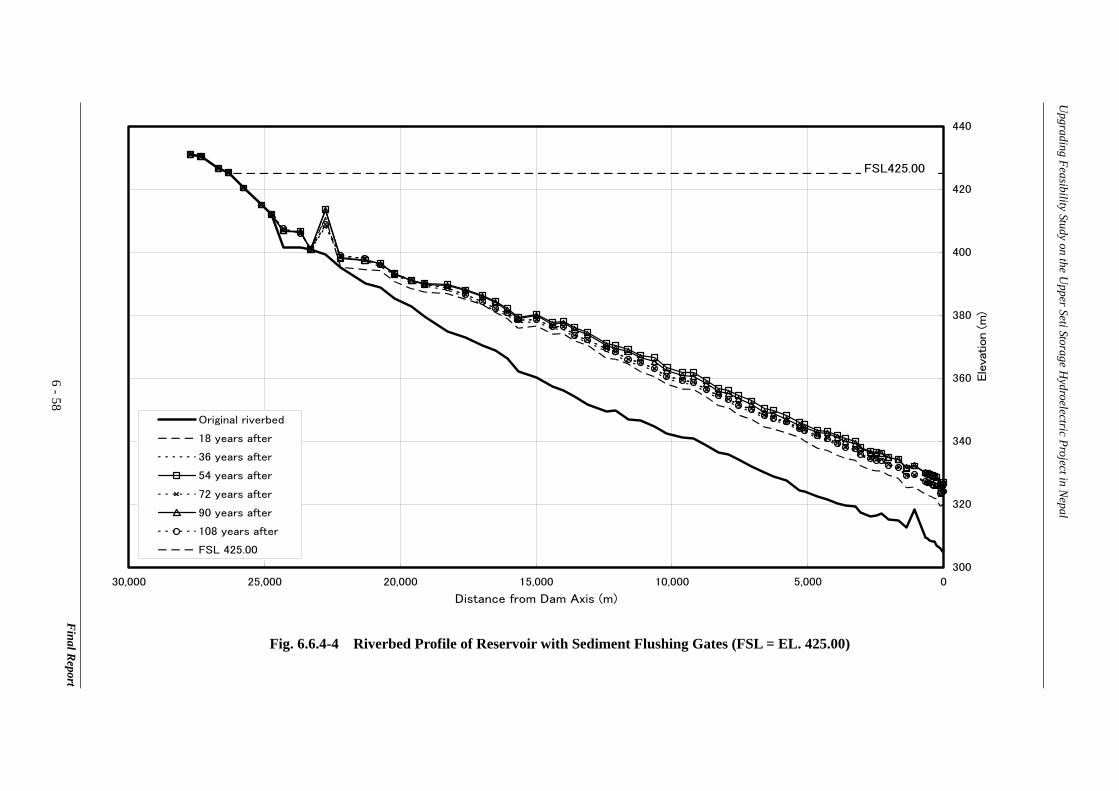
425.00 108,643 125,727 53
435.00 119,257 138,799 89
Average 127,818
4) As shown in Table 6.6.4-1, the maximum sediment volume in the Reservoir for FSL of EL. 395.00 m exceeds that of EL. 425.00 m. In addition, as shown in Fig. 6.6.4-6, the sediment volume for FSL of EL. 425.00 m exceeds that for FSL of EL. 395.00 m up to around 65 years after completion, and from around 75 years after completion, sediment volume for FSL of EL. 395.00 m has exceeded that for FSL of EL. 425.00 m. Although Figs. 6.6.4-3 and 6.6.4-4 show almost constant sediment deposit shapes in both cases after 72 years, sediment volume for FSL of EL. 395.00 m shows a growth trend although that for FSL of EL. 425.00 m shows no trend to increase.
The distribution of a flow velocity at each section of the Reservoir after 72 years is shown in Fig. 6.6.4-7. A flow velocity in the upstream section in the cases of FSLs of EL. 375.00 m and EL. 395.00 m is much faster than that in the cases of FSLs of EL. 425 m and EL. 435 m. There are narrow river sections in the Reservoir in the cases of FSLs of EL. 425.00 m and EL. 435.00 m, and a flow velocity slows due to sediment stored in those sections. While, these sections are not included in the Reservoir in the case of FSLs of EL. 375.00 m and EL. 395.00 m, the fast river flow seems to transport relatively large particles to the downstream area of the Reservoir, where those particles are then deposited. Such large particles tend not to flow out from the Reservoir during the sediment flushing operation, meaning that the sediment volume will continue increasing in the cases of FSLs of EL. 375.00 m and EL. 395.00 m.
The relation between the river discharge and water level near Bhimad Bajar, which lies at the upstream end of the Reservoir, corresponding to the original riverbed profile and four kinds of FSLs as stated above, after 108 years from completion, are calculated. The results are as shown in Table 6.6.4-2 and rating curves are in Fig. 6.6.4-8, respectively, showing that the progress of sedimentation does not cause an increase in the river water level at Bhimad Bajar.
Final Report 6 - 54

Upgrading Feasibility Study on the Upper Seti Storage Hydroelectric Project in Nepal
Table 6.6.4-2 Rating Curve of the Seti River at the RX-54 Section
FSL (EL. m) River discharge 375.00 395.00 415.00 425.00 435.00 Original
riverbed Water level at the RX-54 Section after 108 years from completion (EL. m)
(m3/s)
0 415.10 415.10 415.12 416.93 425.00 435.00 1,000 421.33 421.27 421.27 421.12 425.12 434.99 2,000 423.51 423.51 423.51 423.23 425.40 434.96 3,000 424.86 424.86 424.86 424.47 425.74 434.88 4,000 426.31 426.31 426.31 426.31 426.31 434.75 5,000 428.10 428.10 428.10 428.11 428.10 434.55 6,000 429.79 429.79 429.79 429.80 429.79 434.26 7,000 431.40 431.40 431.40 431.40 431.40 433.83 7,500 432.17 432.17 432.17 432.17 432.17 433.53
The relation between the river discharge and the water level at the RX-53 section, where the Seti River narrows and there is some possibility of the flowing water eroding both sides of the riverbank, corresponding to the original riverbed profile and four kinds of FSLs, as stated above after 108 years from completion, is calculated and the results are as shown in Table 6.6.4-3.
Table 6.6.4-3 Rating Curve of the Seti River at the RX-53 Section
FSL (EL. m) 375.00 395.00 415.00 425.00 435.00 Original
riverbed River
discharge Water level at RX-53 section after 108 years from completion
(EL.m) (m3/s) (EL.m)
0 412.11 413.15 412.20 425.00 435.00 412.31 1,000 418.46 418.51 418.51 418.48 425.12 435.03 2,000 420.85 420.85 420.85 420.85 425.42 435.08 3,000 422.63 422.63 422.63 422.62 425.94 435.18 4,000 424.23 424.49 424.49 424.25 426.65 435.31 5,000 425.54 426.46 426.46 425.55 427.54 435.46 6,000 426.62 428.26 428.26 426.64 428.61 435.65 7,000 427.61 429.81 429.81 427.61 429.82 435.91 7,500 428.08 430.52 430.52 428.10 430.44 436.06
Final Report 6 - 55

U
pgrading Feas
300
320
340
360
380
400
420
440
05,00010,00015,00020,00025,00030,000
Distance from Dam Axis (m)
Ele
vation (m
)
ibility Study on the Upper Seti Storage H
ydroelectric Project in Nepal
FSL 375.00
6-56
Original riverbed
18 years after
36 years after
54 years after
72 years after
90 years after
108 years after
FSL 375.00
Final R
eport
Fig. 6.6.4-2 Riverbed Profile of Reservoir with Sediment Flushing Gates (FSL = EL. 375.00)

U
pgrading Feas
300
320
340
360
380
400
420
440
05,00010,00015,00020,00025,00030,000
Distance from Dam Axis (m)
Ele
vation (m
)
ibility Study on the Upper Seti Storage H
ydroelectric Project in Nepal
FSL395.00
6-57
Original riverbed
18 years after
36 years after
54 years after
72 years after
90 years after
108 years after
FSL 395.00
Final R
eport
Fig. 6.6.4-3 Riverbed Profile of Reservoir with Sediment Flushing Gates (FSL = EL. 395.00)
U
pgrading Feas
ibility Study on the Upper Seti Storage H
ydroelectric Project in Nepal
Final R
eport6
-58
300
320
340
360
380
400
420
440
05,000
Ele
vation (m
)
FSL425.00
10,00015,00020,00025,00030,000
Distance from Dam Axis (m)
Original riverbed
18 years after
36 years after
54 years after
72 years after
90 years after
108 years after
FSL 425.00
Fig. 6.6.4-4 Riverbed Profile of Reservoir with Sediment Flushing Gates (FSL = EL. 425.00)

U
pgrading Feas
300
320
340
360
380
400
420
440
05,00010,00015,00020,00025,00030,000
Distance from Dam Axis (m)
Ele
vation (m
)
FSL 435.00
ibility Study on the Upper Seti Storage H
ydroelectric Project in Nepal
6-59
Original riverbed
18 years after
36 years after
54 years after
72 years after
90 years after
108 years after
FSL 435.00
Final R
eport
Fig. 6.6.4-5 Riverbed Profile of Reservoir with Sediment Flushing Gates (FSL = EL. 435.00)

U
pgrading Feas
ibility Study on the Upper Seti Storage H
ydroelectric Project in Nepal
0
20
40
60
80
100
120
140
160
0 10 20 30 40 50 60 70 80 90 100 110
Year
Sedim
ent Volu
me (m
illio
n m
3)
FSL 375.00 FSL 395.00 FSL 425.00 FSL 435.00
6-60
Final R
eport
Fig. 6.6.4-6 Cumulative Sediment Volume in Reservoir

U
pgrading Feas
0.00
0.20
0.40
0.60
0.80
1.00
1.20
1.40
RCX
59
RCX
54
RCX
49
RCX
44
RCX
39
RCX
34
RCX
29
RCX
24
RCX
19
RCX
14
RCX
9
RCX
4
DX 2
DX 7
Section No.
Flo
w V
elo
city
(m
/sec
)
FSL 375.00
FSL 395.00 ibility Study on the Upper Seti Storage H
ydroelectric Project in Nepal
FSL 425.00
FSL 435.00
6-61
Final R
eport
Fig. 6.6.4-7 Velocity of Each Section after 72 Years

U
pgrading Feas
410
420
430
440
0 1,000 2,000 3,000 4,000 5,000 6,000 7,000 8,000
River Discharge(m3/sec)
Wat
er Leve
l (E
L.m
)
ibility Study on the Upper Seti Storage H
ydroelectric Project in Nepal
6-62
Original riverflow
FSL 375.00
FSL 395.00
FSL 425.00
FSL 435.00
Fig. 6.6.4-8 Rating Curve of Seti River at the RX-54 Section
Final R
eport

Upgrading Feasibility Study on the Upper Seti Storage Hydroelectric Project in Nepal
(2) Riverbed Fluctuation for the Optimum Development Scale
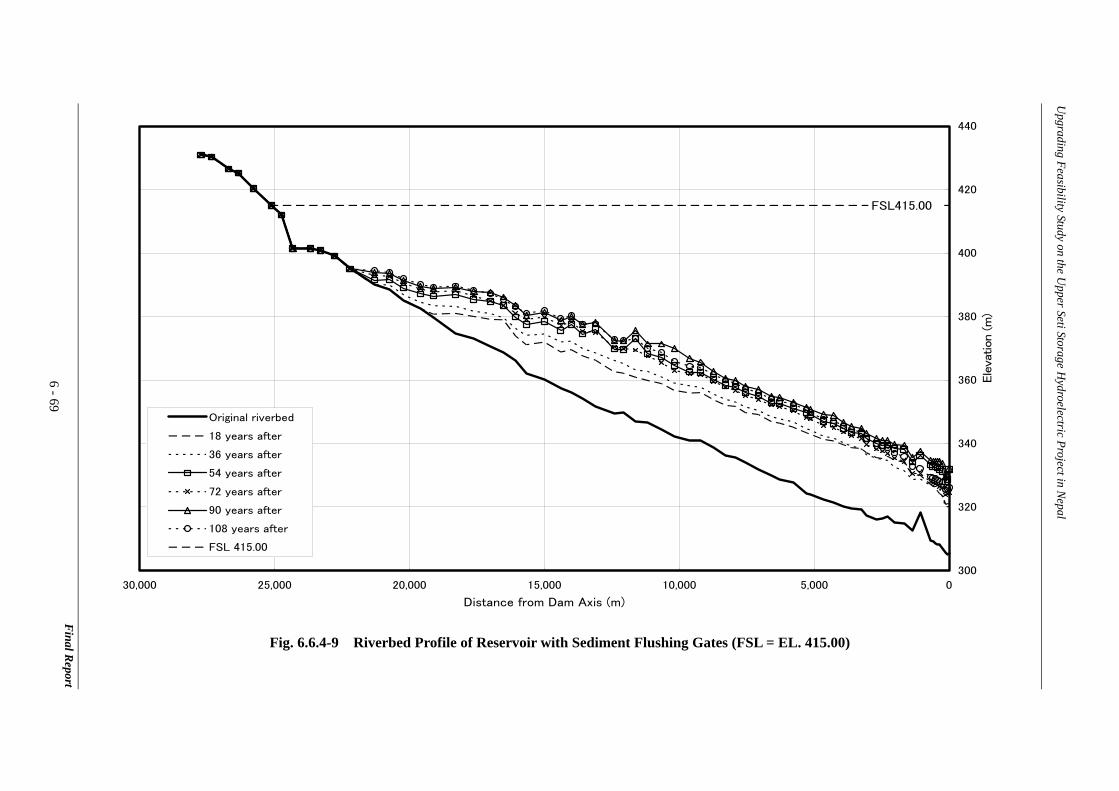
The optimum development plan is decided as the FSL of EL. 415.00 m and MOL of EL. 387.20 m in Chapter 10, while the simulation result of riverbed fluctuation over 108 years is as shown in Fig. 6.6.4-9.
To study the relation between the sill elevation of sediment flushing facilities and a situation of sediment in the Reservoir, the riverbed fluctuation is simulated when the sill elevation of the facilities is raised by 10 m to EL. 330.00 m as shown in Fig. 6.6.4-10. The cumulative and maximum sediment volumes after 108 years from completion, as well as the year in which the sediment volume peaks, are as shown in Table 6.6.4-4, while the change in sediment volume is as shown in Fig. 6.6.4-11. Here, the case with the sill elevation of EL. 320.00 m is referred to as “Case 320”, and that of EL. 330.00 m as “Case 330”, respectively. The table and figure prove that, in Case 330, the riverbed elevation rises by the difference in the sill elevation all over the Reservoir and that the amount of sediment in the Reservoir shows an increase of about 25 % over Case 320. Case 330 can shorten the necessary time to lower the Reservoir water level from MOL to the sill elevation by only on the order of one day from Case 320. Judging from differences between Case 320 and Case 330 as stated above, the sill elevation of Case 320 decided from topographical conditions is better than that of Case 330.
Table 6.6.4-4 Summary of Sediment Volume in Reservoir
Sediment volume in Reservoir Sediment flushing gate
sill elevation Maximum sediment volume After 108 years Years after
completion Volume (1,000 m3) (1,000 m3)
320.00 126,434 138,635 89 330.00 162,952 169,943 89
(3) Study on Frequency of the Sediment Flushing Operation
To confirm the effect of the sediment flushing operation, the riverbed fluctuation is simulated when the flushing operation is carried out every two years, namely, in two, four, six, eight and so on years after completion, and every three years, namely, in three, six, nine, twelve and so on years after completion. The Reservoir is operated as shown in Fig. 6.6.4-1 in the years when the sediment flushing operation is carried out, and in Fig. 6.6.4-12 in the years when this is not done, respectively.
Final Report 6 - 63

Upgrading Feasibility Study on the Upper Seti Storage Hydroelectric Project in Nepal
Final Report 6 - 64
Fig. 6.6.4-12 Reservoir Operation Curve without Flushing
The simulation results are as shown in Fig. 6.6.4-13 and Fig. 6.6.4-14, proving that sediment advances year by year without the yearly sediment flushing operation. The cumulative and maximum sediment volumes after 108 years from completion, as well as the year in which the sediment volume peaks, are as shown in Table 6.6.4-5, while the change in sediment volume is as shown in Fig. 6.6.4-15.
Table 6.6.4-5 Summary of Sediment Volume in Reservoir
Sediment volume in Reservoir Maximum sediment volume Frequency of sediment
flushing operation After 108 years (1,000 m3) Volume
(1,000 m3) Years after completion
Every year 126,434 138,635 89 Every 2 years 246,733 261,389 89 Every 3 years 283,314 288,390 107
(4) Study on the Sediment Flushing Operation Period
To confirm the effect of the sediment flushing operation period, the riverbed fluctuation is simulated for FSL of EL.415.00 m, when the sediment flushing operation period is shortened. The Reservoir is operated as shown in Fig. 6.6.4-16 when the flushing operation is carried out from June 20 to July 15 and from June 20 to July 5.
Fig. 6.6.4-16 Revised Reservoir Operation Curve
Reservoir water level
Sediment flushing gate sill
MOL
FSL
MOL
320
FSL
1/1 6/1 6/20 12/317/157/ 5
7/17→ Fig.6.6.4-17 7/ 7 → Fig.6.6.4-18
Reservoir water level
MOL
7/31
FSL
MOL
FSL
1/1 6/1 12/31
Upgrading Feasibility Study on the Upper Seti Storage Hydroelectric Project in Nepal
The simulation results are as shown in Fig. 6.6.4-17 when the flushing operation is carried out from June 20 to July 15 and in Fig. 6.6.4-18 from June 20 to July 5, respectively. The table and figure prove that sediment advances year by year when a period of the sediment flushing operation is shortened from that of Fig. 6.6.4-1. The cumulative and maximum sediment volumes after 108 years from completion, as well as the year in which the sediment volume peaks, are as shown in Table 6.6.4-6, while the change in sediment volume is as shown in Fig. 6.6.4-19.
Table 6.6.4-6 Summary of Sediment Volume in Reservoir
Sediment in Reservoir Date when sediment flushing
gates are closed Maximum sediment volume After 108 years Years after
completion Volume (1,000 m3) (1,000 m3)
On July 31 126,434 138,635 89
On July 15 272,726 281,211 93
On July 05 322,935 324,193 102
(5) Study on Influence of 100-year Probable Flood
The riverbed fluctuation is simulated when a flood occurs. The simulation result of a case when a flood returning once a century, peak discharge of 3,126 m3/s, occurs in the 36th year, is shown in Fig. 6.6.4-20 and in the 72nd year in Fig. 6.6.4-21, respectively. The figures prove that the flood hardly affects the riverbed profile.
(6) Study on Influence of Gradation Curve
The riverbed fluctuation is simulated by using the gradation curve as shown in Fig. 6.6.2-3 converted from NEA’s gradation curves as shown in Fig. 6.6.1-1 to Fig. 6.6.1-6 in the other simulations. Another riverbed fluctuation is simulated using another gradation curve taking gravels in the riverbank into the curve as shown in Fig. 6.6.4-22.
Final Report 6 - 65

Upgrading Feasibility Study on the Upper Seti Storage Hydroelectric Project in Nepal
Final Report 6 - 66
0
20
40
60
80
100
0.001 0.01 0.1 1 10 100
Particle size (mm)
Perc
ent
pass
ing
(%)
Downstream
Upstream
Fig. 6.6.4-22 Gradation Curve of Sediment used for Simulation Analysis
The simulation result is as shown in Fig. 6.6.4-23. The cumulative and maximum sediment volumes after 108 years from completion, as well as the year in which the sediment volume peaks, are as shown in Table 6.6.4-7, while the change in sediment volume is as shown in Fig. 6.6.4-24.
Table 6.6.4-7 Summary of Sediment Volume in Reservoir
Sediment volume in reservoir Maximum sediment Gradation curve after 108 years
(1,000 m3) Volume (1,000 m3)
Year after completion
Fig. 6.6.2-3 126,434 138,635 89
Fig. 6.6.4-22 100,859 109,093 107
The figure proves that more contents of coarse particles reduce quantity of a sediment movement. In the Study, annual energy production is calculated using the simulation result for the gradation curve of Fig. 6.6.2-3, because such gradation gives less effective storage capacity of the reservoir, which results in disadvantageous conditions for energy production.
(7) Conclusions and Further Studies
The study results of sedimentology in this chapter are concluded as follows.
1) The Project has a lot of sediment inflow to the Reservoir, and sediment flushing facilities are indispensable to maintenance of the effective Reservoir capacity (see 6.6.2).

Upgrading Feasibility Study on the Upper Seti Storage Hydroelectric Project in Nepal
Final Report 6 - 67
2) The Seti River basin is dotted with a source of sediment, and there is little possibility that a lot of sediment may be washed away into the Reservoir at once considering a positional relation between sources of sediment and the Reservoir (see 6.6.2 (4)).
3) It is better to install sediment flushing facilities in the Dam body from economic point of view (see 6.6.3 (3)).
4) It is necessary to install sediment flushing facilities at the lowest possible elevation, and it is recommended that the facilities should be installed at EL. 320.00 m considering topography of the Dam site, the riverbed elevation and the positional relation between the facilities and the spillway (see 6.6.4 (2)).
5) It is recommended that the sediment flushing operation should be carried out from June 20 to July 31 lowering the Reservoir water level to the sill elevation of sediment flushing facilities (see 6.6.4).
Items to be studied in the detail design stage are as follows.
1) The simulation method of riverbed fluctuation used in this study cannot estimate three-dimensional sediment distribution near the inlet of the sediment flushing facilities, but the riverbed in the Reservoir may approximately fluctuate as described in the study. It is recommended that a hydraulic model test should be carried out during the detailed design stage to decide detailed shapes of the facilities as described in 14.1.
2) A method of the sediment flushing operation shall be studied besides a hydraulic model test as stated above.
3) In this study, riverbed fluctuation is estimated, and measures are taken in a feasibility study stage. The WB proposes a life cycle sediment management method of a circular type9 to compare some feasible management methods of reservoir sedimentation in planning, design, construction and maintenance stage, and not a linear management method to carry out a management method of reservoir sedimentation decided during a planning stage until a reservoir ends its life. It is necessary to choose the optimum management method out of the feasible management methods of reservoir sedimentation from technical and economic point of view and to carry out it during a maintenance stage in response to quantity of sediment and progress of sedimentation in the Reservoir and based on the above idea.
4) It is recommended that the sediment flushing operation should be carried out from June 20 to July 31 every year lowering the Reservoir water level to the sill elevation of sediment flushing facilities. This sediment flushing operation period is only a standard
9 A. Palmieri, Socio-economic Aspect of Reservoir Conservation, Sedimentation Management Challenges for Reservoir Stability, Third World Water Forum, March, 2003

Upgrading Feasibility Study on the Upper Seti Storage Hydroelectric Project in Nepal
to confirm the validity of the sediment flushing operation and the period shall be adjusted to a pattern of river discharge in each year in a maintenance stage. For example, it is recommended that a sediment flushing operation period should be adjusted to a degree of sedimentation in the Reservoir measured by a periodical survey in a maintenance stage.
5) It is recommended that the Reservoir water should be discharged out of sediment flushing facilities instead of a spillway in the rain season to prevent the inlet of sediment flushing facilities from being blocked by sediment and water quality in the bottom of the Reservoir from being deteriorated.
Final Report 6 - 68
U
pgrading Feasibility Study on the Upper Seti Storage H
ydroelectric Project in Nepal
300
320
340
360
380
400
420
440
05,00010,00015,00020,00025,00030,000
Distance from Dam Axis (m)
Ele
vation (m
)
Original riverbed
18 years after
36 years after
54 years after
72 years after
90 years after
108 years after
FSL 415.00
FSL415.00
6-69
Final R
eport
Fig. 6.6.4-9 Riverbed Profile of Reservoir with Sediment Flushing Gates (FSL = EL. 415.00)

U
pgrading Feasibility Study on the Upper Seti Storage H
ydroelectric Project in Nepal
300
320
340
360
380
400
420
440
05,00010,00015,00020,00025,00030,000
Distance from Dam Axis (m)
Ele
vation
(m)
Original river bed
18 years after
36 years after
54 years after
72 years after
90 years after
108 years after
FSL 415.00
FSL415.00
6-70
Final R
eport
Fig. 6.6.4-10 Riverbed Profile of Reservoir with Sediment Flushing Gates (FSL = EL. 415.00, Flushing Gates Sill = EL. 330.00)

U
pgrading Feasibility Study on the Upper Seti Storage H
ydroelectric Project in Nepal
0
50
100
150
200
0 10 20 30 40 50 60 70 80 90 100 110
Year
Sedi
ment
Volu
me (m
illio
n m
3)
Gate sill EL.320.00 Gate sill EL.330.00
6-71
Final R
eport
Fig. 6.6.4-11 Cumulative Sediment Volume in Reservoir

U
pgrading Feasibility Study on the Upper Seti Storage H
ydroelectric Project in Nepal
300
320
340
360
380
400
420
440
05,00010,00015,00020,00025,00030,000
Distance from Dam Axis (m)
Ele
vation
(m)
Original river bed
18 years after
36 years after
54 years after
72 years after
90 years after
108 years after
FSL 415.00
FSL415.00
6-72
Final R
eport
Fig. 6.6.4-13 Riverbed Profile of Reservoir with Sediment Flushing Gates (FSL = EL. 415.00, Flushing every 2 years)

U
pgrading Feasibility Study on the Upper Seti Storage H
ydroelectric Project in Nepal
300
320
340
360
380
400
420
440
05,00010,00015,00020,00025,00030,000
Distance from Dam Axis (m)
Ele
vation (m
)
Original riverbed
18 years after
36 years after
54 years after
72 years after
90 years after
108 years after
FSL 415.00
FSL415.00
6-73
Final R
eport
Fig. 6.6.4-14 Riverbed Profile of Reservoir with Sediment Flushing Gates (FSL = EL. 415.00, Flushing every 3 years)

U
pgrading Feasibility Study on the Upper Seti Storage H
ydroelectric Project in Nepal
0
50
100
150
200
250
300
0 10 20 30 40 50 60 70 80 90 100 110
Year
Sedim
ent
Volu
me
(millio
n m
3)
Every year Every 2 years Every 3 years
6-74
Final R
eport
Fig. 6.6.4-15 Cumulative Sediment Volume in Reservoir

U
pgrading Feasibility Study on the Upper Seti Storage H
ydroelectric Project in Nepal
300
320
340
360
380
400
420
440
05,00010,00015,00020,00025,00030,000
Distance from Dam Axis (m)
Ele
vation (
m)
FSL415.00
6-75
Original riverbed
18 years after
36 years after
54 years after
72 years after
90 years after
108 years after
FSL 415.00
Final R
eport
Fig. 6.6.4-17 Riverbed Profile of Reservoir when Sediment Flushing Operation Ends on July 15

U
pgrading Feasibility Study on the Upper Seti Storage H
ydroelectric Project in Nepal
300
320
340
360
380
400
420
440
05,00010,00015,00020,00025,00030,000
Distance from Dam Axis (m)
Ele
vation
(m)
FSL415.00
6-76
Original riverbed
18 years after
36 years after
54 years after
72 years after
90 years after
108 years after
FSL 415.00
Final R
eport
Fig. 6.6.4-18 Riverbed Profile of Reservoir when Sediment Flushing Operation Ends on July 5

U
pgrading Feasibility Study on the Upper Seti Storage H
ydroelectric Project in Nepal
Final R
eport6
-77
100
150
200
250
300
350Sedim
ent
Volu
me (m
illio
n m
3)
6/20-7/31 6/20-7/15 6/20-7/5
0
50
0 10 20 30 40 50 60 70 80 90 100 110
Year
Fig. 6.6.4-19 Cumulative Sediment Volume in Reservoir

U
pgrading Feasibility Study on the Upper Seti Storage H
ydroelectric Project in Nepal
300
320
340
360
380
400
420
440
05,00010,00015,00020,00025,00030,000
Distance from Dam Axis (m)
Ele
vation
(m)
FSL415.00
6-78
Original riverbed
18 years after
36years flood
36 years after
54 years after
72 years after
90 years after
108 years after
FSL 415.00
Final R
eport
Fig. 6.6.4-20 Riverbed Profile of Reservoir with 100-year Probable Flood in 36th year

U
pgrading Feasibility Study on the Upper Seti Storage H
ydroelectric Project in Nepal
300
320
340
360
380
400
420
440
05,00010,00015,00020,00025,00030,000
Distance from Dam Axis (m)
Ele
vation (m
)
FSL415.00
6-79
Original riverbed
18 years after
36 years after
54 years after
72years flood
72 years after
90 years after
108 years after
FSL 415.00
Final R
eport
Fig. 6.6.4-21 Riverbed Profile of Reservoir with 100-year Probable Flood in 72nd year

U
pgrading Feasibility Study on the Upper Seti Storage H
ydroelectric Project in Nepal
300
320
340
360
380
400
420
440
05,00010,00015,00020,00025,00030,000
Distance from Dam Axis (m)
Ele
vation
(m
)
FSL415.00
6-80
Original river bed
18 years after
36 years after
54 years after
72 years after
90 years after
108 years after
FSL 415.00
Final R
eport
Fig. 6.6.4-23 Riverbed Profile of Reservoir with Sediment Flushing Gates (FSL = EL. 415.00, Gradation Curve of Fig.6.6.4-22)

U
pgrading Feasibility Study on the Upper Seti Storage H
ydroelectric Project in Nepal
0
50
100
150
0 10 20 30 40 50 60 70 80 90 100 110
Year
Sedim
ent
Volu
me (m
illio
n m
3)
Fig.6.6.2-3 Fig.6.6.4-22
6-81
Final R
eport
Fig. 6.6.4-24 Cumulative Sediment Volume in Reservoir