Embed Size (px)
Citation preview

Update on Zero-Net Energy (ZNE) in California
October 25th, 2017
Snuller Price, Senior Partner

About Energy and Environmental Economics, Inc. (E3)
Consumer AdvocatesEnvironmental
InterestsEnergy Consumers
State Agencies Regulatory Authorities
State Executive BranchesLegislators
UtilitiesSystem Operators
Financial Institutions
Project DevelopersTechnology Companies
Asset OwnersFinanciers/Investors
2
Founded in 1989, E3 is an industry leading consultancy in North America with a growing international presence
E3 operates at the nexus of energy, environment and economics
Our team employs a unique combination of economic analysis, modeling acumen, and deep institutional insight to solve complex problems and provide critical thought leadership for a diverse client base

3
Long track record of focused building efficiency progress
Mild climate, robust economy
Range of Policies Supporting Zero-net Energy Buildings
• SB32 GHG target in 2030
• EO B-30-15 GHG target in 2050
• SB350 50% renewable portfolio standard, doubling EE levels
• EO B-18-12; ZNE state buildings (based on source energy)
• California’s integrated energy policy report (IEPR) requires ZNE Residential by 2020 and Non-residential by 2030 (based on a time-dependent valuation ‘TDV’ metric)
California Background

4
California Policy for ZNE
2015 IEPR clarified the definition of ZNE
ZNE goal applies to low-rise residential buildings by 2020 and commercial buildings by 20302
Alternative compliance and community solar1
• Approaches need to be identified to make it administratively workable and cost-effective
• Must allow for building department verification to ensure that identified resources exist and are the correct size for offsetting energy use
1 http://docketpublic.energy.ca.gov/PublicDocuments/15-IEPR-01/TN212017_20160629T154354_2015_Integrated_Energy_Policy_Report_Small_File_Size.pdf2 http://www.energy.ca.gov/2013publications/CEC-100-2013-001/CEC-100-2013-001-CMF-small.pdf
• A ZNE building is one where the value of the energy produced by on-site renewable energy resources is equal to the value of the energy consumed annually by the building… measured using the California Energy Commission’s Time Dependent Valuation metric1

5
Proposed Mechanism for ZNE
CEC has proposed a mechanism for ZNE in the 2019 code cycle1
1) CEC will calculate base EDR from prescribed energy efficiency2 for each climate zone (Base Case Home EDR)
2) CEC will calculation additional EDR reductions using PV size required to displace site kWh of base case home (Additional EDR reductions)
3) New buildings must pass both ‘tests’
1 https://www.dropbox.com/sh/cqdmx9fvj3ncnqt/AAB88Wmr3ymYdlB_Hy-OWtqWa?dl=0&preview=Mazi+Shirakh+-+CEC_ZNE+forum_2016-11-29.pdf2 Energy Design Rating (EDR) is defined as lifecycle TDV value
Base Case Home EDR
Additional EDR
reductions
Remaining EDR
Additional reductions from
PV, EE, Community
Test #1: Get home below Base EDR without PV
Test #2: Use PV to get home below residual EDR

6
California Building
System Perspective on Buildings
California Grid
Stanford Huang Engineering CenterCredit Stanford Unofficial Blog
CAISO System MapCredit CAISO Website

7
California Integrated Resource Plan (IRP) 2017–2018
• Example IRP Results are Consistent with a 30MMt Electricity Sector by 2030
California Grid is Changing
Remaining high quality wind built in first period to
capture PTC
Remaining high quality wind built in first period to
capture PTC
Near term solar build takes
advantage of ITC
Near term solar build takes
advantage of ITC
Short duration storage becomes cost effective
Short duration storage becomes cost effective
Long duration storage added to balance daily renewable productionLong duration storage added to
balance daily renewable production

8
Flexibility challenges for highly renewable systems – Spring Day
1. Downward Ramping
2. Minimum Generation
3. Upward Ramping
4. Peaking capability
Thermal resources operating to serve loads at night must be ramped downward and potentially shut down to make room for a significant influx of solar energy after the sun rises.
Overgeneration may occur during hours with high renewable production. A system with more flexibility to reduce thermal generation will incur less overgeneration.
The system will need enough resources to meet the highest peak loads with sufficient reliability.
Thermal resources must ramp up quickly and new units may be required to start up to meet a high net peak demand that occurs shortly after sundown.
5. Ancillary Services
The system needs to be flexible enough to meet short‐term balancing requirements at all times.
5

9
Different ZNE metrics include site, source, GHG with varying and important details for each
California uses Time-dependent Valuation (TDV) in Building Code (Title 24)
• Underlying cost of delivering electricity and natural gas that varies by area- and time- across California
• Reflects 16 climate zones
Pro: Integrates grid-harmonization into the metric
Con: Difficult to apply to existing buildings to get a TDV ‘score’ based on building energy usage
What do we mean by ZNE?
Average Day 30-Year NPV TDV Values for San Francisco Bay Area (CZ3) for 2019 Title 24 Update
Example TDV Values – Average Day
10
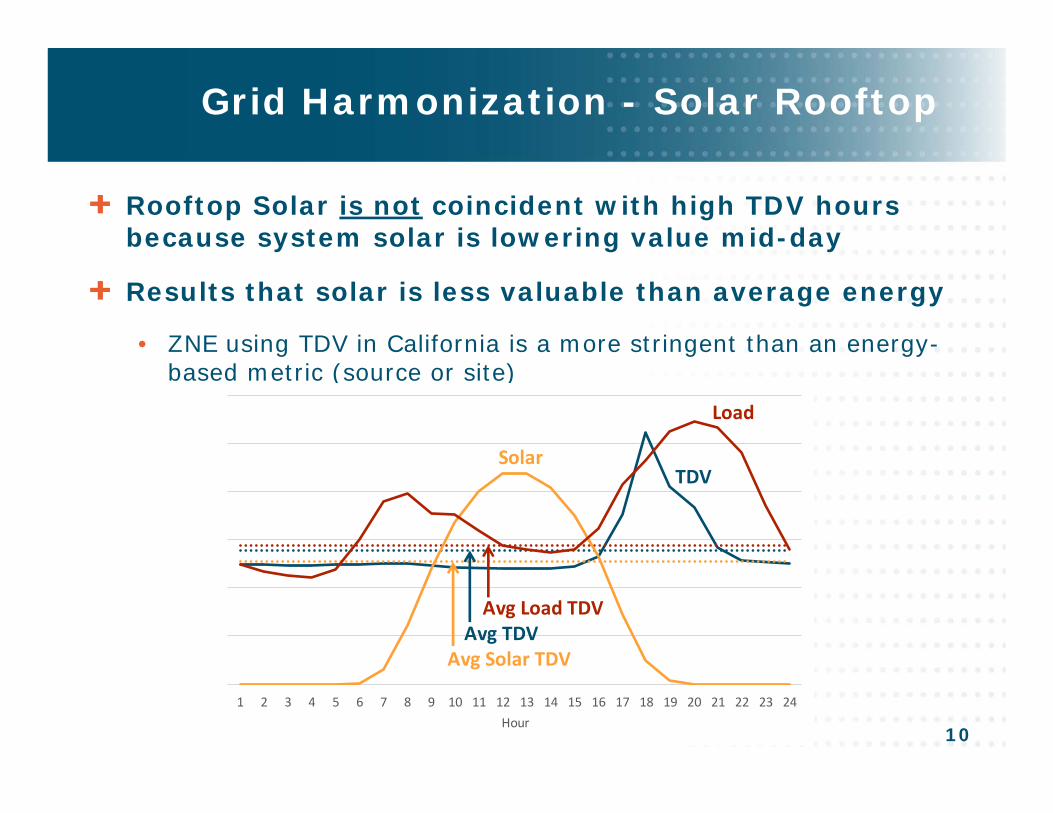
Grid Harmonization - Solar Rooftop
Rooftop Solar is not coincident with high TDV hours because system solar is lowering value mid-day
Results that solar is less valuable than average energy
• ZNE using TDV in California is a more stringent than an energy-based metric (source or site)
1 2 3 4 5 6 7 8 9 10 11 12 13 14 15 16 17 18 19 20 21 22 23 24Hour
Load
TDVSolar
Avg Solar TDVAvg TDVAvg Load TDV

11
PV system size varies significantly depending on building type, panel orientation, and climate zone
Regulatory (1 MW maximum size for net energy metering (NEM)) or physical (roof size) limits may prevent sizing PV to full load
Rooftop limitation for non-residential buildings

12
NREL Comparison
• Residential
• Residential = $2.93/W-DC
• NREL, 9/20/2016, U.S. Solar Photovoltaic System Cost Benchmark: Q1 2016, available http://www.nrel.gov/docs/fy16osti/66532.pdf
• Community
• Larger scale = $2.03/W-DC to $2.29/W-DC depending on size
• NREL, September 2016, "U.S. Solar Photovoltaic System Cost Benchmark: Q1 2016," available at http://www.nrel.gov/docs/fy16osti/67142.pdf
Relative Solar Costs
Other sourcesBrattle Report that compares residential to utility-scale prices puts utility-scale rate ~$60/MWh and Res at ~$140/MWh in 2019Utility-Scale_and_Residential-Scale_PV_in_Xcel_Energy_Colorado's_Service_Area.pdf

13
Developed storage dispatch under different TDV assumptions
Either way, charge during the day, discharge in evening
Grid Harmonization - Batteries
‐1.5
‐1
‐0.5
0
0.5
1
1.5
1 2 3 4 5 6 7 8 9 10 11 12 13 14 15 16 17 18 19 20 21 22 23 24
Storage Ch
arge/Discharge
(kW)
Hour
NEM 2.0 BTM TDV

14
Grid Harmonization –Pre-Cooling
Base case residential model assumes a cooling season set point of 78° F
By pre-cooling the building with a communicating setback thermostat to below 78° before the highest TDV hours, the building can save TDVs by allowing the temperature to rise back to 78° during these highest hours
Pre-cooling often means using more kWh than in the base case
‐
50
100
150
200
250
300
350
0
0.5
1
1.5
2
2.5
1 2 3 4 5 6 7 8 9 10 11 12 13 14 15 16 17 18 19 20 21 22 23 24
TDV
Cooling kW
h
Hour
TDV Base Case Cooling kWh Pre‐Cooling kWh

15
‐ 5,000
10,000 15,000 20,000 25,000 30,000 35,000 40,000 45,000
Base 78 Optimal
TDV
‐
50
100
150
200
250
Base 78 Optimal
kWh
Benefits of Pre-Cooling in Sacramento (Climate Zone 12)
By utilizing pre-cooling
• Cooling TDV consumption is reduced 84%
• Cooling kWh increased 19%
85%
6% Days at Cooling Schedule
75 for 2 hrs 1275 for 4 hrs 1375 for 6 hrs 1075 for 8 hrs 275 for 10 hrs 272 for 2 hrs 272 for 4 hrs 672 for 6 hrs 2872 for 8 hrs 572 for 10 hrs 975 for 6 hrs stop 2 2375 for 10 hrs stop 2 7Const 78 246
16
The approach for ZNE buildings to address natural gas consumption is a crux issue for GHG emissions
All-electric buildings with heat pump space and water heating reduce GHG emissions in California by about 50% over the life of the building
What about biogas?
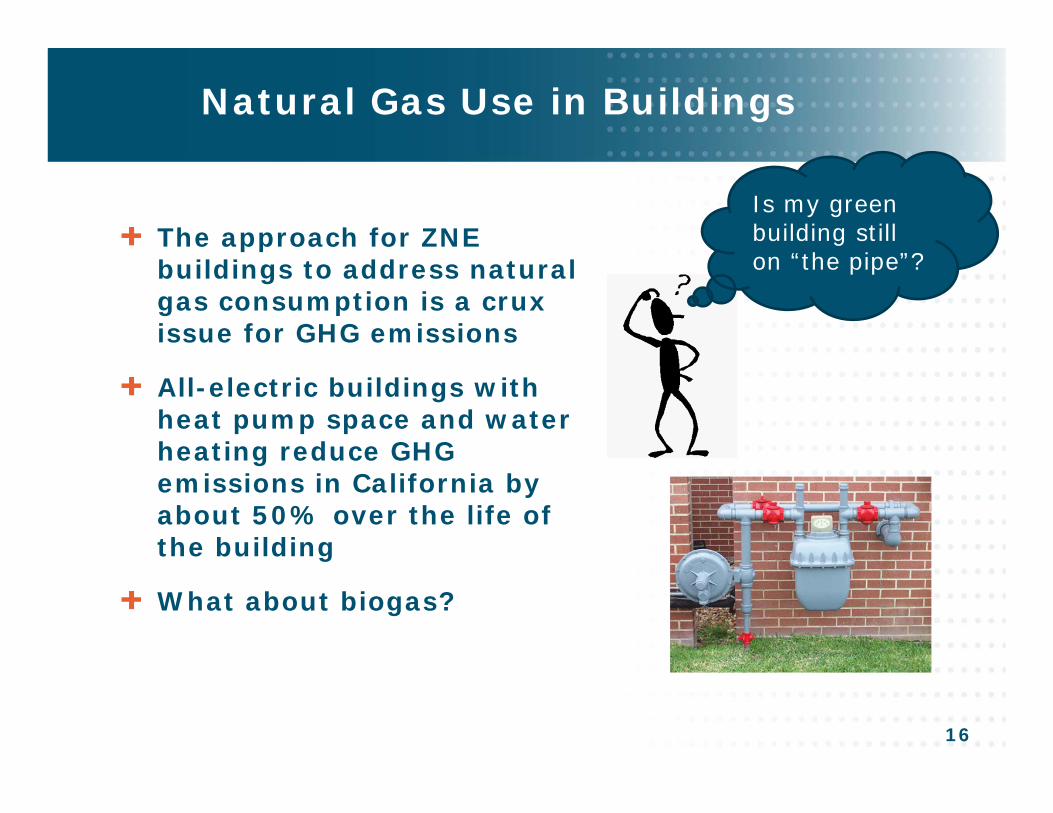
Natural Gas Use in Buildings
Is my green building still on “the pipe”?

17
Results for 2,100 sqft residential prototype for emissions and lifecycle TDVs compared between mixed-fuel and all-electric prototype homes
All-electric homes require more TDV (cost ~20% more to operate), but produce less GHGs (by ~50%) in California using the CEC Title 24 methodology
Natural Gas and GHG Emissions
0
5
10
15
20
25
30
Lifecycle E
mission
s (tons
CO2)
Cl imate Zone
Mixed‐Fuel All‐Electric
0
50,000
100,000
150,000
200,000
250,000
300,000
350,000
400,000
Lifecycle TD
V Co
nsum
ption
(kBtu)
Climate Zone
Mixed‐Fuel All‐Electric

18
Positive things about the ZNE policy in California
• We will encourage design and construction of better buildings
• innovation in building efficiency and design
• demand for green, efficient buildings
• solar roofs, an ideal place for solar from an environmental perspective
• engage building owners in their energy use, and lower their operating costs
• The TDV metric embeds grid harmonization into the metric, rewards building features that are good citizens on the grid
However, the mandate for all buildings to be ZNE is sub-optimal from a systems integration perspective and GHG policy
• Doesn’t align with California’s primary goal on GHGs
• Relies on higher cost renewable generation and less diverse generation opportunities than on the grid
• Doesn’t work for some building types with higher building density or smaller footprints without broadly redefining ZNE with off-site renewables
• A better policy would allow, but not require, the solar rooftop solar and focus on energy efficiency and grid harmonization
Summary Discussion

CONTACT INFORMATIONSnuller Price, Senior Partner415-391-5100 [email protected]