Embed Size (px)
Citation preview

Update on the MPF System in Hong Kong - Retirement Planning
and Challenges
Alice LawChief Operating Officer and Executive Director,Mandatory Provident Fund Schemes Authority
11 January 2018
Hong Kong’s
Demographic
Developments

3
Ageing Population in Hong Kong (1)
Percentage of the population aged 65 and over(excluding foreign domestic helpers)
Year 2016 Year 2066
37%
17%
4
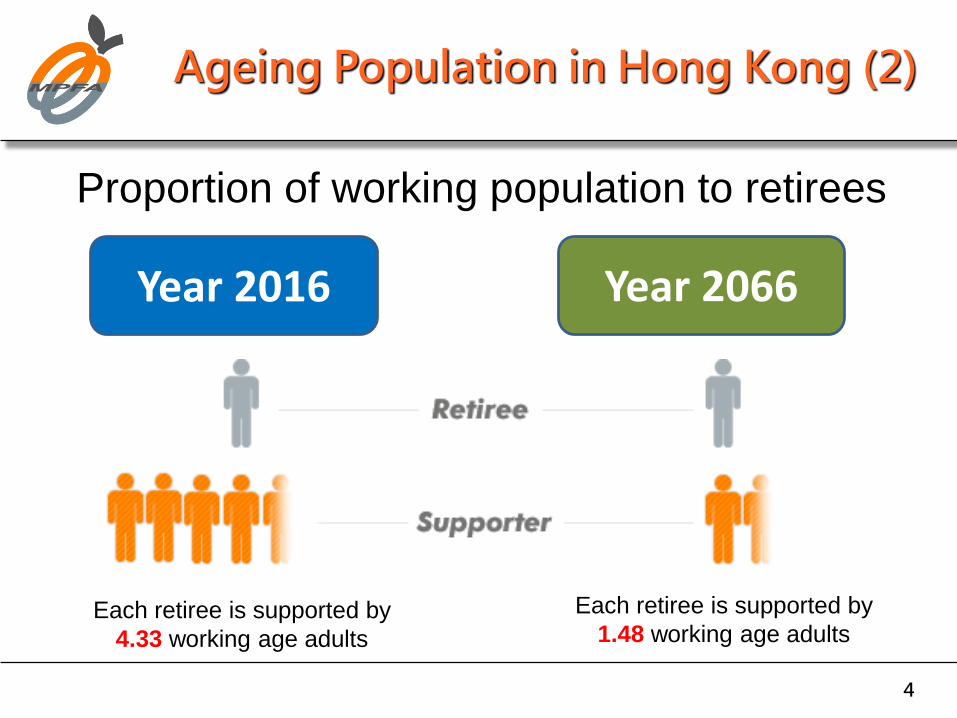
Year 2016 Year 2066
Proportion of working population to retirees
Each retiree is supported by
4.33 working age adults
Each retiree is supported by
1.48 working age adults
Ageing Population in Hong Kong (2)

5
Year 2016 Year 2066
Life expectancy of Hong Kong people
Women
Age 87
Men
Age 81
Women
Age 93
Men
Age 87
Ageing Population in Hong Kong (3)
Overview of
MPF System
7
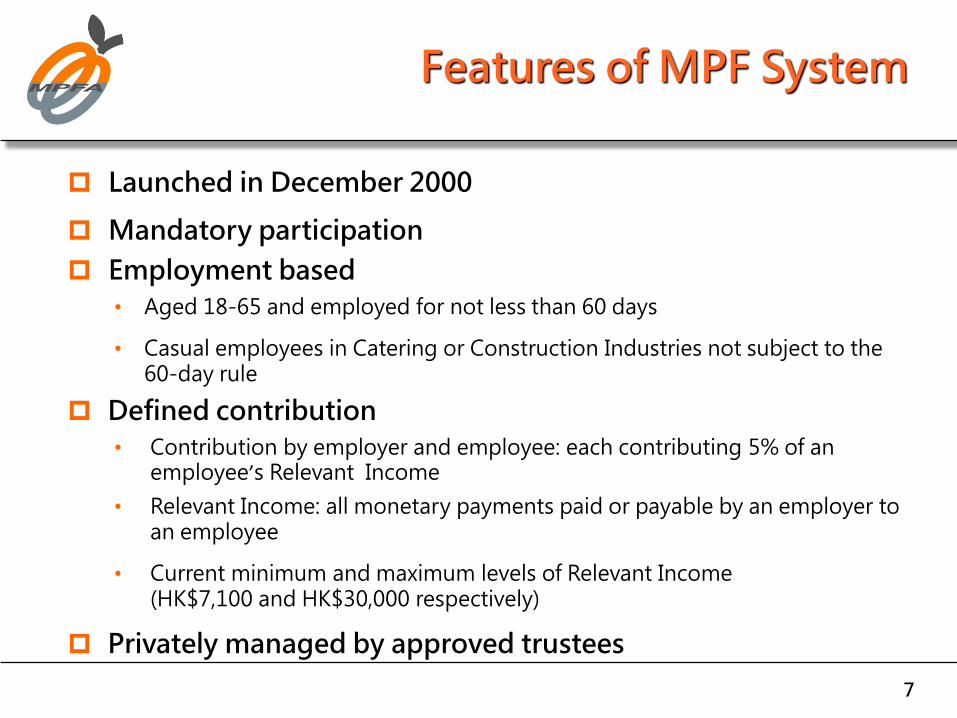
Features of MPF System
Launched in December 2000
Mandatory participation
Employment based
• Aged 18-65 and employed for not less than 60 days
• Casual employees in Catering or Construction Industries not subject to the 60-day rule
Defined contribution
• Contribution by employer and employee: each contributing 5% of an employee’s Relevant Income
• Relevant Income: all monetary payments paid or payable by an employer to an employee
• Current minimum and maximum levels of Relevant Income(HK$7,100 and HK$30,000 respectively)
Privately managed by approved trustees

8
World Bank Old Age Protection Framework
Five Pillars Framework
2. Employment based, mandatory, contributory and privately managed (e.g. MPF)
3. Voluntary savings(e.g. personal savings and insurance)
4. Informal support (e.g. family support)
Other formal social programmes (e.g. health care and housing)
Other individual assets (e.g. home ownership)
1. Mandatory, contributory and publicly managed
0. Non-contributory, publicly financed and managed (e.g. Comprehensive Social Security Assistance Scheme in Hong Kong)
9
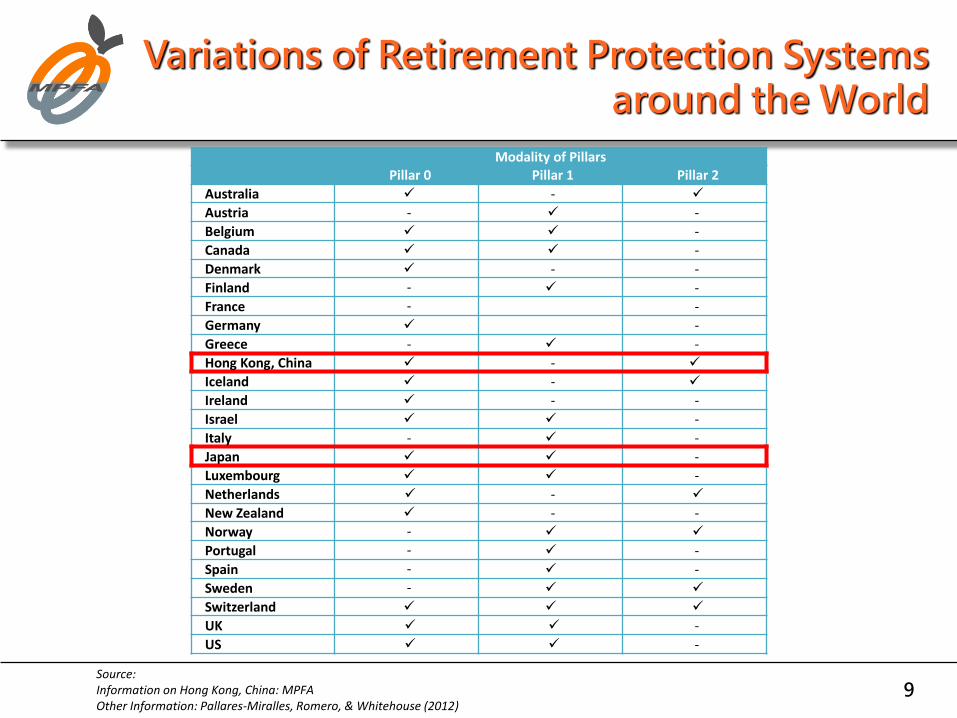
Variations of Retirement Protection Systems around the World
Modality of PillarsPillar 0 Pillar 1 Pillar 2
Australia -
Austria - -
Belgium -
Canada -
Denmark - -
Finland - -
France - -
Germany -
Greece - -
Hong Kong, China -
Iceland -
Ireland - -
Israel -
Italy - -
Japan -
Luxembourg -
Netherlands -
New Zealand - -
Norway -
Portugal - -
Spain - -
Sweden -
Switzerland
UK -
US -
Source: Information on Hong Kong, China: MPFAOther Information: Pallares-Miralles, Romero, & Whitehouse (2012)

10
As at 31 Dec 2017
With
Retirement
Protection Without
Retirement
Protection
Before Implementation of MPF System
2
3
1
3
Joined MPF schemes
73%Joined other retirement schemes(e.g. Civil Servants, ORSO)
12%
Not required to join any local retirement schemes(e.g. Domestic Helpers)
13%
Not yet joined any MPF schemes
2%
Coverage of the Employed Population by Retirement Protection in Hong Kong
11
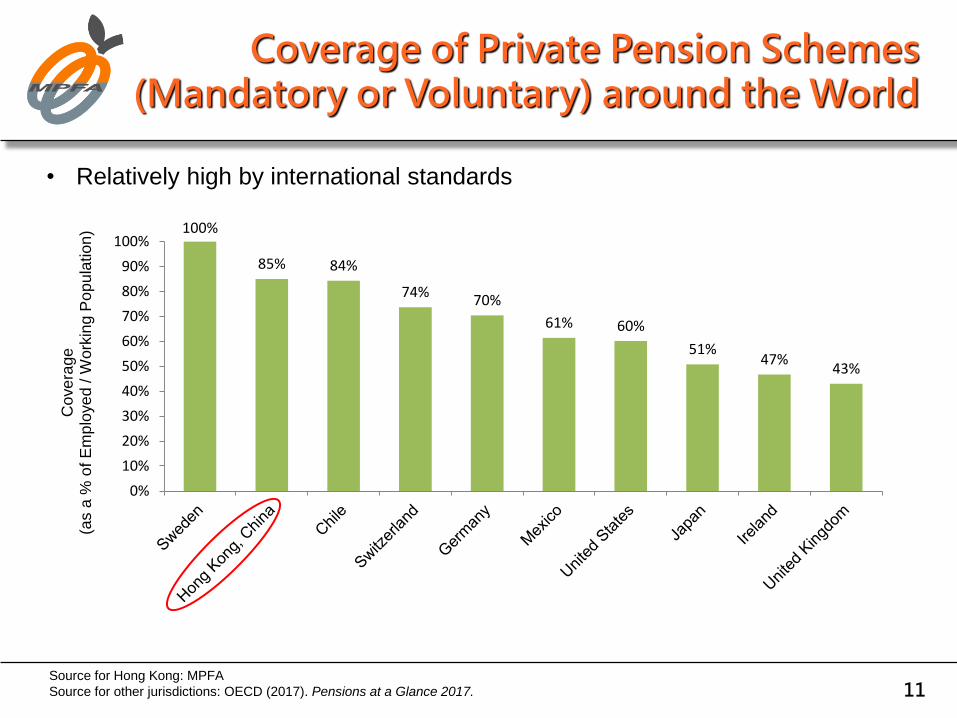
Coverage of Private Pension Schemes (Mandatory or Voluntary) around the World
100%
85% 84%
74%70%
61% 60%
51%47%
43%
0%
10%
20%
30%
40%
50%
60%
70%
80%
90%
100%
Cove
rage
(a
s a
% o
f E
mp
loye
d / W
ork
ing P
op
ula
tion
)
Source for Hong Kong: MPFA
Source for other jurisdictions: OECD (2017). Pensions at a Glance 2017.
• Relatively high by international standards

MPF Market
13
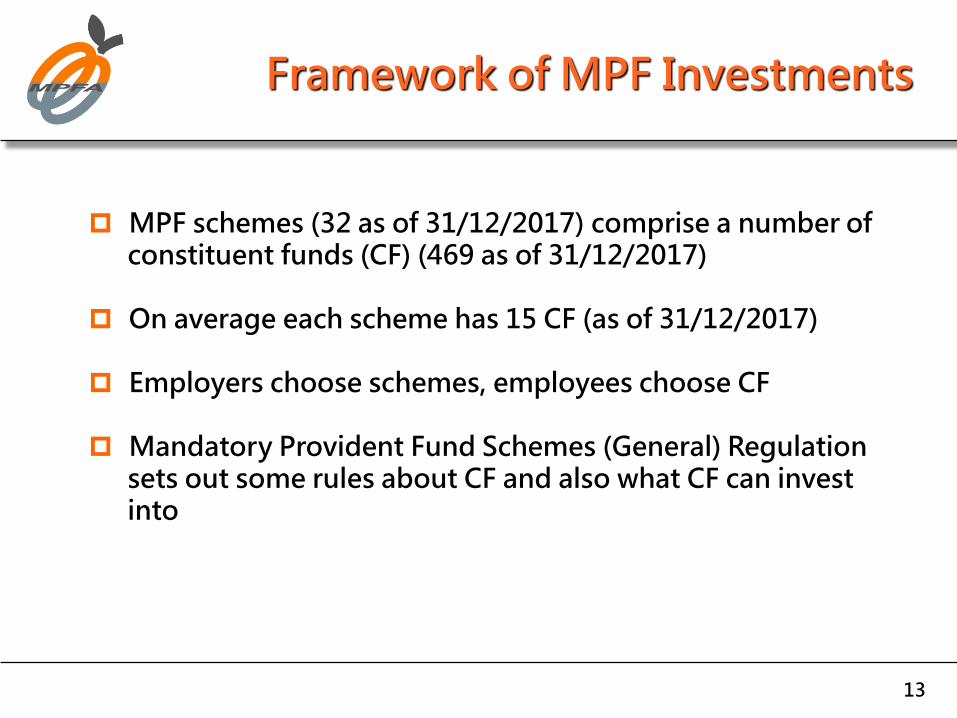
Framework of MPF Investments
MPF schemes (32 as of 31/12/2017) comprise a number of constituent funds (CF) (469 as of 31/12/2017)
On average each scheme has 15 CF (as of 31/12/2017)
Employers choose schemes, employees choose CF
Mandatory Provident Fund Schemes (General) Regulation sets out some rules about CF and also what CF can invest into
14
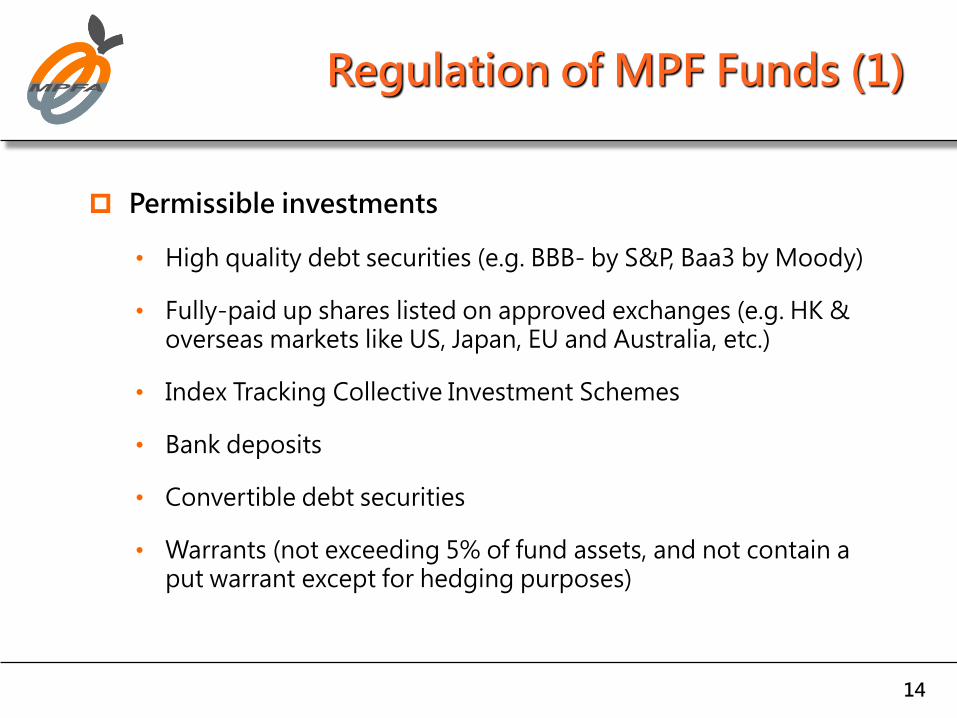
Regulation of MPF Funds (1)
Permissible investments
• High quality debt securities (e.g. BBB- by S&P, Baa3 by Moody)
• Fully-paid up shares listed on approved exchanges (e.g. HK & overseas markets like US, Japan, EU and Australia, etc.)
• Index Tracking Collective Investment Schemes
• Bank deposits
• Convertible debt securities
• Warrants (not exceeding 5% of fund assets, and not contain a put warrant except for hedging purposes)
15
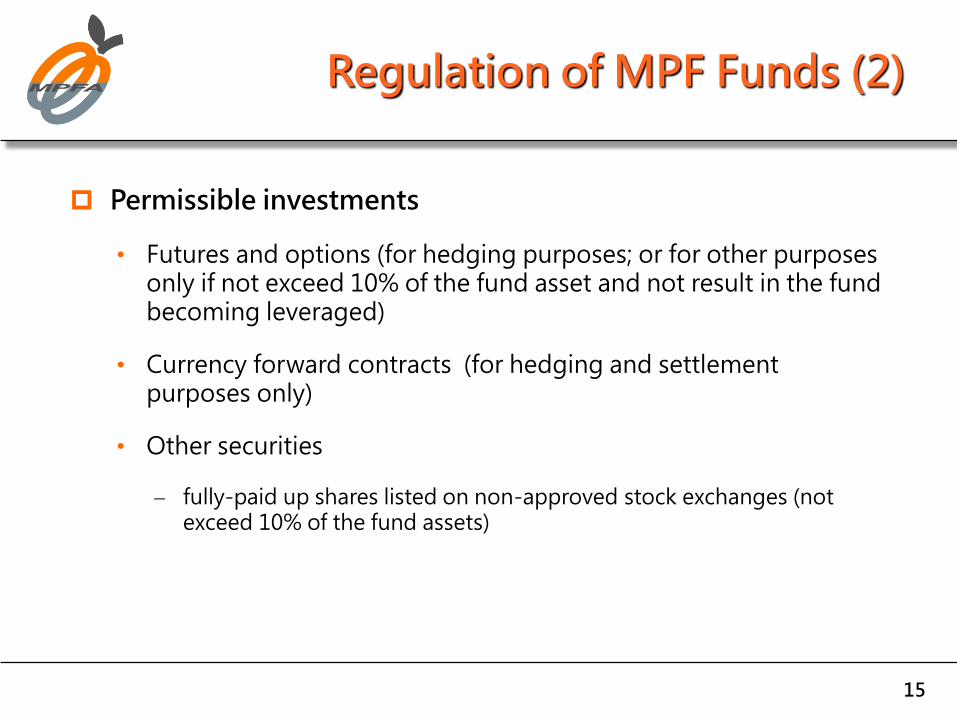
Regulation of MPF Funds (2)
Permissible investments
• Futures and options (for hedging purposes; or for other purposes only if not exceed 10% of the fund asset and not result in the fund becoming leveraged)
• Currency forward contracts (for hedging and settlement purposes only)
• Other securities
fully-paid up shares listed on non-approved stock exchanges (not exceed 10% of the fund assets)

16
Regulation of MPF Funds (3)
General restrictions
• diversification of investments
• borrowing of money
• borrowing and lending of securities
• currency exposure (minimum 30% HKD)
17
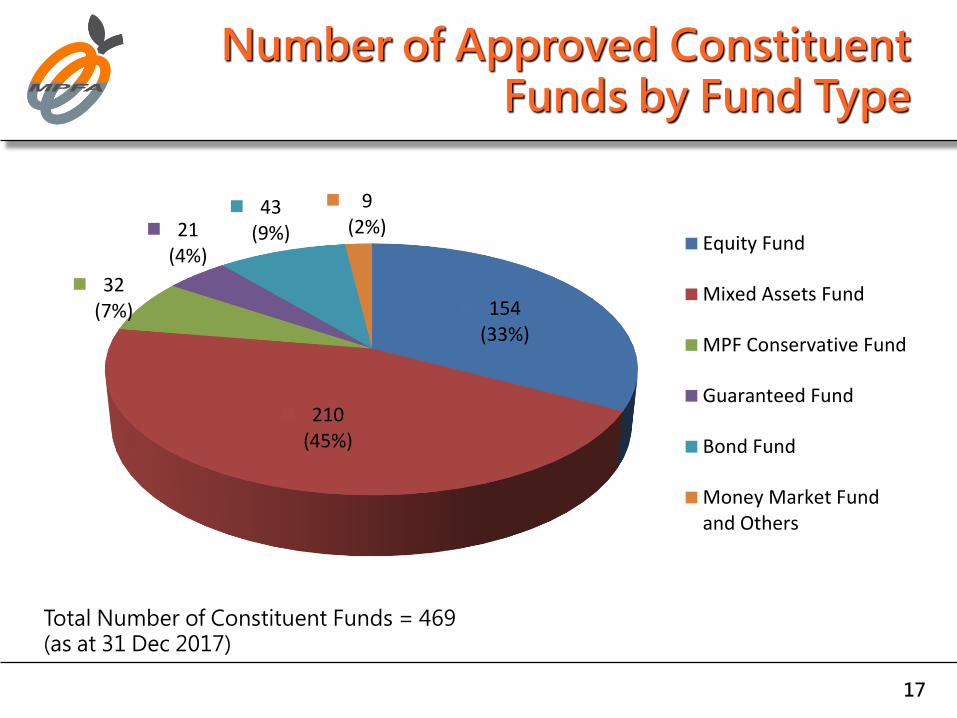
Number of Approved Constituent Funds by Fund Type
154(33%)
210(45%)
32(7%)
21(4%)
43(9%)
9(2%)
Equity Fund
Mixed Assets Fund
MPF Conservative Fund
Guaranteed Fund
Bond Fund
Money Market Fundand Others
Total Number of Constituent Funds = 469(as at 31 Dec 2017)

18
Net Asset Values of Approved Constituent Funds by Fund Type
353.9
(43%)
306.2
(37%)
76.6
(9%)
61.4
(7%)
25.3
(3%)
3.1
(<0.5%) Equity Fund
Mixed Assets Fund
MPF Conservative Fund
Guaranteed Fund
Bond Fund
Money Market Fundand Others
Total NAV = HK$826.6 billion(as at 30 Nov 2017)
($ billion)

19
Asset Allocation of Approved Constituent Funds by Asset Class
69%
18%
13%Equities
Debt Securites
Deposits & Cash
(as at 30 Sep 2017)

20
Asset Allocation of Approved Constituent Funds by Geographical Region
59%
4%
10%
15%
13% Hong Kong
Japan
Asia*
North America
Europe
(as at 30 Sep 2017)
* excluding Hong Kong and Japan
Retirement
Savings
Generated by
the MPF System
22
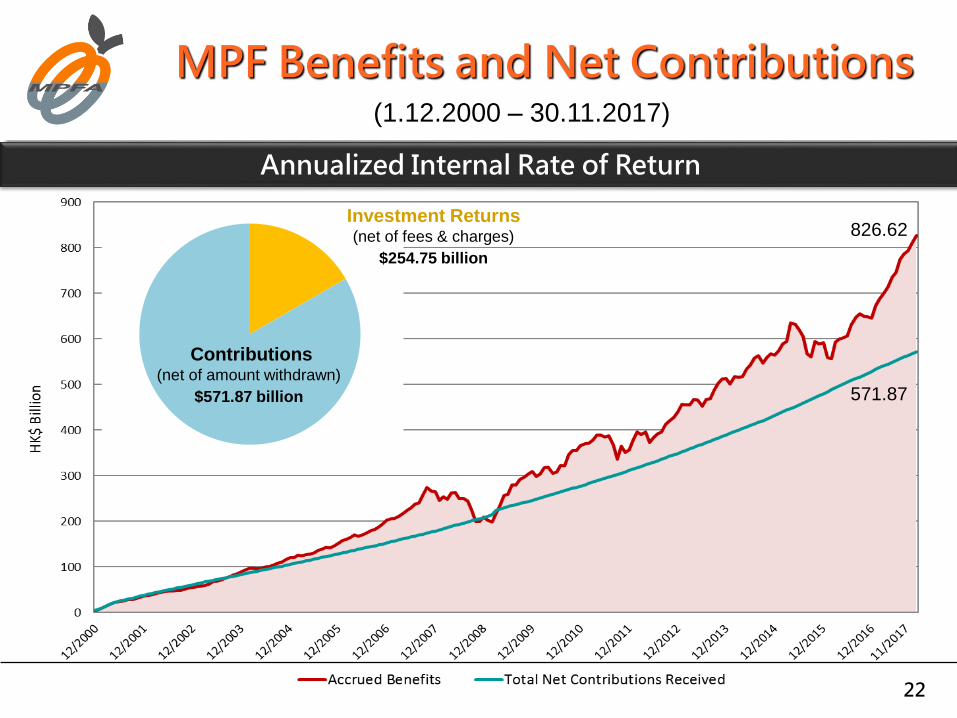
MPF Benefits and Net Contributions
Annualized Internal Rate of Return
(1.12.2000 – 30.11.2017)
Contributions(net of amount withdrawn)
$571.87 billion
Investment Returns(net of fees & charges)
$254.75 billion
826.62
571.87
23
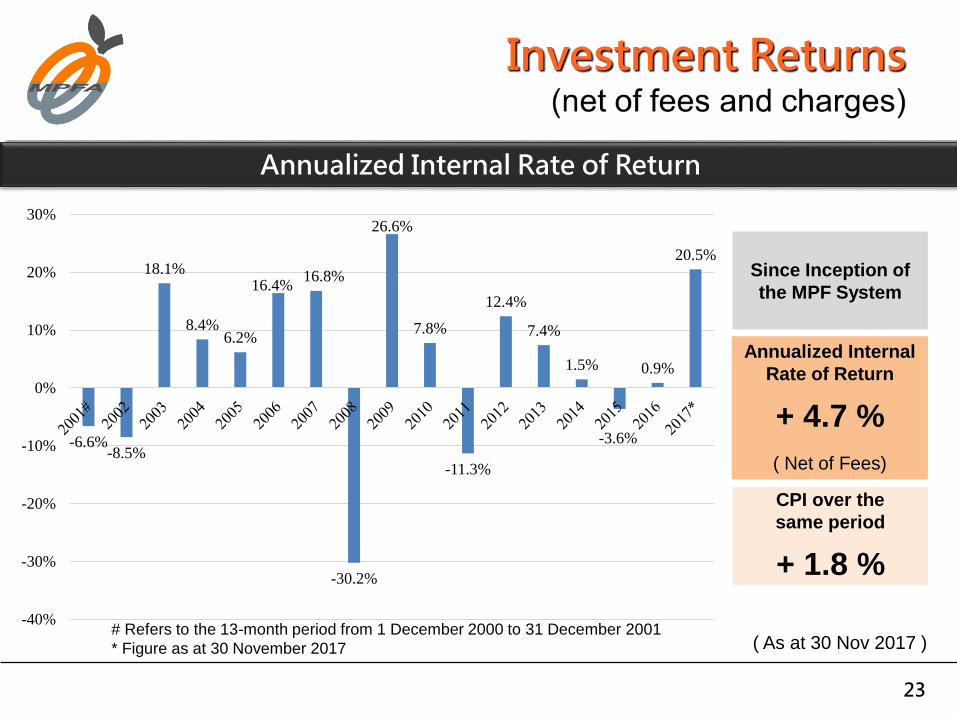
Investment Returns
Annualized Internal Rate of Return
Annualized Internal
Rate of Return
+ 4.7 %
( Net of Fees)
Since Inception of
the MPF System
CPI over the
same period
+ 1.8 %
( As at 30 Nov 2017 )
-6.6%-8.5%
18.1%
8.4%6.2%
16.4%16.8%
-30.2%
26.6%
7.8%
-11.3%
12.4%
7.4%
1.5%
-3.6%
0.9%
20.5%
-40%
-30%
-20%
-10%
0%
10%
20%
30%
# Refers to the 13-month period from 1 December 2000 to 31 December 2001
* Figure as at 30 November 2017
24
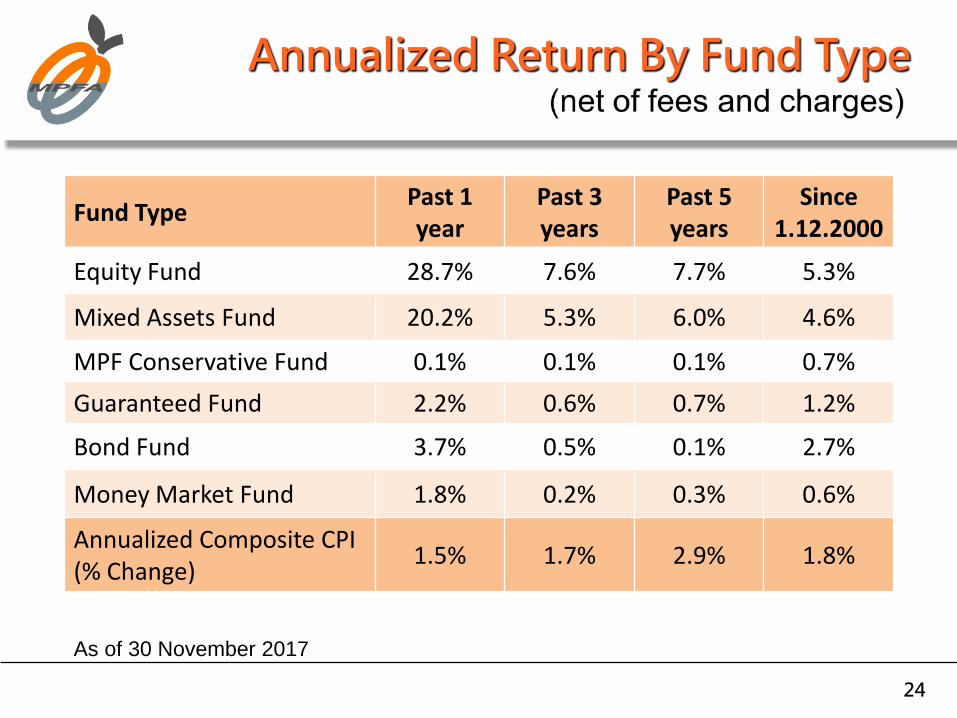
Annualized Return By Fund Type
Fund TypePast 1 year
Past 3 years
Past 5 years
Since 1.12.2000
Equity Fund 28.7% 7.6% 7.7% 5.3%
Mixed Assets Fund 20.2% 5.3% 6.0% 4.6%
MPF Conservative Fund 0.1% 0.1% 0.1% 0.7%
Guaranteed Fund 2.2% 0.6% 0.7% 1.2%
Bond Fund 3.7% 0.5% 0.1% 2.7%
Money Market Fund 1.8% 0.2% 0.3% 0.6%
Annualized Composite CPI (% Change)
1.5% 1.7% 2.9% 1.8%
As of 30 November 2017
25
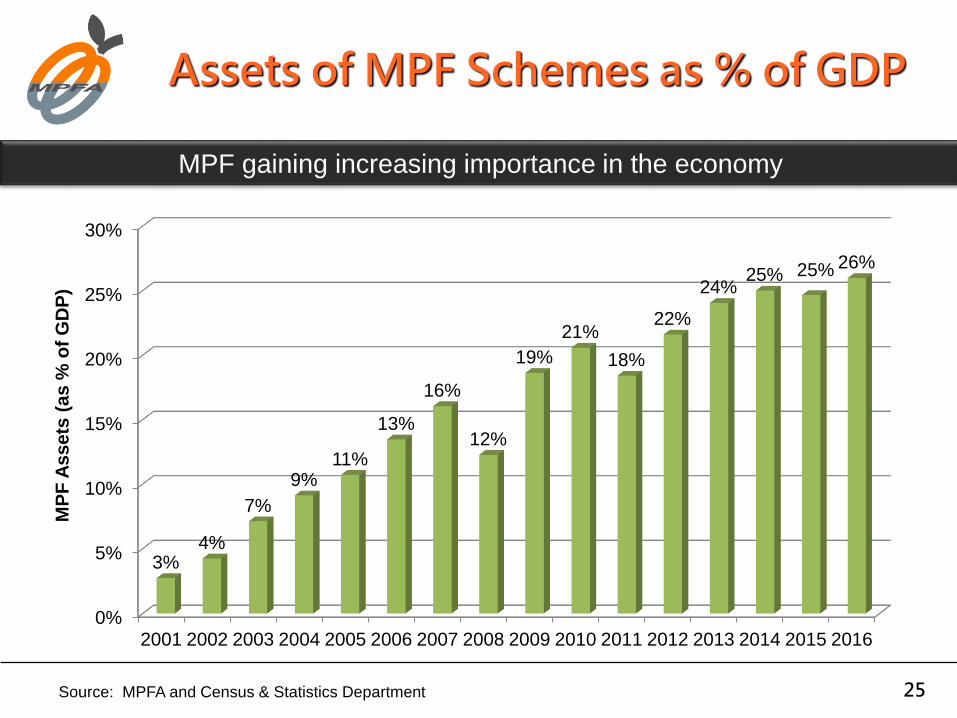
Assets of MPF Schemes as % of GDP
MPF gaining increasing importance in the economy
0%
5%
10%
15%
20%
25%
30%
2001 2002 2003 2004 2005 2006 2007 2008 2009 2010 2011 2012 2013 2014 2015 2016
3%4%
7%
9%11%
13%
16%
12%
19%
21%
18%
22%
24%25% 25% 26%
MP
F A
ss
ets
(a
s %
of
GD
P)
Source: MPFA and Census & Statistics Department

26
Pension Fund Assets as % of GDP
Room for growth compared to OECD jurisdictions
0.0%
50.0%
100.0%
150.0%
200.0%
250.0%
Denmark OECD Average Japan Hong Kong,China
209.0%
49.5%29.4% 26.0%
Pe
ns
ion
Fu
nd
As
se
ts(%
of
GD
P)
as
at
31
De
c 2
01
6
Source: OECD. (2017). Pension Markets in Focus <figures for jurisdictions other than Hong Kong>
MPFA and Census & Statistics Department <figure for Hong Kong>
Note: Pension fund assets of Hong Kong refer to assets of MPF schemes only; assets in other retirement
schemes are not included
27
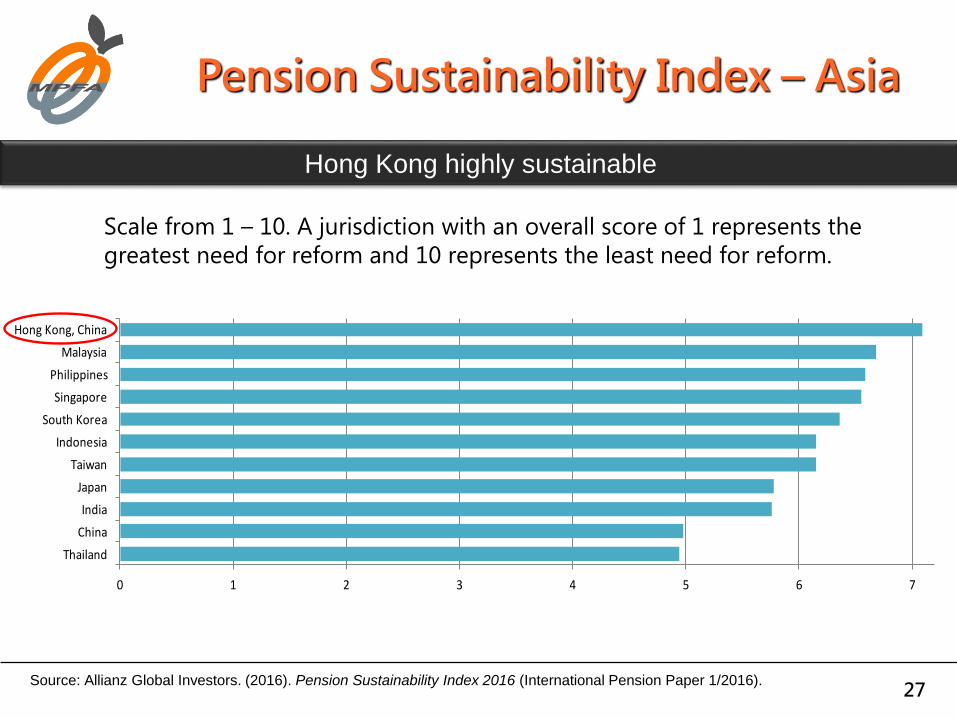
Pension Sustainability Index – Asia
Hong Kong highly sustainable
0 1 2 3 4 5 6 7
Thailand
China
India
Japan
Taiwan
Indonesia
South Korea
Singapore
Philippines
Malaysia
Hong Kong, China
Scale from 1 – 10. A jurisdiction with an overall score of 1 represents the
greatest need for reform and 10 represents the least need for reform.
Source: Allianz Global Investors. (2016). Pension Sustainability Index 2016 (International Pension Paper 1/2016).
Challenges &
Latest Reforms
of MPF System

29
Role of MPF in a multi pillar system – provision of basic retirement protection
Employment based
Mandatory contribution of 10% of employees’ relevant income (employers and employees each contribute 5%), subject to a cap (HK$30,000)
(employees earning less than HK$7,100 do not need to contribute themselves)
Relatively short contribution period (launched for only 17 years)
Coverage and Adequacy

30
Fees & Expenses – Privately managed
• FER, an indicator to measure fees, has indeed droppedfrom 2.1% (2007) to 1.56%
- As a result of MPFA urging trustees to respond to public calls,simplification of administration procedures, etc
Returns – Subject to market volatility and higher fee structures
• High equity exposure of members’ investment (69% oftotal assets as at Sep 2017)
Fees and Returns (1)

31
Fees and Returns (2)
Savings from 0.54% Reduction in Fees Over 40 Years
1,544,000
1,357,000
0
500,000
1,000,000
1,500,000
2,000,000
1 2 3 4 5 6 7 8 9 10111213141516171819202122232425262728293031323334353637383940
$
Investment Horizon / Year
FER at 1.56%
FER at 2.10%
Key Assumptions
• Gross investment return (before fees and expenses) is 5% per year.
• Each FER level remains constant throughout the 40-year investment horizon.
• Monthly salary is $15,000, which was the median salary of Hong Kong’s employed persons as at Q1 2017.
• No salary growth.
Increase in Final
Accrued Benefits:
$188,000(13.8%)

32
Latest Reforms
Default Investment Strategy (DIS)
Standardizing, Streamlining & Automating (SSA) Administration Processes
33
Default Investment Strategy (DIS) (1)
A ready-made, low fee default investment solution
Launched on 1 April 2017
34
DIS (2)
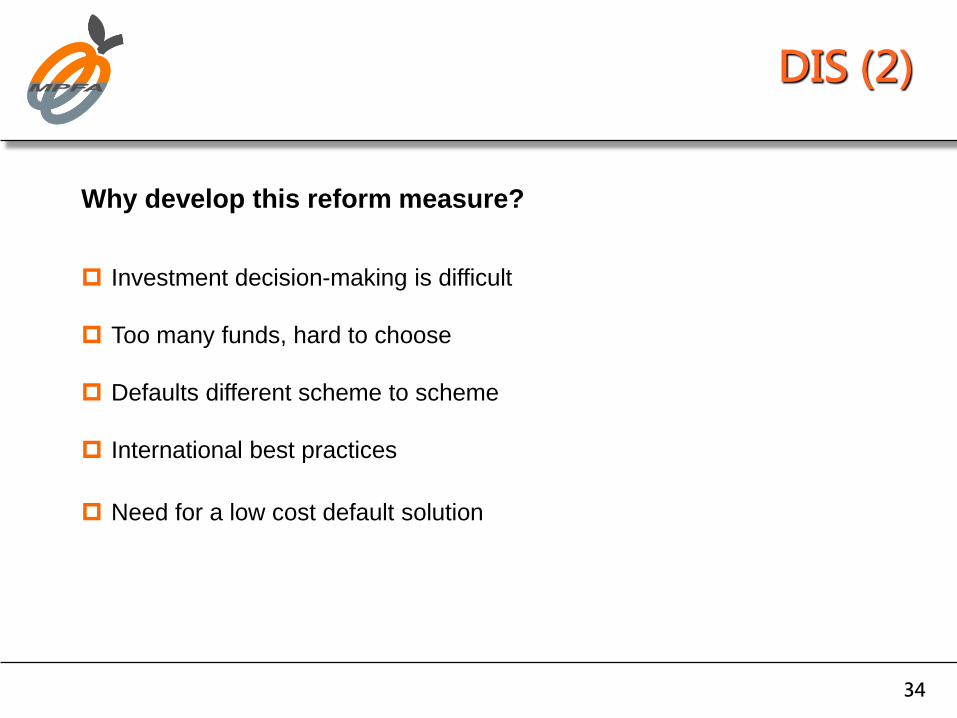
Why develop this reform measure?
Investment decision-making is difficult
Too many funds, hard to choose
Defaults different scheme to scheme
International best practices
Need for a low cost default solution

35
DIS (3)
DIS “One, Two, Three”
One ready-made, low fee investment solution
Comprised of Two constituent funds
• Core Accumulation Fund (CAF) - 60% higher risk
• Age 65 Plus Fund (A65F) - 20% higher risk
Three main features
• Fee controls
Management fee : 0.75% of total asset value of fund
Recurrent out-of-pocket expenses : 0.20% of total asset value of fund
• Automatically de-risk as members approach retirement age
• Diversified investment in global market
36
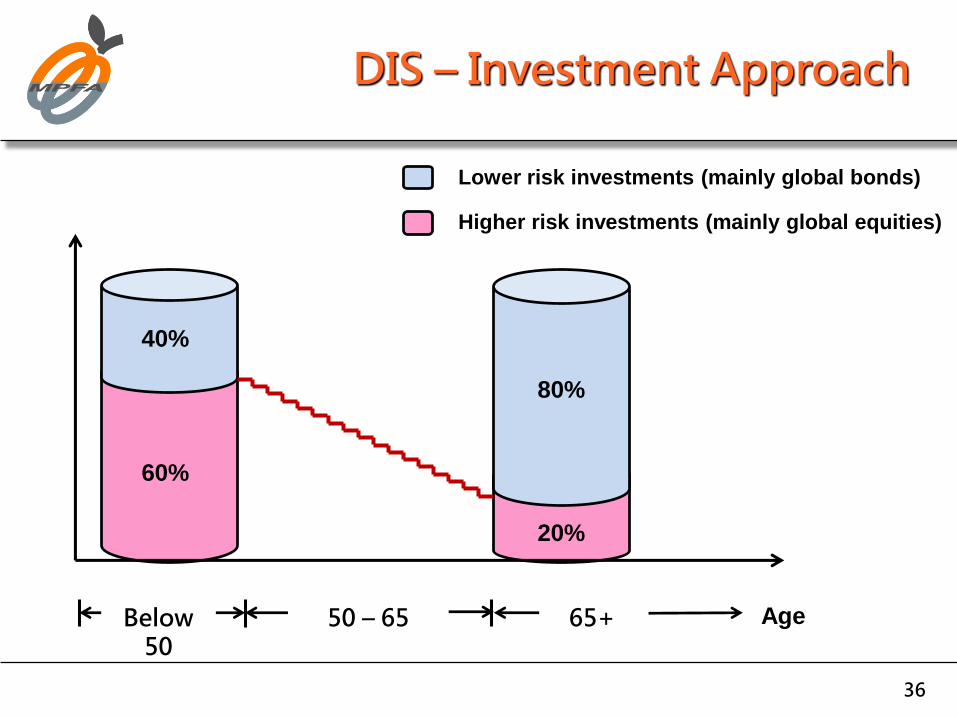
DIS – Investment Approach
Lower risk investments (mainly global bonds)
Higher risk investments (mainly global equities)
≥65
40%
60%
80%
20%
Age50 – 65Below 50
65+
37
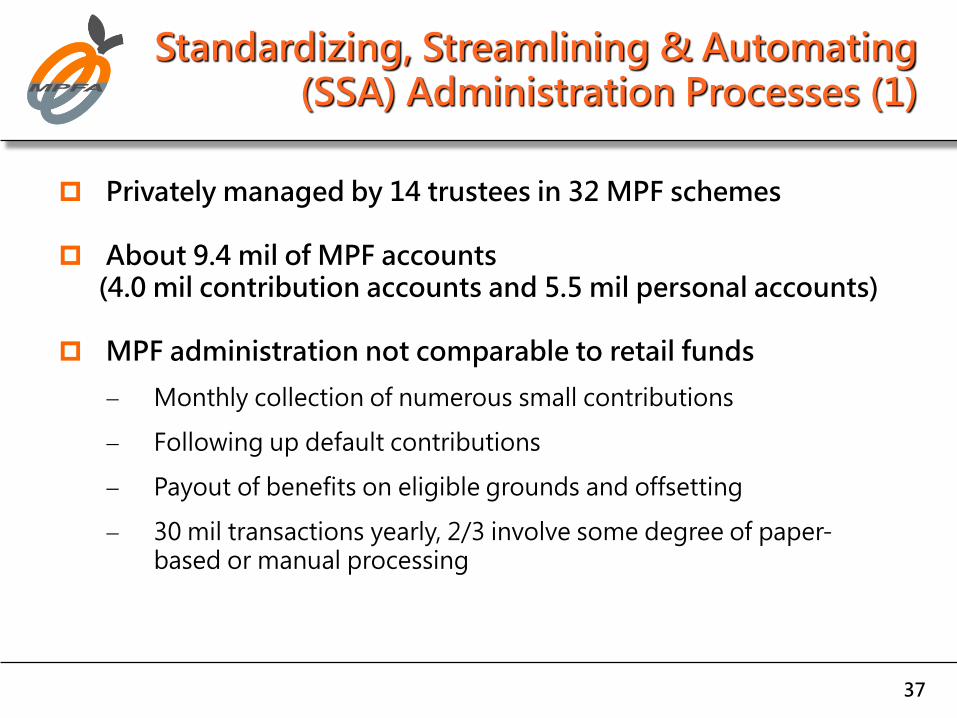
Standardizing, Streamlining & Automating (SSA) Administration Processes (1)
Privately managed by 14 trustees in 32 MPF schemes
About 9.4 mil of MPF accounts(4.0 mil contribution accounts and 5.5 mil personal accounts)
MPF administration not comparable to retail funds
Monthly collection of numerous small contributions
Following up default contributions
Payout of benefits on eligible grounds and offsetting
30 mil transactions yearly, 2/3 involve some degree of paper-based or manual processing

38
Standardizing, Streamlining & Automating (SSA) Administration Processes (2)
Objectives
1Improve
accuracy, reliability and
efficiency
2
43
Lower costs and
fees
Enhance user experience
Enable future reform

39
Key Features
Registration and unique user ID
Central database
Electronic one-stop access
Streamlined electronic processing
Standardized procedures, forms and formats
Service centres to assist less computer-literate duringtransition
Conceptual Model of eMPF
40
MPF System
With DIS
• Low fee
• Easy choice
With SSA
• Simple administration
Our Vision