Embed Size (px)
Citation preview

EDITION 1.1, 01.07.2010 I
Jan-Martin Rhiemeier, Sina Wartmann, Marcello Pagnotta, Natalia Makowska, Xingyu Li
Ecofys Germany GmbH Contact: [email protected] Project No.: PCESDE073349 Cologne, 01.07.2010
Update on global SF6 emissions trends from electrical equipment – Edition 1.1 Ecofys Emission Scenario Initiative on Sulphur
Hexafluoride for Electric Industry (ESI-SF6)

EDITION 1.1, 01.07.2010
Financial support from JEMA, NEMA, ABB, Alstom, Ormazabal, Schneider Electric, Solvay and Siemens is acknowledged. The ESI-SF6 project reflects the opinion of the authors and does not necessarily reflect the opinion of the support-ing companies and associations on the results obtained.

EDITION 1.1, 01.07.2010
Contents
Executive Summary 5
1 In t roduct ion 8 1.1 SF6 and climate change 8 1.2 Project objectives 9
2 SF6 Electr ical Equipment 11 2.1 Power Transmission and Distribution 11 2.2 Equipment Categories 12 2.3 Life Cycle SF6 Emissions 14 2.4 Handling practices 15
3 Global SF6 Pol icy 17 3.1 Introduction to Climate change policy 17 3.2 Regulations concerning SF6 17
4 Emission Development 2005-2030 21 4.1 Data Collection Process 22 4.2 Scenario Design 23 4.2.1 Reduction measures under the Additional Action Scenario 25 4.2.2 Activity data projections 28 4.3 Emission Development 2005-2030 33 4.3.1 Emissions during manufacturing 34 4.3.2 Emissions from the use-phase 36 4.3.3 Emissions from decommissioning 37 4.4 Sensitivity analysis for annual SF6 consumption 41 4.5 SF6 emissions and the IPCC scenario process 42
5 Conclusions 43
6 References 50
Annex 1: Abbreviat ions 53

EDITION 1.1, 01.07.2010
Annex 2: Addit ional f igures 54
Annex 3: Emission Development 2030-2100 55 Emissions during manufacturing 2030-2100 56 Emissions from use phase 2030-2100 58 Emissions from decommissioning 2030-2100 59

EDITION 1.1, 01.07.2010 5
Executive Summary
The Emission Scenario Initiative on Sulphur Hexafluoride for Electric Industry aims to provide scenarios for the short and long-term SF6 emissions from high and me-dium voltage electrical equipment at the global level. It shows emission scenarios for the three life cycle phases, manufacturing, use and decommissioning of equipment for the period between 2005 and 2030. A “business-as-usual” scenario (BAU sce-nario) and an additional action scenario are based on a forecast of market trends, global energy demand, population development and regional GDP growth. The un-derlying data is based on a global data collection, literature research and interviews among industry experts.
Key findings:
• Global emissions from electrical equipment can be reduced by
30 % compared to 2005, despite a strong increase in global elec-tricity demand until 2030
• Relative emissions would accordingly decrease from 5.0 % in 2005 to 0.8 %1 in 2030 per metric tonne of banked SF6
• With a reduction of 30 % by 2030 the global electrical equipment industry has ambitious objectives that contribute significantly to the effort of stabilizing the global warming at an average global temperature increase of 2°C as agreed in the Copenhagen accord. The 2°C path implicates to freeze global CO2 concentration in the atmosphere at 450 ppm until 2050. This can be achieved by a global emission reduction of 12,1% until 2030 with respect to 20052.
• The success of voluntary agreements shows that this could be one flexible and efficient tool beside future regulations to achieve en-vironmental improvements on a global scale. Through these vol-untary agreements, the electrical industry proactively contributes to global emission reductions. As a consequence, SF6 emissions will continue to remain very low in the future
1 A sensitivity analysis for the bank development showed that by varying the annual bank growth by ± 25 % the relative emissions per metric tonne of banked SF6 only vary by 0.007%. 2 Joeri Rogelj, Julia Nabel, Claudine Chen, William Hare, Kathleen Markmann, Malte Mein-
shausen, Michiel Schaeffer, Kirsten Macey, Niklas Höhne 2010: Copenhagen Accord pledges are paltry, Nature Vol 464, p. 1126-1128

EDITION 1.1, 01.07.2010 6
The report clearly shows that if existing emission reduction actions based on state-of-the-art techniques are applied on a global level, today’s global emissions from electrical equipment could be reduced by 30 % until 2030, despite a global increase in electricity demand and a significant SF6 bank growth in developing countries. Such reduction measures are primarily standard technologies close to best available techniques that are already currently widely applied in OECD countries. Europe and Japan in particular, have already achieved significant emission reductions during the past 15-20 years. Therefore, in Europe and Japan no major improvements in the emissions limitation can be expected in absolute terms, in the coming years. How-ever, a decrease of the emission rate per ton of SF6 installed can be still expected as old equipment at end of life is replaced by state of the art equipment having less SF6 volume, as well as lower leakage rates.
Compared to the SF6 emission scenarios presented in the SRES report3 from 1999, projected emissions from electrical equipment shown in this study are only a minor part of global total SF6 emissions. Comparing the two best emission paths from both scenarios, SF6 emissions from electrical equipment calculated in this study only represent 16,4% of global total SF6 emissions shown in SRES.
Helping countries in transition and developing countries to rapidly implement ade-quate reduction measures to reach the same level of consciousness and professional management of SF6 as in Europe, Japan and lately also in the USA therefore be-comes a key task for both industry and policy makers in the coming years. Major improvements can than be expected in countries in transition and in developing countries, by extending the use of state-of-the-art technology. If emissions remain uncontrolled in countries in transition and in developing coun-tries, the scenario calculations show that global SF6 emissions are projected to rise significantly from 1,600 t SF6 to 2,800 t SF6 under the BAU scenario until 2030. 70 % of the projected growth in electricity demand takes place in non-OECD countries, where important parts of the OECD countries exports are allocated. By selling state of the art equipment and by producing within non-OECD countries state-of-the-art equipment using state-of-the-art manufacturing process, the OECD manufacturing sector will assist them in making a significant contribution on their emissions evolu-tion. State-of–the-art equipment usually generally involves the necessary technical support and training to implement the technical and organizational measures that fa-cilitate the achievement of low emission levels by 2030. 3 Special Report on Emission Scenarios [3]

EDITION 1.1, 01.07.2010 7
Upon examining the context, the electrical equipment industry has been a front-runner in recent years. Through applying several voluntary reduction programmes, considerable emission reductions were achieved already in the past although no or much less ambitious regulations were in place. Through the large economic growth in developing countries, the electrical industry needs to face new challenges to further reduce SF6 emissions from the application of high and medium voltage switchgear. SF6 technology globally remains an important part of interconnected electricity grids in particular with regard to growing impor-tance of renewable energy supply. It fulfils important criteria like compactness, cost effectiveness and long distance transportation, being currently the only available technology to do so for high voltage levels. It is therefore very important for the pro-ducers and users of SF6 electrical equipment to keep the proactive spirit of the recent past to achieve the given reduction potentials in countries in transition and in devel-oping countries.
EDITION 1.1, 01.07.2010 8
1 Introduct ion
The following report aims to provide scenarios for the short and long-term SF6 emis-sions from high and medium voltage electrical equipment at the global level. Emis-sion scenarios will be presented for all life cycle phases, manufacturing, use and de-commissioning of equipment for the period between 2005 and 2030.. Additionally Annex 3 presents an approach to a possible scenario beyond 2030 up to 2100. After 2030 the uncertainties for the future development are very high. There-fore the Figures given in Annex 3 should be used as an indication for potential future emissions from electrical equipment only.
1.1 SF 6 and c l imate change
Due to growing concerns over the potential effects of anthropogenic climate change due to greenhouse gas emissions into the atmosphere, increasing attention is given to specific greenhouse gases, their emission sources as well as their future emission de-velopment and emission reduction options. SF6 (sulphur hexafluoride), hydrofluorocarbons (HFCs) and perfluorocarbons (PFCs) are usually referred to as fluorinated greenhouse gases or F-gases. PFCs and HFCs were introduced as the “environmental-friendly alternative” to ozone depleting sub-stances like chlorofluorocarbons (CFCs) in the mid nineteen nineties, while SF6.in HV equipment has been in use since the early nineteen sixties These chlorofluoro-carbons (mostly used as refrigerants) are controlled under the international Montreal Protocol that looks to phase out ozone depleting substances by 2040. However, fur-ther scientific research on F-gases has revealed their contribution to climate change. They have high global warming potentials (GWP) ranging from 140 (HFC-152a) to 23,900 (SF6).4 This is the reason why F-gases, beside CO2, N2O and CH4 are regu-lated under the Kyoto-Protocol (see chapter 3.1). Global Warming Potential (GWP) of SF6 Recent research concluded that the GWP for a 100 years time horizon of SF6 is 22.800 [1]. This value will be used for future climate change actions under the UNFCCC after 2012. However, annual emission reporting under the UNFCCC is still using the value of 23,900 for SF6
5. Therefore, this value is also used for emis-sion calculation in this study to ensure consistency with past emission projections.
4 GWP is a measure to compare gases’ effects on global warming in relation to the same mass of carbon dioxide, which is indexed at 1. 5 http://unfccc.int/ghg_data/items/3825.php
EDITION 1.1, 01.07.2010 9
SF6 is a non-flammable man-made gas with excellent dielectric and arc-quenching properties. It also occurs naturally in common granitic rocks and fluorite minerals from which it is released extremely slowly through weathering processes [2]. With its high GWP of 23,900 and an atmospheric lifetime of 3,200 years it is the green-house gas with the highest specific potential impact on the global climate system. It is completely inert, nontoxic and has very good dielectric6 and quenching7 proper-ties. Therefore, it is used in various products and industrial processes such as in elec-trical equipment, as a cover gas for magnesium die-casting, in degassing of alumin-ium, in semiconductor manufacturing, in sound-insulating glazing8 and historically in high performance sports shoes. “Use” can mean both open use, where the gas is emitted, as e.g. magnesium die-casting, as well as closed use, where the gas is con-tained inside products, e.g. banked in electrical equipment.
1.2 Project object ives
Emission scenarios play an important role by informing policy makers about the need for future policy action. The most important scientific source for policy makers is the IPCC report that provides a regular update on the global climate system. The underlying scenarios of the IPCC only consider aggregated SF6 emissions from all different emission sources until 2100 [3]. The unique scenario that assesses electrical equipment emissions in particular, only projects emissions until the year 2020 [4]. This report aims at providing short to long-term scenarios covering a business-as-usual and an additional action scenario on a global level. In particular, the study shows the emission development for the entire life cycle of high voltage (HV) and medium voltage (MV) electrical equipment for the period between 2005 and 2030 and gives an indication for the period from 2030 to 2100. The year 2030 was se-lected because solid global data for electricity demand and economic growth is only available until 2030. For this purpose, major stakeholders from the electrical equip-ment industry and electricity suppliers were invited to deliver technical expertise to support the development of regional scenarios for 14 major market regions. As an introduction to transmission and distribution of electricity, Chapter 2 provides a brief overview of the main electrical equipment categories used in T&D networks and describes how emissions occur during each life cycle phase of the equipment. In addition, Chapter 2 also offers a comprehensive overview on handling practices for electrical equipment already used by the industry to reduce life cycle emissions. In-formation about handling practices was collected through a detailed questionnaire that was distributed among industry representatives in the different market regions.
6 The ability to withstand the applied voltage. 7 The ability to extinguish an electrical arc. 8 Forbidden in the EU as of July 4th 2007 (Regulation (EC) No 842/2006)

EDITION 1.1, 01.07.2010 10
Chapter 3 provides the latest information on global climate change policy. Particular focus is placed on recent developments of policies that affect the use of SF6 in elec-trical equipment. The scenario development is presented in chapter 4. It shows the global SF6 emission development from electrical equipment for the periods 2005- 2030. For this period, the emission calculation is presented for each of the three life cycle phases; manufac-turing, use and disposal of equipment. To classify the scenarios, they will be com-pared with existing emission scenarios from SRES [3], US EPA [4] and the ECOFYS report for CAPIEL from 2005 [5]. Additionally, chapter 4 contains information about projected amounts of SF6 con-sumed by electrical equipment manufacturers; shows the development of SF6 banked in electrical equipment and estimates the amount of SF6 that needs to be decommis-sioned in the future. A similar approach is followed in Annex 3 to estimate evolution of emission in the period 2030-2100. Chapter 5 summarizes the previous chapters and provides conclusions for policy relevant storylines, for future evolution and mitigation of SF6 emissions. In addition, the need for further research in future key market regions is identified.

EDITION 1.1, 01.07.2010 11
2 SF6 Electrical Equipment
Chapter 2 provides a short introduction on electricity transmission and distribution. It provides a brief overview of the main electrical equipment categories used in T&D networks and describes how emissions occur during each life cycle phase of the equipment. Chapter 2 also provides further information about the handling practices for electrical equipment helping to reduce SF6 emissions in the different life cycle phases.
2.1 Power Transmiss ion and Distr ibut ion
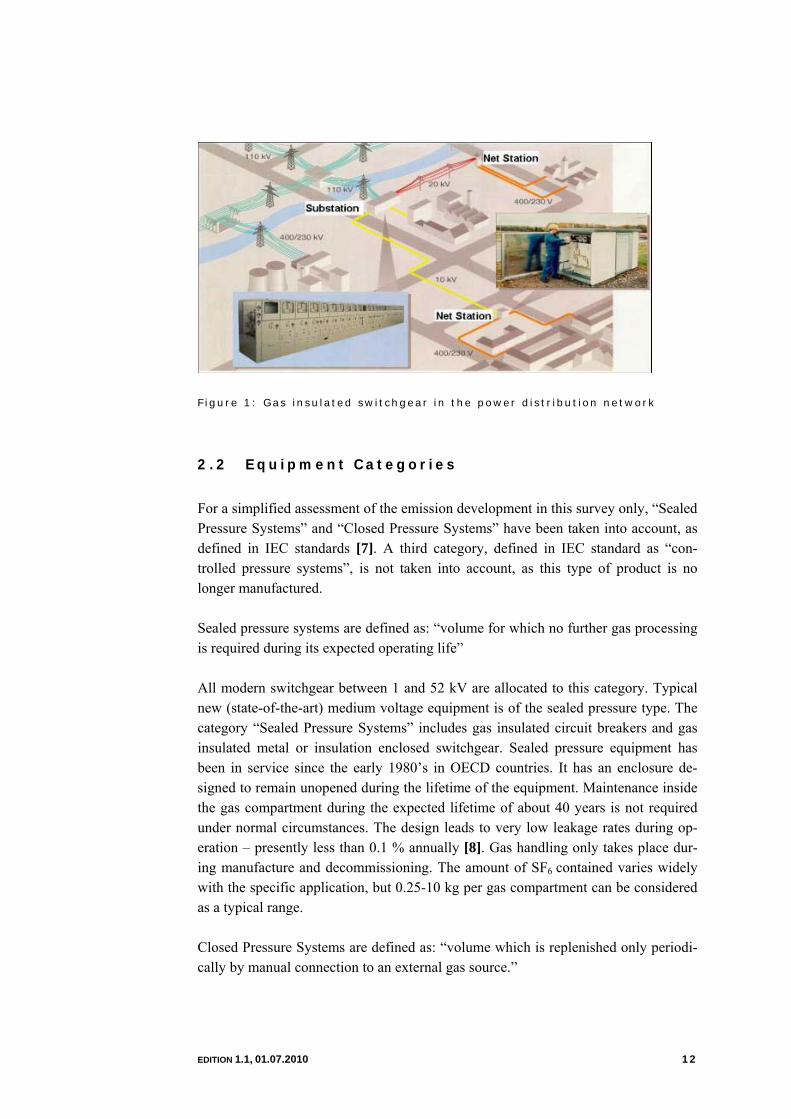
According to IEA’s World Energy Outlook 2009, 19,756 TWh of electricity was consumed worldwide in 2007. World electricity demand is projected to grow at an annual rate of 2.7 % in the period 2007-2015, slowing to 2.4 % per year on average in the period 2015-2030, as economies mature and as electricity becomes more effi-cient [6]. Interconnected power networks play an important role for a safe and sus-tainable electricity supply throughout the world. A power system consists of electricity generation, transmission and distribution. Transmission relates to transferring power over long distances and is usually associ-ated with voltage levels above 52kV to minimise energy losses during transport. Dis-tribution is associated with shorter distances at voltage levels below 110kV. Trans-mission and distribution networks consist of overhead lines or cables, in addition to other components such as switchgears and transformers. Switchgear is used to pro-tect electrical equipment against overload and short circuit currents (“circuit break-ing”) and to connect / disconnect networks (“load-breaking”). Figure 1 shows the use of switchgear in a power network.
EDITION 1.1, 01.07.2010 12
Figure 1: Gas insulated switchgear in the power d istr ibut ion network
2.2 Equipment Categor ies
For a simplified assessment of the emission development in this survey only, “Sealed Pressure Systems” and “Closed Pressure Systems” have been taken into account, as defined in IEC standards [7]. A third category, defined in IEC standard as “con-trolled pressure systems”, is not taken into account, as this type of product is no longer manufactured. Sealed pressure systems are defined as: “volume for which no further gas processing is required during its expected operating life” All modern switchgear between 1 and 52 kV are allocated to this category. Typical new (state-of-the-art) medium voltage equipment is of the sealed pressure type. The category “Sealed Pressure Systems” includes gas insulated circuit breakers and gas insulated metal or insulation enclosed switchgear. Sealed pressure equipment has been in service since the early 1980’s in OECD countries. It has an enclosure de-signed to remain unopened during the lifetime of the equipment. Maintenance inside the gas compartment during the expected lifetime of about 40 years is not required under normal circumstances. The design leads to very low leakage rates during op-eration – presently less than 0.1 % annually [8]. Gas handling only takes place dur-ing manufacture and decommissioning. The amount of SF6 contained varies widely with the specific application, but 0.25-10 kg per gas compartment can be considered as a typical range. Closed Pressure Systems are defined as: “volume which is replenished only periodi-cally by manual connection to an external gas source.”

EDITION 1.1, 01.07.2010 13
Switchgear above 52 kV is assigned to Closed Pressure Systems. This category con-tains gas insulated circuit breakers, gas insulated metal enclosed switchgear, gas in-sulated lines and outdoor gas-insulated instrument transformers. For equipment de-signed since the mid-nineties, maintenance including gas handling for closed pres-sure systems is commonly required only after 20 to 25 years. Topping-up of SF6 can be required once or twice during the lifetime, depending on the leakage rate. Design-related leakage rates for new equipment are ≤ 0.5 % p.a. [7]. Operation pressure is in the range of 0.2-0.8 MPa absolute pressure. The high operating pressure requires transport of the equipment at a lower pressure level and increasing this to the operat-ing pressure at the site of installation. Gas amounts can vary between a few kg and up to several hundreds kg SF6 per gas compartment. Switchgear dimensions and sub-sequently also the SF6 amount per piece of equipment have significantly decreased over time, both for sealed and closed pressure systems (see Figure 22).

EDITION 1.1, 01.07.2010 14
2.3 Li fe Cyc le SF 6 Emiss ions
Manufacturing In the manufacturing phase, the components are produced and assembled. Depending on the type of equipment, several test phases for gas tightness are carried out on components and assembled equipment. Sealed pressure equipment is usually filled and tested at the production site and is, in normal operation, only reopened for dis-mantling at decommissioning after gas recovery. Closed pressure systems are filled for testing at the production site. The gas is then recovered and the equipment is filled with SF6 or N2 at a pressure slightly above atmospheric for shipping. At the in-stallation site, they are then topped up (if filled with SF6 before) or evacuated (if filled with N2 before) and then filled to the rated SF6 pressure. During the manufac-turing process, emissions can occur whenever gas is handled; this is predominantly during, filling, topping up and gas recovery before shipping. Use During the use phase, no gas handling is required for sealed equipment. Closed pres-sure equipment installed since the mid 1990s is designed to require maintenance in-cluding gas-handling only after 20-25 years. Prior to opening for internal inspection and/or maintenance, the SF6 is recovered almost 100% depending on the evacuation equipment used [9]. The maintenance is then carried out and afterwards, once the compartment is closed again, it is filled up to rated pressure. Older equipment may not be designed for high tightness and might require additional gas refilling. Emis-sions in the use-phase include the design-related leakage of gas from the equipment, increased leakage of defective equipment, losses during gas handling and emissions because of single events e.g. internal arc faults. For this study, the emission rate dur-ing use-phase includes all of these sources of emission. Decommissioning In the decommissioning phase of equipment, SF6 is recovered. Afterwards it can be reused either on-site or at gas manufacturer or it is disposed of, according to local or international regulations on waste management. Gas reuse is presently more com-mon than disposal. The gas supplier commonly carries out reuse of SF6. The empty equipment is dismantled and the materials are predominantly recycled, as a number of valuable raw materials such as stainless steel, aluminium and copper are present. As full recovery of the gas is not possible (even when state-of-the-art gas handling equipment is utilised), some emissions also occur during decommissioning, but re-main typically between 2 % and 0.4% of the name plate capacity, depending on the SF6 rated filling pressure of the equipment, the performance of the evacuation

EDITION 1.1, 01.07.2010 15
equipment and if the operation is carried out by qualified staff with the appropriate equipment. According to the recently issued Technical Report IEC/TR 62271-303 [9] the SF6 residual pressure in the gas compartment should be lower than 2 kPa be-fore flooding with air. The emission factor is defined as, “the ratio between the SF6 residual pressure and the SF6 rated filling pressure”.
2.4 Handl ing pract ices
According to the European F-Gases Regulation (EC) No 842/2006 [10] and Regula-tion (EC) No 305/2008 [11], the European industry (manufacturers, recycling com-panies, maintenance providers, utilities etc.) is obliged to provide for training, ex-amination and certification of all personnel involved in the recovery of SF6 from high voltage switchgear. For the purposes of Regulation (EC) No 305/2008 “high voltage switchgear” means switching devices intended for use in connection with generation, transmission, distribution and conversion of electric energy at rated volt-ages above 1 kV. Another important part of proper handling is the clear identifica-tion of equipment that contains SF6. Regulation (EC) 1494/2007 [12] therefore obliges the correct labelling of such equipment in Europe. A similar regulation does not currently exist anywhere else in the world (see also chapter 3). However, interna-tional standards (IEC) require to indicate in the nameplate the quantity and pressure of the gas contained. According to the manufacturers interviewed in Europe, Japan, Korea and the USA, the staff who fill HV-equipment with SF6 on-site (when taking equipment into opera-tion) or carrying out maintenance involving SF6 handling, are always trained. Some companies organize internal trainings for production staff for SF6 gas handling pro-cedures, which covers the proper use of gas carts, safe handling of pressurized equipment and safe handling of SF6 arc by-products. Training sessions also include; how to operate air evacuation and gas recovery equipment, how to fill up SF6 in equipment and how to check for leakage in factory and on site. The objectives of this training are to minimize the SF6 emissions continuously during testing, production, construction on site and commissioning, operating, service and dismantling. Apart from training, continual improvement on SF6 monitoring can also be observed. Manufacturers prepare periodical meetings to raise environmental awareness on the SF6 impact on climate change and all main international industry associations (i.e. T&D Europe, JEMA, NEMA, CIGRE), have established special SF6 working groups over the last 15 years. The first efforts to reduce SF6 emissions from electrical equipment started around 1995 in Europe and Japan, when the high potential climate impact of SF6 was first acknowledged. North American efforts started some years later, with the introduc-tion of the SF6 emission reduction partnership for electric equipment. Table 1 gives

EDITION 1.1, 01.07.2010 16
an overview of the past measures taken to reduce SF6 emissions during manufactur-ing processes and future planned activities. .
Table 1: Measures taken by manufacturers to minimize SF6 emissions from electr ical equipment
SF6 Reduction measures during manufacturing and installation
• use of automated gas handling equipment to minimize leakage threats during evacuation and filling
• improvements in equipment design for electrical equipment filled with SF6 • reduction of the SF6 mass in the gas filled compartments -with the same func-
tionality and same or higher rating data • routine tightness tests of components and / or gas filled compartments without
SF6 (i.e. with helium) as integral tightness routine test • installation of SF6 flow meters at all feeder and tapping points • implementation and continuous improvement of a SF6 mass balance system • Improved awareness and training of personnel involved in production processes • installation of monitoring and leak detection equipment in the manufacturing sys-
tem • revision of joints to improve gas tightness • recovery of SF6 left in the flexible connections between the filling and making the
vacuum • reduction of treatment time during repair of leaking products • testing gas-tightness with helium rather than SF6; • use of more efficient recovery compressors (announced down to 2 kPa) • usage of flow meters to check the quantity of gas used in the products and detect
leakages in the network and monthly calculation of emissions are planned

EDITION 1.1, 01.07.2010 17
3 Global SF6 Policy
This chapter provides an overview on global and national climate change policy re-lated to SF6 emissions from electrical equipment.
3.1 Introduct ion to C l imate change po l icy
Climate change is a global problem. In 1997, the industrialized countries accepted emission reduction targets for six greenhouse gases at the third conference of the Parties to the United Nations Framework Convention on Climate Change (UNFCCC) in Kyoto. The agreed target is an average reduction of 5 % from 1990 levels by the year 2012. This agreement subsequently became known as the Kyoto-Protocol and came into effect on February 16, 2005. Despite non-ratification by the USA, it is widely seen as an important step to limit global greenhouse gas emissions to levels which “avoid dangerous anthropogenic interference with the climate sys-tem” – the key objective laid down in the UN framework convention in 1992. Car-bon dioxide (CO2) is the major greenhouse gas, with emissions occurring mainly from fossil fuel use for the generation of heat and power. However, the Kyoto-Protocol also concerns nitrous oxide (N2O), methane (CH4) and the entire set of fluorinated greenhouse gases, including hydrofluorocarbons (HFC), perfluorocar-bons (PFC) and sulphur hexafluoride (SF6).
3.2 Regulat ions concern ing SF 6
The Kyoto Protocol has been ratified by 184 countries. 37 countries of those 184 have committed themselves to a reduction of four greenhouse gases (carbon dioxide, methane, nitrous oxide and sulphur hexafluoride) and two groups of greenhouse gases (hydrofluorocarbons (HFC) and perfluorocarbons (PFC), in relation to their 1990 emission levels, in accordance with Annex B of the Protocol. The six green-house gases are translated into their CO2 equivalents to determine the reduction of emissions. F-Gases only account for approximately 1.1 % of the total global greenhouse gas emissions (see Figure 2). This might be one reason that other than the European Un-ion, no other country has so far introduced a regulation dedicated to F-Gases. Look-ing at the total reported F-Gas emission data from Annex I, countries of the

EDITION 1.1, 01.07.2010 18
UNFCCC, the SF6 emissions from electrical equipment contributes to 8.0 % of the total F-Gas emissions of those countries in 20079.
Figure 2: Distr ibut ion of g lobal tota l greenhouse gas emiss ions over ind i-
v idual greenhouse gases in 2004 [13]
The objective of the European regulation, (Regulation (EC) No 842/2006) is to re-duce emissions of the fluorinated greenhouse gases considered under the Kyoto Pro-tocol. It addresses the containment, use, recovery and destruction of fluorinated greenhouse gases in addition to the labelling and disposal of products and equipment containing those gases. It also regulates the reporting of information on F-Gases; the control of uses referred to in Article 8 and the placing on the market, prohibitions of the products and equipment referred to in Article 9 and Annex II. Another important part is the training and certification of personnel from companies involved in activi-ties provided for by this regulation. The F-Gas regulation has no binding reduction targets on F-Gases but the above-mentioned set of measures is nevertheless, expected to achieve significant reduc-tions. Estimations by the European commission, state a reduction potential of 21 Mt CO2 eq. by 2012 through containment measures and further 6 Mt CO2 eq. through prohibitions and use bans by 2012 [14]. The Commission does not state specific es-timates for SF6 emissions from electrical equipment. The European F-Gas regulation affects electrical equipment using SF6 in two differ-ent ways. Article 4 regulates the recovery of SF6 from high voltage switchgear above 1 kV (see also chapter 2.4) and Article 6 demands reporting of produced amounts of
9 http://unfccc.int/di/DetailedByParty/Event.do;jsessionid=5A2B0A801213B4F89F0E3EA380D6EE5F.diprod01?event=go#
EDITION 1.1, 01.07.2010 19
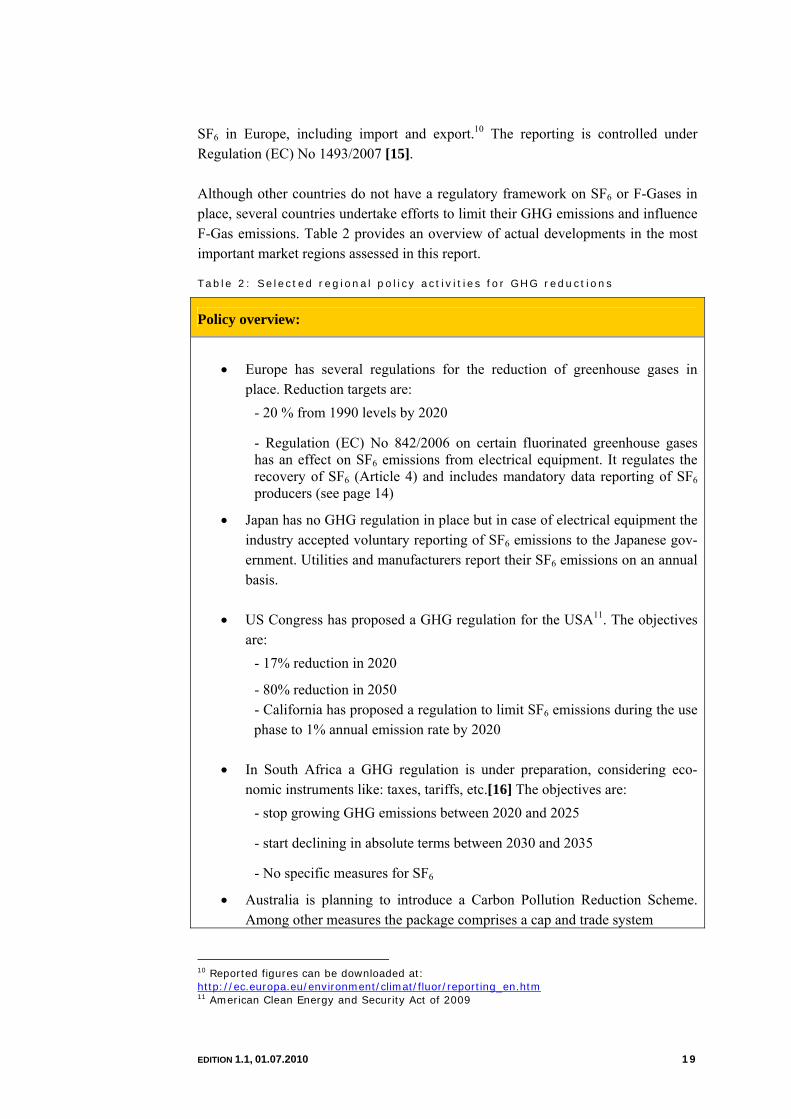
SF6 in Europe, including import and export.10 The reporting is controlled under Regulation (EC) No 1493/2007 [15]. Although other countries do not have a regulatory framework on SF6 or F-Gases in place, several countries undertake efforts to limit their GHG emissions and influence F-Gas emissions. Table 2 provides an overview of actual developments in the most important market regions assessed in this report.
Table 2: Se lected reg ional po l icy act iv i t ies for GHG reduct ions
Policy overview:
• Europe has several regulations for the reduction of greenhouse gases in
place. Reduction targets are: - 20 % from 1990 levels by 2020
- Regulation (EC) No 842/2006 on certain fluorinated greenhouse gases has an effect on SF6 emissions from electrical equipment. It regulates the recovery of SF6 (Article 4) and includes mandatory data reporting of SF6 producers (see page 14)
• Japan has no GHG regulation in place but in case of electrical equipment the industry accepted voluntary reporting of SF6 emissions to the Japanese gov-ernment. Utilities and manufacturers report their SF6 emissions on an annual basis.
• US Congress has proposed a GHG regulation for the USA11. The objectives
are: - 17% reduction in 2020
- 80% reduction in 2050 - California has proposed a regulation to limit SF6 emissions during the use phase to 1% annual emission rate by 2020
• In South Africa a GHG regulation is under preparation, considering eco-
nomic instruments like: taxes, tariffs, etc.[16] The objectives are: - stop growing GHG emissions between 2020 and 2025
- start declining in absolute terms between 2030 and 2035
- No specific measures for SF6
• Australia is planning to introduce a Carbon Pollution Reduction Scheme. Among other measures the package comprises a cap and trade system
10 Reported figures can be downloaded at: http://ec.europa.eu/environment/climat/fluor/reporting_en.htm 11 American Clean Energy and Security Act of 2009
EDITION 1.1, 01.07.2010 20
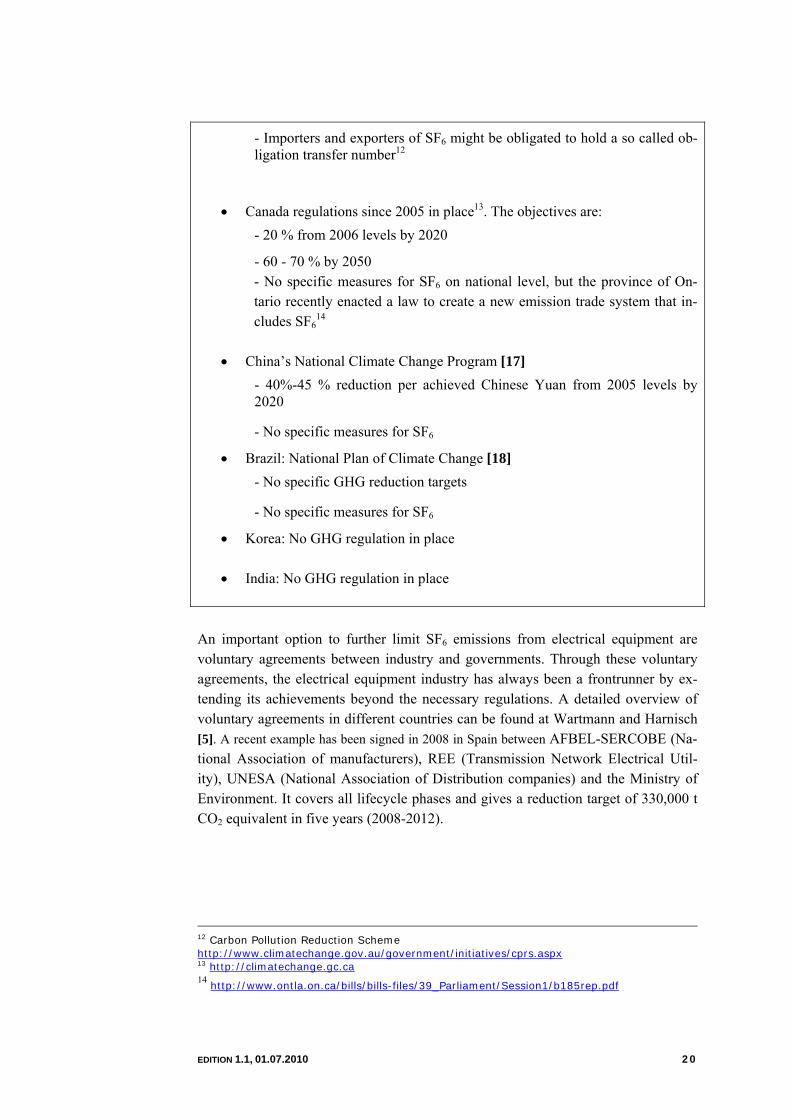
- Importers and exporters of SF6 might be obligated to hold a so called ob-ligation transfer number12
• Canada regulations since 2005 in place13. The objectives are: - 20 % from 2006 levels by 2020
- 60 - 70 % by 2050 - No specific measures for SF6 on national level, but the province of On-tario recently enacted a law to create a new emission trade system that in-cludes SF6
14
• China’s National Climate Change Program [17] - 40%-45 % reduction per achieved Chinese Yuan from 2005 levels by 2020
- No specific measures for SF6
• Brazil: National Plan of Climate Change [18] - No specific GHG reduction targets
- No specific measures for SF6
• Korea: No GHG regulation in place
• India: No GHG regulation in place An important option to further limit SF6 emissions from electrical equipment are voluntary agreements between industry and governments. Through these voluntary agreements, the electrical equipment industry has always been a frontrunner by ex-tending its achievements beyond the necessary regulations. A detailed overview of voluntary agreements in different countries can be found at Wartmann and Harnisch [5]. A recent example has been signed in 2008 in Spain between AFBEL-SERCOBE (Na-tional Association of manufacturers), REE (Transmission Network Electrical Util-ity), UNESA (National Association of Distribution companies) and the Ministry of Environment. It covers all lifecycle phases and gives a reduction target of 330,000 t CO2 equivalent in five years (2008-2012).
12 Carbon Pollution Reduction Scheme http://www.climatechange.gov.au/government/initiatives/cprs.aspx 13 http://climatechange.gc.ca 14 http://www.ontla.on.ca/bills/bills-files/39_Parliament/Session1/b185rep.pdf

EDITION 1.1, 01.07.2010 21
4 Emission Development 2005-2030
The following chapter contains emission scenarios for 2005 to 2030. For this period, a “business-as-usual” scenario and an additional action scenario is calculated. The scenarios aim to provide a comprehensive overview of the development of SF6 emis-sions from the electrical equipment and electrical industry on the global climate sys-tem. This report makes use of information about future global electricity demand projec-tions according to the latest publication of the World Energy Outlook 2009 [6], which is a key driver for the expansion of electricity grids and therefore also for SF6 emissions from electrical equipment. Accordingly, global SF6 consumption from the electrical equipment industry and the global bank development are also shown. Global Electricity Demand An important driver for future SF6 use in transmission and distribution equipment is the future global electricity demand. The emission scenario design is based on IEAs World Energy Outlook 200915. The global electricity demand is projected to grow at an annual rate of 2.7 % in the period, 2007 to 2015, slowing to 2,4 % per year on av-erage in the period, 2015-2030. Over 70% of the growth takes place in non-OECD countries. In the OECD, electricity demand is projected to rise by just 1.1 % annu-ally between 2007 and 2030. Total global electric capacity additions amount to 4,800 GW until 2030, of which about 1,522 GW are added in the period to 2015. The total cumulative investment in the power sector over the period 2007 to 2030 is projected $ 13.7 trillion16, of which $ 6.5 trillion is required for transmission and distribution networks.
15 http://www.worldenergyoutlook.org/2009.asp 16 year-2008 dollars

EDITION 1.1, 01.07.2010 22
4.1 Data Co l lec t ion Process
Emissions estimates and projections from electrical equipment are based on an as-sessment of expected technology shifts and an evaluation of respective emission fac-tors in the 14 market regions shown in Table 3.
Table 3: Regional Scope of the study
Assessed regions:
• EU-27 • North America • Japan • India • Korea • China • Russia • Saudi Arabia
• Brazil • South Africa • Central Europe (Non EU) • South East Asia • Indonesia • Oceania
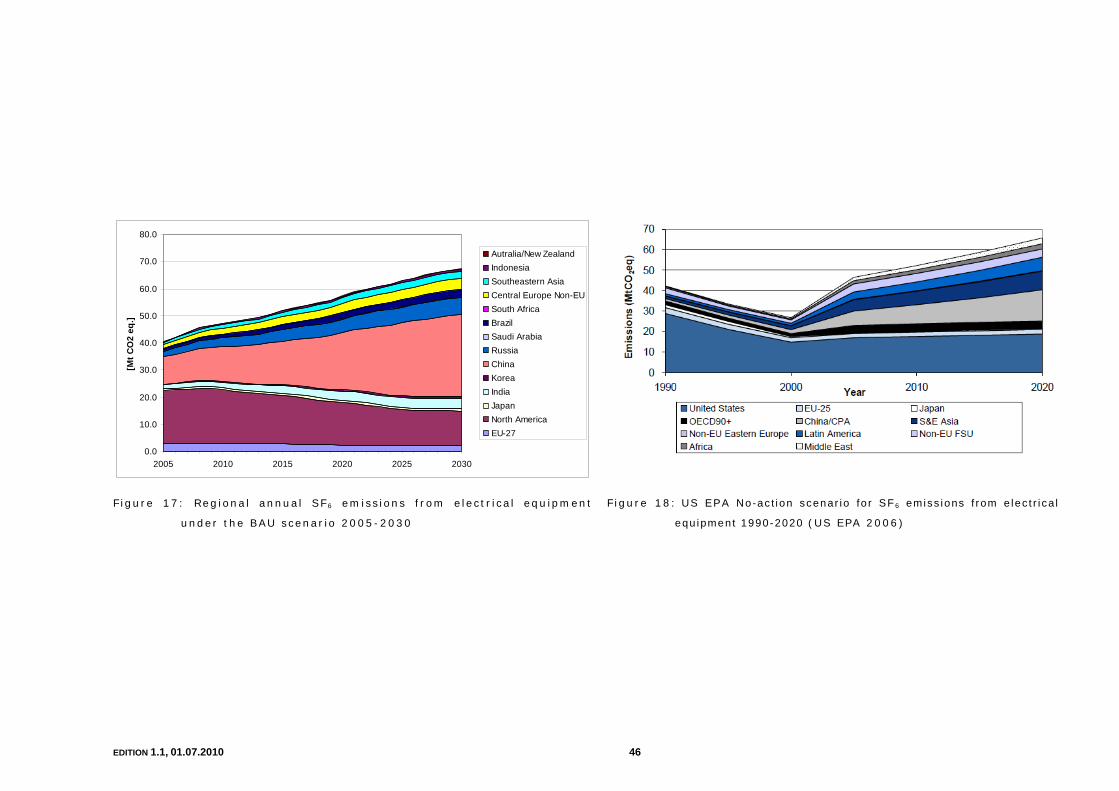
Therefore, a detailed questionnaire was developed and distributed among experts from JEMA, NEMA and T&D Europe. The Japan Electrical Manufacturers' Associa-tion (JEMA) consists of major Japanese companies in the electrical industry, includ-ing power and industrial systems, home appliances and related industries. NEMA is the trade association for the electrical manufacturing industry in the USA. The mem-ber companies of NEMA manufacture products used in the generation, transmission and distribution, control, and end-use of electricity. T&D Europe is the European as-sociation of the electricity transmission and distribution equipment and services in-dustry. It represents all relevant European national associations. The survey resulted in a solid data basis for existing banks, applied technologies and technology shifts in Europe, Japan and North America. The questionnaire was sent to industry experts in other market regions with a very low response quota. As a result the emission projections of the remaining 11 market regions are primarily based on assumptions that have been intensively discussed with industry experts and market representatives from the above mentioned associations. The SF6 emission development in the 14 regions can be seen in Figure 17and Figure 19. However, the report gives a very clear picture of the current state of the electrical equipment industry and the end users of electrical equipment on a global level. It also aims to indicate what action needs to be taken to further reduce SF6 emissions from the entire life cycle of electrical equipment essential to today’s global society.

EDITION 1.1, 01.07.2010 23
4.2 Scenar io Des ign
Chapter 4.3 show a, “business-as-usual” scenario (“BAU Scenario”) and an addi-tional action scenario (“Additional Action Scenario”) for period 2005-2030. Both scenarios are based on a forecast of market trends, global energy demand, population development and regional GDP growth. Life cycle emissions are calculated by using an emission-factor approach that applies annual emission factors per life cycle phase. Relevant activity data per life cycle phase is SF6 consumption by equipment manu-facturers, banked SF6 quantities in transmission and distribution networks and the annual share of SF6 banked in equipment that is recovered during decommissioning. BAU Scenario By 2005, Europe and Japan had already reached low emission levels over the entire life cycle of electrical equipment, due to voluntary actions launched since the mid-1990s. Manufacturers and end users of SF6 insulated electrical equipment have suc-ceeded in significantly improving the technical standards according to which the equipment is produced, serviced, maintained and decommissioned. Emission rates during manufacturing are below 3 % (see chapter 4.3.1) and are ex-pected to reach a minimum of 2.0 % until 2015. Apart from design-related leakages, emissions from the use-phase are also caused during gas handling and by defective equipment. The data collection for Japan showed that annual emissions during use phase have already reached a level below 1.0 %. In Europe, these emissions still re-main slightly above 1.0 %, but this is expected to decrease further in the coming years [5]. According to an opinion shared among experts, the emission rate during decommissioning of equipment in Europe is around 0.8 % for the mix of closed and sealed electrical equipment [9]. At present, figures from Japan are not available. However, it is assumed that handling processes are comparable to Europe and emis-sions from decommissioning are estimated to not exceed 0.8 %. However, due to a different share between HV and MV equipment, the global annual BAT emission rate for decommissioning is 0.9 %. North America still offers considerably higher potential for emission reduction than Europe and Japan. Due to a growing awareness of climate change in the USA, it is estimated that North America will pick up quickly in the coming years. Other well-developed world regions like Korea, Saudi Arabia, South Africa and Oceania are also expected to be at an acceptable emission level as of 2005. The electrical equip-ment industry in these regions is represented, mainly by European and Japanese companies, which already have high tightness standards in place. However, in order to reach European and Japanese standards, additional action still needs to be taken.
EDITION 1.1, 01.07.2010 24
It is estimated that currently, countries in transition (i.e. China, India and Brazil) and developing countries show the highest life cycle emissions from electrical equip-ment. In particular, emission rates from the use-phase and from decommissioning seem considerably higher than in the developed world. This is mainly a result of the lack of trained handling and maintenance personnel and a lack of established han-dling procedures. Emission rates from manufacture are assumed closer to the Euro-pean and Japanese average, because manufacturing in developing countries is mainly executed from western companies. As a result, the BAU Scenario shows the global emission development under the as-sumption that in developing countries, emission rates from manufacture and disposal of electrical equipment remain constant at the 2005 level over the given timeframe. Emissions from the use phase decline slightly until 2030, depending on the year of installation, assuming that older equipment with higher leakage rates is progressively decommissioned. Emission rates from developed countries that already have voluntary actions estab-lished in the mid nineteen nineties follow their trend from the recent past in the BAU scenario. Additional Action Scenario The additional-action scenario is based on the trend of voluntary action aiming for a reduction of SF6 emissions, and on past experience with the implementation of “vol-untary-action” measures in Europe and Japan. Under this scenario it is expected that Europe and Japan will reach best possible emission rates in all three life cycle phases until 2020. Experiences from the recent past in OECD countries have shown that significant improvements can be achieved in a period of 15 to 20 years. Therefore, for all other countries, it is estimated that BAT emissions rates can be reached, at the latest, by 2030. Table 4 shows annual emission rates per life cycle phase for best available techniques (BAT). The emission rates are weighted emission factors for both, HV and MV electrical equipment, applying a global average use share of 30/70 for MV and HV equipment. In some regions, i.e. in Japan and the USA, HV equip-ment is more significant and reaches a share of 90 %. In other regions like Europe, MV equipment is in the process of becoming more significant and the share of MV equipment reaches approx. 40 %. To facilitate calculations, a global average share of 30/70 for MV/HV is applied to all markets.

EDITION 1.1, 01.07.2010 25
Table 4: Weighted BAT annual emiss ion rates17
Manufacturing Use-phase Decommissioning 2.0 % 0.4 % 0.9 %
The decommissioning of electrical equipment will become very important in the coming years. The additional action scenarios show two different scenarios for the decommissioning phase. The first scenario assumes that all (100 %) of the equip-ment reaches proper recycling facilities at end of life. The second scenario shows how emissions evolve in a situation where only 80 % of the equipment is recycled properly and the remaining 20 % is vented into the atmosphere. The additional action scenario sets the BAT emission rates as a target for the entire electrical equipment industry. Although this target seems very ambitious, the experi-ence from Europe and Japan showed that this is achievable. Figure 9(page 35), Figure 10 (page 37) and Figure 11 (page 39) shows that by achieving this target by 2030 and beyond, emissions from the global electrical equipment industry can be re-duced by 30 % against 2005 levels, even if the global energy demand and related SF6 banks grow significantly.
4.2 .1 Reduct ion measures under the Addit ional Act ion Scenar io
Chapter 2.4 described handling practices applied by equipment manufacturers. How-ever, several reduction measures can be applied throughout the entire life cycle of electrical equipment. The following section shows selected reduction measures, which are already implemented in most of the developed world. By applying those reduction measures in developing countries, a significant reduction potential can be achieved as the emission development under the Additional Action Scenario shows. (see chapter 4.3 ff.) Reduction measures during manufacturing Instead of using individual gas bottles for each work place in the production and shuttling bottles back and forth through the production site, a central supply system helps to significantly reduce emissions and allows the process to be thoroughly monitored through flow meters at the workstations. Such a system consists of a sin-gle gas tank and a pipe-system to the single working stations.
17 According to expert interviews

EDITION 1.1, 01.07.2010 26
Gas bottles are usually equipped with self-closing valves, but when tubes are used for filling, a certain amount of gas remains in the tube and is released after the tube is disconnected from the filled application. These emissions can also be avoided by equipping the tubes with self-closing couplings/valves or through process changes, such as evacuation of the tube after the filling process and recovery of the SF6 from the resulting gas/air-mix. Reduction measures during the use-phase Leakage of closed pressure equipment can be monitored with either density or tem-perature compensated pressure sensors. When the pressure level falls below the op-erating pressure, an alarm is given. State-of-the-art monitoring techniques enable the detection of leaking compartments at an early stage, allowing for timely action for repair or replacement. Today, all closed pressure equipment is equipped with den-sity/pressure sensors and most of the older units have been re-equipped in OECD countries. Even with high awareness and good training, opening closed pressure equipment as part of maintenance will always lead to emissions. Therefore, reducing the frequency of maintenance for closed pressure equipment to the minimum will lead to emission reductions. In recent years, a strong tendency can be observed towards decreasing the fixed maintenance frequencies or carrying out maintenance only if gas quality checks indicate it to be necessary, in OECD countries (reliability centered/condition based maintenance) End of life emission reduction measures Creating a cost-efficient and reliable decommissioning structure is an important op-tion. When greater numbers of equipment are expected to be taken out of operation after 2045, a decommissioning infrastructure with clear competences and logistics, sufficient numbers of trained staff and up-to-date equipment has to be in place. Awareness of the user will contribute significantly to avoid emissions, by making the equipment reaching its end of life to be processed by accredited disposal entities. Reduction measures for all life cycle phases Training is a significant option, that is already widely applied in OECD countries, for all phases of the life-cycle, as it ensures that staff are able to properly carry out all provisions for emission prevention and reduction. This includes not only the proper handling of the equipment, but also the awareness that SF6 is a greenhouse gas and emissions need to be kept to a minimum. The industry from OECD countries is already taking training very seriously and has implemented several training meas-ures [19].
EDITION 1.1, 01.07.2010 27
Monitoring and book keeping of handled, installed or consumed gas amounts does not directly lead to emission reductions, but it does allow for the identification of re-duction potential and controlling the effects of implemented reduction measures. It also raises awareness and responsibility for emission development can then be as-signed (e.g. to staff at single working stations in manufacturing). Labelling of equipment, i.e. the indication on the equipment that SF6 is contained and the amount of the substance in kg, also has no direct impact on emission reduc-tion. The main purpose of this is to create awareness in those handling the equipment and to identify the equipment for correct decommissioning. Most new products in the OECD countries actually show a separate label applied since April 1st 2008 indi-cating that SF6 must not be released into the atmosphere. Most of the above mentioned reduction measures are commercially available on a global level and can be implemented at a relatively low cost (below 20 US dollar per tonne abated CO2 equ.). More detailed information about reduction costs is available via [5].

EDITION 1.1, 01.07.2010 28
4.2 .2 Act iv i ty data project ions
SF6 consumption by manufacturers: Annual SF6 consumption has been estimated from results of the data collection with the questionnaire, literature data and expert estimates. The main SF6 consuming re-gions of the electrical equipment industry are Europe, Japan and China followed by North America. It is assumed that approximately 80 % of the SF6 consumption for high and medium voltage electrical equipment is consumed in these regions. How-ever, detailed data is only available for Europe, Japan, the USA and Korea. Europe’s SF6 consumption in 2005 is estimated at approximately 1,200t [5]. The data collec-tion showed that Japan consumed around 600t in 2005. According to the National emission inventory of the USA, their annual SF6 consumption for manufacture amounted to 300t in 2005 and the Korean manufacturers consumed 278t. According to expert estimates, at least five large electrical equipment manufacturers exist in China and each of these manufacturers account for an annual SF6 consump-tion of 200-600t. For the SF6 consumption projections in this report, a conservative estimate of 1.500t SF6 was estimated for the annual SF6 consumption of Chinese manufacturers. It is assumed that in other regions no significant SF6 consumption for manufacturing takes place. If electrical equipment is manufactured in other countries the production site usually belongs to one of the leading European, Japanese or US companies and the SF6 consumption is already included in their figures. Consumption projections for the five electrical equipment producing regions are cal-culated according to annual market growth expectations until 2013 [20]. From 2013 onwards, SF6 consumption for manufacture is correlated with annual GDP growth projections and electricity demand projections, according to the World Energy Out-look 2009, which leads to a global annual average growth rate for SF6 consumption of 2 %. Figure 3 shows that annual SF6 consumption peaks around 2045 and slowly decreases in the following years, due to market saturation, and reduced SF6 quanti-ties in the equipment. An example for the decreases of SF6 quantities per unit of electrical equipment over the last 40 years is shown in Annex 2, figure 24. The development of annual SF6 consumption for the long-term is associated with high uncertainties. Chapter 4.4 provides a sensitivity analysis for the SF6 consump-tion development. As the amount of annual consumption is integral to the emission projections, chapter 4.4 shows the emission development for the situations that the annual amount of SF6 consumption is 25 % above or 25 % below the following fig-ures.

EDITION 1.1, 01.07.2010 29
Global annual SF6 consumption
0
2.500
5.000
7.500
10.000
2005 2010 2015 2020 2025 2030
[t SF
6]
Figure 3: Global annual SF6 consumpt ion project ions for e lectr ica l equip-
ment product ion 2005-2030
EDITION 1.1, 01.07.2010 30
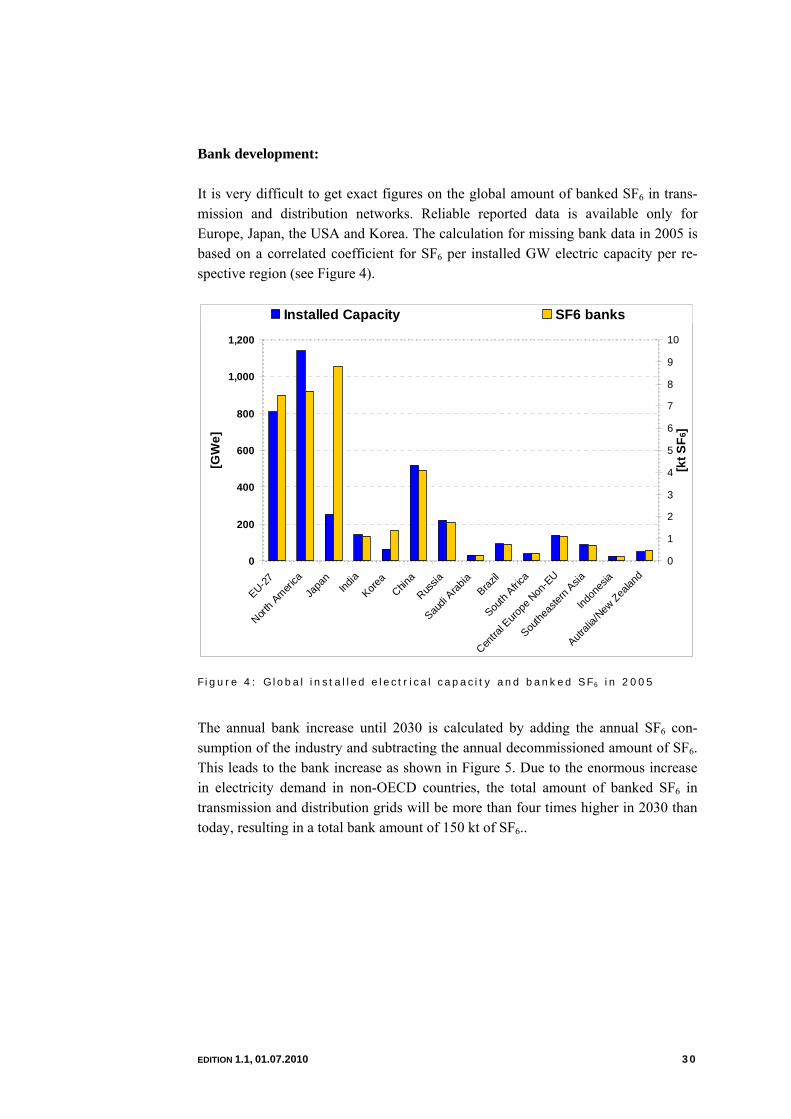
Bank development: It is very difficult to get exact figures on the global amount of banked SF6 in trans-mission and distribution networks. Reliable reported data is available only for Europe, Japan, the USA and Korea. The calculation for missing bank data in 2005 is based on a correlated coefficient for SF6 per installed GW electric capacity per re-spective region (see Figure 4).
0
200
400
600
800
1,000
1,200
EU-27
North A
merica
Japa
nInd
iaKore
aChin
a
Russia
Saudi
Arabia
Brazil
South
Africa
Centra
l Euro
pe N
on-E
U
Southe
aster
n Asia
Indon
esia
Autrali
a/New
Zealan
d
[GW
e]
0
1
2
3
4
5
6
7
8
9
10
[kt S
F 6]
Installed Capacity SF6 banks
Figure 4: Global insta l led e lectr ica l capac i ty and banked SF6 in 2005
The annual bank increase until 2030 is calculated by adding the annual SF6 con-sumption of the industry and subtracting the annual decommissioned amount of SF6. This leads to the bank increase as shown in Figure 5. Due to the enormous increase in electricity demand in non-OECD countries, the total amount of banked SF6 in transmission and distribution grids will be more than four times higher in 2030 than today, resulting in a total bank amount of 150 kt of SF6..

EDITION 1.1, 01.07.2010 31
0
20.000
40.000
60.000
80.000
100.000
120.000
140.000
160.000
2005 2010 2015 2020 2025 2030
[t SF
6]
Figure 5: Projected aggregated SF6 bank development 2005-2030
Annual share of decommissioned SF6 banks: The annual share of banked SF6 that is going to be disposed is estimated from results of the data collection, literature data and expert estimates. Equipment lifetimes are between 30-50 years on average, depending on the equipment category. At present decommissioning of old and defective equipment occurs only in small quantities, be-cause, in comparison to today, 30 years ago, those installed quantities were very small. Figures for Europe show that the annual share of decommissioned SF6 will remain below 2.0 % until 2020 [5]. According to a recent report on the recovery of F-gases in the EU-27, recovered amounts of SF6 from electrical equipment are ten times higher than the above-mentioned 2 % of the bank in 2005 [21]. However, this amount seems very high and for the purpose of this study, a conservative value of 2 %, according to Wartmann 2005, is applied. After 2020, the decommissioning of equipment increases to a maximum annual share of 3.0 %. Due to missing data for other developed regions, the European figures are also used for Japan, Korea, Saudi Arabia, South Africa and Oceania. For North America, an annual share of decommissioned SF6 of 2.0 % is currently es-timated. Particularly in the USA, much of the older equipment has been replaced with up-to-date technology that demonstrates greater efficiency. The annual share of 3.0 % is estimated to be reached in 2015 in North America. In developing countries, the annual share of decommissioned equipment is estimated to remain on a very low
EDITION 1.1, 01.07.2010 32
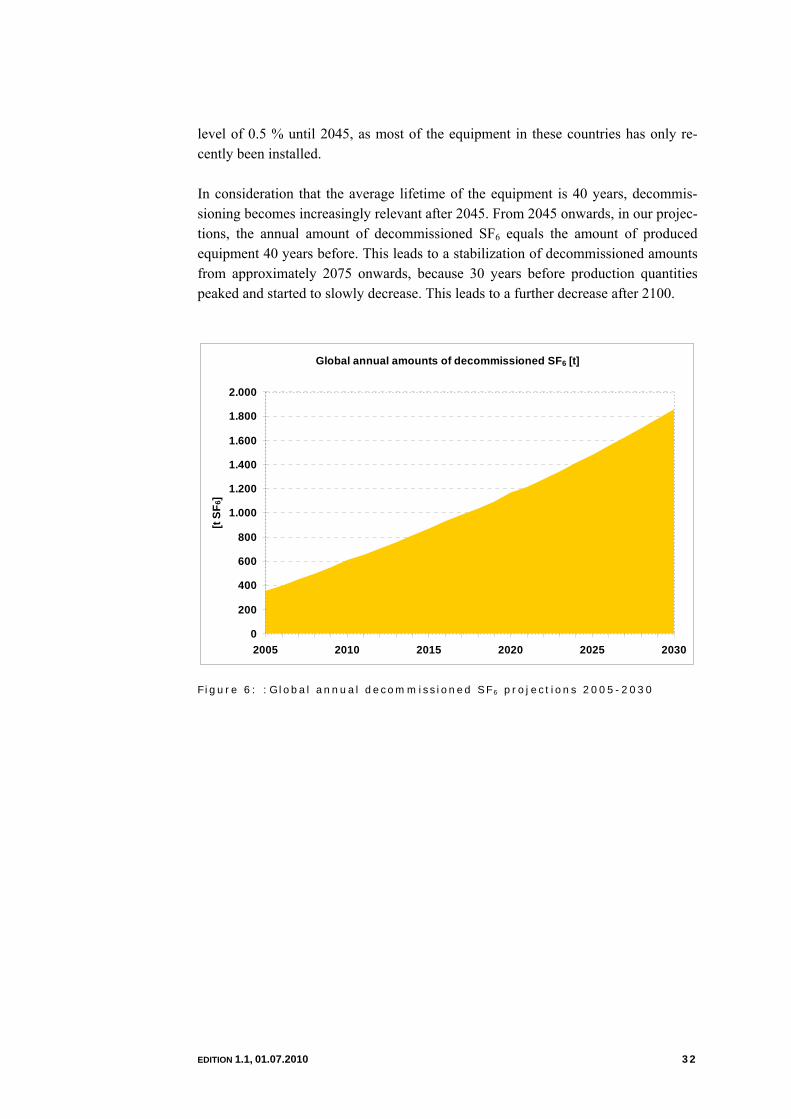
level of 0.5 % until 2045, as most of the equipment in these countries has only re-cently been installed. In consideration that the average lifetime of the equipment is 40 years, decommis-sioning becomes increasingly relevant after 2045. From 2045 onwards, in our projec-tions, the annual amount of decommissioned SF6 equals the amount of produced equipment 40 years before. This leads to a stabilization of decommissioned amounts from approximately 2075 onwards, because 30 years before production quantities peaked and started to slowly decrease. This leads to a further decrease after 2100.
Global annual amounts of decommissioned SF6 [t]
0
200
400
600
800
1.000
1.200
1.400
1.600
1.800
2.000
2005 2010 2015 2020 2025 2030
[t SF
6]
Figure 6: :Global annual decommiss ioned SF6 project ions 2005-2030

EDITION 1.1, 01.07.2010 33
4.3 Emiss ion Deve lopment 2005-2030
The following chapters show detailed figures for each life cycle phase, both for the BAU scenario and the additional action scenario. As Figure 7 shows, the additional action scenario offers a large reduction potential for the period up to 2030. 2030 emissions can be reduced by 30 % compared to 2005 levels, despite a significant bank increase if BAT standards are applied in all three life cycle phases of high and medium voltage electrical equipment. In contrast if global SF6 emissions from electrical equipment remain uncontrolled, they are projected to rise significantly by 60 % from about 1,700 t in 2005 to about 2,800 t in 2030 under the BAU scenario. Figure 7 shows that a global emissions in-crease takes place in correlation with global bank growth as shown in chapter 4.2.
0
1.000
2.000
3.000
4.000
5.000
6.000
2005 2010 2015 2020 2025 2030
[t SF
6]
Additional Actions Scenario BAU Scenario
Figure 7: Global annual SF6 emiss ions f rom electr ica l equipment 2005-
2030
Clearly, the strong increase in emissions in the BAU scenario is not in correlation with the global necessity to reduce GHG emissions in order to reduce man-made climate change as much as possible. In the other hand, the estimated reduction of emissions in the additional action scenario, exceeds the required global reduction of GHG to achieve the goal of 450 ppm of CO2 equipment in 2050. In such a way the contribution of the electrical industry to limit climate change would be positive.
EDITION 1.1, 01.07.2010 34
4.3 .1 Emiss ions dur ing manufactur ing
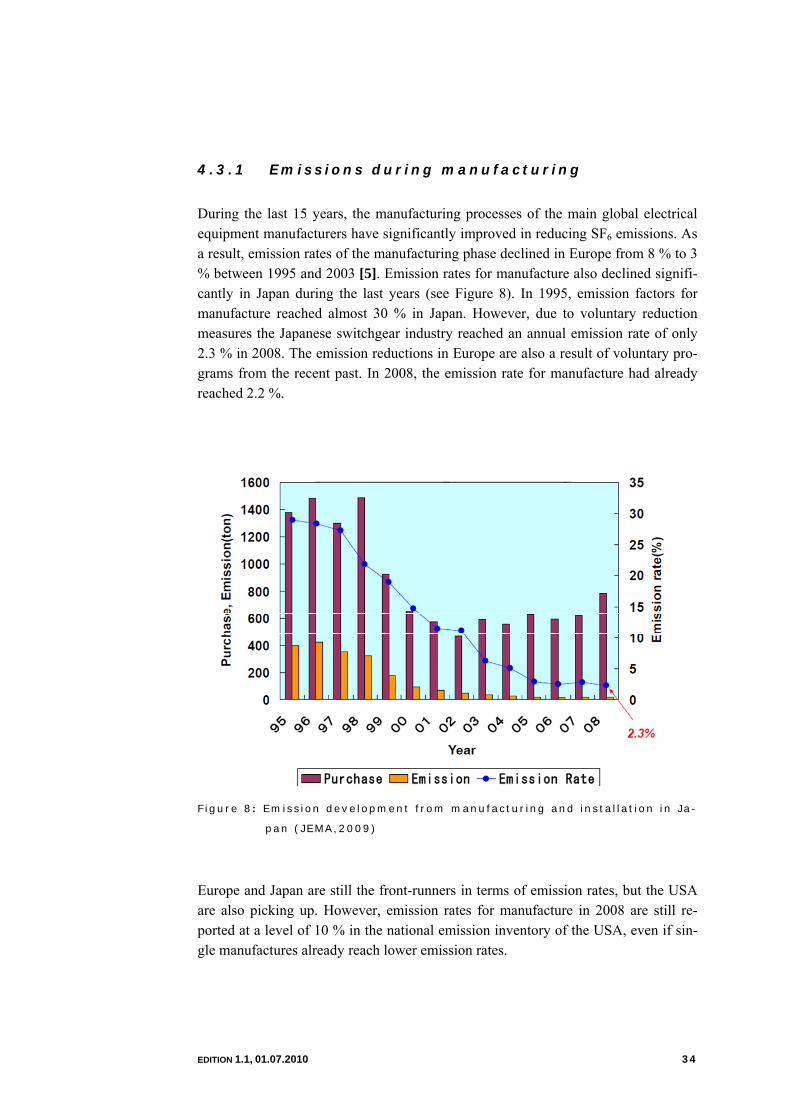
During the last 15 years, the manufacturing processes of the main global electrical equipment manufacturers have significantly improved in reducing SF6 emissions. As a result, emission rates of the manufacturing phase declined in Europe from 8 % to 3 % between 1995 and 2003 [5]. Emission rates for manufacture also declined signifi-cantly in Japan during the last years (see Figure 8). In 1995, emission factors for manufacture reached almost 30 % in Japan. However, due to voluntary reduction measures the Japanese switchgear industry reached an annual emission rate of only 2.3 % in 2008. The emission reductions in Europe are also a result of voluntary pro-grams from the recent past. In 2008, the emission rate for manufacture had already reached 2.2 %.
Figure 8 : Emiss ion development f rom manufactur ing and insta l lat ion in Ja-
pan (JEMA,2009)
Europe and Japan are still the front-runners in terms of emission rates, but the USA are also picking up. However, emission rates for manufacture in 2008 are still re-ported at a level of 10 % in the national emission inventory of the USA, even if sin-gle manufactures already reach lower emission rates.

EDITION 1.1, 01.07.2010 35
Historically, Japan and Europe supply most of the global demand for electrical equipment. Manufacturing in most other regions only plays a minor role and if pro-ductions sites are located in those regions, they usually belong to Japanese or Euro-pean companies. For those regions with production sites from western companies, an annual emission factor of 5.0 % is estimated. This is different for China. Due to the growing energy demand in China and the rapid growth of the switchgear industry in recent years, (see chapter 4.2) several Chinese manufacturers have entered the market and it is expected that the Chinese electrical equipment industry will reach a market share of 50 % of the total global market in the coming years. As of today no awareness for SF6 emissions during the manufacturing process exists in China, an annual emission rate of 15 % is assumed. Annual emissions can be calculated by applying the afore-mentioned emission fac-tors on the projected SF6 consumption of electrical equipment manufacturers, as de-scribed in chapter 4.2. Figure 9 shows the emission development for both the BAU scenario and the addi-tional action scenario between 2005 and 2030. It becomes clear that emissions from manufacture will increase by more than 200 % of today’s amount in the BAU sce-nario. If additional actions are implemented globally and the target emission rate as shown in Table 4 is reached, emission can be reduced by 80 % in 2030 compared to the BAU Scenario. Emissions would then fall below today’s level.
0
100
200
300
400
500
600
700
800
2005 2010 2015 2020 2025 2030
[t SF
6]
Additional Actions Scenario for manufacture BAU Scenario for manufacture
Figure 9: Global annual SF6 emiss ions f rom manufacture 2005-2030

EDITION 1.1, 01.07.2010 36
4.3 .2 Emiss ions f rom the use-phase
As already described above, the data collection showed that the annual emission rates during use phase have already reached a level below 1.0 % in Japan. In Europe, the emission rates still remain slightly above 1.0 %, but are expected to decrease fur-ther in the coming years [5]. In North America, emissions from the use phase are still relatively high because of a high share of old equipment not designed for high tight-ness in the grids. According to the national greenhouse gas (GHG) inventory of the USA, emissions during use phase are slightly above 10%18 of the installed bank. However, several utilities in the USA participate in a voluntary reduction programme initiated by US EPA. The participating companies achieved an emission reduction from 15.2 % in 1999 to 5.5 % in 2007 [22]. Current emission rates for developing countries are estimated at a level of 5 % annu-ally because although new equipment designed for high tightness is used in the grid, gas handling practices and individual staff awareness have not yet reached western standards. Figure 10 shows that emissions during the use phase only increase slowly in the BAU scenario. The increase is smaller than the bank development shown in Figure 5, according to decreasing emission factors caused by progressively decommissioned old equipment that is replaced by new equipment designed for high tightness (see chapter 4.2). When taking additional action, especially in developing countries, emissions from the use phase can be reduced to a level that is 25 % below today’s global emissions from the use phase in 2030 compared to the BAU-Scenario.
18http://unfccc.int/files/national_reports/annex_i_ghg_invento-ries/national_inventories_submissions/application/zip/usa_2009_crf_13apr.zip

EDITION 1.1, 01.07.2010 37
0
500
1.000
1.500
2.000
2.500
3.000
2005 2010 2015 2020 2025 2030
[t SF
6]
Additional Actions Scenario use phase BAU Scenario use phase
Figure 10: Global annual SF6 emiss ions f rom the use-phase 2005-2030
4.3 .3 Emiss ions f rom decommiss ion ing
The emission rates for gas recovery in decommissioning have two drivers: the rate of correct decommissioning, i.e. where the gas is recovered instead of releasing it into the atmosphere (venting), and the amount of gas emitted during recovery for techni-cal reasons. Due to a lower level of awareness, in Europe a significant share of venting is as-sumed to have taken place in the 1990s. Based on information from the European manufacturers and users side the total emission rate for recovery in decommissioning was assumed to be 70 % of the SF6 contained in decommissioned equipment in 1995. For 2003, an emission rate of 2 % has been determined for decommissioning in Europe due to increased awareness [5]. This emission rate reflects 100 % of equip-ment being decommissioned properly with a technically minimized gas loss of 2 % during gas recovery. Table 5 shows the best handling practices for gas recovery ac-cording to IEC/TR 62271-303.

EDITION 1.1, 01.07.2010 38
Table 5: Recover ing and rec la iming of SF6 f rom any compartment of con-
tro l led and/or c losed pressure systems [9]
These assumptions are also applied for Japan, Korea, Saudi Arabia, South Africa and Oceania. For North America, an emission factor of 5 % has been assumed for 2005. For the remaining regions, an emission factor of 70 % is applied. However, the high emission factor for developing countries in the remaining regions will have only a minor effect on the annual emissions, as the share of decommissioned equipment in these countries will remain very small until 2045 (see chapter 4.2). Figure 11 shows the emission development until 2030, under the assumption that 100% of the disposed equipment reaches adequate recycling facilities at end of life as described in chapter 4.2.1. Figure 12 shows how emissions evolve in the case that only 80 % of the equipment is treated in a proper way at end of life and the remain-ing 20 % is vented into the atmosphere. Figure 12 shows that even in the additional action scenario, emissions increase by 350 % if a share of 20 % is not treated cor-rectly after end of life. This clearly shows how important an efficient and intercon-nected global recycling system for SF6 insulated electrical equipment is, to reduce emissions at the end of life. In this sense, awareness of users become essential to as-sure that 100% of the decommissioned equipment is correctly disposed of.

EDITION 1.1, 01.07.2010 39
0
100
200
300
400
500
600
700
800
2005 2010 2015 2020 2025 2030
[t SF
6]
Additional Actions Sc. decommissioning BAU Scenario decommissioning
Figure 11: Global annual SF6 emiss ions f rom decommiss ioning 2005-2030
(recyc l ing quota 100 %)
0
100
200
300
400
500
600
700
800
2005 2010 2015 2020 2025 2030
[t SF
6]
Additional Actions Sc. decommissioning BAU Scenario decommissioning
Figure 12: Global annual SF6 emiss ions f rom decommiss ion ing 2005-2030
(recyc l ing quota 80 %)
Even if emissions from decommissioning under the BAU-scenario only play a minor role in comparison to the total life-cycle of electrical equipment, a significant emis-

EDITION 1.1, 01.07.2010 40
sion reduction can be achieved in the additional action scenario if all disposed sys-tem reach an appropriate recycling facility and today’s emissions can be halved by 2030. The impact of increasing amounts of equipment that requires decommission-ing is more substantial after 2045, when globally bigger shares of electrical equip-ment require decommissioning (see Annex 3).

EDITION 1.1, 01.07.2010 41
4.4 Sens i t iv i ty ana lys is for annual SF6 consump-t ion
As already described in chapter 4.2.2, the development of annual SF6 consumption for the long-term is associated with high uncertainties. To demonstrate the sensitivity of annual SF6 consumption by the electrical equipment industry, the emission figures above, are recalculated on the premise that annual SF6 consumption is either 25 % above or 25 % below the above shown figures. Figure 13 shows the global total SF6 emission development from electrical equipment for the different consumption sce-narios in the period 2005-2030. All figures are created assuming that 100 % of the equipment reaches proper recycling facilities at end of life.
0
500
1.000
1.500
2.000
2.500
3.000
3.500
2005 2010 2015 2020 2025 2030
[t SF
6]
BAU Scenario
BAU Scenario +25%
BAU Scenario -25%
Additional ActionScenarioAdditional Action +25%
Additional Action -25%
Figure 13: Sensi t iv i ty analys is for g lobal tota l SF6 emiss ions f rom electr i -
ca l equipment 2005-2030
Figure 13 clearly shows that the sensitivity of the annual SF6 consumption remains relatively small. Through changing the annual SF6 consumption by 25 %, the total emission development only changes by approximately 15 % under the BAU sce-nario. The influence of the annual amount of consumed SF6 becomes even less im-portant under the additional action scenario, as an increase in the implementation of additional actions reduces the emissions sensitivity to SF6 gas consumption. Emis-sions in 2030 then vary by only. ±10 %.

EDITION 1.1, 01.07.2010 42
4.5 SF 6 emiss ions and the IPCC scenar io process
The latest emission scenarios for SF6 stem from the Special report on Emission sce-narios (SRES) prepared by the IPCC in 2000. They show the global SF6 emission development only on an aggregated basis, meaning that SF6 emissions from various sources like the semiconductor industry, magnesium industry, electrical equipment industry and military applications are shown all together. In 2003, the IPCC decided to develop new emission scenarios until 2012/2013. These scenarios shall present the global greenhouse gas emission development for the “near term” until about 2035 and the long term until 2100. The new IPCC scenario process is run much more decentralised than the IPCC SRES process. The IPCC has only a facilitating role of the work of a range of modelling groups. The report at hand wants to provide the relevant emission scenarios for SF6 emissions from electrical equipment. Figure 14 below shows the result of this study in comparison to the SRES scenarios19.
It becomes clear that emissions from electrical equipment, depending on what sce-narios are used for comparison, are only responsible for 10.0 % to 38.7 % of global total SF6 emissions. This underlines the need of further research also for other em-mission sources than electrical equipment.
19 A detailed scenario description of the SRES scenarios can be found on page 48.
-
2.000
4.000
6.000
8.000
10.000
12.000
14.000
2020 2021 2022 2023 2024 2025 2026 2027 2028 2029 2030
[t SF
6]
SRES A1
SRES A2
SRES B1
SRES B2
ESI-SF6 BAU
ESI-SF6 AdditionalAction
Figure 14: SF6 emiss ions f rom e lectr ica l equipment ESI-SF6 vs. SRES
(1999)

EDITION 1.1, 01.07.2010 43
5 Conclusions
The aim of this report is to provide detailed information on the future development of SF6 emissions from high and medium voltage electrical equipment at the global level. This chapter summarizes the global emission projections and compares the re-sults with other emission scenarios from the recent past. Emission Projections The scenario calculations show that global SF6 emissions are projected to rise by al-most 100 % under the BAU scenario until 2030. The increase between 2005 and 2030 is mainly a result of the significant increase in the global electricity demand during this period, which then leads to the significant expansion of transmission and distribution networks, especially in developing countries. In 2030, the electricity demand is predicted to stabilize but emissions will continue to increase under the BAU scenario due to further growing banks and growing numbers of equipment that reaches end of life and has to be decommissioned. (see Figure 15). The immense SF6 emission increase under the BAU scenario clearly needs to be addressed in order to contribute to global efforts on reducing climate change. As the additional action sce-nario shows, that if the already existing reduction measures, as used e.g. in Japan and the EU, were applied at a global level, this would be sufficient to avoid emission in-creases and even allow emission reductions compared to 2005.
0
1.000
2.000
3.000
4.000
5.000
6.000
2005 2010 2015 2020 2025 2030
[t SF
6]
Global SF6 emissions from manufacturing Global SF6 emissions from use phaseGlobal SF6 emissions from decommissioning
Figure 15: Global annual SF6 emiss ions f rom electr ica l equipment 2005-
2030 under the BAU scenar io

EDITION 1.1, 01.07.2010 44
Figure 16 shows the emission development under the assumption that the global electrical equipment and electricity industry applies worldwide BAT standards for manufacturing, use and decommissioning of electrical equipment. The regional assessment identifies an overall reduction potential of 65 %, if develop-ing countries achieve western emission standards and the USA also follows the re-cent trend of decreasing emissions. If appropriate measures are applied globally, the current global emissions from electrical equipment can already be reduced by 30 % until 2030, despite the projected increases in global electricity demand and signifi-cant bank growth.
0
1.000
2.000
3.000
4.000
5.000
6.000
2005 2010 2015 2020 2025 2030
[t SF
6]
Global SF6 emissions from manufacturing Global SF6 emissions from use phaseGlobal SF6 emissions from decommissioning
Figure 16: Global annual SF6 emiss ions f rom electr ica l equipment 2005-
2030 under the addit iona l scenar io
The emission development under the additional action scenario might be perceived as an ambitious target for the global electrical equipment industry. However, the re-cord of emission reductions achieved in Europe and particularly in Japan, demon-strates that by implementing voluntary emission reduction programs, significant emission reductions are achievable over a period of less than 15 years. Through these voluntary agreements, the electrical equipment industry has always been a frontrun-ner by extending its achievements beyond the necessary regulations. It is of great importance to maintain this spirit and raise awareness for the need for action with the global electrical equipment industry and for users of SF6 equipment to support the implementation of appropriate reduction measures, especially in major developing countries like China, India, Russia, Brazil or Mexico.

EDITION 1.1, 01.07.2010 45
Comparison to projections from other studies To further reinforce the scenario calculations, Figure 24 and Figure 26 show the SF6 emission scenarios calculated by the US EPA from 2005 [4]. When comparing US EPA’s scenarios with the calculated BAU scenario, a similar growth trend can be identified. Our recent calculations show that emissions are approximately the same in 2020 and will rise by a further 10 Mt CO2 eq. until 2030. To gain a comprehensive impression of how our calculations can be seen in respect to the total emissions of all SF6 emitting appliances and processes, Figure 27 illus-trates the SF6 scenarios from the IPCC Special Report on Emissions Scenarios (SRES scenarios) from 1999, which show emission projections until 2100 [3]. The ESI-SF6 BAU emissions in 2100 account for 20 % to 100 % of the SF6 emissions calculated in the SRES scenarios for that year. Thereby it becomes obvious that the global electrical equipment industry is a major source of SF6 emissions. Taking this into account, a clear need to assess all relevant SF6 emissions sources separately is identified. If only aggregated SF6 emissions from different emissions sources are considered, this might lead to an incorrect picture of the different SF6 emitting sec-tors. A clear picture is however, highly relevant when aiming to identify a need for action for single sectors. With regard to the ongoing IPCC scenario process, which aims to provide updated emission scenarios for all major greenhouse gases, it is recommended that the pre-sented emission scenarios of this report are used as an important data source for fu-ture emissions estimates under the umbrella of the IPCC. Furthermore, future efforts should also be focused on generating a solid database from developing countries with a strong economic growth such as China and India because these countries will predominantly determine future emission development from high and medium volt-age electrical switchgear.
EDITION 1.1, 01.07.2010 46
0.0
10.0
20.0
30.0
40.0
50.0
60.0
70.0
80.0
2005 2010 2015 2020 2025 2030
[Mt C
O2
eq.]
Autralia/New ZealandIndonesiaSoutheastern AsiaCentral Europe Non-EUSouth AfricaBrazilSaudi ArabiaRussiaChinaKoreaIndiaJapanNorth AmericaEU-27
Figure 17: Regional annual SF6 emiss ions f rom electr ica l equipment
under the BAU scenar io 2005-2030
F igure 18 : US EPA No-ac t ion scenar io fo r SF 6 emiss ions f rom e lec t r i ca l
equ ipment 1990-2020 (US EPA 2006)

EDITION 1.1, 01.07.2010 47
0.0
5.0
10.0
15.0
20.0
25.0
30.0
35.0
40.0
45.0
50.0
2005
2007
2009
2011
2013
2015
2017
2019
2021
2023
2025
2027
2029
[Mt C
O2
eq.]
Autralia/New ZealandIndonesiaSoutheastern AsiaCentral Europe Non-EUSouth AfricaBrazilSaudi ArabiaRussiaChinaKoreaIndiaJapanNorth AmericaEU-27
Figure 19: Regional annual SF6 emiss ions f rom electr ica l equipment under
the addi t ional act ion scenar io 2005-2030
F igure 20: US EPA Techno logy Adop t ion scenar io fo r SF 6 emiss ions f rom
e lec t r i ca l equ ipment 1990-2020 (US EPA 2006)

EDITION 1.1, 01.07.2010 48
IPCC - SRES SF6-Emissions Scenario20
SRES SF6-Emissions Scenario of 1999
0
5
10
15
20
25
30
2020 2050 2100
[kt S
F 6] A1
A2B1B2
Figure 21: SRES SF6 emiss ion scenar io (Fenhann, 1999)
Scenario description • The A1 storyline and scenario family describes a future world of very rapid eco-nomic growth, low population growth, and the rapid introduction of new and more efficient technologies. Major underlying themes are convergence among regions, ca-pacity building and increased cultural and social interactions, with a substantial re-duction in regional differences in per capita income. The A1 scenario family devel-ops into four groups that describe alternative directions of technological change in the energy system. • The A2 storyline and scenario family describes a very heterogeneous world. The underlying theme is self-reliance and preservation of local identities. Fertility pat-terns across regions converge very slowly, which results in high population growth. Economic development is primarily regionally oriented and per capita economic growth and technological change is more fragmented and slower than in other story-lines.
20 http://www.ipcc.ch/ipccreports/sres/emission/index.php?idp=0

EDITION 1.1, 01.07.2010 49
• The B1 storyline and scenario family describes a convergent world with the same low population growth as A1 storyline, but with rapid changes in economic struc-tures toward a service and information economy, with reductions in material inten-sity, and the introduction of clean and resource-efficient technologies. The emphasis is on global solutions to economic, social, and environmental sustainability, includ-ing improved equity, but without additional climate initiatives. • The B2 storyline and scenario family describes a world in which the emphasis is on local solutions to economic, social, and environmental sustainability. It is a world with moderate population growth, intermediate levels of economic development, and less rapid and more diverse technological change than in the B1 and A1 storylines. Although the scenario is also oriented toward environmental protection and social equity, it focuses on local and regional levels.

EDITION 1.1, 01.07.2010 50
6 References
[1] Climate Change 2007: The Physical Science Basis. Contribution of Working
Group I to the Fourth Assessment Report of the Intergovernmental Panel on Cli-
mate Change [Solomon, S., D. Qin, M. Manning, Z. Chen, M. Marquis, K.B. Ave-
ryt, M. Tignor and H.L. Miller (eds.)]. Cambridge University Press, Cambridge,
United Kingdom and New York, NY, USA, 212 pp.
[2] Harnisch, J., M. Frische, R. Borchers, A. Eisenhauer, A. Jordan; Natural fluori-
nated organics in fluorite and rocks; Geophys. Res. Lett., Vol. 27 , No. 13 , pp.
1883-1886, 2000.
[3] Fenhann, Jorgen: HFC, PFC and SF6 IPCC Special report scenarios, Denmark
1999
[4] United States Environmental Protection Agency: Global Mitigation of Non-CO2
Greenhouse Gases, Offi ce of Atmospheric Programs, Washington DC, June 2006
[5] Wartmann, S., Harnisch, J.: Reductions of SF6 emissions from high and medium
voltage electrical equipment in Europe. Report prepared for CAPIEL, Nurnberg,
June 2005.
[6] International Energy Agency: World Energy Outlook 2009, Paris 2009
[7] International Standard IEC 62271-1: High-voltage switchgear and controlgear –
Part 1: Common Specifications. International Electrotechnical Commission, Swit-
zerland, October 2007
[8] Biasse JM.; Stangherlin S.: Presentation of SF6 Tightness Guide presented at Ci-
gre Regional conference South Africa, August 2009

EDITION 1.1, 01.07.2010 51
[9] Technical Report IEC/TR 62271-303: High voltage switchgear and controlgear –
Part 303: Use and handling of sulphur hexafluoride (SF6) International Electro-
technical Commission, Switzerland, July 2008
[10] Regulation (EC) No 842/2006 of the European Parliament and of the Council on
certain fluorinated greenhouse gases, Brussels, May 2006
[11] Regulation (EC) No 305/2008 establishing, pursuant to Regulation (EC) No
842/2006 of the European Parliament and of the Council, minimum requirements
and the conditions for mutual recognition for the certification of personnel recov-
ering certain fluorinated greenhouse gases from high-voltage switchgear. Brussels,
April 2008
[12] Regulation (EC) No 1494/2007 establishing, pursuant to Regulation (EC) No
842/2006 of the European Parliament and the Council, the form of labels and addi-
tional labelling requirements as regards products and equipment contain fluori-
nated greenhouse gases. December 2007
[13] Climate Change 2007: Mitigation. Contribution of Working Group III to the
Fourth Assessment Report of the Intergovernmental Panel on Climate Change [B.
Metz, O.R. Davidson, P.R. Bosch, R. Dave, L.A. Meyer (eds)], Cambridge Uni-
versity Press, Cambridge, United Kingdom and New York, NY, USA., 28 pp.
[14] Wenning Marianne: EU Perspective 2020 for Climate Protection in Refrigeration,
European Commission DG ENV, Berlin May 2007
[15] Regulation (EC) No 1493/2007 establishing, pursuant to Regulation (EC) No
842/2006 of the European Parliament and the Council, the format of the report to
be submitted by producers, importers, and exporters of certain fluorinated green-
house gases.
[16] Department Environmental Affairs and Tourism Republic of South Africa: The
National climate change response policy. Discussion Document for the 2009 Na-
tional Climate Change Response Policy development Summit, Gallagher Conven-
tion Centre, Midrand, March 2009 http://www.ccsummit2009.co.za

EDITION 1.1, 01.07.2010 52
[17] China’s National Climate Change Program. Prepared under the Auspices of Na-
tional Development and Reform Commission People’s Republic of China, June
2007
[18] National Plan on Climate Change – Brazil. Government of Brazil, Interministerial
Committee on Climate Change Decree No. 6263 of November 21, 2007
[19] Sarkis S.; Endre T.; Cordioli G.; Bessede JL on behalf of T&D Europe: Reducing
greenhouse gas emissions through proper SF6 handling, presented at NCGG05
Amsterdam June 09.
[20] The Freedonia Group: World Electric Power Transmission & Distribution Equip-
ment to 2013, USA, July2009
[21] ICF International: Analysis on the Recovery of Fluorinated Greenhouse Gases in
EU-27 in the Period 2004-2007 and Determination of Options for Further Pro-
gress. Prepared for the European Commission, October 2008
[22] US EPA 2008 United States Environmental Protection Agency: SF6 Emis-
sion Reduction Partnership for Electric Power Systems, Annual Report 2007,
Washington DC, December 2008

EDITION 1.1, 01.07.2010 53
Annex 1: Abbreviations
CIGRE International Council on large electric systems CO2 eq. CO2 equivalent ESI-SF6 Ecofys Emission Scenario Initiative on Sulphur Hexafluoride GHG Greenhouse gas GDP Gross Domestic Product GWP Global Warming Potential HV High voltage JEMA Japanese electrical manufacturers association kt kilo (1000) metric tonnes MV Medium voltage NEMA National electrical manufacturers association (USA) OECD Organisation for Economic Co-operation and Development t metric tonnes T&D Europe European Association of the Electricity Transmission and Distri-
bution Equipment and Services Industry UNFCCC United Nations Framework Convention on Climate Change

EDITION 1.1, 01.07.2010 54
Annex 2: Additional f igures
0%
20%
40%
60%
80%
100%
120%
145 kV 245 kV 420 / 550 kV
Mas
s of
SF 6
per
bay
1970s2000s
The SF6 mass per bay used for 420/550 kV in 1970s is adopted as reference
145 kV 245 kV 420/550 kV
1970s
2000s
1970s
2000s
The SF6 mass per bay used for 420/550 kv is adopted as reference
Mas
s of
SF 6
per b
ay
Figure 22: Reduct ion of the mass of SF6 used per GIS bay and for d i f fer-
ent vo l tage levels [8 ]
EDITION 1.1, 01.07.2010 55
Annex 3: Emission Development 2030-2100
Estimating long-term global SF6 emissions from electrical equipment carries a num-ber of uncertainties, because several questions can not be easily answered at present. One of the main questions will be, how the global electrical equipment industry will be positioned when the electrification of the global society reaches saturation and when this saturation will occur. In the following figures, it is assumed that market saturation will be reached around 2030. The CAPIEL report from 2005 showed that the European electrical equipment market reaches saturation around the year 2010. Due to lack of similar information from other market regions, it is assumed that markets in the rest of the world and es-pecially in developing countries will reach saturation when the enormous capacity additions for electricity production are installed in 2030 (see chapter 4.2.2). At this point of time industry’s SF6 consumption peaks and will then slowly decline until 2100. Global SF6 emissions from electrical equipment are projected to rise with the same speed from 2030 to 2070, due to further bank growth and significant amounts of SF6 that have to be decommissioned. Figure 13 shows that emissions under the Addi-tional Action scenario also increase slightly after 2030, but will be only slightly above 2005 levels, despite the SF6 bank that will still be growing until 2070.

EDITION 1.1, 01.07.2010 56
0
1,000
2,000
3,000
4,000
5,000
6,000
2030 2035 2040 2045 2050 2055 2060 2065 2070 2075 2080 2085 2090 2095 2100
[t SF
6]
Additional Actions Scenario BAU Scenario
Figure 23: Global SF6 emiss ions f rom electr ica l equipment 2030-2100
Emiss ions dur ing manufactur ing 2030-2100
Figure 14 shows the emission development from manufacturing between 2030 and 2100. When applying annual emission factors for manufacturing to the global SF6 consumption, as shown in Figure 3, the annual emissions from manufacturing de-cline slightly until 2100 under the BAU scenario due to decreasing amounts of an-nual SF6 consumption (see chapter 4.2.2). If BAT standards for manufacturing can be achieved until 2030, emissions under the additional action scenario will remain stable at those 2030 levels until 2100. Under the Additional Action Scenario, manufacturing emissions contribute to approxi-mately 8 % of the global total annual SF6 emissions from electrical equipment.

EDITION 1.1, 01.07.2010 57
0100200300400500600700800900
2030
2035
2040
2045
2050
2055
2060
2065
2070
2075
2080
2085
2090
2095
2100
[t SF
6]
Additional Actions Scenario for manufacture BAU Scenario for manufacture
Figure 24: Global annual SF6 emiss ions f rom manufacture 2030-2100
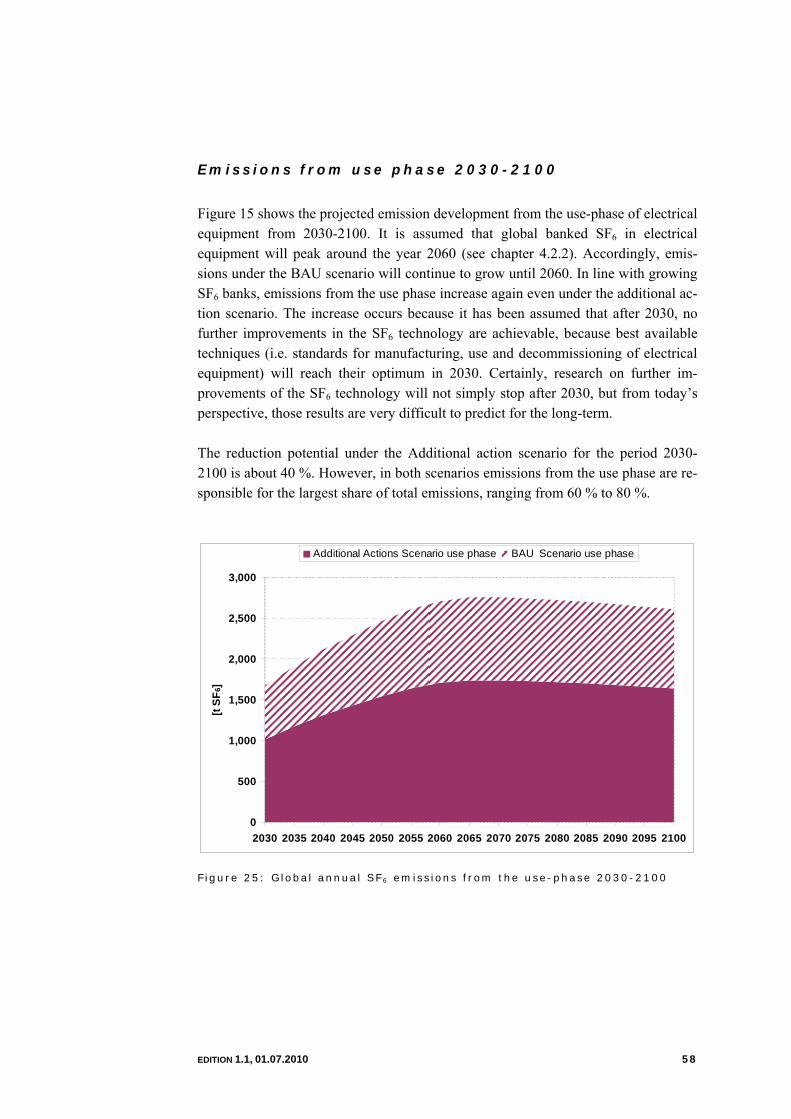
EDITION 1.1, 01.07.2010 58
Emiss ions f rom use phase 2030-2100
Figure 15 shows the projected emission development from the use-phase of electrical equipment from 2030-2100. It is assumed that global banked SF6 in electrical equipment will peak around the year 2060 (see chapter 4.2.2). Accordingly, emis-sions under the BAU scenario will continue to grow until 2060. In line with growing SF6 banks, emissions from the use phase increase again even under the additional ac-tion scenario. The increase occurs because it has been assumed that after 2030, no further improvements in the SF6 technology are achievable, because best available techniques (i.e. standards for manufacturing, use and decommissioning of electrical equipment) will reach their optimum in 2030. Certainly, research on further im-provements of the SF6 technology will not simply stop after 2030, but from today’s perspective, those results are very difficult to predict for the long-term. The reduction potential under the Additional action scenario for the period 2030-2100 is about 40 %. However, in both scenarios emissions from the use phase are re-sponsible for the largest share of total emissions, ranging from 60 % to 80 %.
0
500
1,000
1,500
2,000
2,500
3,000
2030 2035 2040 2045 2050 2055 2060 2065 2070 2075 2080 2085 2090 2095 2100
[t SF
6]
Additional Actions Scenario use phase BAU Scenario use phase
Figure 25: Global annual SF6 emiss ions f rom the use-phase 2030-2100

EDITION 1.1, 01.07.2010 59
Emiss ions f rom decommiss ion ing 2030-2100
Decommissioning of electrical equipment – which is then replaced by new equip-ment - is becoming increasingly relevant after 2045. Globally, the steadily increasing amounts of SF6 that have been installed from 2005 onwards are then disposed of. This leads to a significant increase in emissions under the BAU scenario, as shown in Figure 16. Accordingly, emissions under the BAU scenario in 2100 will be 5 times higher than in 2030 if all equipment reaches the proper recycling facilities at end of life. A rather small increase of approximately 50t SF6 in the period after 2045 can also be noticed in the additional action scenario. However, if the recycling industry reaches the BAT target of a 0.9 % emission rate from decommissioning, these emissions will continue to play a minor role also on the long-term, always assuming that 100 % are treated properly at end of life.
0
500
1.000
1.500
2.000
2.500
3.000
3.500
4.000
2030 2035 2040 2045 2050 2055 2060 2065 2070 2075 2080 2085 2090 2095 2100
[t SF
6]
Additional Actions Sc. decommissioning BAU Scenario decommissioning
Figure 26: Global annual SF6 emiss ions f rom decommiss ioning 2030-2100
(recyc l ing quota 100 %)
Figure 27 shows that emissions in both scenarios increase significantly if only 80 % of the disposed equipment reaches proper recycling facilities at end of life. Emis-sions under the BAU scenario only increase by 150 %. Emissions under the addi-tional action scenario will dramatically increase and lay more than 20 times above the projected emissions in the scenario where all equipment is properly recycled at end of life.

EDITION 1.1, 01.07.2010 60
0
500
1,000
1,500
2,000
2,500
3,000
3,500
4,000
2030 2035 2040 2045 2050 2055 2060 2065 2070 2075 2080 2085 2090 2095 2100
[t SF
6]
Additional Actions Sc. decommissioning BAU Scenario decommissioning
Figure 27: Global annual SF6 emiss ions f rom decommiss ion ing 2030-2100
(recyc l ing quota 80 %)