Embed Size (px)
Citation preview
Update on EDIC: Epidemiology of Diabetes Interventions and
Complications Study
Charlotte McDonald, MD, MSc, FRCPC
Associate Professor,
Division of Endocrinology,
Department of Medicine,
UWO
DCCT/EDIC 30th Anniversary Symposium Contributions and Progress
DCCT/EDIC Research Group
June 22, 2013
DCCT/EDIC
AcknowledgementsEDIC Executive Committee • Patricia Cleary, MS • John Lachin, ScD• Catherine Cowie, PhD• David Nathan, MD• Saul Genuth, MD• Rose Gubitosi-Klug, MD, PhD • Bernard Zinman, MD• Meg Bayless, BSN, RN, CDE,
CCRC• Gayle Lorenzi, RN, CDE
30th Anniversary Slides• David M. Nathan, M.D. Co-Chair • Retinopathy: Lloyd Paul Aiello, MD, PhD
PI, Joslin Diabetes Center• Nephropathy: Ian H. de Boer, MD
Investigator, University of Washington• Neuropathy: Catherine Martin, MS, RN,
BC-ADM, CDE Study Coordinator, University of Michigan
• Cardiology: John M. Lachin, Sc.D. Principal Investigator DCCT/EDIC Data Coordinating Center,The Biostatistics Center, The George Washington University
• Rose A. Gubitosi-Klug, MD, PhD Principal Investigator DCCT/EDIC Clinical Coordinating Center
EDIC TEAM: UWOJohn Dupre, MD, FRCP, FRCPC, FACP
Principal Investigator DCCT/EDIC
University of Western Ontario
Judy Harth, RN
and
Marsha Driscoll, RN:
EDIC Study Coordinators UWO
Debra Nielsen Robarts Research Institute
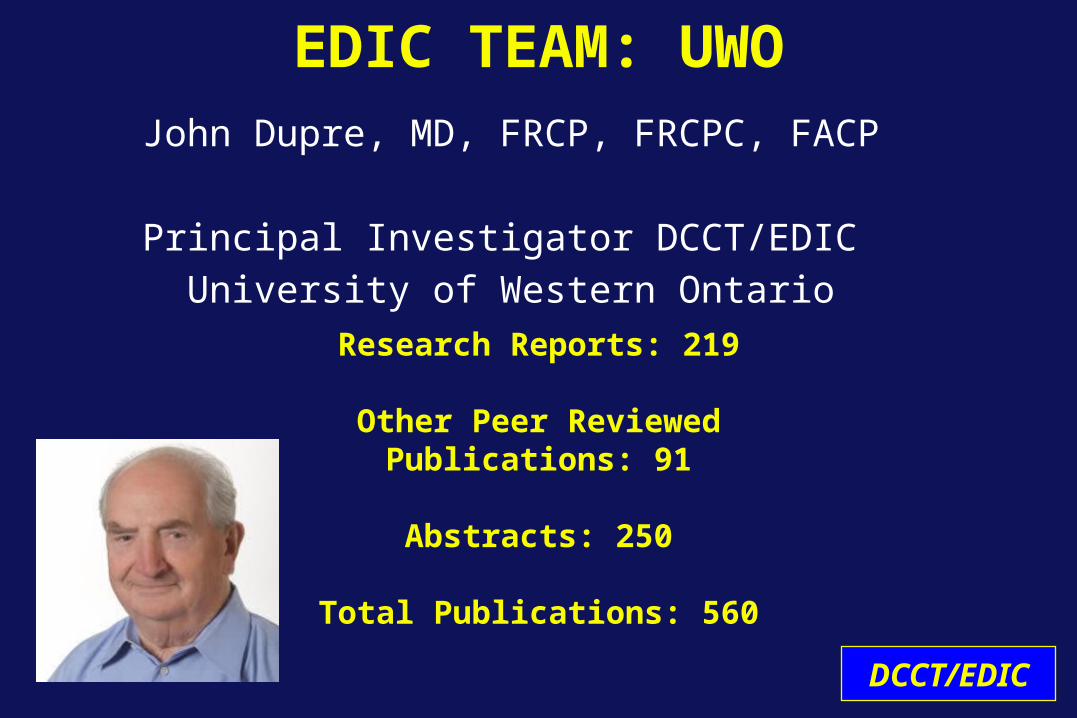
EDIC TEAM: UWO
DCCT/EDIC
John Dupre, MD, FRCP, FRCPC, FACP
Principal Investigator DCCT/EDIC
University of Western Ontario
Research Reports: 219
Other Peer Reviewed Publications: 91
Abstracts: 250
Total Publications: 560
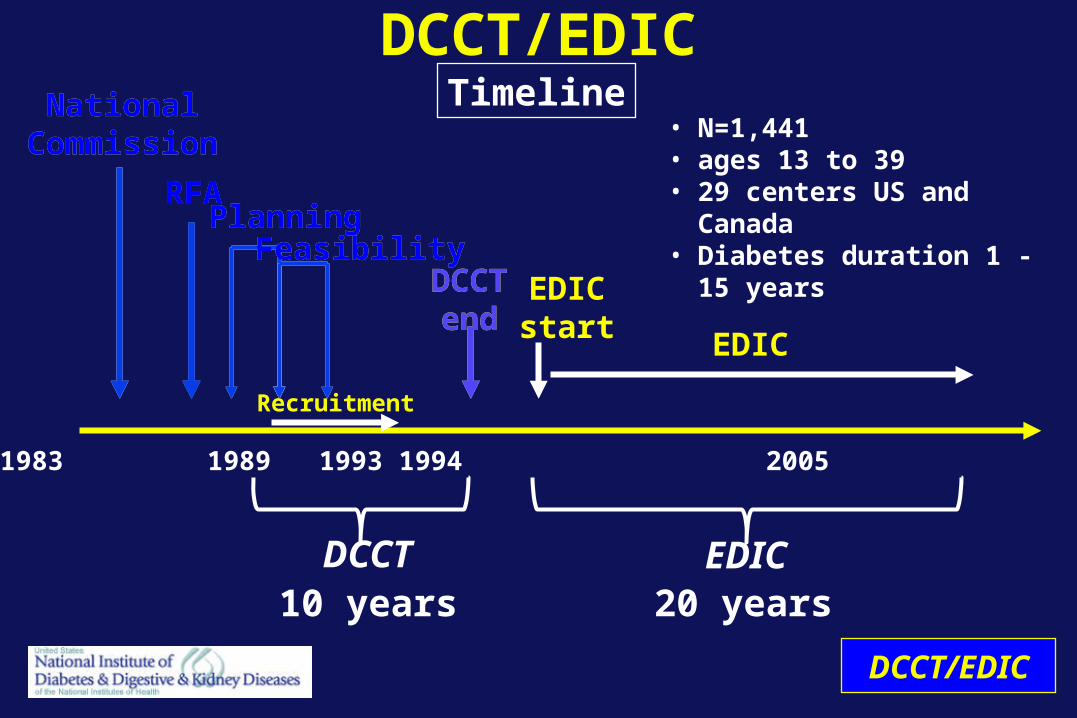
DCCT/EDICTimeline
1978 1982 1983 1989 1993 1994 2005 2013 2016
DCCT
NationalCommission
RFA
NationalCommission
PlanningRFA
FeasibilityPlanning
RFA
Recruitment
FeasibilityDCCTend
EDICstart
DCCTend
10 years
EDIC
EDIC20 years
DCCT/EDIC
• N=1,441• ages 13 to 39 • 29 centers US and Canada • Diabetes duration 1 - 15
years
lll
l
ll
l
ll
ll
l
l
ll
l
l
l
l
lll
llll ll
l
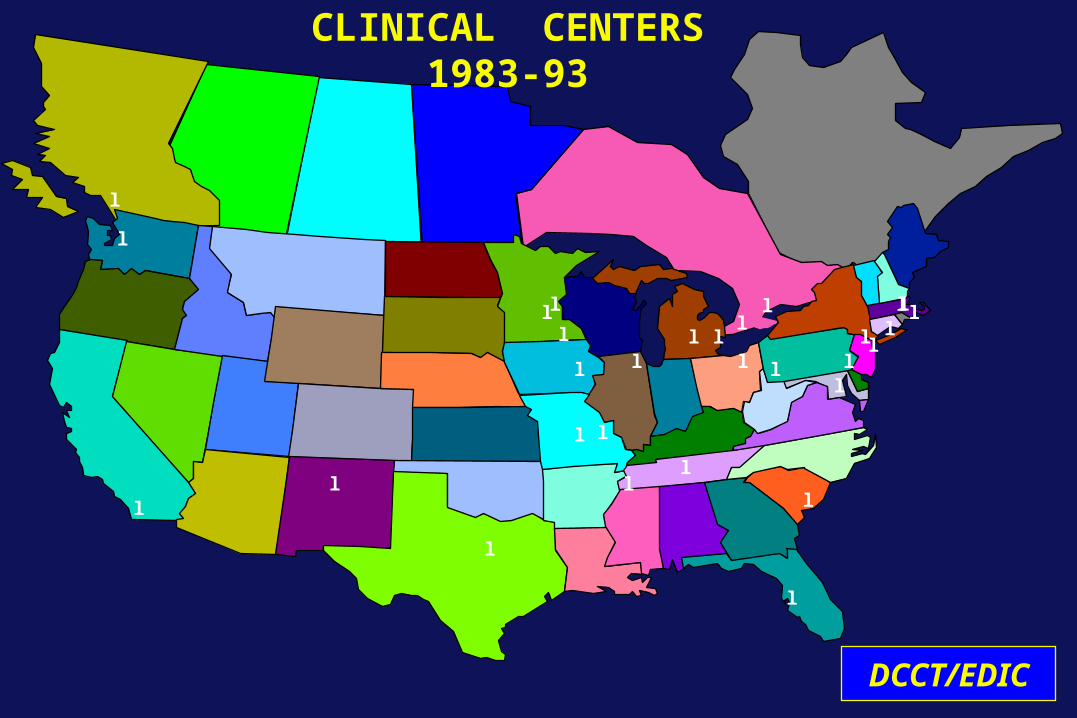
CLINICAL CENTERS1983-93
l
DCCT/EDIC
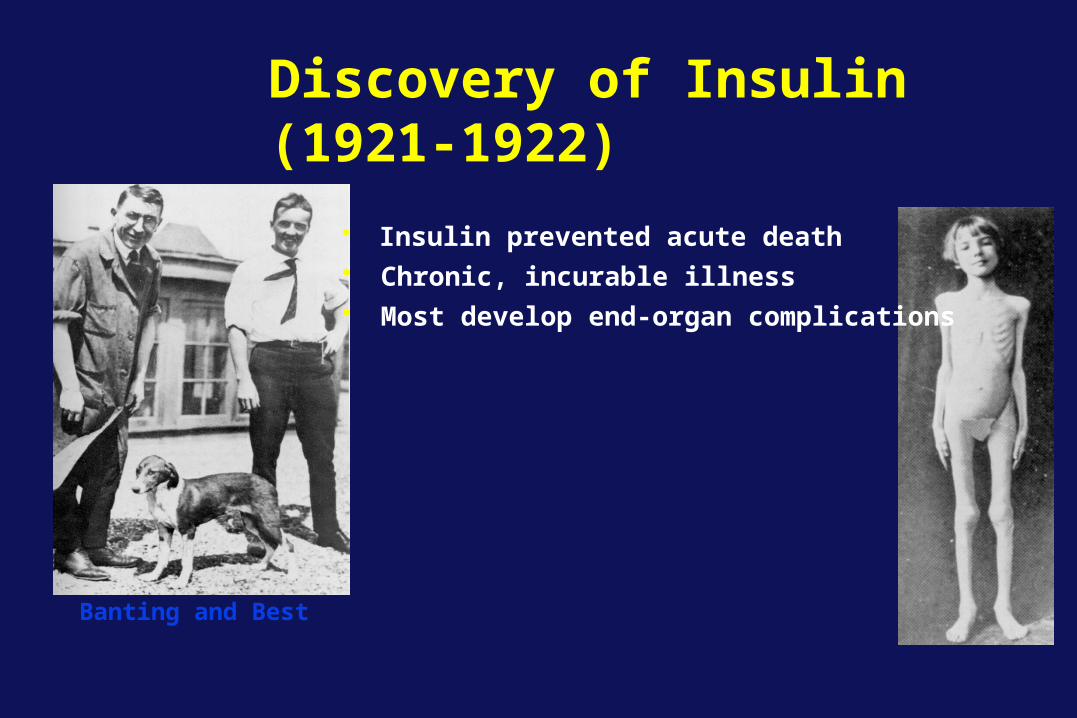
Discovery of Insulin(1921-1922)
Banting and Best
• Insulin prevented acute death• Chronic, incurable illness• Most develop end-organ complications
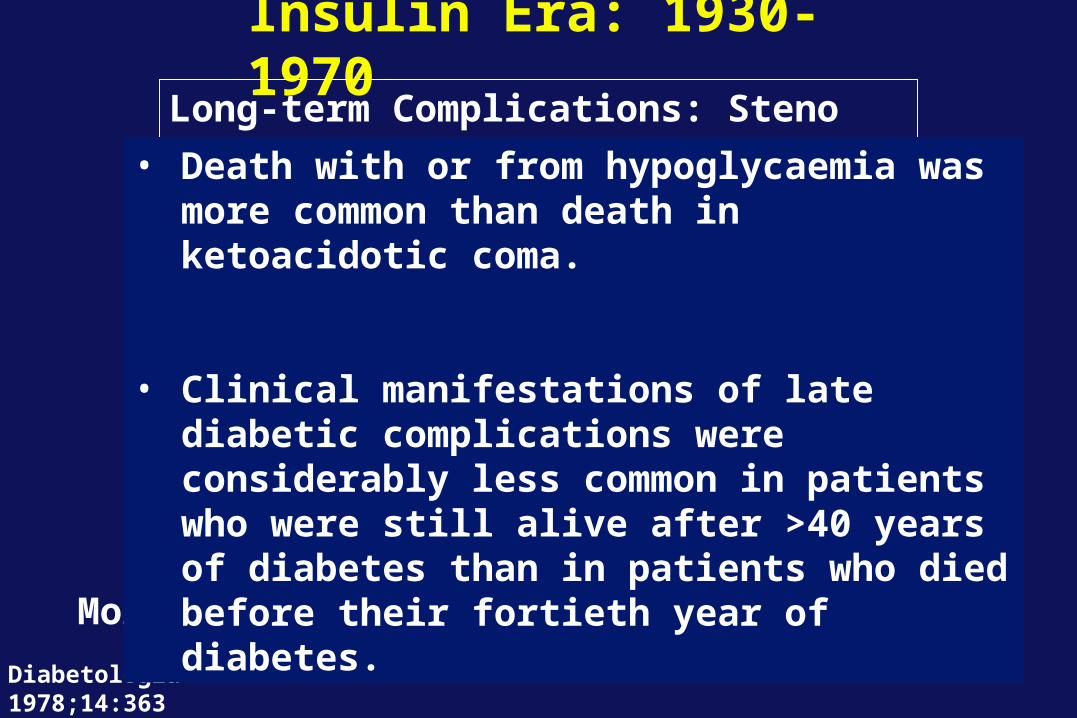
Insulin Era: 1930-1970
Visual impairment (legal) 14%
Blindness (total) 16%
Renal failure 22%
Stroke 10%
Amputation 12%
Myocardial infarction 21%
Mortality increased 2-6 fold compared withage-matched non-diabetic population
Long-term Complications: Steno Hospital
31%
Diabetologia1978;14:363
• Death with or from hypoglycaemia was more common than death in ketoacidotic coma.
• Clinical manifestations of late diabetic complications were considerably less common in patients who were still alive after >40 years of diabetes than in patients who died before their fortieth year of diabetes.

DCCT: Major Study Questions
• Primary prevention: Will intensive therapy prevent the development of retinopathy
• Secondary Intervention: Will intensive therapy reduce the progression of retinopathy
compared with conventional therapy?

Study Cohorts
Primary prevention (n= 726): 1-5 years duration No retinopathy or microalbuminuria
Secondary intervention (n= 715): 1-15 years duration> 1 microaneurysm, < severe NPDR
< 200 mg albumin excretion/24 h
Age 13-40
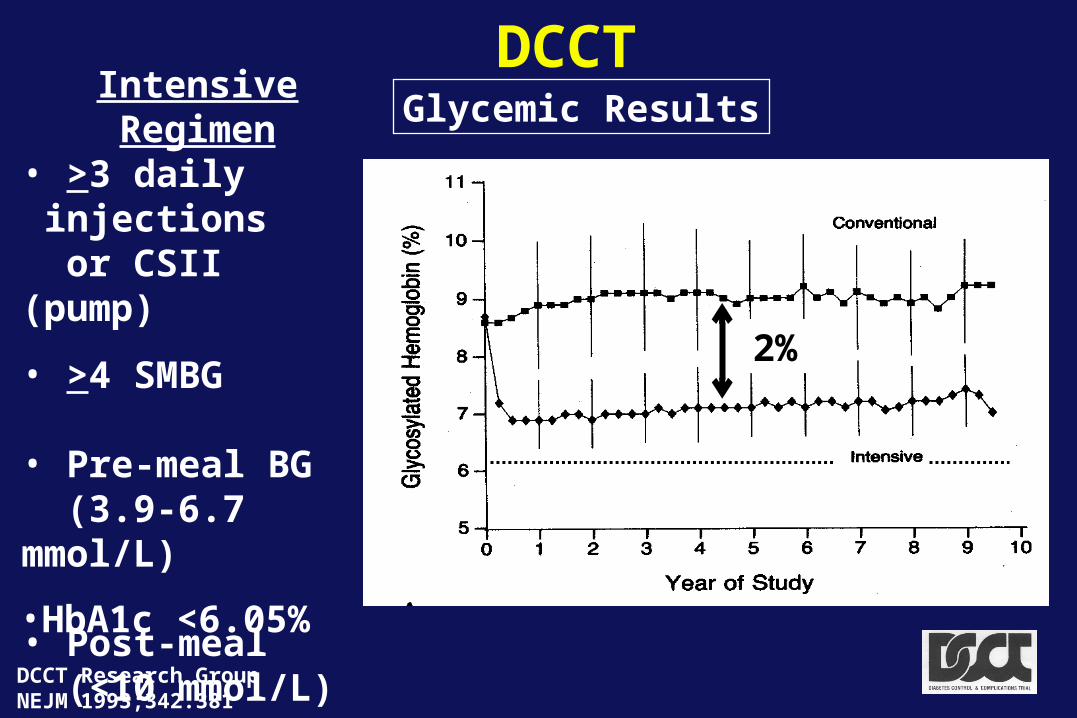
DCCTGlycemic Results
Intensive Regimen• >3 daily
injections or CSII (pump)
• >4 SMBG
• Pre-meal BG (3.9-6.7 mmol/L)
• Post-meal (<10 mmol/L)
DCCT Research GroupNEJM 1993;342:381
2%
• HbA1c <6.05%
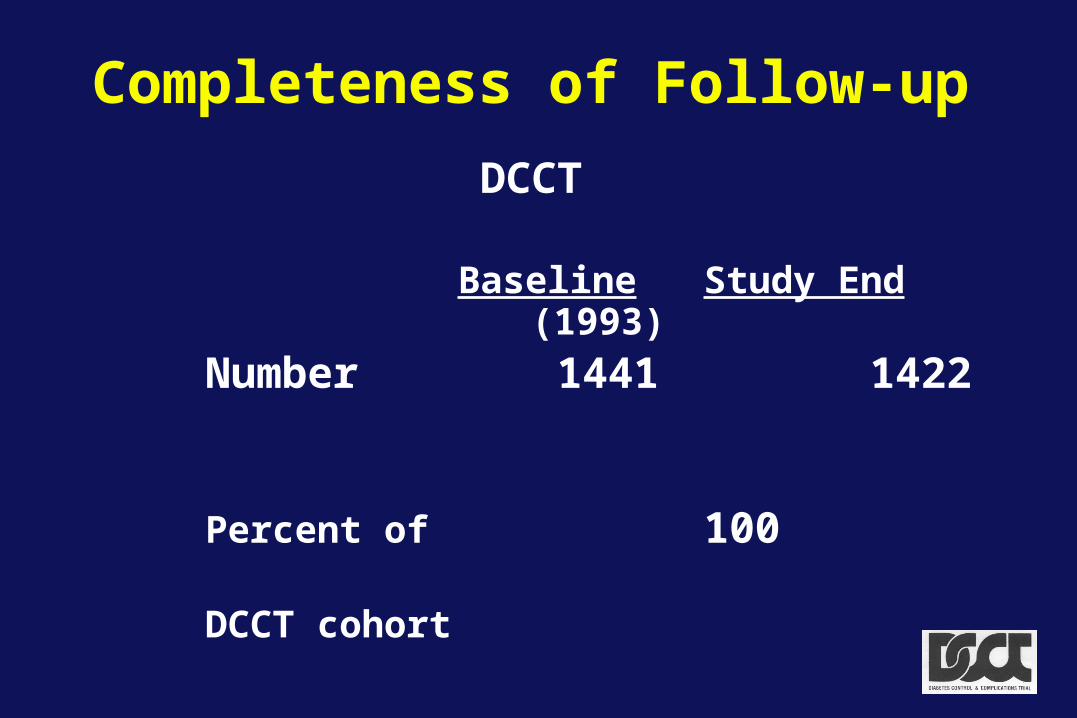
Completeness of Follow-up
DCCT Baseline Study End
(1993)
Number 1441 1422
Percent of 100 99 DCCT cohort
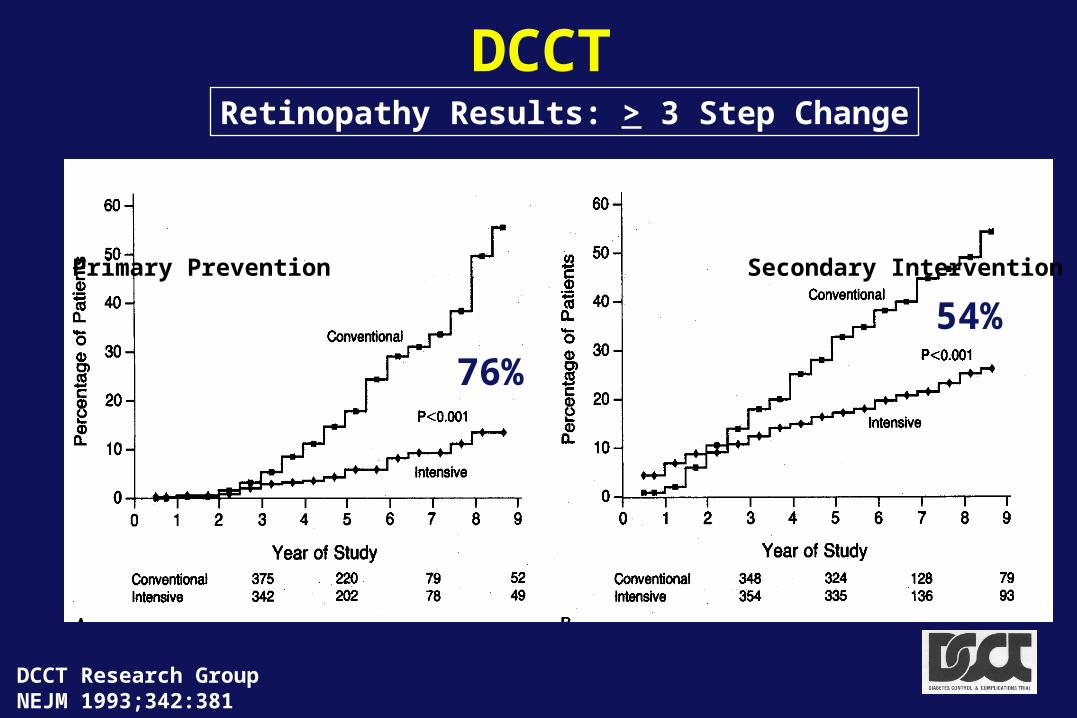
DCCTRetinopathy Results: > 3 Step Change
Primary Prevention Secondary Intervention
76%
54%
DCCT Research GroupNEJM 1993;342:381

Reduction in Complications: Intensive vs Conventional
DCCT Research GroupNEJM 1993;342:381
Series1
0 10 20 30 40 50 60 70 80
Percent Reduction
Retinopathy
Nephropathy
Neuropathy
Development
3-step progression
Severe NPDR
Microalbuminuria
Albuminuria
Clinical
Summary
Achieved mean HbA1c substantially (2%) lower than conventional therapy, albeit not in the non-diabetic range, with consistent major beneficial effects on early microvascular complications
Intensive Therapy
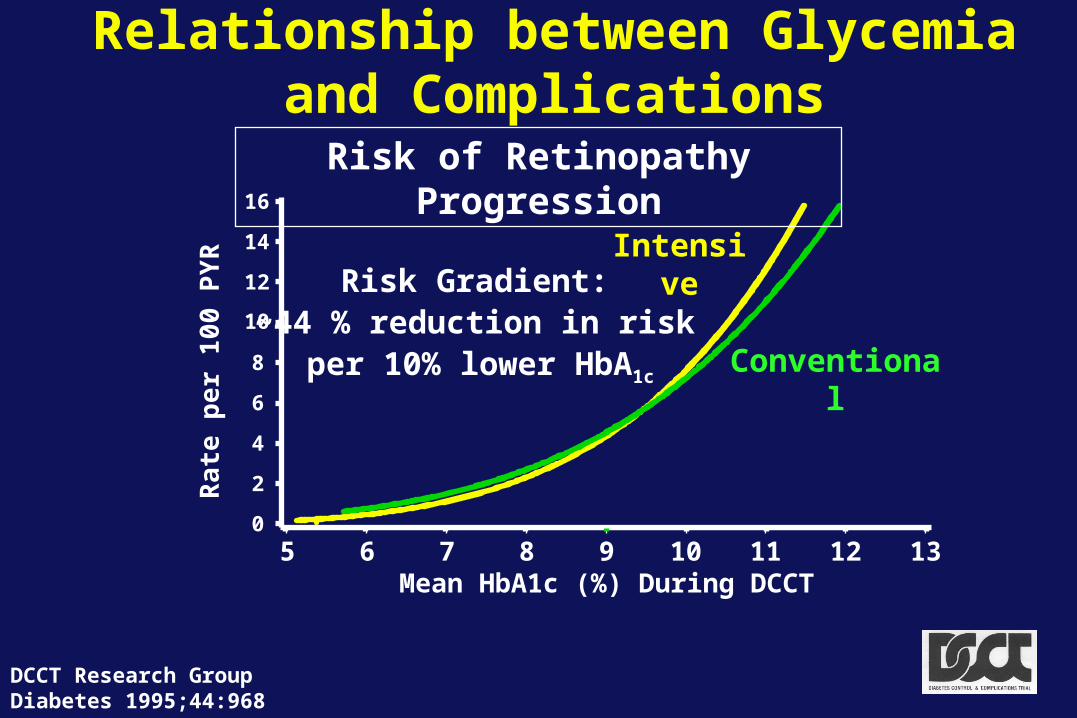
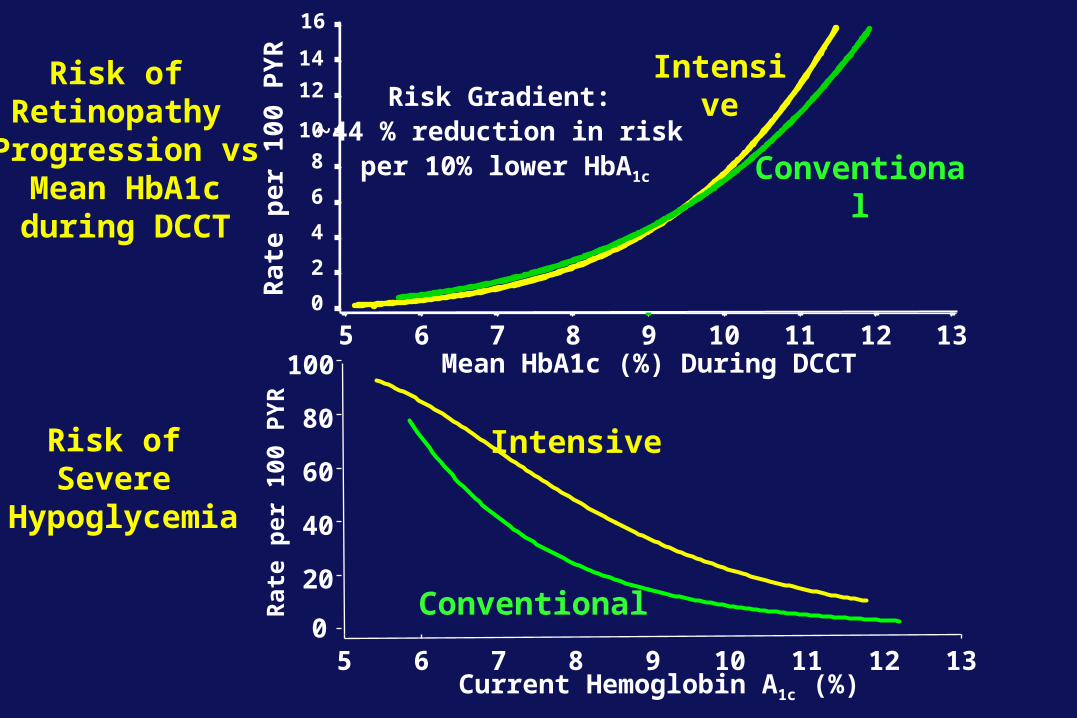
Relationship between Glycemiaand Complications
DCCT Research GroupDiabetes 1995;44:968
0
2
4
6
8
10
12
14
16
Mean HbA1c (%) During DCCT5 6 7 8 9 10 11 12 13
IntensiveR
ate
pe
r 1
00 P
YR Risk Gradient:
~44 % reduction in riskper 10% lower HbA1c
Conventional
Risk of Retinopathy Progression
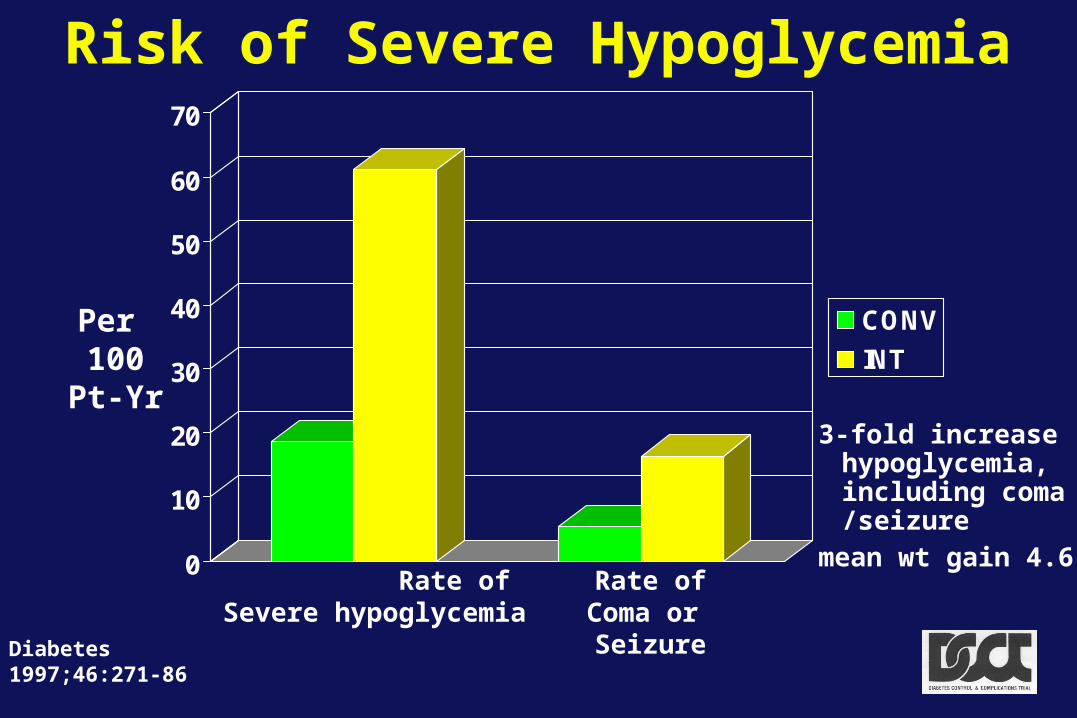
Risk of Severe Hypoglycemia
0
10
20
30
40
50
60
70
CONV
INT
Rate of Severe hypoglycemia
Rate ofComa or Seizure
RR=3.3
RR=3.0
Diabetes1997;46:271-86
Per 100
Pt-Yr3-fold increase
hypoglycemia, including coma /seizure
mean wt gain 4.6 kg
0
2
4
6
8
10
12
14
16
Mean HbA1c (%) During DCCT5 6 7 8 9 10 11 12 13
Intensive
Ra
te p
er
100
PY
R
Risk Gradient:~44 % reduction in risk
per 10% lower HbA1c Conventional
Risk of Retinopathy
Progression vs Mean HbA1c during DCCT
Current Hemoglobin A1c (%)
Rat
e p
er 1
00 P
YR
5 6 7 8 9 10 11 12 130
20
40
60
80
100
Intensive
Conventional
Risk of Severe
Hypoglycemia
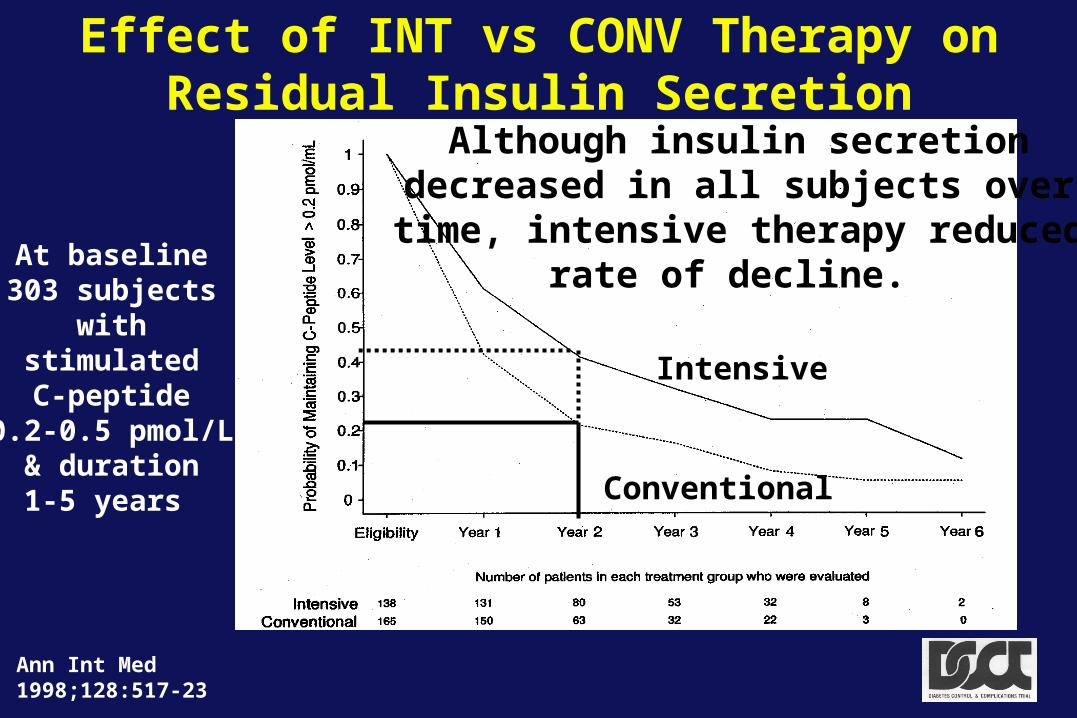
Effect of INT vs CONV Therapy on Residual Insulin Secretion
At baseline303 subjects
withstimulatedC-peptide
0.2-0.5 pmol/L& duration1-5 years
Ann Int Med 1998;128:517-23
Intensive
Conventional
Although insulin secretiondecreased in all subjects over
time, intensive therapy reducedrate of decline.
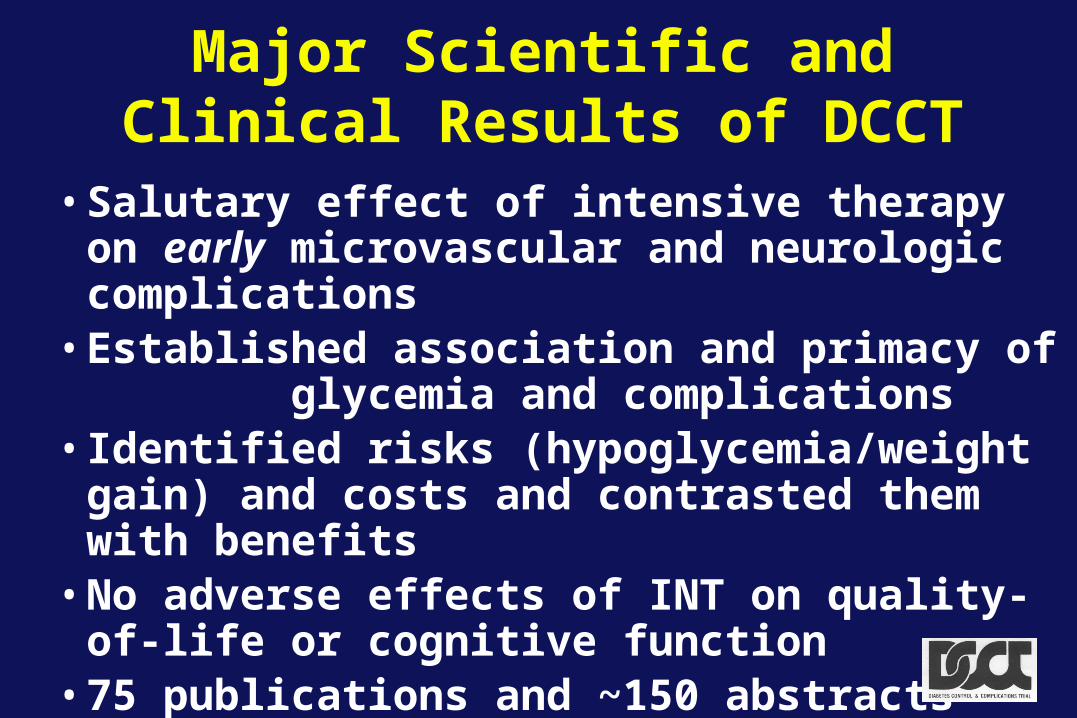
Major Scientific and Clinical Results of DCCT
• Salutary effect of intensive therapy on early microvascular and neurologic complications
• Established association and primacy of glycemia and complications
• Identified risks (hypoglycemia/weight gain) and costs and contrasted them with benefits
• No adverse effects of INT on quality-of-life or cognitive function
• 75 publications and ~150 abstracts
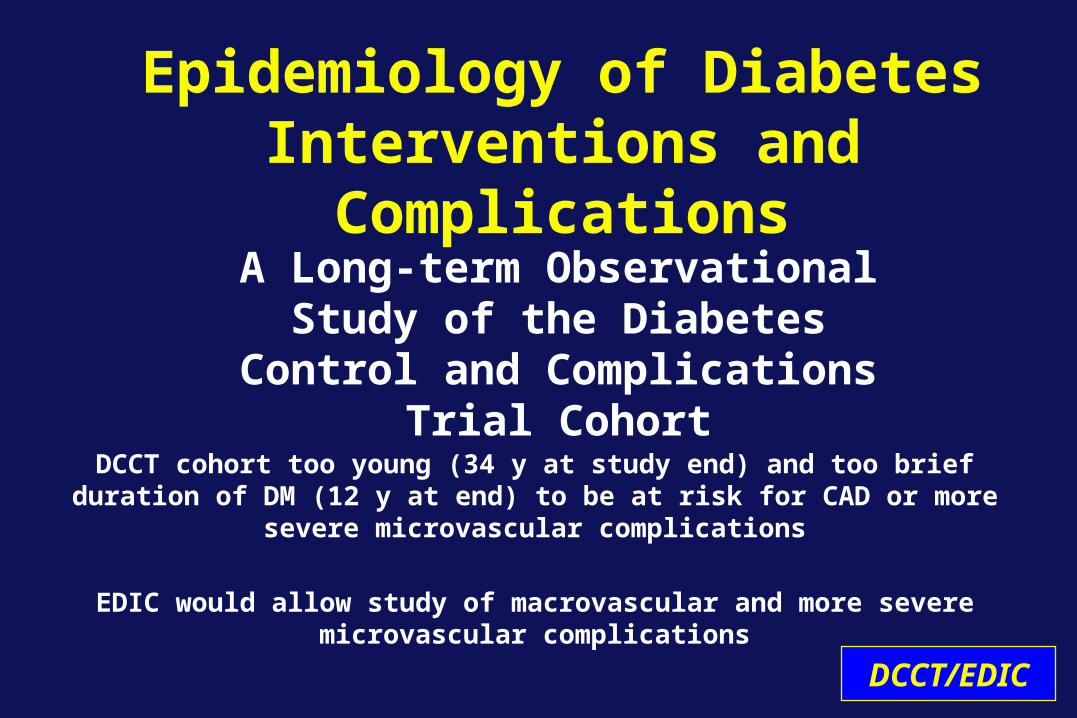
Epidemiology of Diabetes Interventions and Complications
A Long-term Observational Study of the Diabetes Control and
Complications Trial Cohort
DCCT/EDIC
DCCT cohort too young (34 y at study end) and too brief duration of DM (12 y at end) to be at risk for CAD or more severe microvascular complications
EDIC would allow study of macrovascular and more severe microvascular complications
Major Objective
To examine the longer-term effects of Intensive vs Conventional therapy implemented during the DCCT on the development and progression of more advanced stages of retinopathy, nephropathy, and neuropathy, and of CVD.
EDIC Research GroupDiabetes Care 1999;22:99 DCCT/EDIC
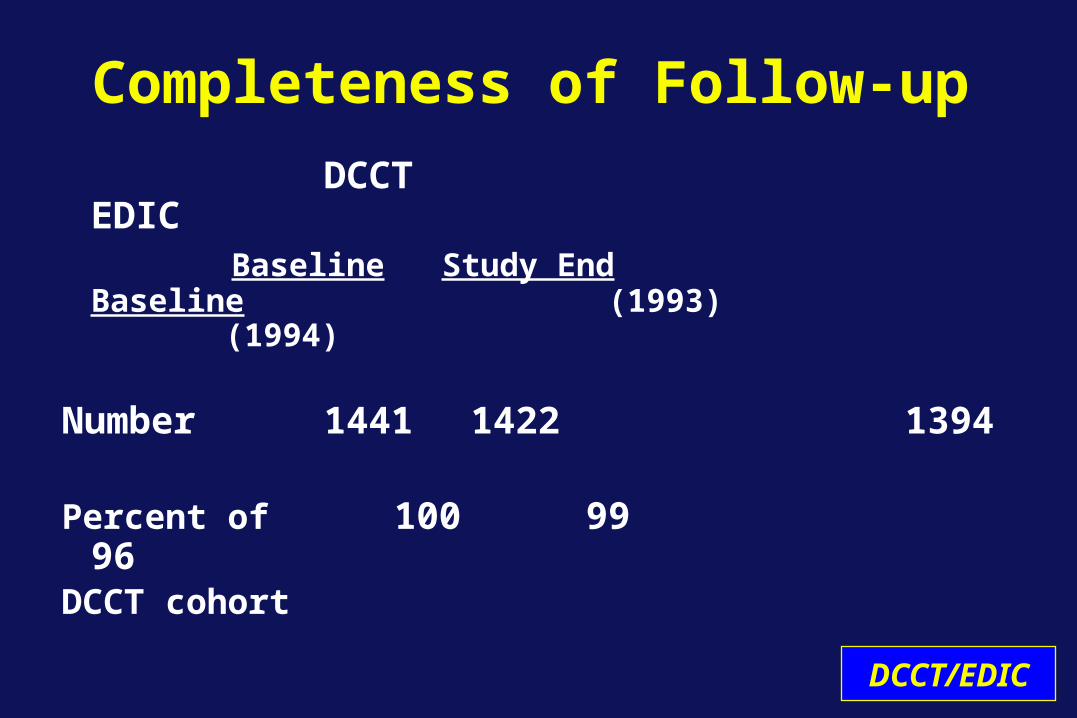
Completeness of Follow-up
DCCT EDIC Baseline Study End Baseline
(1993) (1994)
Number 1441 1422 1394
Percent of 100 99 96 DCCT cohort
DCCT/EDIC

Metabolic Results: Median HbA1c
DCCT Intervention
1 2 3 4 5 6 7 8 9 10 11 12 13 14 15 16 17 18
EDIC
IntensiveEDIC mean 7.9%
* * * * * P< 0.05
DCCT
DCCT/EDIC
Training
1993-1994
At the end of the DCCT, allparticipants were offered
training in intensive therapy
and
The clinical care of the DCCT participants was returned to
their own health care providers
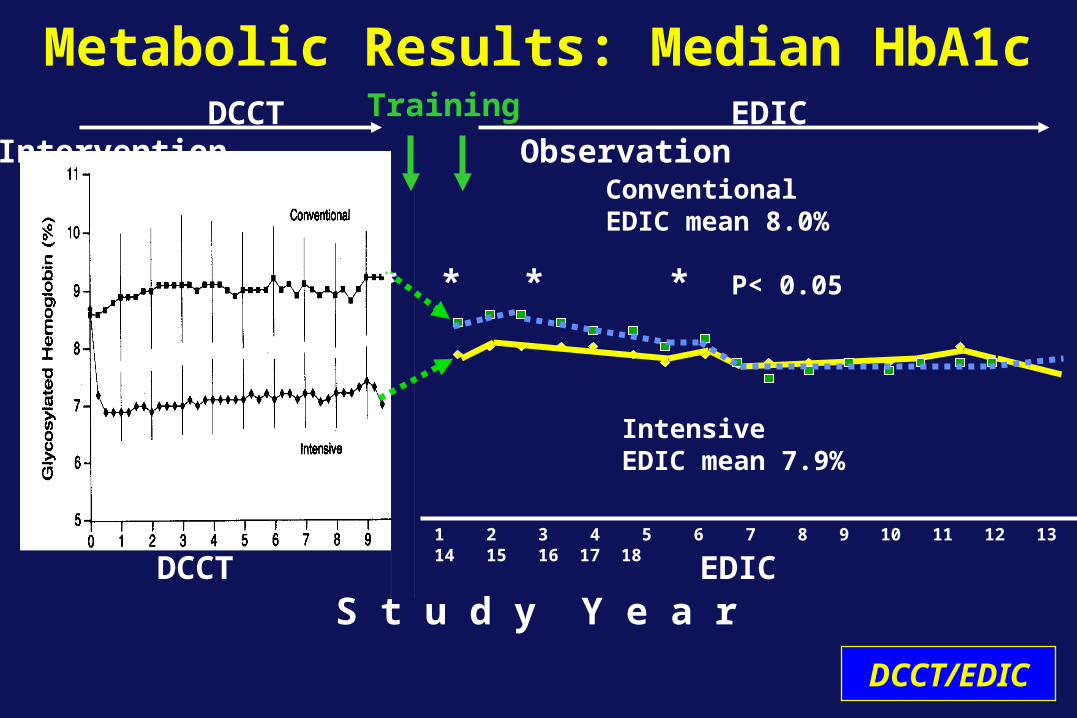
Metabolic Results: Median HbA1c
DCCT Intervention
S t u d y Y e a r
1 2 3 4 5 6 7 8 9 10 11 12 13 14 15 16 17 18
EDIC Observation
EDIC
ConventionalEDIC mean 8.0%
IntensiveEDIC mean 7.9%
Training
* * * * * P< 0.05
DCCT
DCCT/EDIC
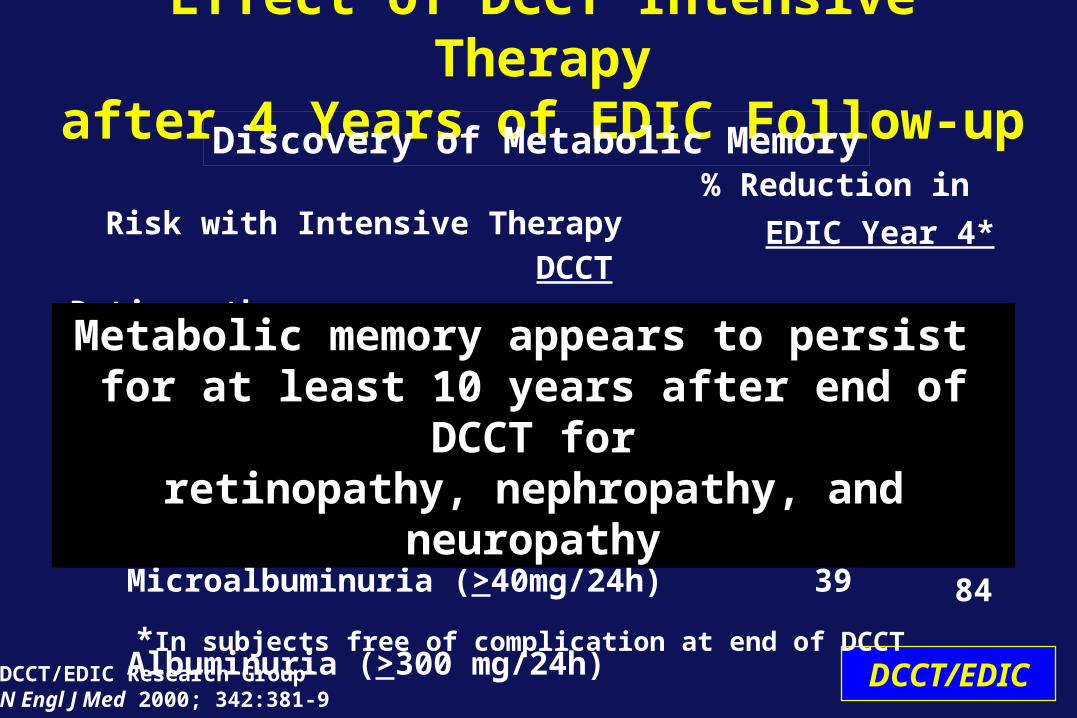
% Reduction in Risk with Intensive Therapy
DCCT
Retinopathy
3-step worsening 52
Proliferative 47
Macular edema 26
Laser Therapy 56
Nephropathy
Microalbuminuria (>40mg/24h) 39
Albuminuria (>300 mg/24h) 54
Effect of DCCT Intensive Therapyafter 4 Years of EDIC Follow-up
DCCT/EDIC Research GroupN Engl J Med 2000; 342:381-9
DCCT/EDIC
Discovery of Metabolic Memory
EDIC Year 4*
63
55
73
62
53
84
*In subjects free of complication at end of DCCT
Metabolic memory appears to persist for at least 10 years after end of DCCT forretinopathy, nephropathy, and neuropathy
Conventional
Intensive
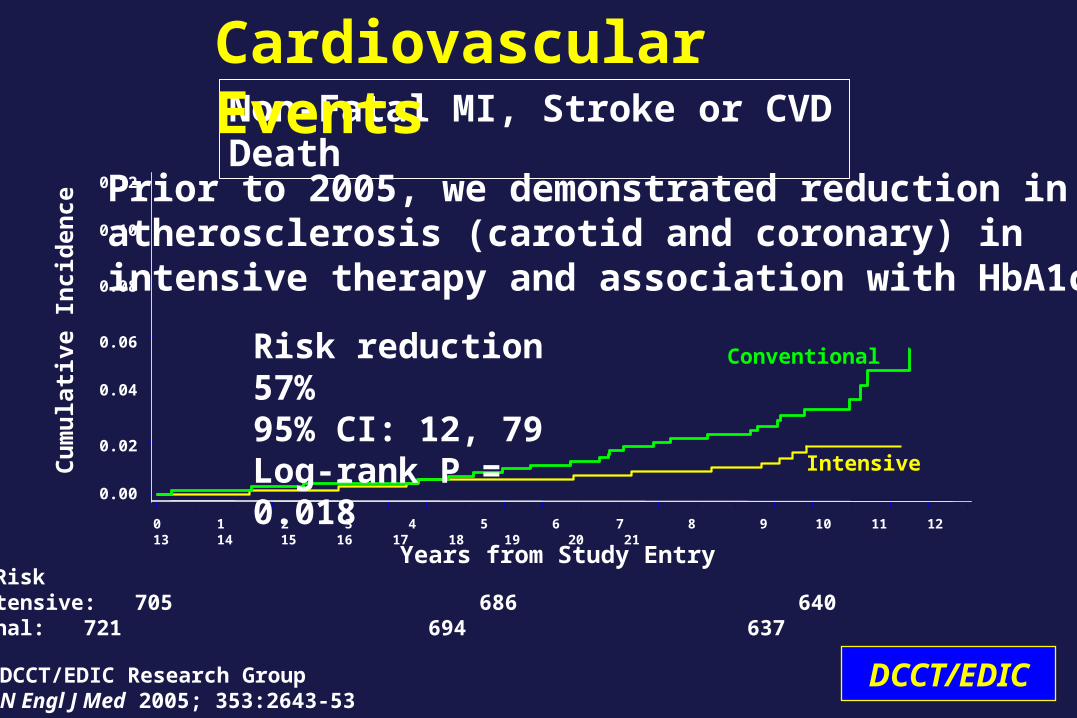
Non-Fatal MI, Stroke or CVD Death
Cardiovascular Events
0 1 2 3 4 5 6 7 8 9 10 11 12 13 14 15 16 17 18 19 20 21
Number at Risk Intensive: 705 686 640 118 Conventional: 721 694 637 96
Years from Study Entry
0.00
0.02
0.04
0.06
0.08
0.10
0.12
Cu
mu
lati
ve I
nci
den
ce
Risk reduction 57% 95% CI: 12, 79Log-rank P = 0.018
DCCT/EDIC Research GroupN Engl J Med 2005; 353:2643-53
Prior to 2005, we demonstrated reduction in atherosclerosis (carotid and coronary) in intensive therapy and association with HbA1c
DCCT/EDIC
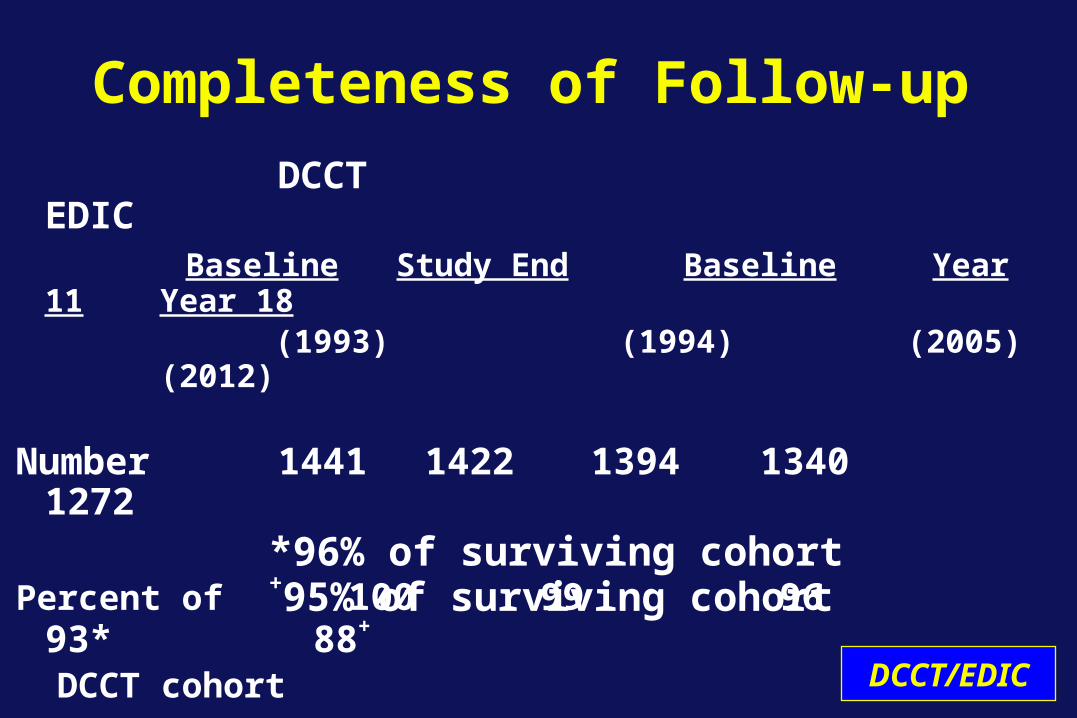
Completeness of Follow-up
DCCT EDIC Baseline Study End Baseline Year 11 Year
18 (1993) (1994) (2005)
(2012)
Number 1441 1422 1394 1340 1272
Percent of 100 99 96 93* 88+
DCCT cohortDCCT/EDIC
*96% of surviving cohort+95% of surviving cohort
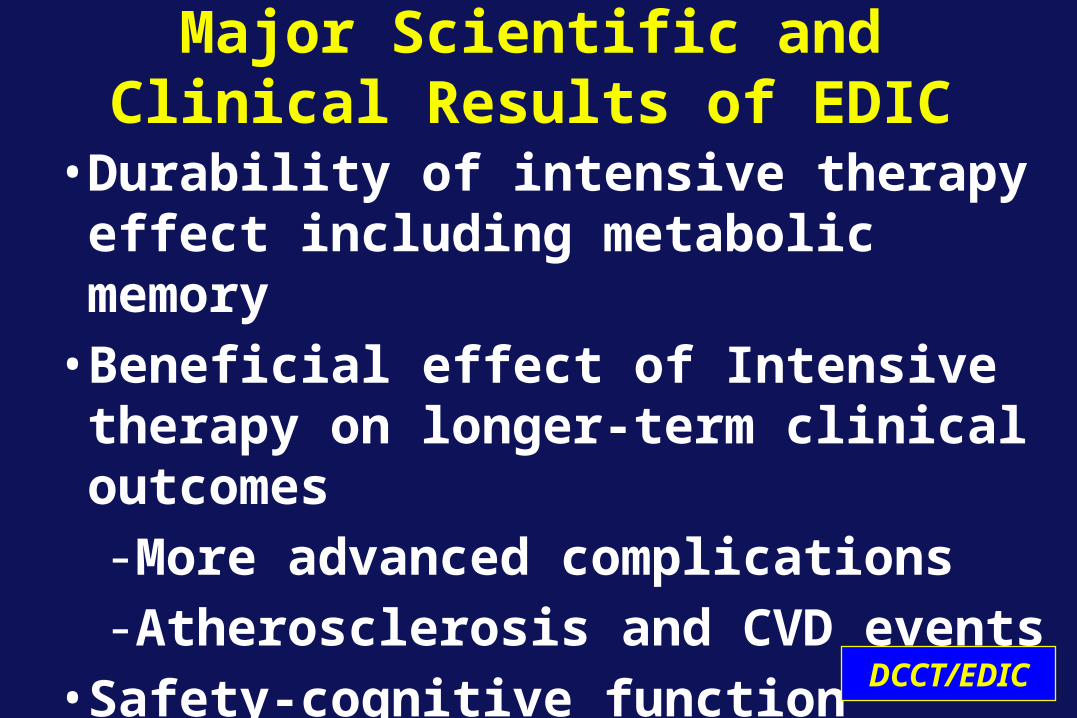
• Durability of intensive therapy effect including metabolic memory
• Beneficial effect of Intensive therapy on longer-term clinical outcomes- More advanced complications- Atherosclerosis and CVD events
• Safety-cognitive function unaffected despite hypoglycemia
Major Scientific and Clinical Results of EDIC
DCCT/EDIC

0
10
20
30
40
50
60
0 5 10 15 20 25 30 35
Diabetes Duration (Years)C
um
ula
tive
In
cid
ence
(%
)
0
10
20
30
40
50
60
1 3 5 7 9 11 13 15 17 19 21 23 25 27 29 31
Duration of Diabetes (Years)
Population-based
Proliferativeretinopathy
Nephropathy
CVD
DCCT Intensive Therapy
Long-term Outcomes of Type 1 DiabetesPittsburgh EDC
DCCT/EDICArch Int Med 2009;169:1307
20
44
19
812 8
30-year Cumulative Incidence~1980-2008 DCCT/EDIC
The frequencies of serious complications in patients with T1DM, especially when treated intensively, are lower than that reported historically.
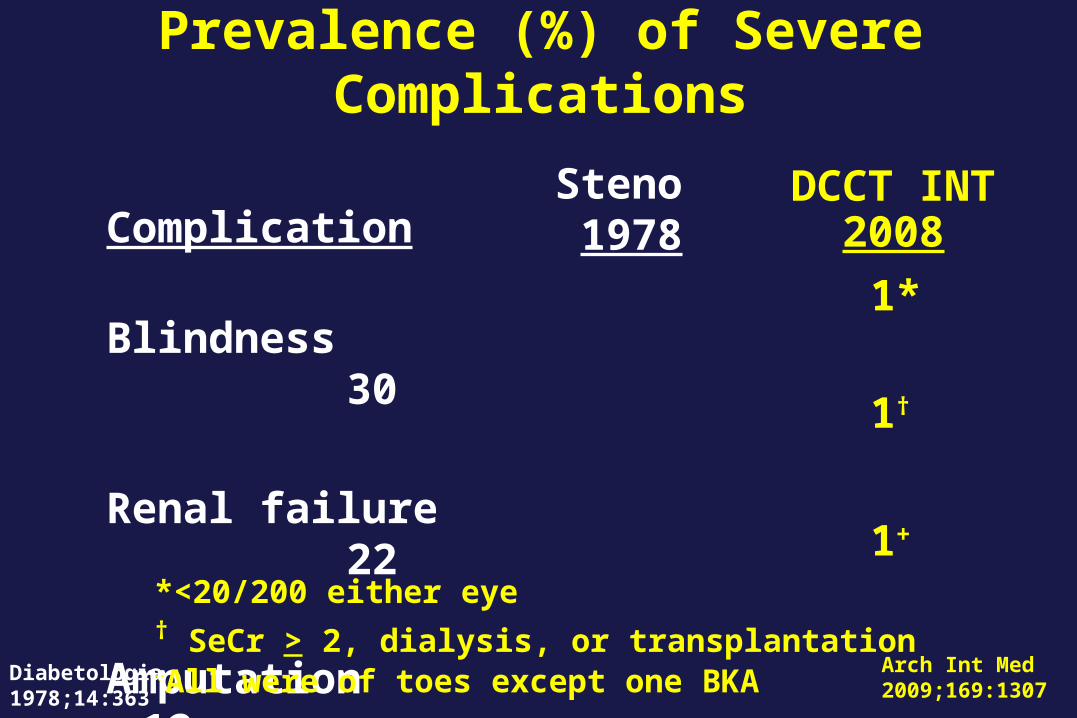
Prevalence (%) of Severe Complications
Complication
Blindness 30
Renal failure 22
Amputation 12
Steno 1978
Arch Int Med 2009;169:1307
*<20/200 either eye † SeCr > 2, dialysis, or transplantation +All were of toes except one BKA
DCCT INT2008
1*
1†
1+
Diabetologia1978;14:363
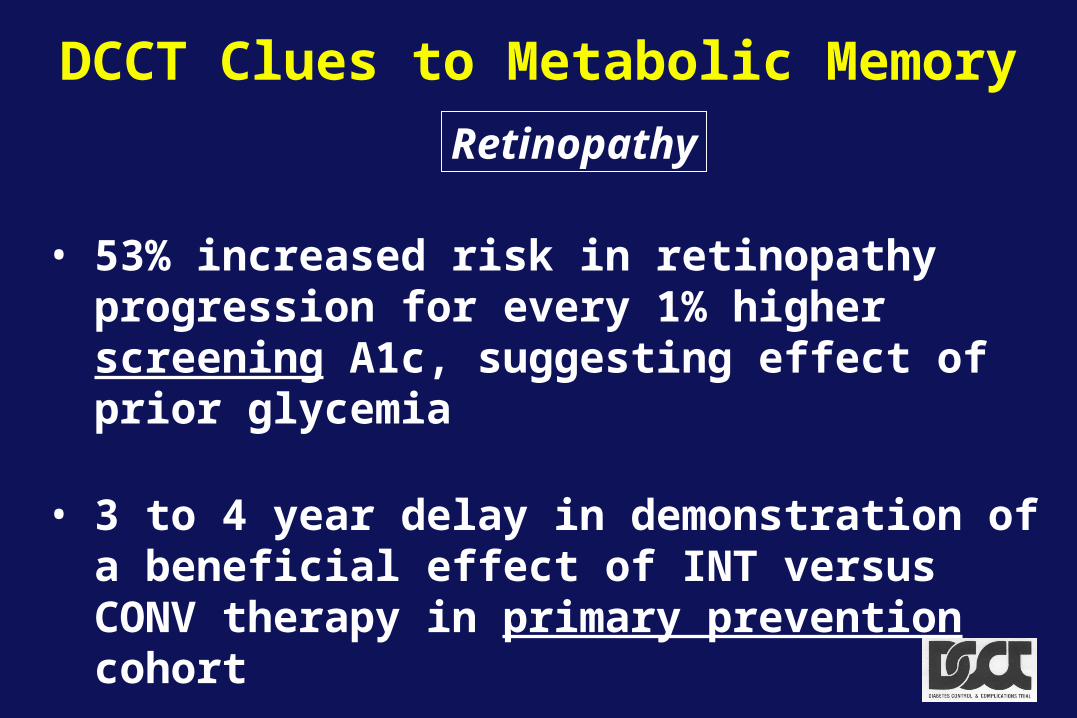
DCCT Clues to Metabolic Memory
• 53% increased risk in retinopathy progression for every 1% higher screening A1c, suggesting effect of prior glycemia
• 3 to 4 year delay in demonstration of a beneficial effect of INT versus CONV therapy in primary prevention cohort
Retinopathy
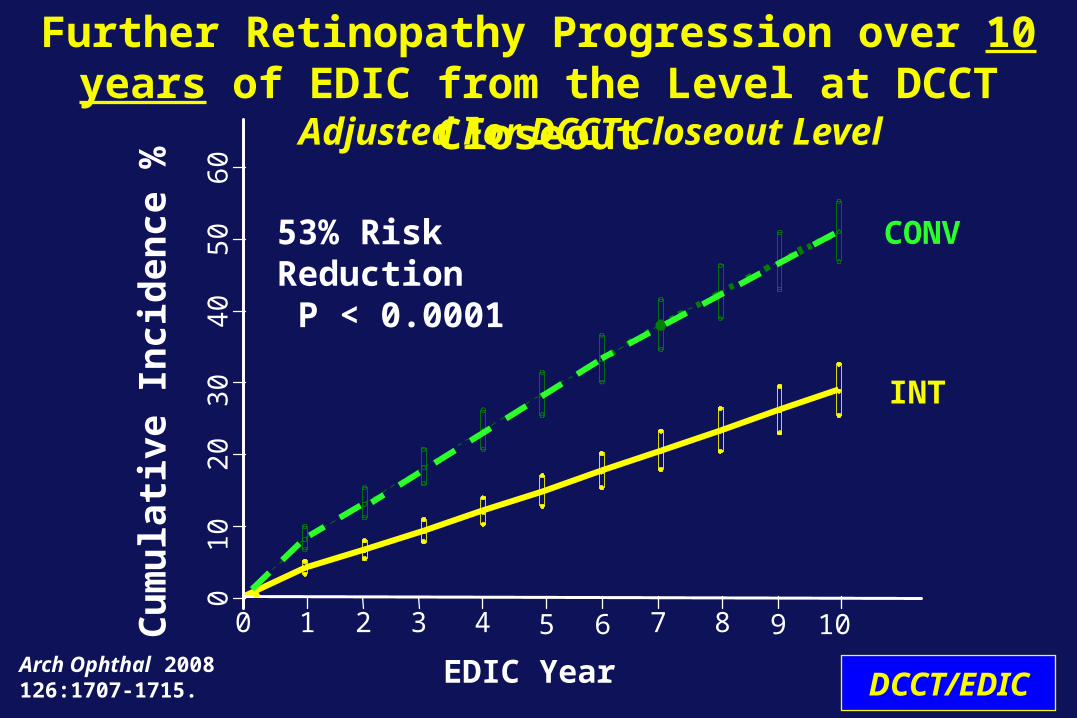
EDIC Year
Cu
mu
lati
ve In
cid
ence
%
Arch Ophthal 2008126:1707-1715.
Further Retinopathy Progression over 10 years of EDIC from the Level at DCCT Closeout
Adjusted For DCCT Closeout Level
CONV
INT
53% Risk Reduction P < 0.0001
0 1 7 82 3 4 5 6 9 10
010
2030
4050
60
DCCT/EDIC
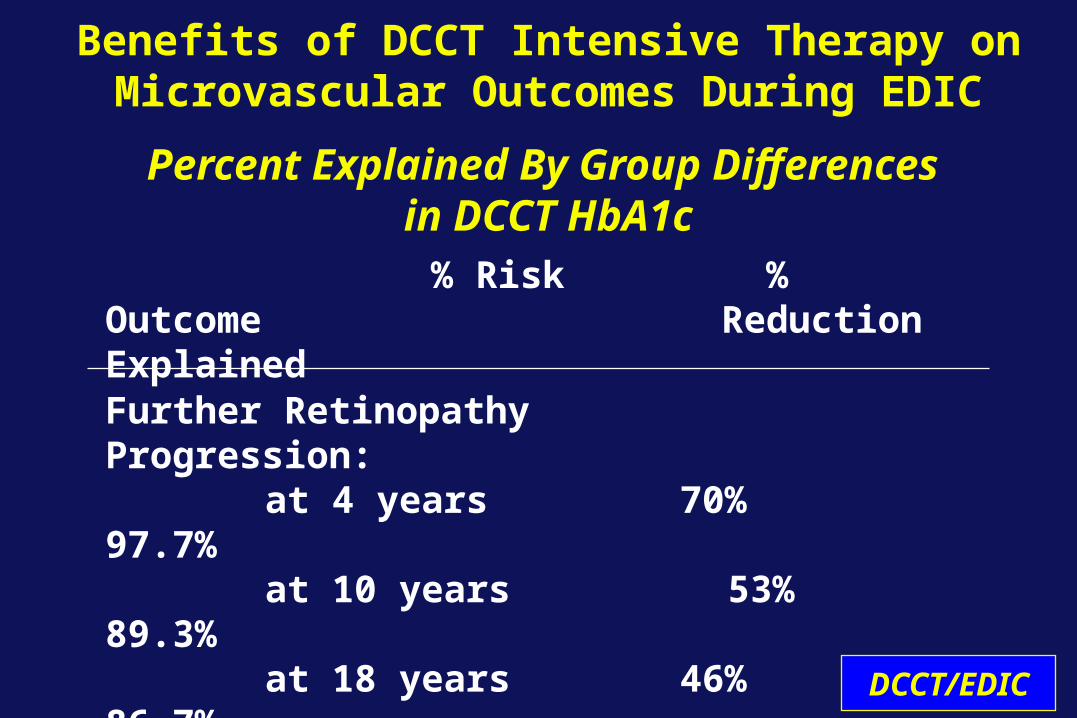
Benefits of DCCT Intensive Therapy onMicrovascular Outcomes During EDIC
Percent Explained By Group Differences in DCCT HbA1c
Further Retinopathy Progression:
at 4 years 70% 97.7% at 10 years 53% 89.3% at 18 years 46% 86.7%
% Risk % Outcome Reduction Explained
DCCT/EDIC
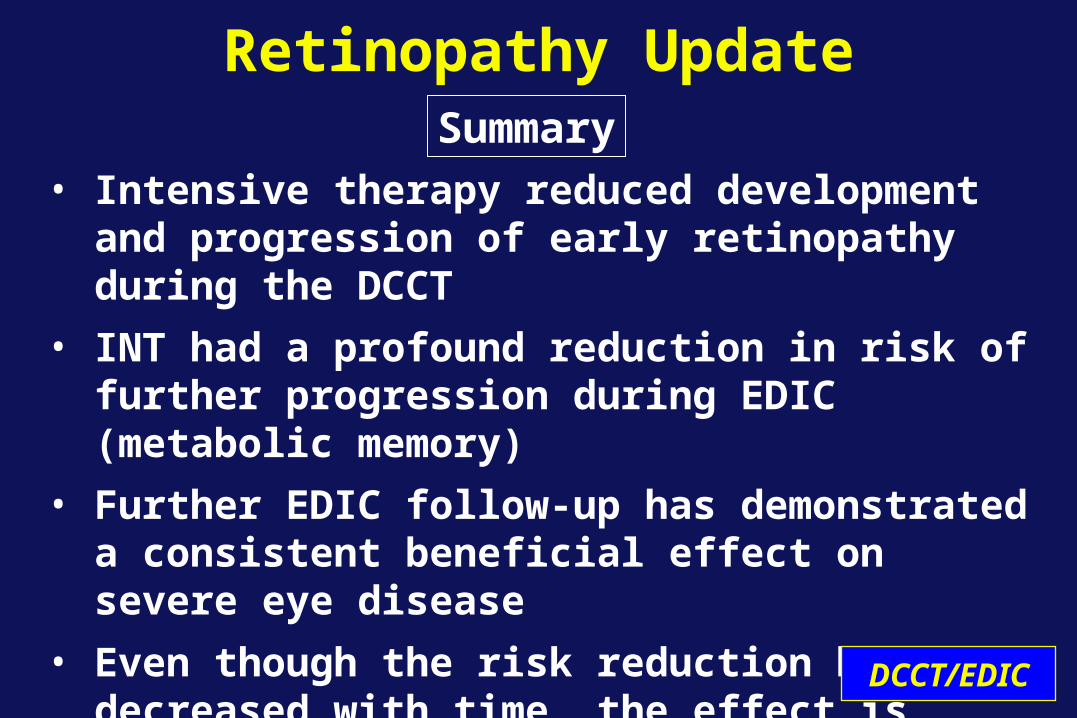
Retinopathy Update
• Intensive therapy reduced development and progression of early retinopathy during the DCCT
• INT had a profound reduction in risk of further progression during EDIC (metabolic memory)
• Further EDIC follow-up has demonstrated a consistent beneficial effect on severe eye disease
• Even though the risk reduction has decreased with time, the effect is still substantial after 18 years of EDIC follow-up
DCCT/EDIC
Summary
• During EDIC, there was a major (48%) reduction of risk of ocular surgery in the original INT group
• In the original INT group, the incidence of severe retinal outcomes was reduced by 50% over the DCCT/EDIC period.
DCCT/EDIC
Retinopathy UpdateSummary
1-2 3-4 5-6 7-8 0
5
10
15
20
25
Conventional
Intensive
Cu
mu
lati
ve I
nci
den
ce (
%)
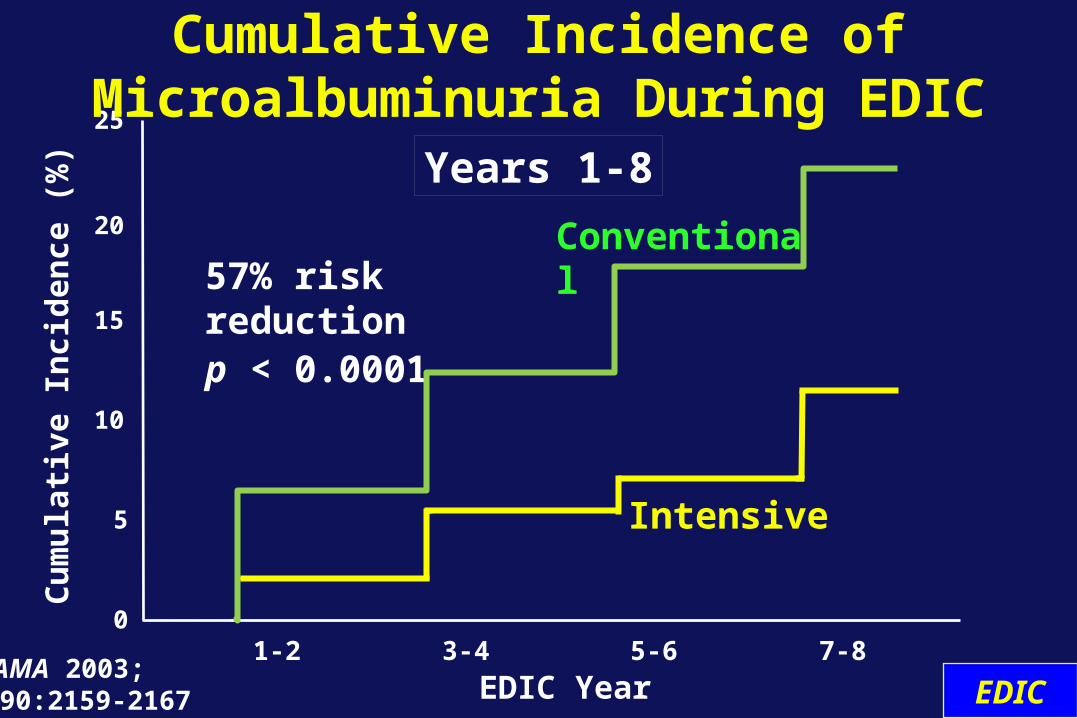
57% risk reductionp < 0.0001
EDIC YearJAMA 2003; 290:2159-2167
Cumulative Incidence of Microalbuminuria During EDIC
Years 1-8
EDIC
0
2
4
6
8
10
12
1 - 2 3 - 4 5 - 6 7 - 8
Conventional
IntensiveCu
mu
lati
ve I
nci
den
ce (
%)
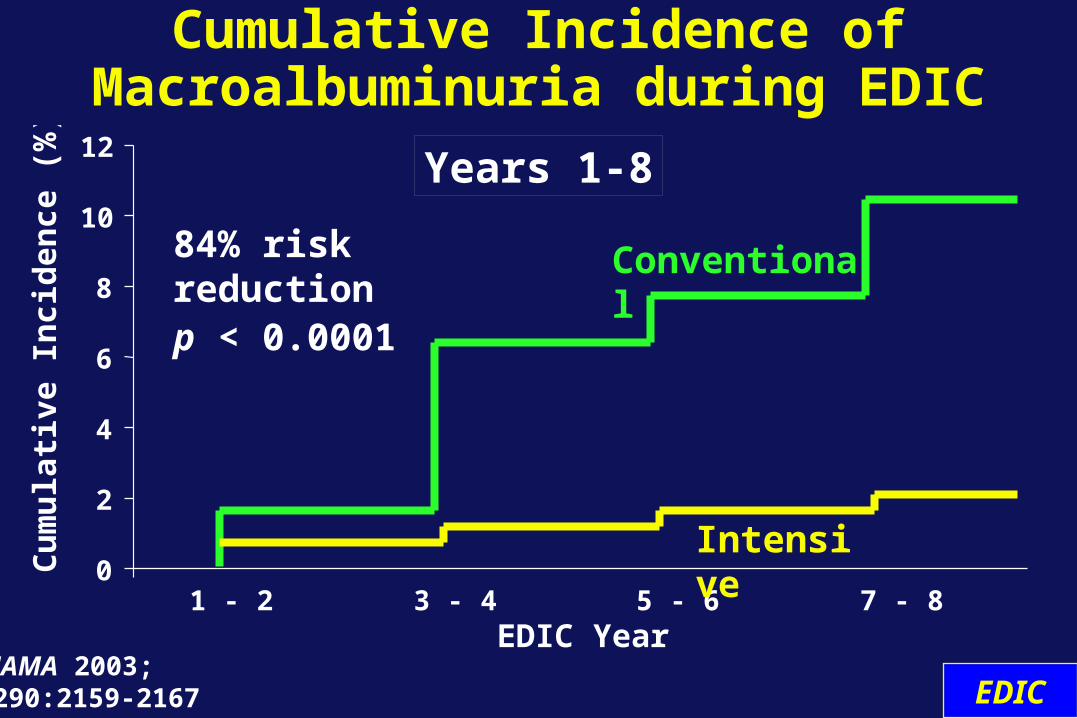
84% risk reductionp < 0.0001
EDIC Year
Cumulative Incidence of Macroalbuminuria during EDIC
JAMA 2003; 290:2159-2167
Years 1-8
EDIC
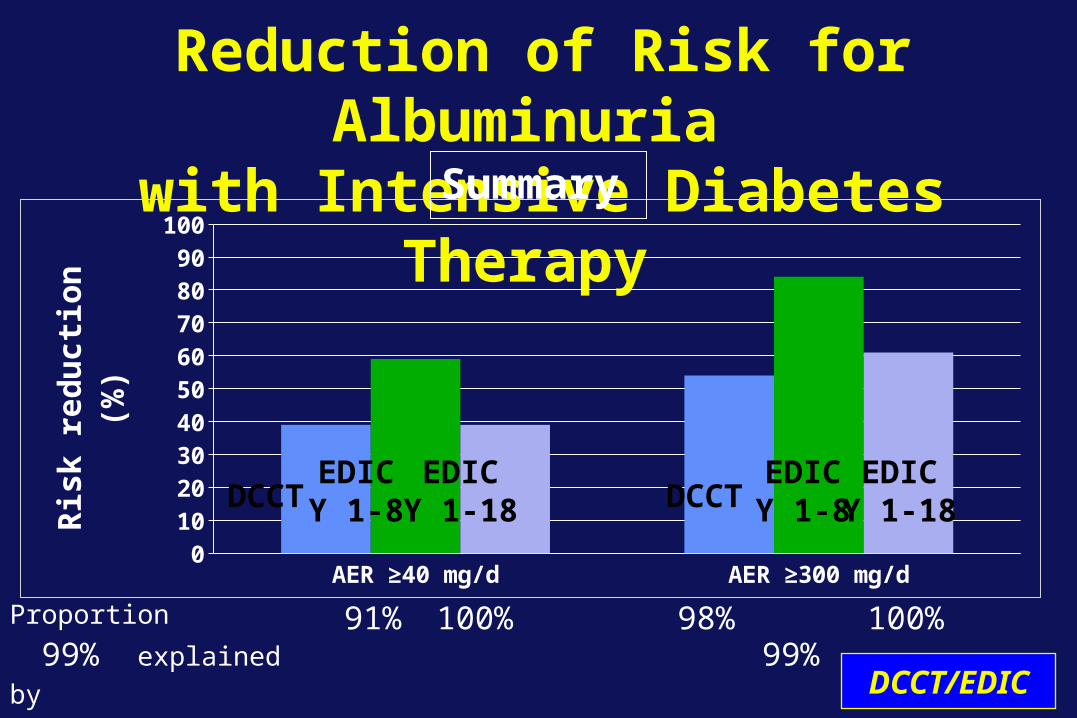
Reduction of Risk for Albuminuria with Intensive Diabetes Therapy
AER ≥40 mg/d AER ≥300 mg/d0
10
20
30
40
50
60
70
80
90
100
Ris
k r
ed
uc
tio
n (
%)
Proportion 99% explained by DCCT mean HbA1c
91% 100% 98% 99% 100%
Summary
DCCT DCCTEDICY 1-8
EDICY 1-8
EDICY 1-18
EDICY 1-18
DCCT/EDIC
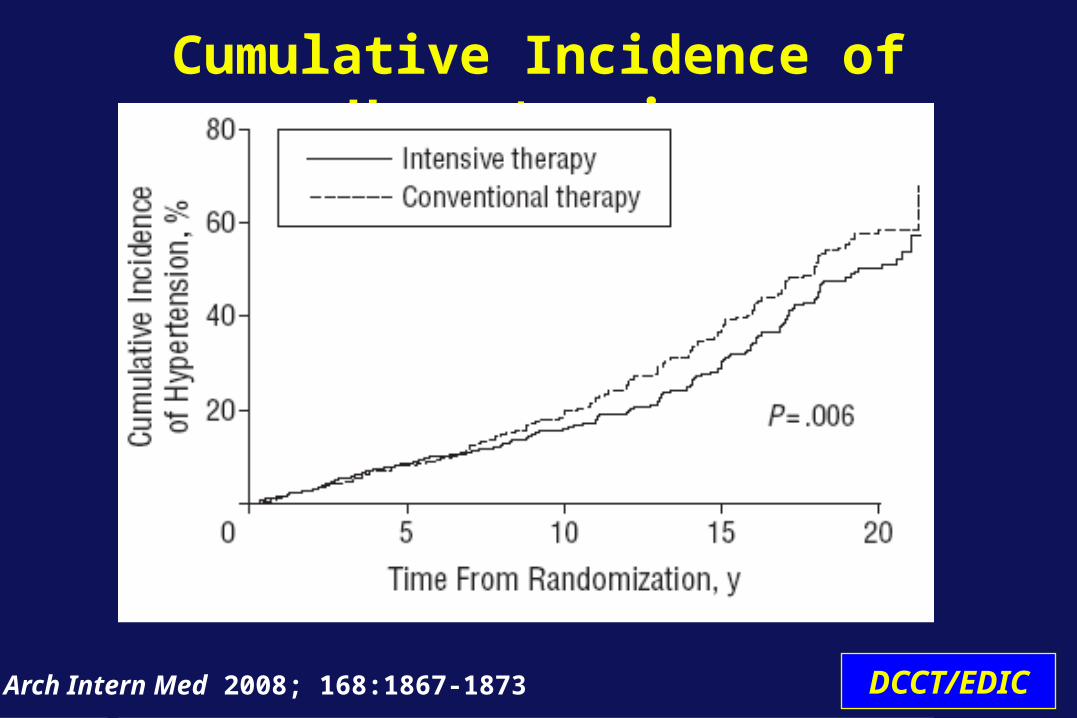
Cumulative Incidence of Hypertension
Arch Intern Med 2008; 168:1867-1873 DCCT/EDIC
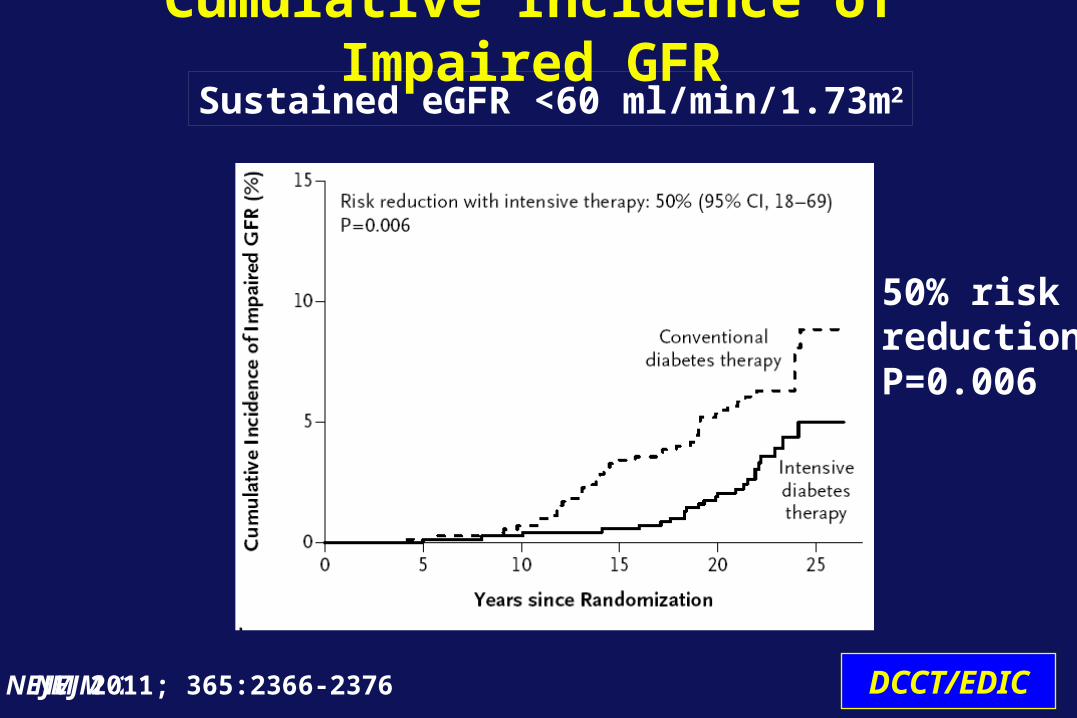
Cumulative Incidence of Impaired GFR
NEJM 2011
50% riskreductionP=0.006
Sustained eGFR <60 ml/min/1.73m2
NEJM 2011; 365:2366-2376 DCCT/EDIC
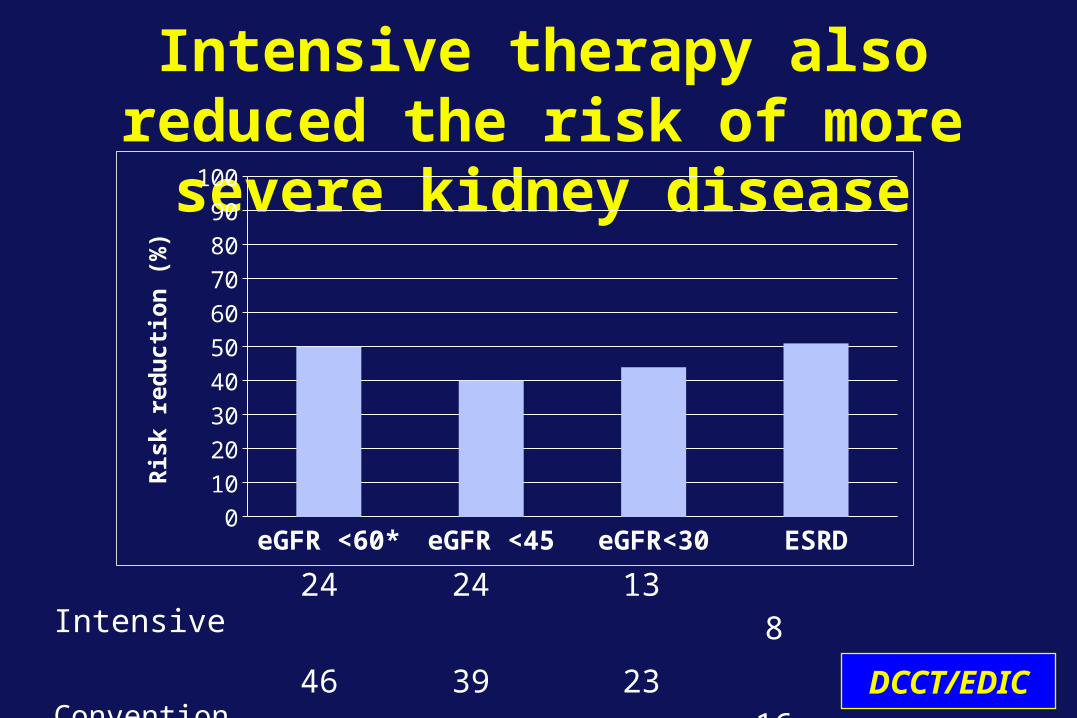
Intensive therapy also reduced the risk of more severe kidney disease
eGFR <60* eGFR <45 eGFR<30 ESRD0
10
20
30
40
50
60
70
80
90
100R
isk
red
uct
ion
(%
)
Intensive 24 24 13 8 Conventional 46 39 23 16P-value 0.006 0.045 0.088 0.098 DCCT/EDIC
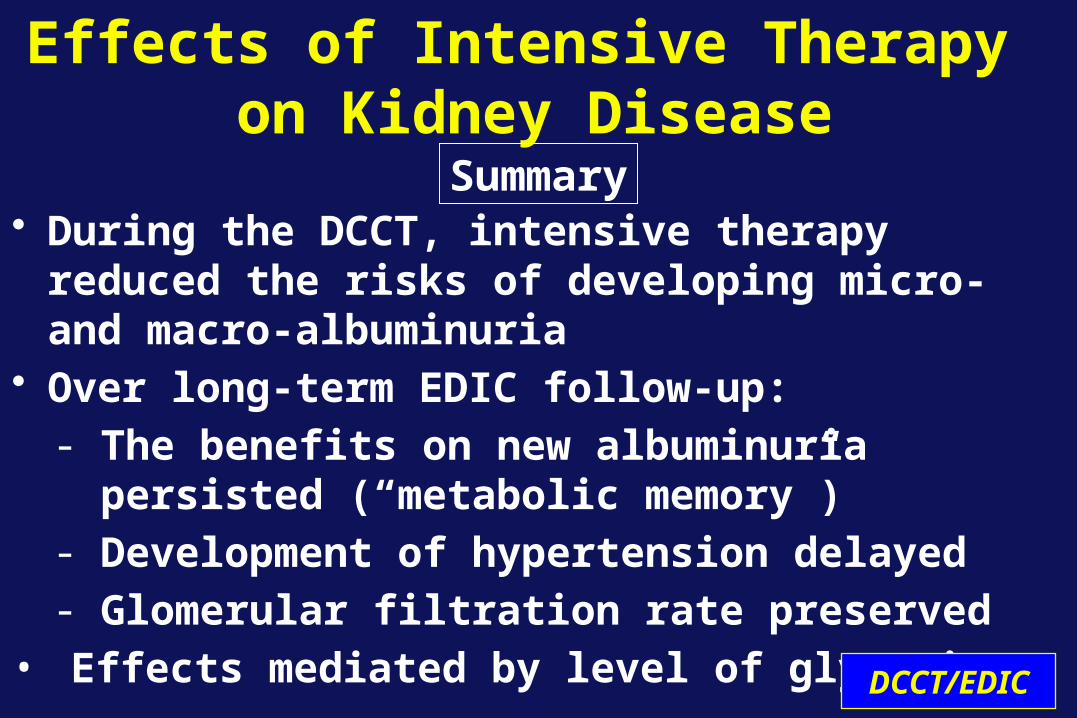
Effects of Intensive Therapy on Kidney Disease
• During the DCCT, intensive therapy reduced the risks of developing micro- and macro-albuminuria
• Over long-term EDIC follow-up:- The benefits on new albuminuria persisted
(“metabolic memory”)- Development of hypertension delayed- Glomerular filtration rate preserved
• Effects mediated by level of glycemia
Summary
DCCT/EDIC
Effects of Intensive Therapy on Kidney Disease
Conclusion
DCCT/EDIC
Early intensive diabetes therapy is effective for preventing or delaying kidney disease in type 1 diabetes
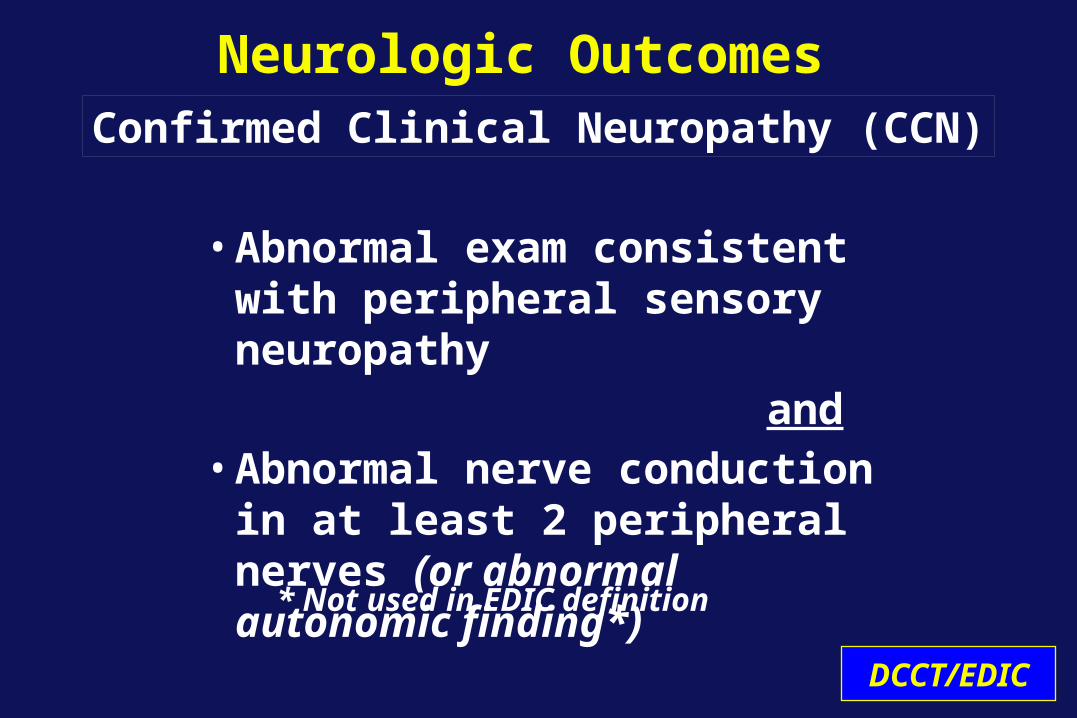
Neurologic Outcomes
• Abnormal exam consistent with peripheral sensory neuropathy
and• Abnormal nerve conduction in
at least 2 peripheral nerves (or abnormal autonomic finding*)
* Not used in EDIC definition
Confirmed Clinical Neuropathy (CCN)
DCCT/EDIC
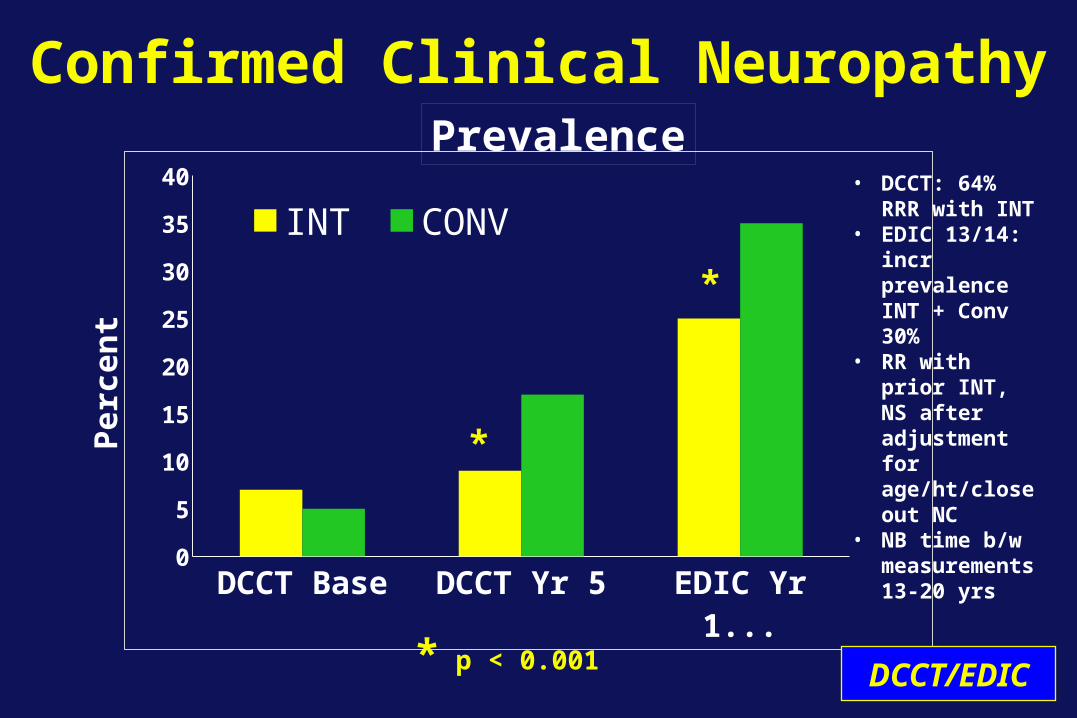
Confirmed Clinical Neuropathy
DCCT Base DCCT Yr 5 EDIC Yr 13/140
5
10
15
20
25
30
35
40
INT CONV
Per
cen
t
*
*
* p < 0.001
Prevalence
DCCT/EDIC
• DCCT: 64% RRR with INT
• EDIC 13/14: incr prevalence INT + Conv 30%
• RR with prior INT, NS after adjustment for age/ht/close out NC
• NB time b/w measurements 13-20 yrs
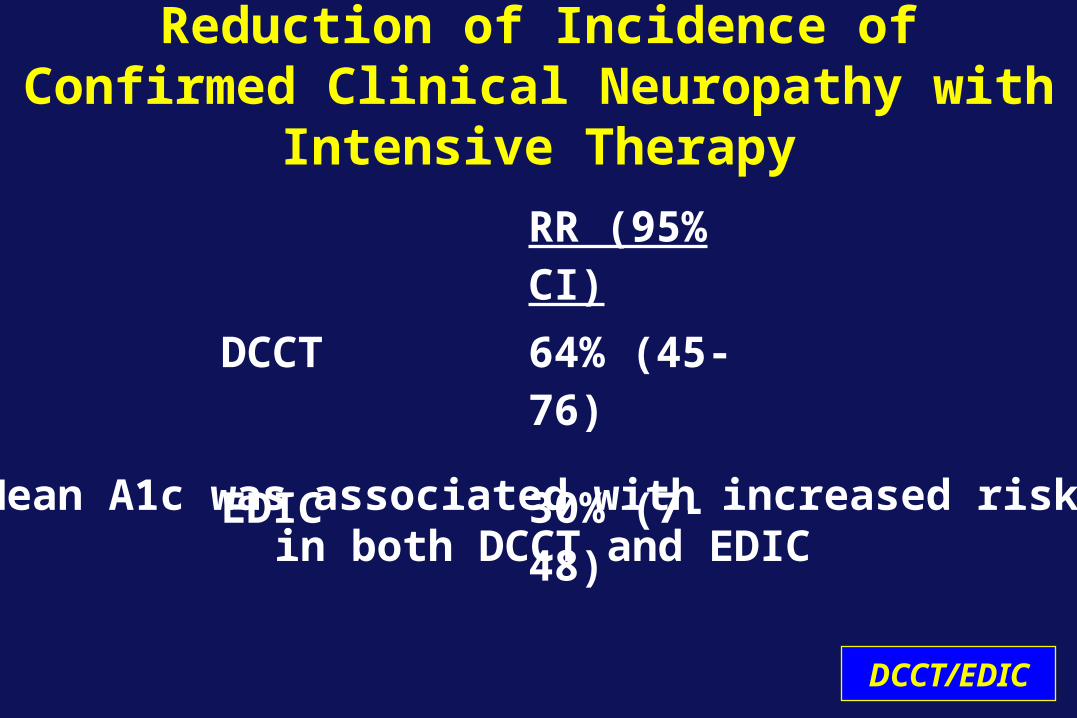
Reduction of Incidence of Confirmed Clinical Neuropathy with Intensive Therapy
RR (95% CI)DCCT 64% (45-76)
EDIC 30% (7-48)
Mean A1c was associated with increased risk in both DCCT and EDIC
DCCT/EDIC
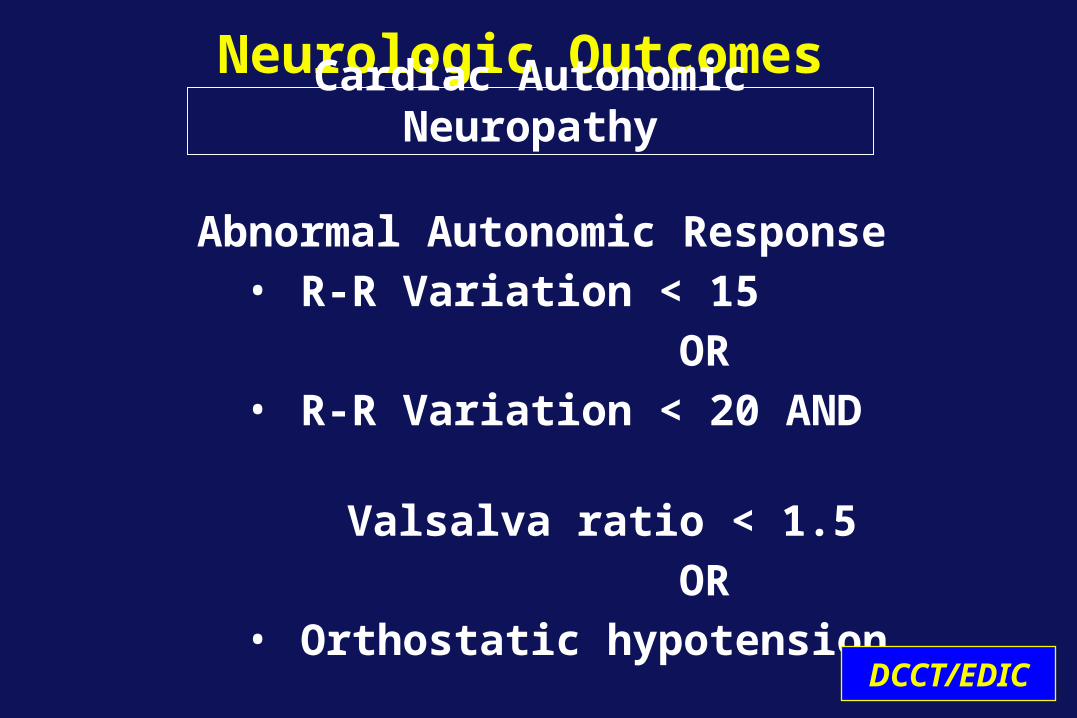
Neurologic Outcomes
Abnormal Autonomic Response• R-R Variation < 15
OR• R-R Variation < 20 AND
Valsalva ratio < 1.5
OR• Orthostatic hypotension
Cardiac Autonomic Neuropathy
DCCT/EDIC
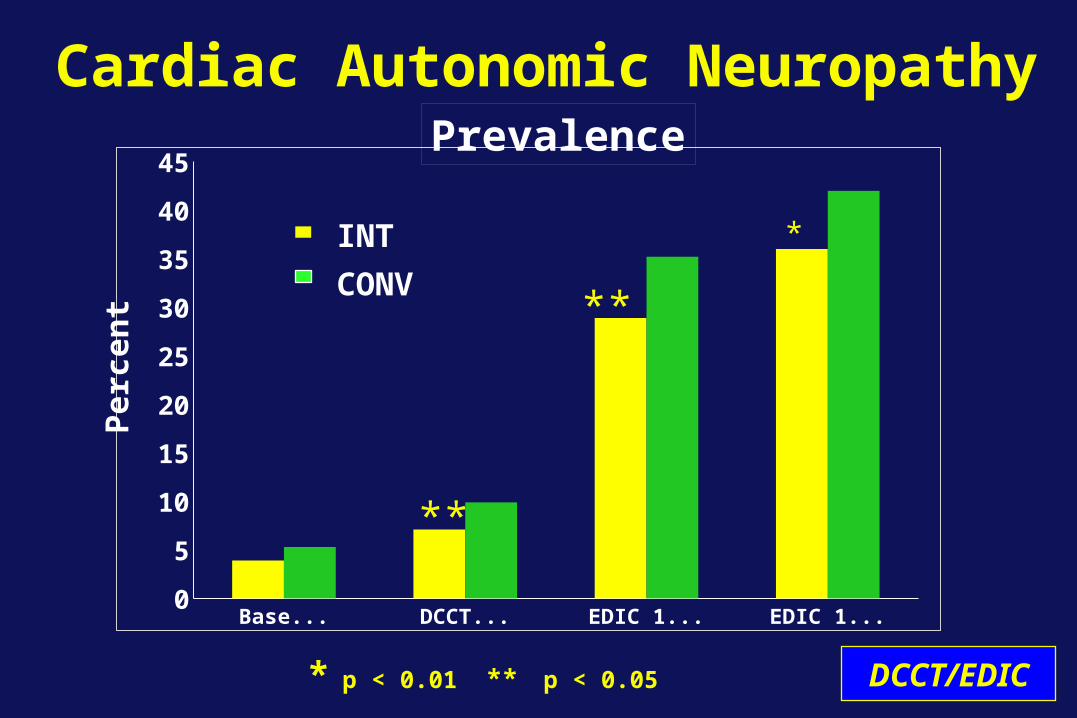
Cardiac Autonomic Neuropathy
Baseline DCCT END EDIC 13/14 EDIC 16/170
5
10
15
20
25
30
35
40
45
**
*
**
INT
CONV
* p < 0.01 ** p < 0.05
Per
cen
tPrevalence
DCCT/EDIC
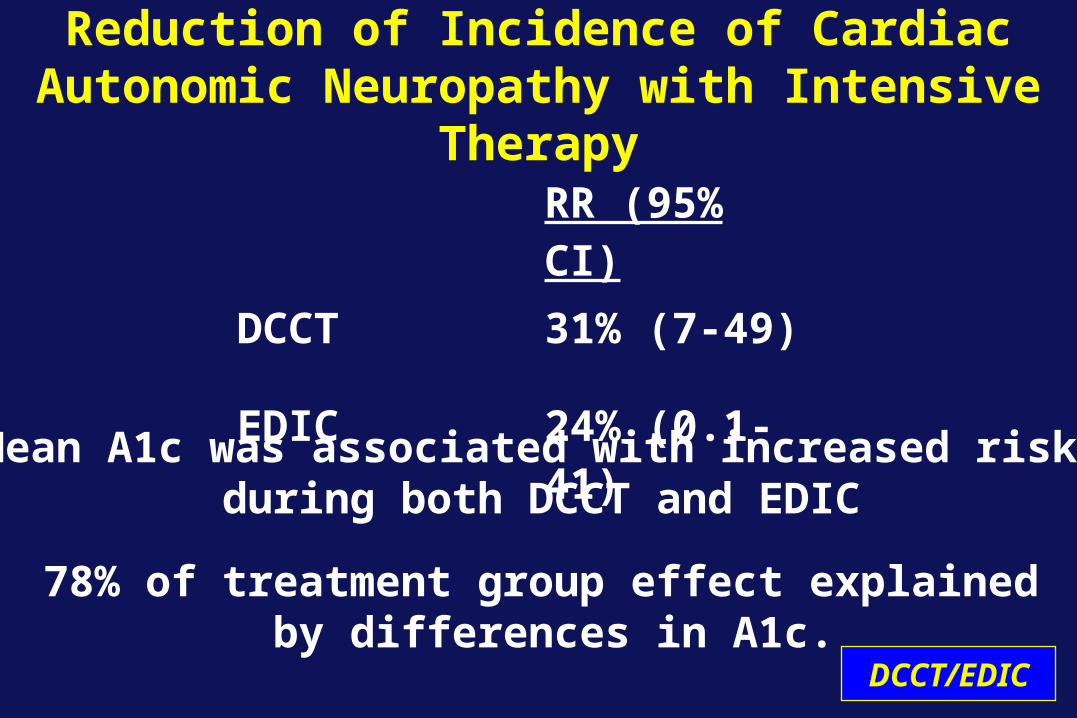
Reduction of Incidence of Cardiac Autonomic Neuropathy with Intensive Therapy
RR (95% CI)DCCT 31% (7-49)
EDIC 24% (0.1-41)
Mean A1c was associated with increased risk during both DCCT and EDIC
78% of treatment group effect explained by differences in A1c.
DCCT/EDIC
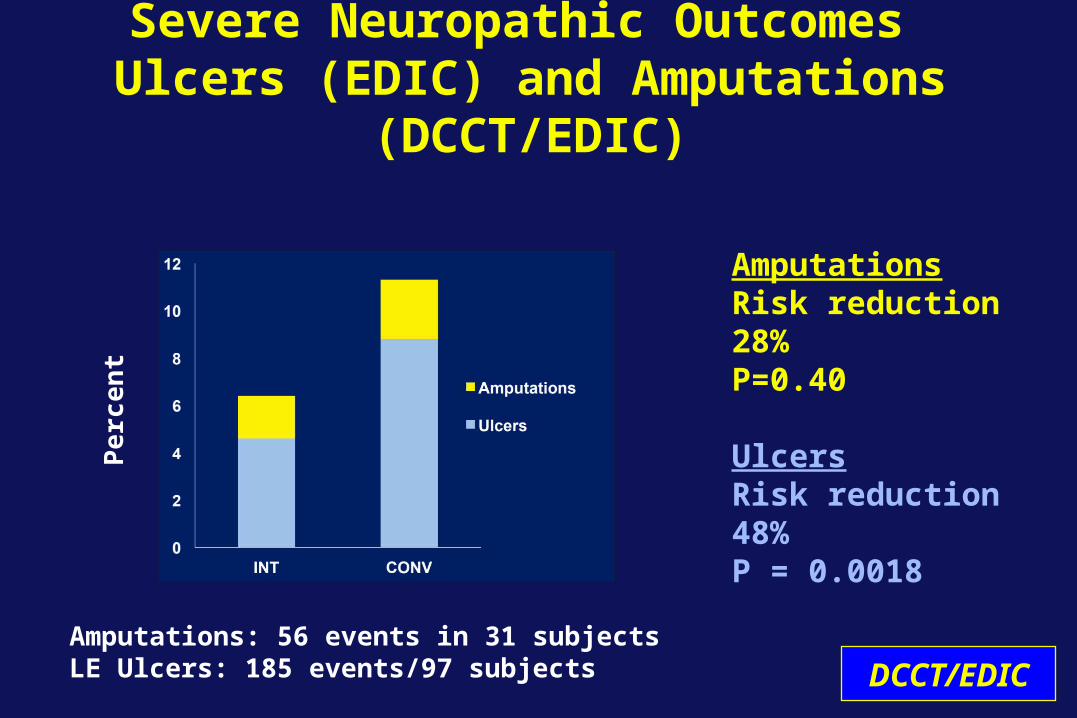
Severe Neuropathic Outcomes Ulcers (EDIC) and Amputations (DCCT/EDIC)
AmputationsRisk reduction 28% P=0.40
UlcersRisk reduction 48%P = 0.0018
Pe
rce
nt
DCCT/EDICAmputations: 56 events in 31 subjectsLE Ulcers: 185 events/97 subjects

Erectile Dysfunction
Primary Secondary0%
5%
10%
15%
20%
25%
30%
35%
INT
CONV
*
*p< 0.001 DCCT/EDIC
Prevalence EDIC Yr 10
J Urol2011;185:1828
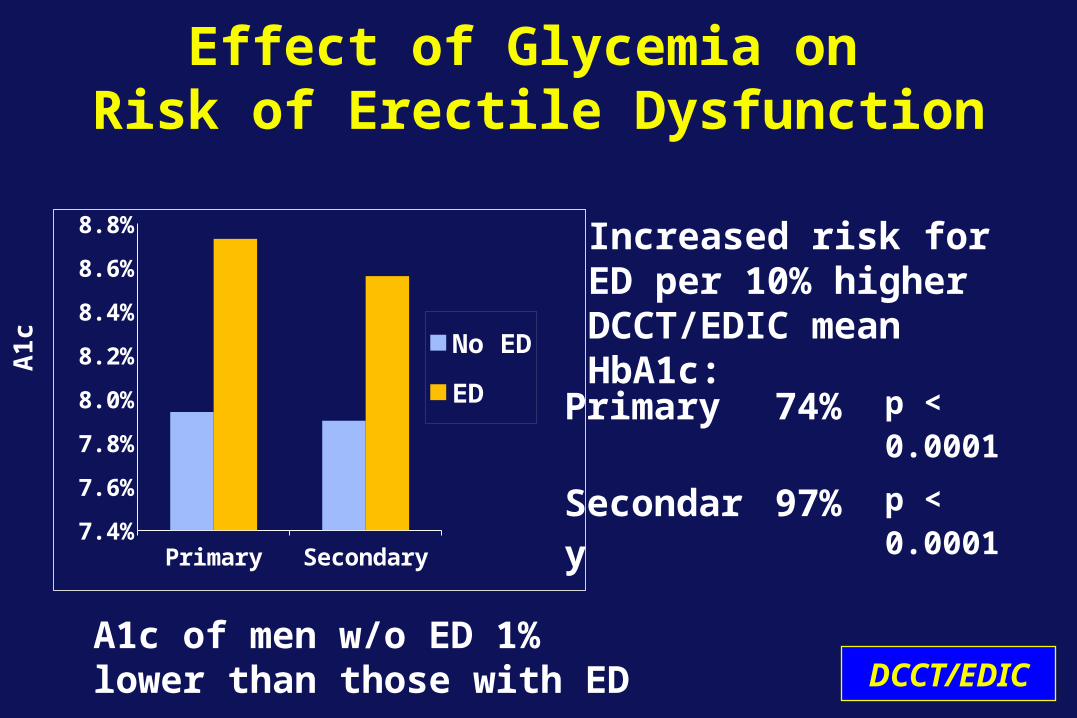
Effect of Glycemia on Risk of Erectile Dysfunction
Primary Secondary7.4%
7.6%
7.8%
8.0%
8.2%
8.4%
8.6%
8.8%
No ED
ED
A1
c
Primary 74% p < 0.0001
Secondary 97% p < 0.0001
Increased risk for ED per 10% higher DCCT/EDIC mean HbA1c:
DCCT/EDICA1c of men w/o ED 1% lower than those with ED

Neuropathy Findings
• Intensive therapy reduced risk of developing Confirmed Clinical Neuropathy (CCN) by 64% and of Cardiac Autonomic Neuropathy (CAN) by 31% at DCCT end.
• Risk of developing CCN by EDIC year 14 reduced by 30% in former INT subjects (OR 0.70; 95% CI 0.52-0.93).
• Risk of developing CAN by EDIC year 14 reduced by 31% (OR 0.69 95% CI 0.51-0.93) in former INT subjects.
Summary
DCCT/EDIC
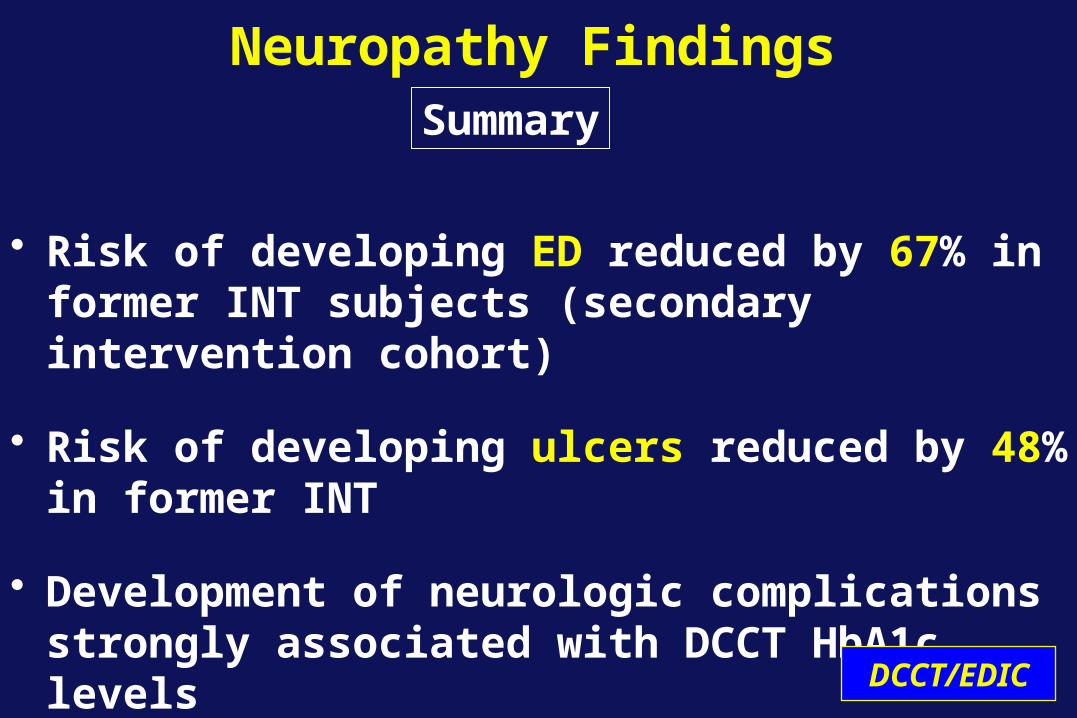
Neuropathy Findings
• Risk of developing ED reduced by 67% in former INT subjects (secondary intervention cohort)
• Risk of developing ulcers reduced by 48% in former INT
• Development of neurologic complications strongly associated with DCCT HbA1c levels
Summary
DCCT/EDIC

TAKE A BREAK!
Cardiovascular Update
John M. Lachin, Sc.D.
DCCT/EDIC
Principal Investigator DCCT/EDIC Data Coordinating Center
The Biostatistics CenterThe George Washington University
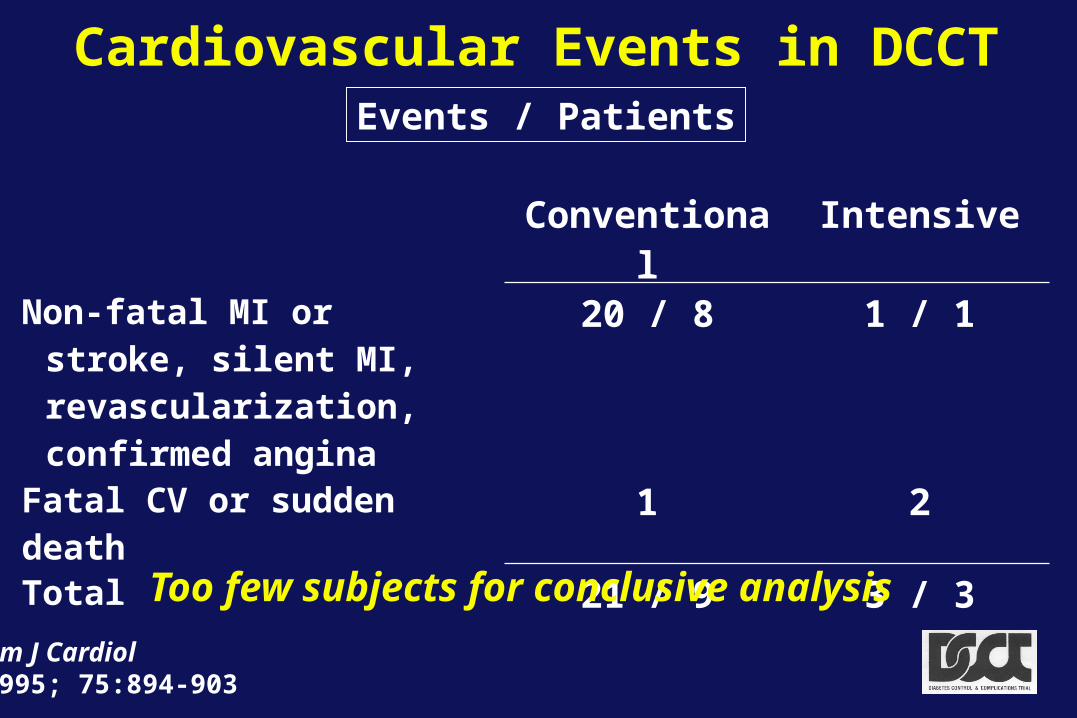
Cardiovascular Events in DCCTEvents / Patients
Am J Cardiol1995; 75:894-903
Conventional IntensiveNon-fatal MI or stroke, silent
MI, revascularization, confirmed angina
20 / 8 1 / 1
Fatal CV or sudden death 1 2Total 21 / 9 3 / 3
Too few subjects for conclusive analysis
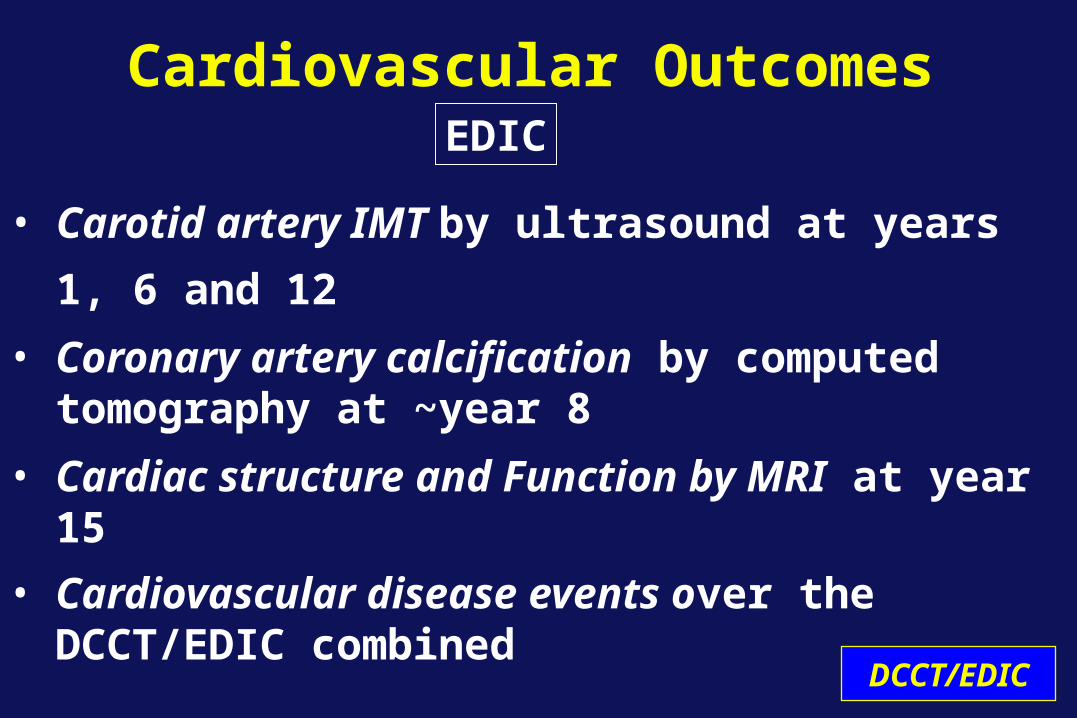
Cardiovascular Outcomes
• Carotid artery IMT by ultrasound at years 1, 6
and 12
• Coronary artery calcification by computed tomography at ~year 8
• Cardiac structure and Function by MRI at year 15
• Cardiovascular disease events over the DCCT/EDIC combined
DCCT/EDIC
EDIC
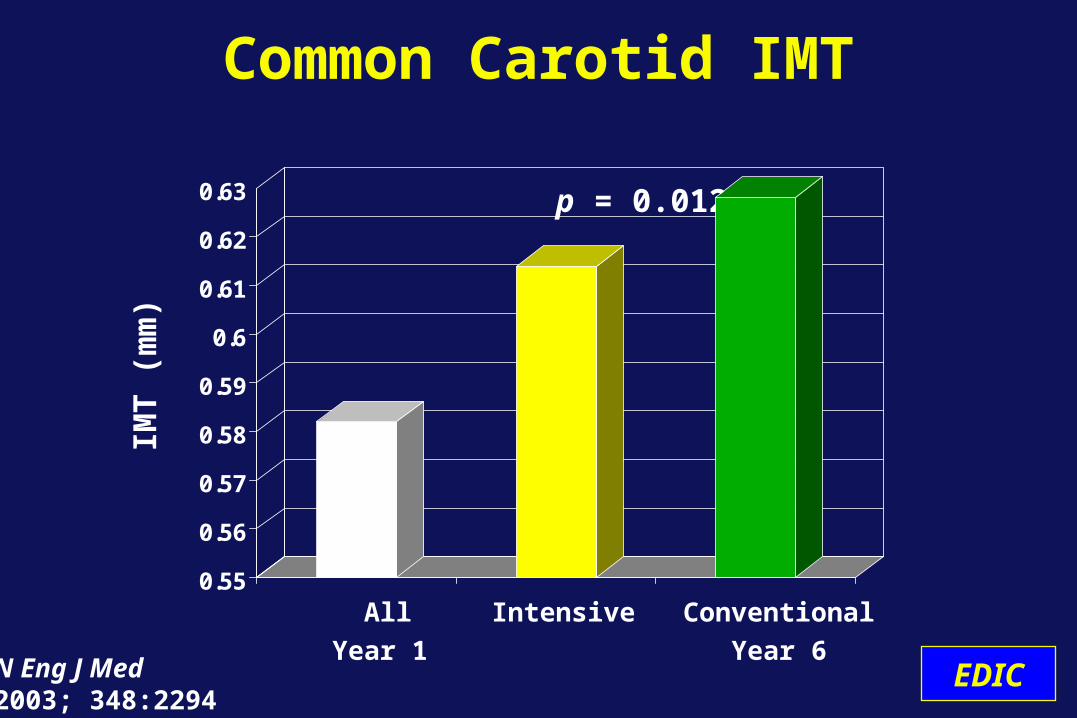
Common Carotid IMT
0.55
0.56
0.57
0.58
0.59
0.6
0.61
0.62
0.63
All Intensive Conventional
Year 1 Year 6
p = 0.012
N Eng J Med2003; 348:2294
IMT
(m
m)
EDIC
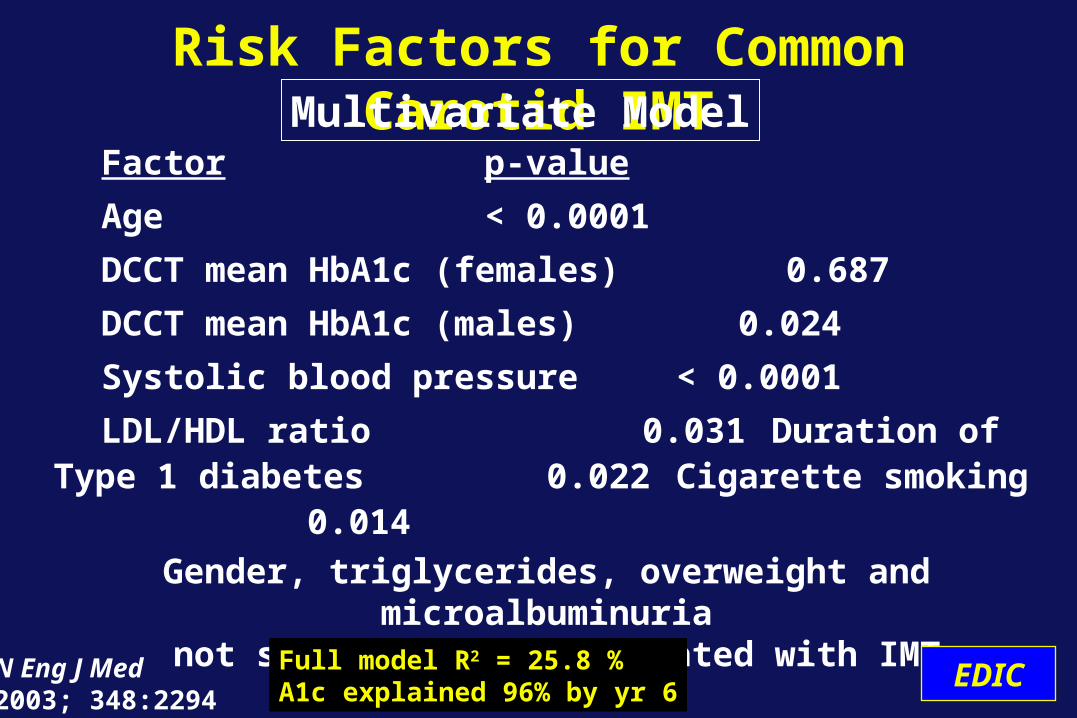
Factor p-value
Age < 0.0001
DCCT mean HbA1c (females) 0.687
DCCT mean HbA1c (males) 0.024
Systolic blood pressure < 0.0001
LDL/HDL ratio 0.031Duration of Type 1 diabetes 0.022Cigarette smoking 0.014
Gender, triglycerides, overweight and microalbuminuria not significantly associated with IMT
Risk Factors for Common Carotid IMT
Full model R2 = 25.8 %A1c explained 96% by yr 6
Multivariate Model
EDICN Eng J Med2003; 348:2294
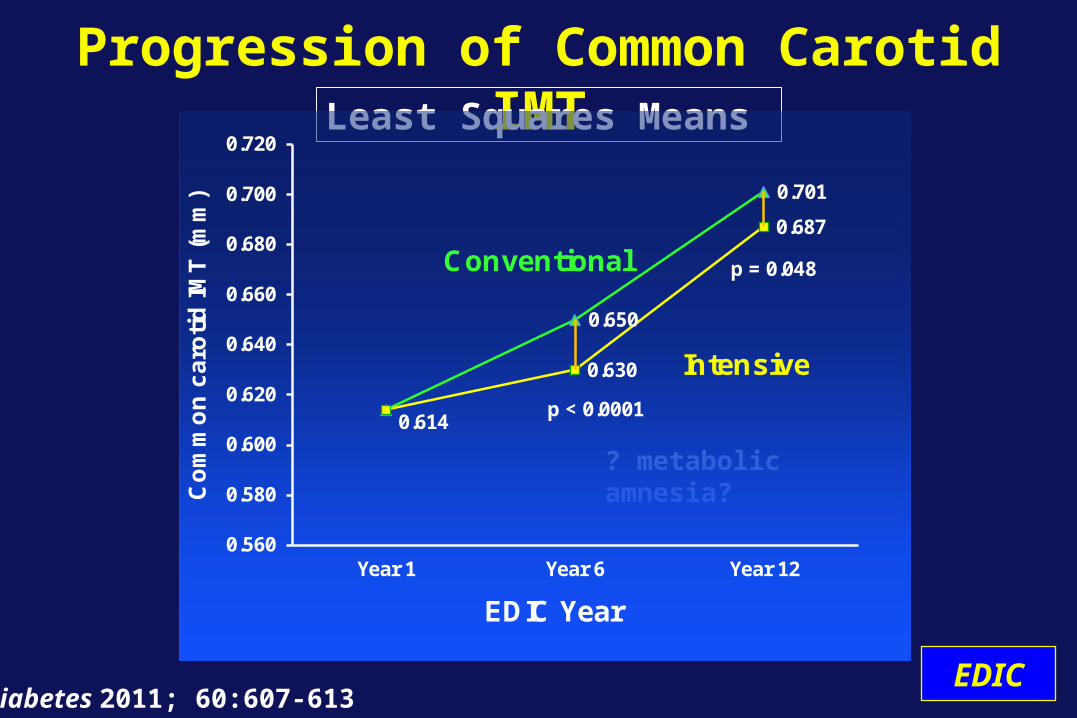
0.614
0.650
0.701
0.630
0.687
0.560
0.580
0.600
0.620
0.640
0.660
0.680
0.700
0.720
Year 1 Year 6 Year 12
Co
mm
on
ca
roti
d I
MT
(m
m)
EDIC Year
Conventional
Intensive
p < 0.0001
p = 0.048
Progression of Common Carotid IMT
Diabetes 2011; 60:607-613 EDIC
Least Squares Means
? metabolic amnesia?
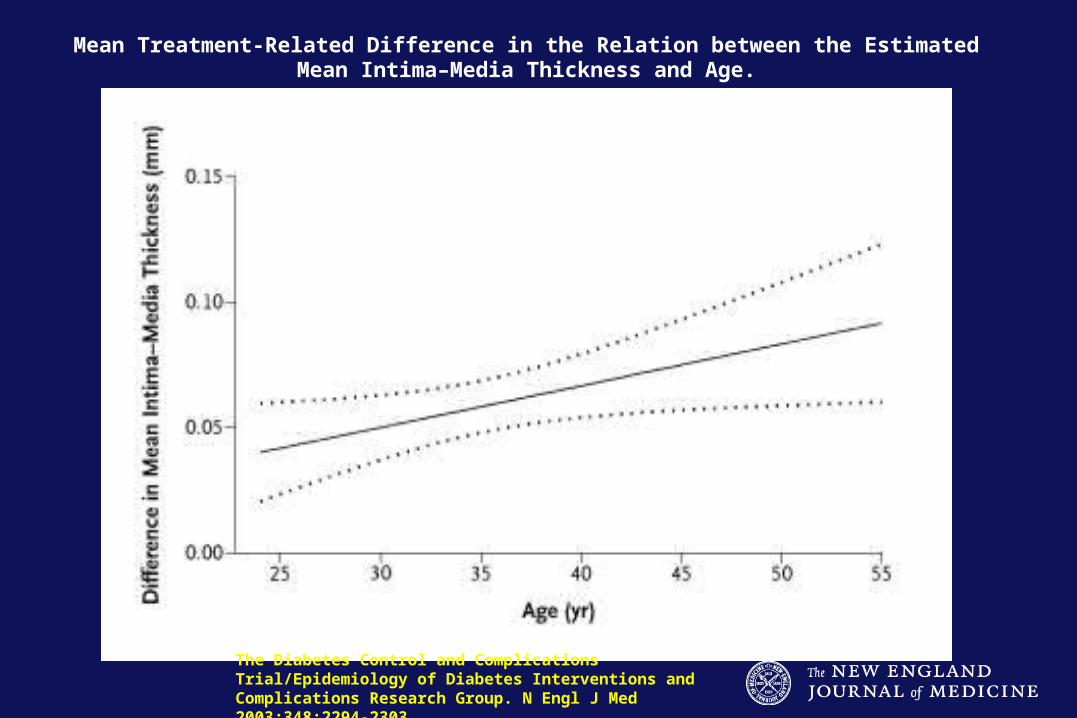
Mean Treatment-Related Difference in the Relation between the Estimated Mean Intima–Media Thickness and Age.
The Diabetes Control and Complications Trial/Epidemiology of Diabetes Interventions and Complications Research Group. N Engl J Med 2003;348:2294-2303.
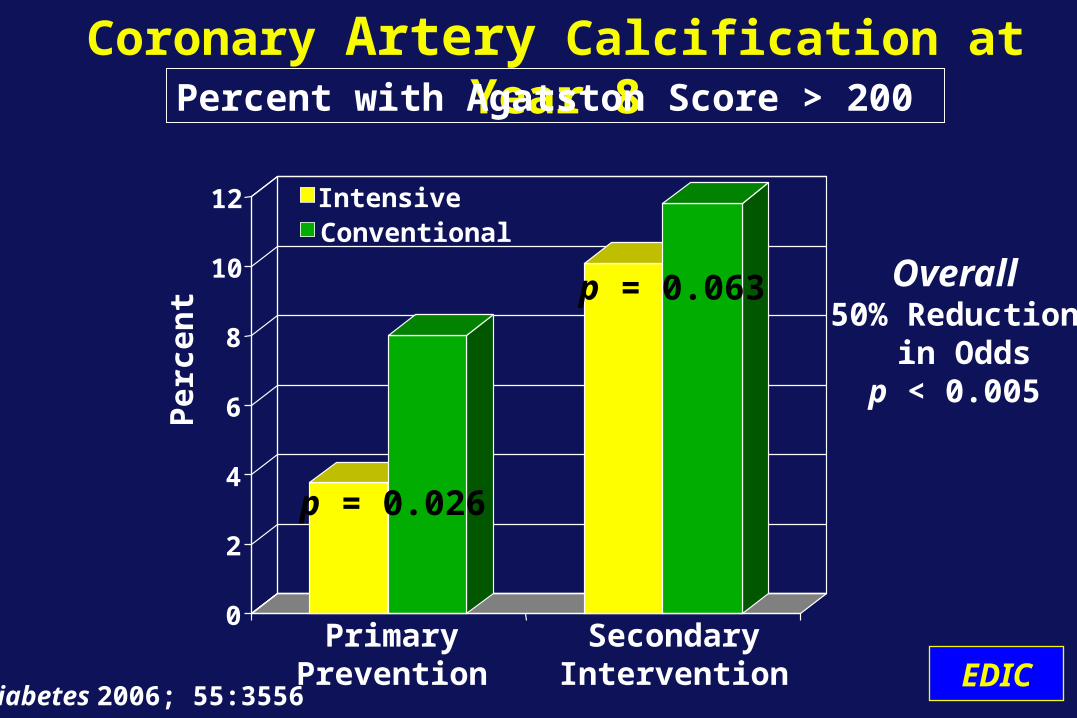
Coronary Artery Calcification at Year 8
0
2
4
6
8
10
12
PrimaryPrevention
SecondaryIntervention
IntensiveConventional
Per
cen
t
p = 0.026
p = 0.063 Overall50% Reduction
in Oddsp < 0.005
Diabetes 2006; 55:3556 EDIC
Percent with Agatston Score > 200
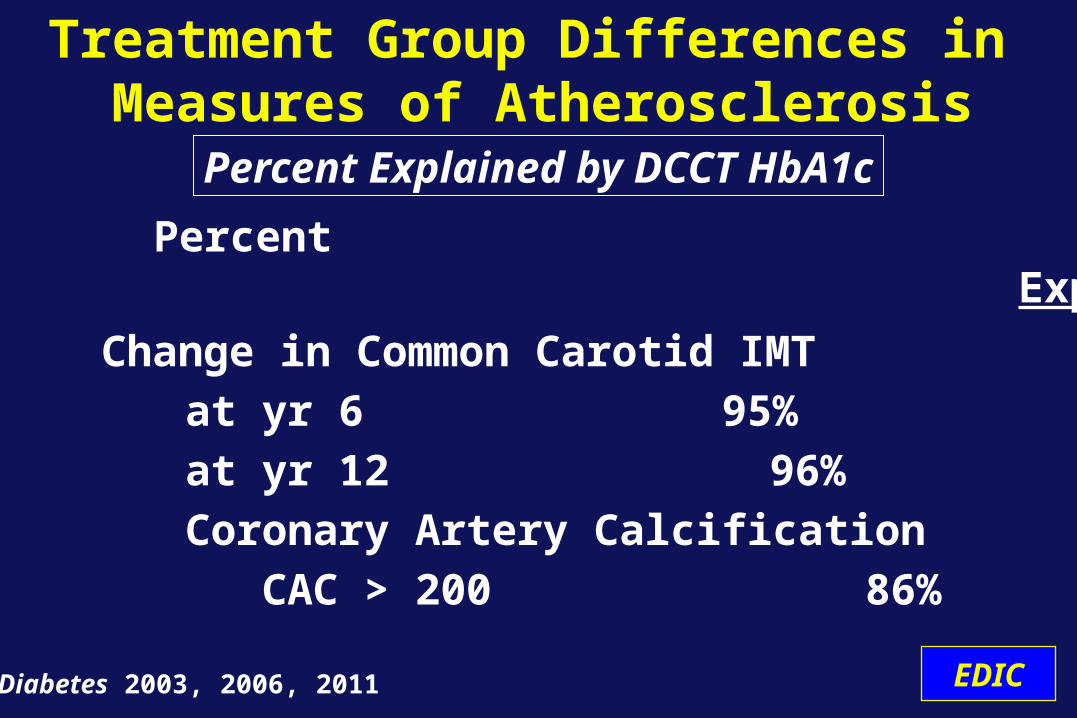
Change in Common Carotid IMT
at yr 6 95%
at yr 12 96%
Coronary Artery Calcification
CAC > 200 86%
Treatment Group Differences in Measures of Atherosclerosis
Percent Outcome Explained
Diabetes 2003, 2006, 2011 EDIC
Percent Explained by DCCT HbA1c
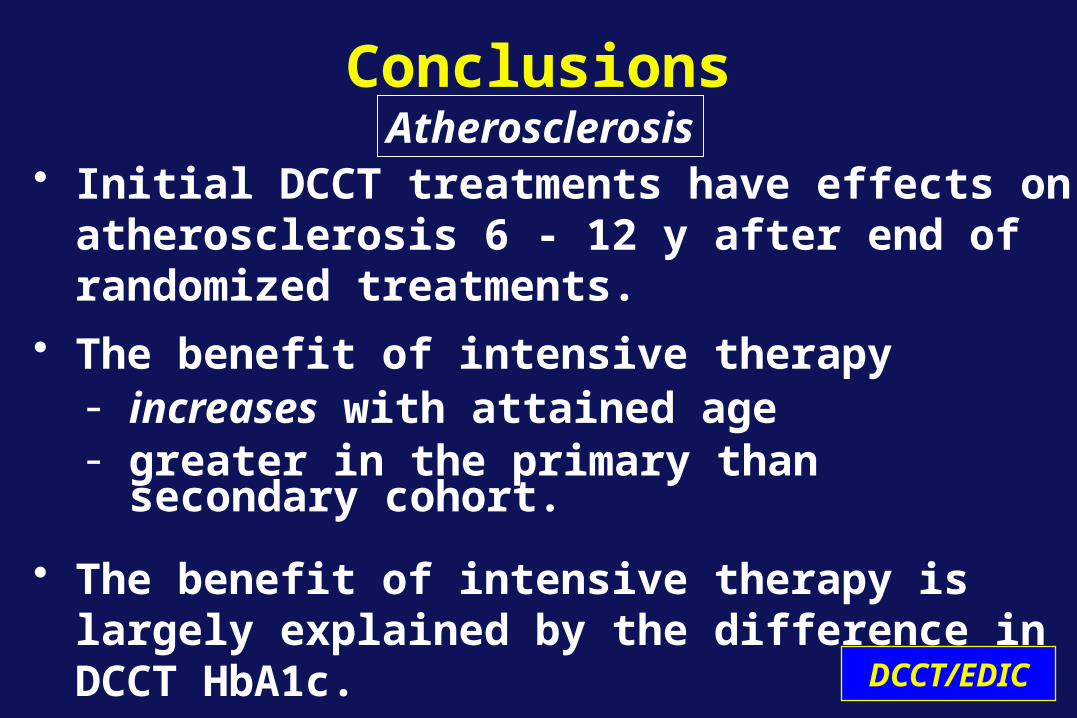
Conclusions
• Initial DCCT treatments have effects on atherosclerosis 6 - 12 y after end of randomized treatments.
• The benefit of intensive therapy- increases with attained age- greater in the primary than secondary cohort.
• The benefit of intensive therapy is largely explained by the difference in DCCT HbA1c.
DCCT/EDIC
Atherosclerosis
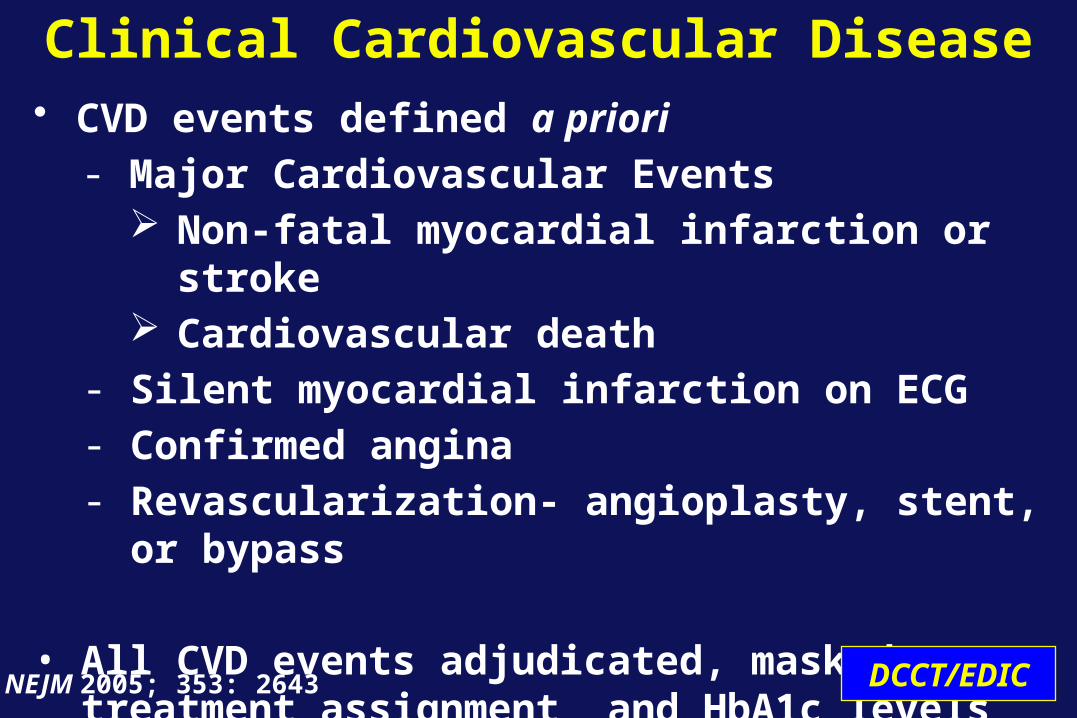
• CVD events defined a priori - Major Cardiovascular Events
Non-fatal myocardial infarction or stroke Cardiovascular death
- Silent myocardial infarction on ECG- Confirmed angina- Revascularization- angioplasty, stent, or bypass
• All CVD events adjudicated, masked to treatment assignment and HbA1c levels
Clinical Cardiovascular Disease
NEJM 2005; 353: 2643 DCCT/EDIC
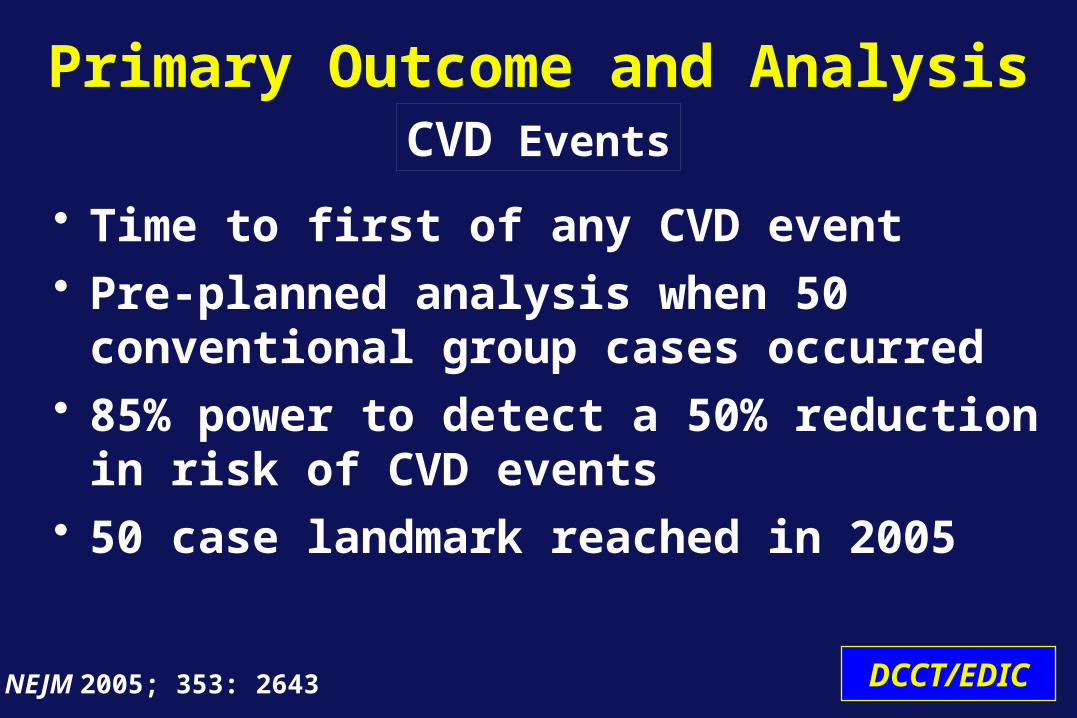
• Time to first of any CVD event• Pre-planned analysis when 50 conventional
group cases occurred• 85% power to detect a 50% reduction in risk
of CVD events • 50 case landmark reached in 2005
Primary Outcome and Analysis
DCCT/EDICNEJM 2005; 353: 2643
CVD Events
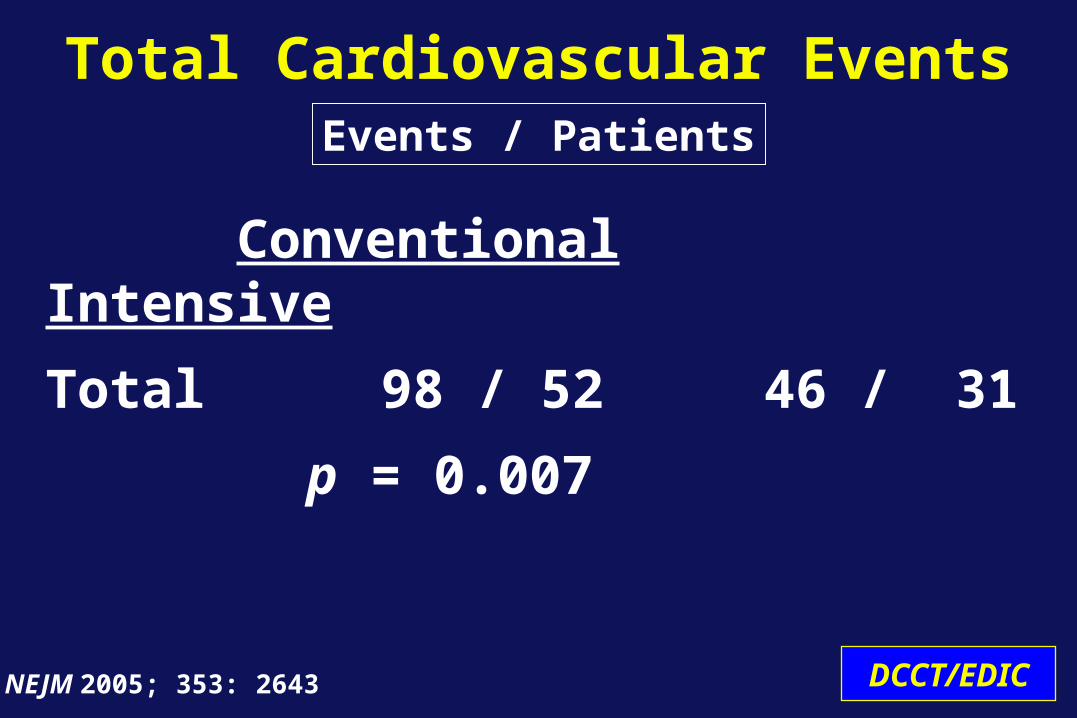
Conventional Intensive
Total 98 / 52 46 / 31
p = 0.007
Total Cardiovascular EventsEvents / Patients
DCCT/EDICNEJM 2005; 353: 2643
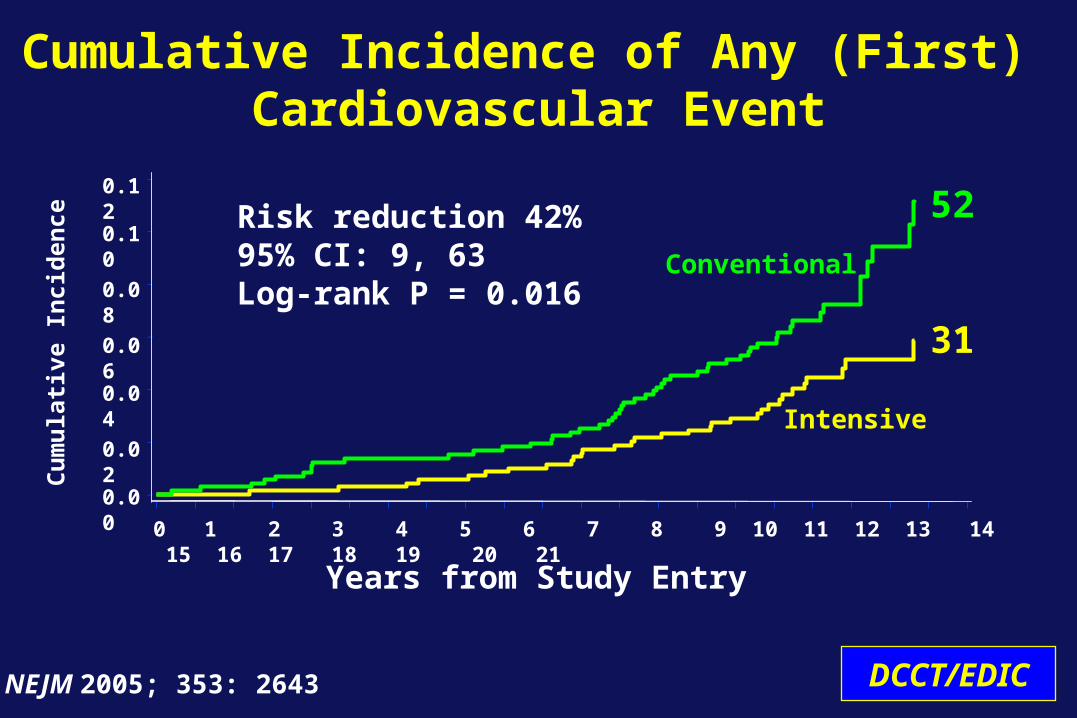
Cu
mu
lati
ve I
nci
den
ce
Years from Study Entry
Cumulative Incidence of Any (First) Cardiovascular Event
0 1 2 3 4 5 6 7 8 9 10 11 12 13 14 15 16 17 18 19 20 21
Risk reduction 42% 95% CI: 9, 63Log-rank P = 0.016
0.12
0.10
0.08
0.06
0.04
0.02
0.00
Conventional
Intensive
52
31
DCCT/EDICNEJM 2005; 353: 2643
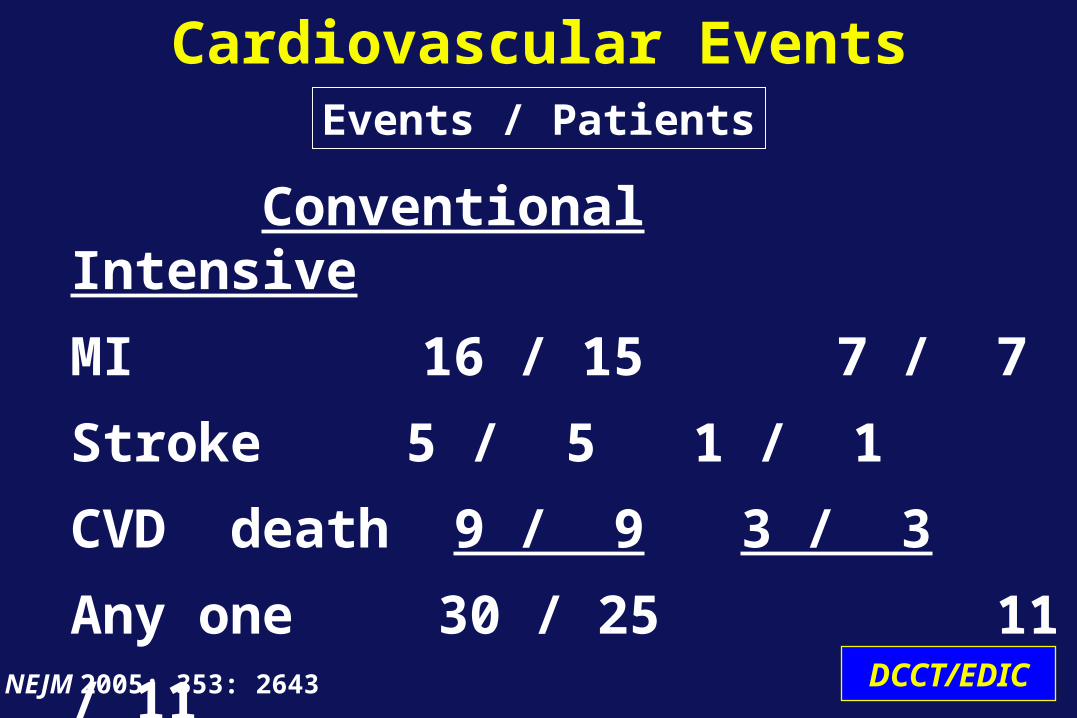
Conventional Intensive
MI 16 / 15 7 / 7
Stroke 5 / 5 1 / 1
CVD death 9 / 9 3 / 3
Any one 30 / 25 11 / 11
Cardiovascular EventsEvents / Patients
DCCT/EDICNEJM 2005; 353: 2643
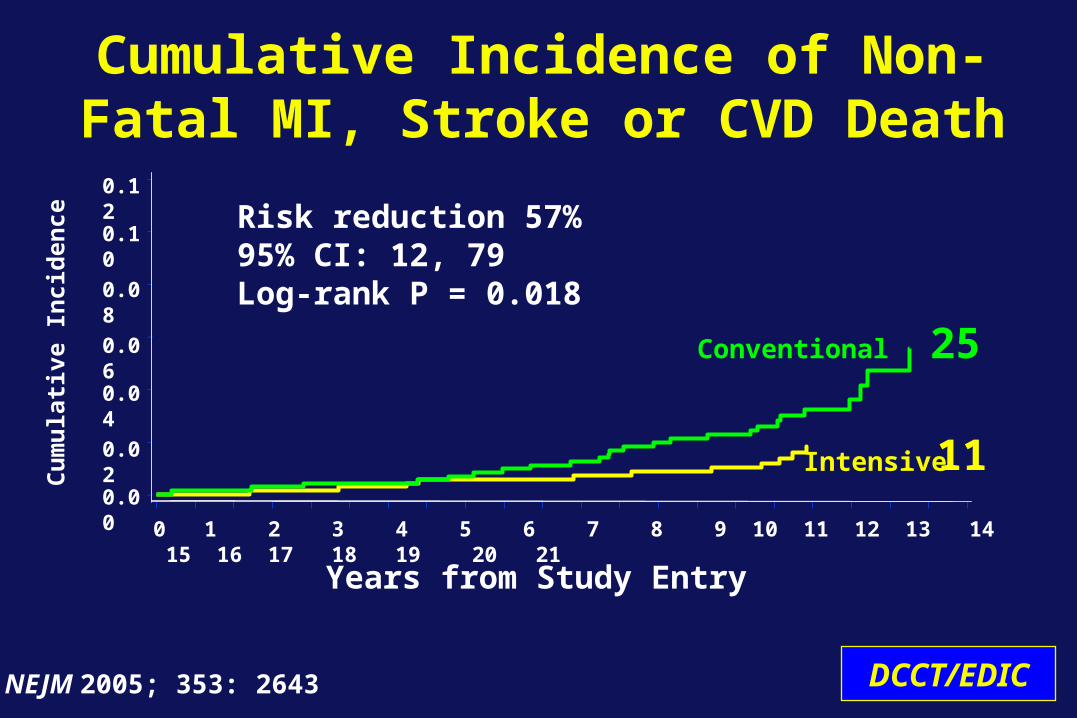
Conventional
Intensive
Cumulative Incidence of Non-Fatal MI, Stroke or CVD Death
Risk reduction 57% 95% CI: 12, 79Log-rank P = 0.018
Cu
mu
lati
ve I
nci
den
ce
0.12
0.10
0.08
0.06
0.04
0.02
0.00
0 1 2 3 4 5 6 7 8 9 10 11 12 13 14 15 16 17 18 19 20 21
Years from Study Entry
25
11
DCCT/EDICNEJM 2005; 353: 2643
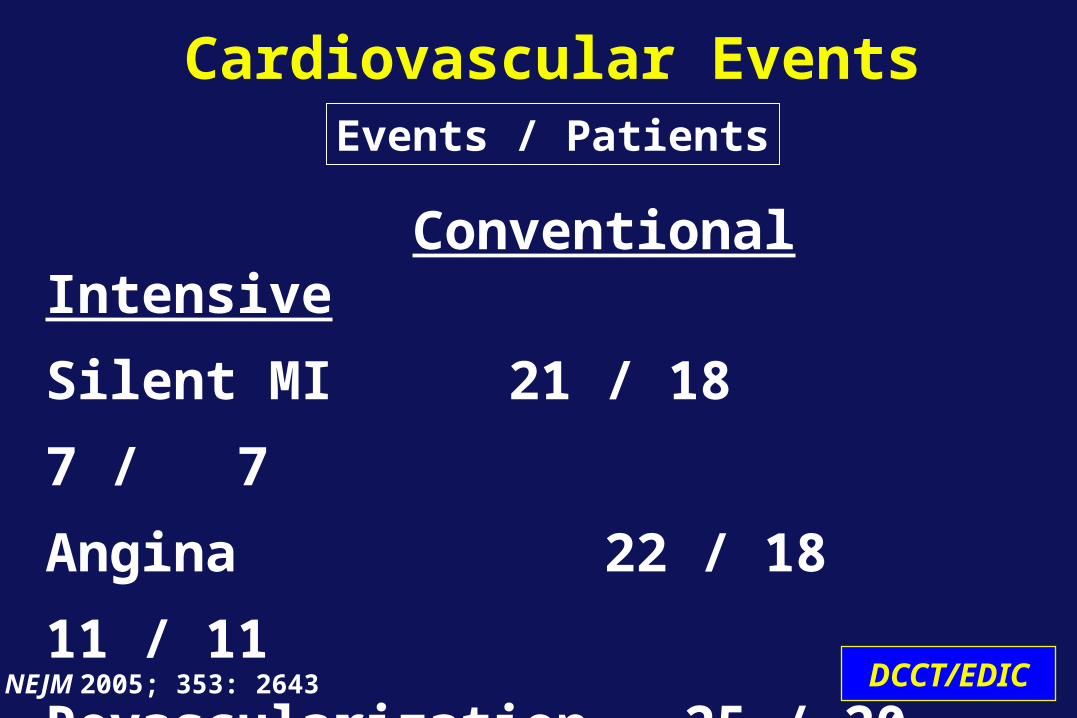
Conventional Intensive
Silent MI 21 / 18 7 / 7
Angina 22 / 18 11 / 11
Revascularization 25 / 20 17 / 11
Cardiovascular EventsEvents / Patients
DCCT/EDICNEJM 2005; 353: 2643
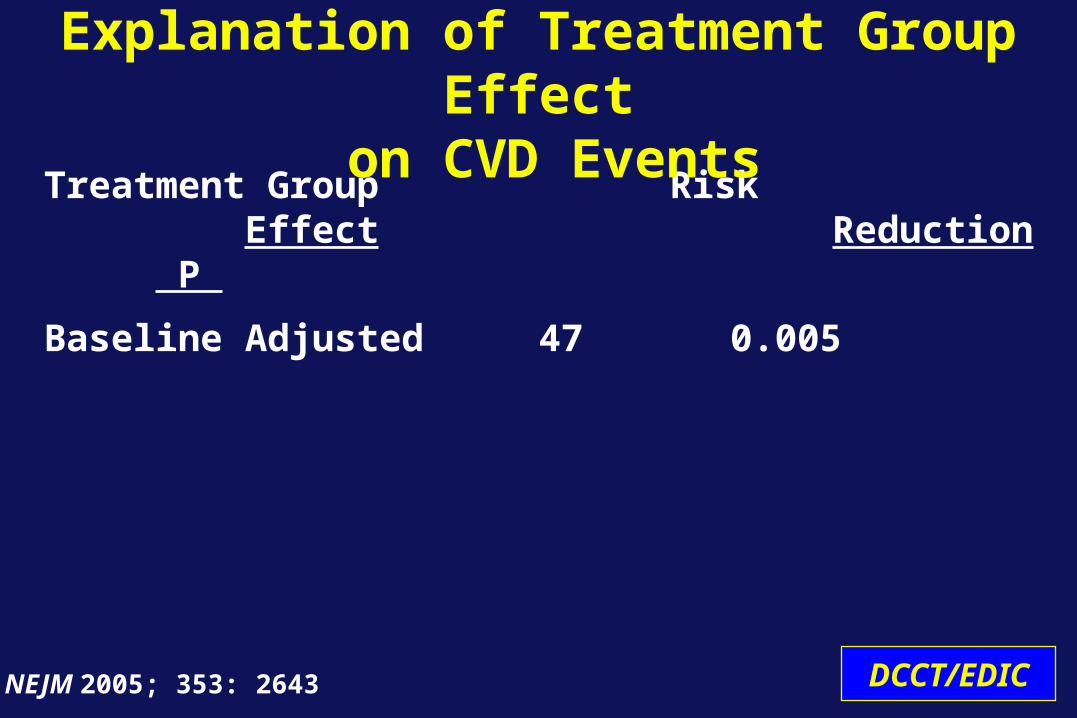
Treatment Group Risk Effect Reduction P
Baseline Adjusted 47 0.005
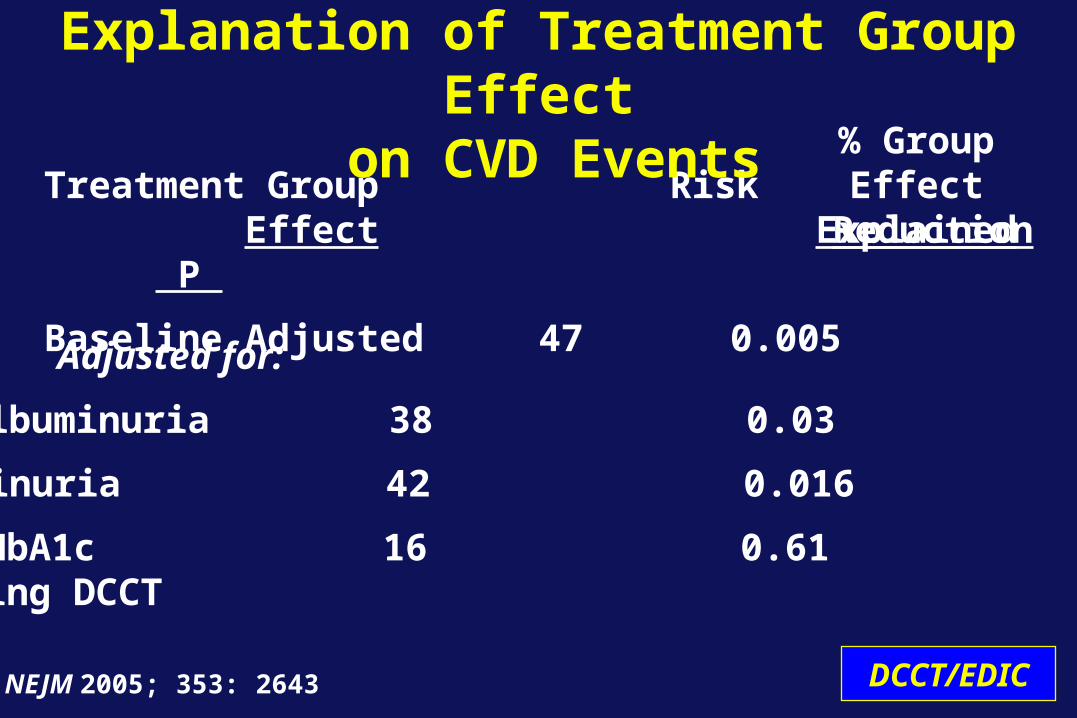
Explanation of Treatment Group Effect on CVD Events
DCCT/EDICNEJM 2005; 353: 2643
Treatment Group Risk Effect Reduction P
Baseline Adjusted 47 0.005
Explanation of Treatment Group Effect on CVD Events
DCCT/EDICNEJM 2005; 353: 2643
Albuminuria 42 0.016 29
Mean HbA1c 16 0.61 97 during DCCT
Microalbuminuria 38 0.03 45
Adjusted for:
% GroupEffect
Explained
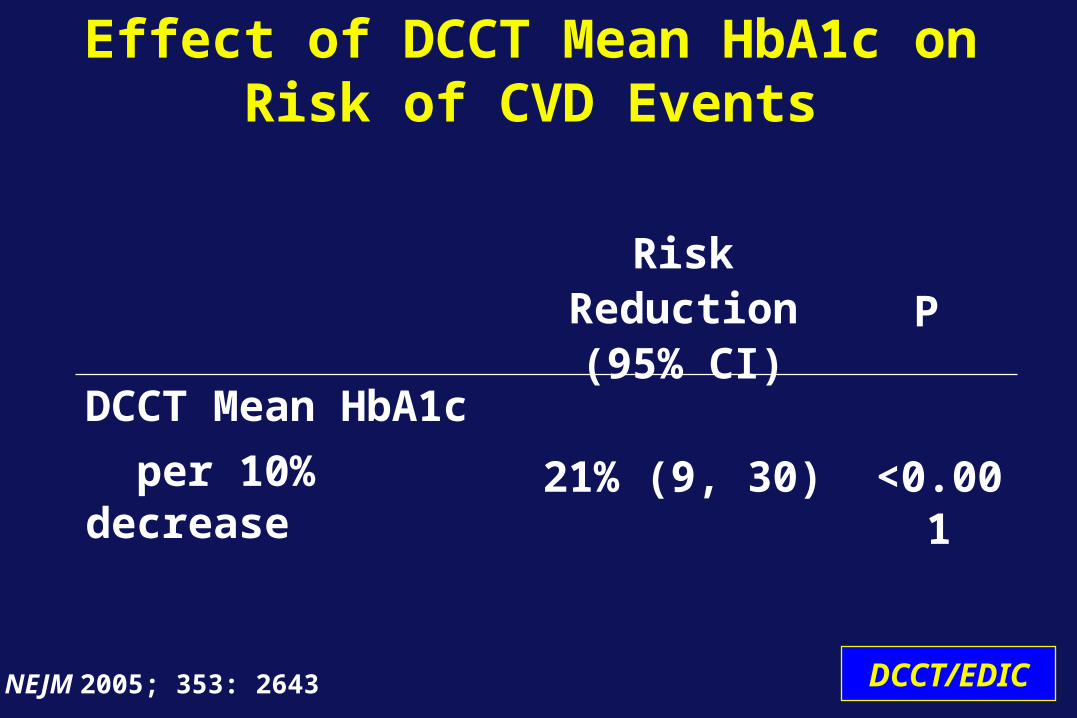
Effect of DCCT Mean HbA1c on Risk of CVD Events
Risk Reduction(95% CI) P
DCCT Mean HbA1c per 10% decrease 21% (9, 30) <0.001
DCCT/EDICNEJM 2005; 353: 2643
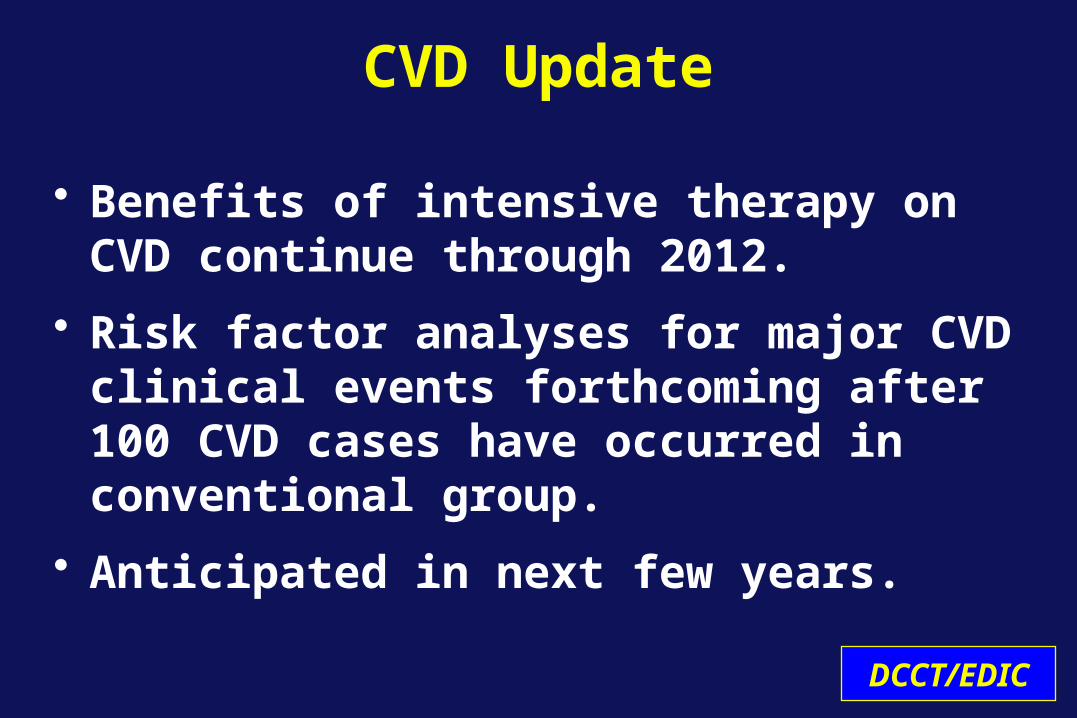
• Benefits of intensive therapy on CVD continue through 2012.
• Risk factor analyses for major CVD clinical events forthcoming after 100 CVD cases have occurred in conventional group.
• Anticipated in next few years.
CVD Update
DCCT/EDIC
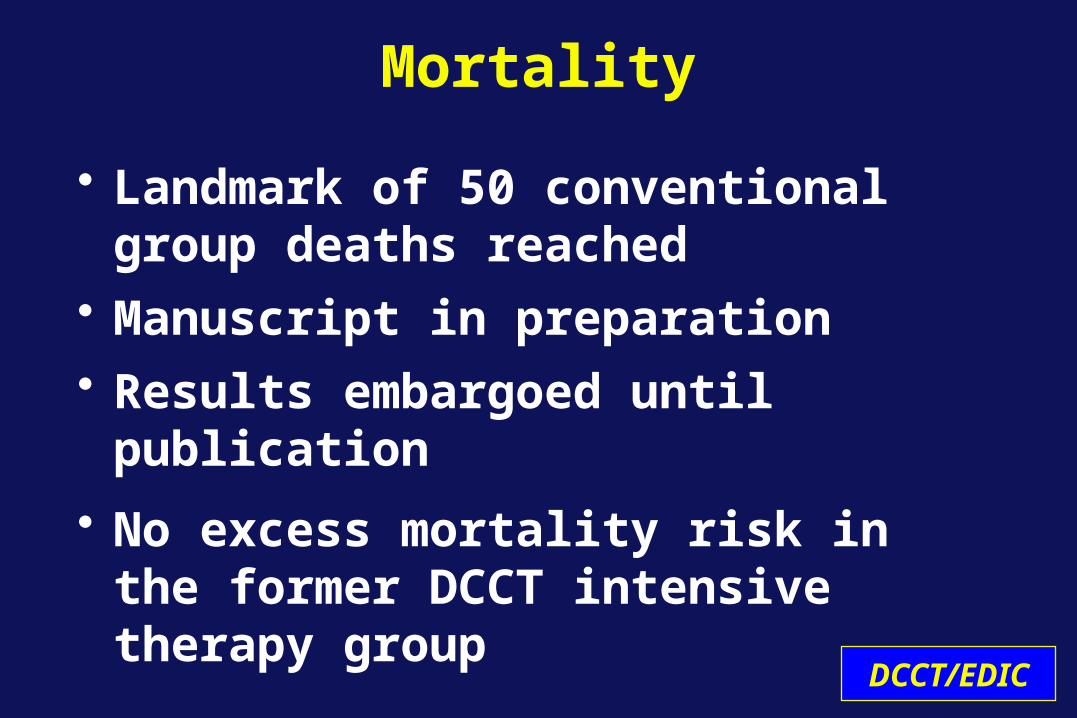
• Landmark of 50 conventional group deaths reached
• Manuscript in preparation• Results embargoed until publication
• No excess mortality risk in the former DCCT intensive therapy group
Mortality
DCCT/EDIC
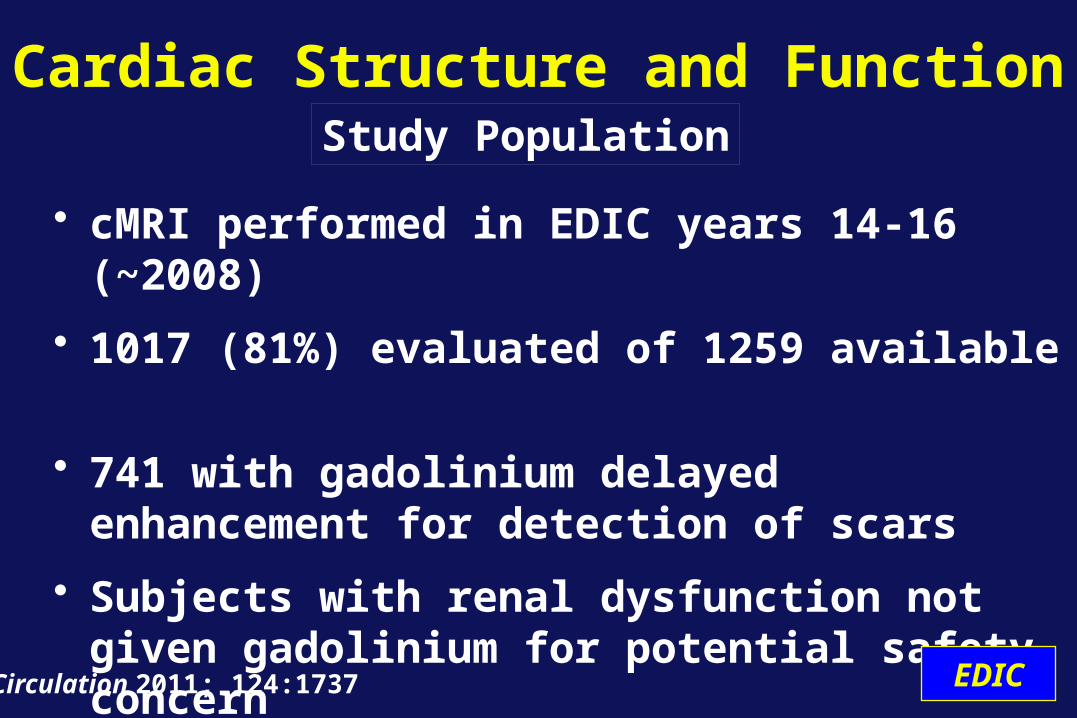
• cMRI performed in EDIC years 14-16 (~2008)
• 1017 (81%) evaluated of 1259 available
• 741 with gadolinium delayed enhancement for detection of scars
• Subjects with renal dysfunction not given gadolinium for potential safety concern
Cardiac Structure and Function
Circulation 2011; 124:1737 EDIC
Study Population
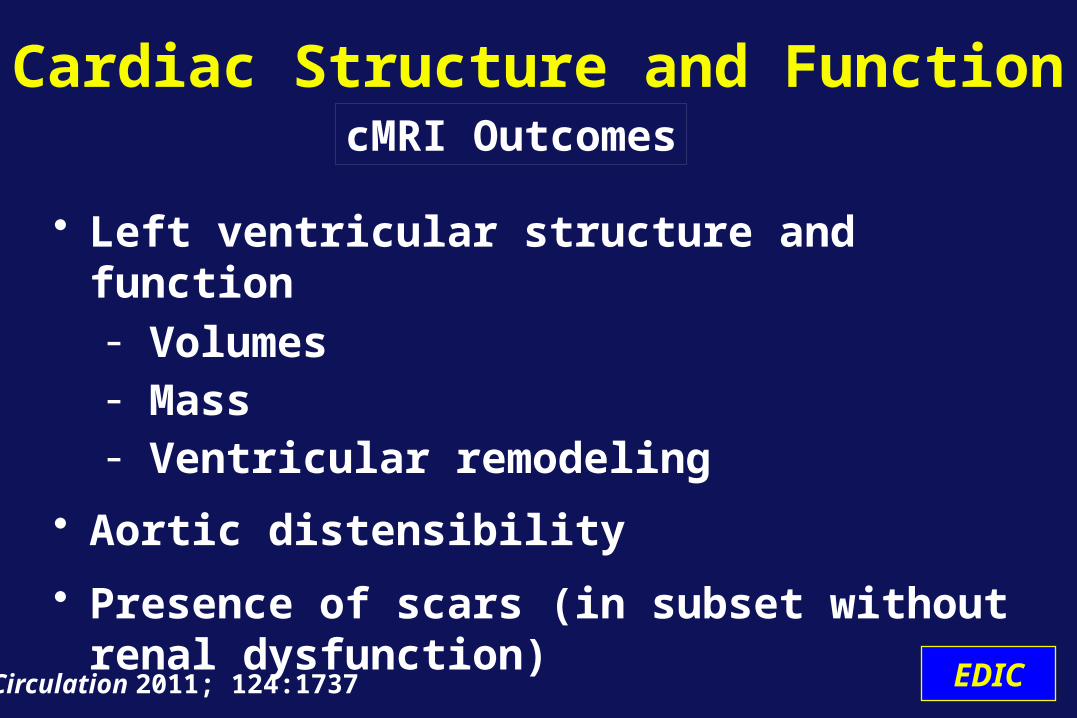
• Left ventricular structure and function- Volumes- Mass- Ventricular remodeling
• Aortic distensibility
• Presence of scars (in subset without renal dysfunction)
Cardiac Structure and Function
Circulation 2011; 124:1737 EDIC
cMRI Outcomes
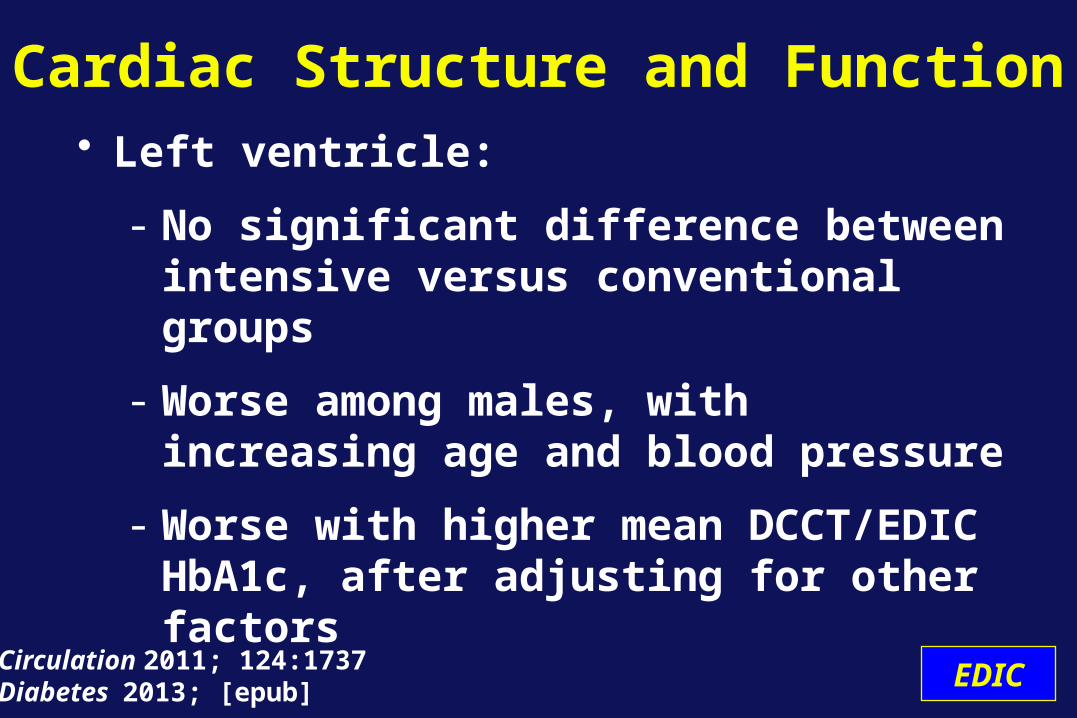
• Left ventricle:
- No significant difference between intensive versus conventional groups
- Worse among males, with increasing age and blood pressure
- Worse with higher mean DCCT/EDIC HbA1c, after adjusting for other factors
Cardiac Structure and Function
Circulation 2011; 124:1737 Diabetes 2013; [epub]
EDIC
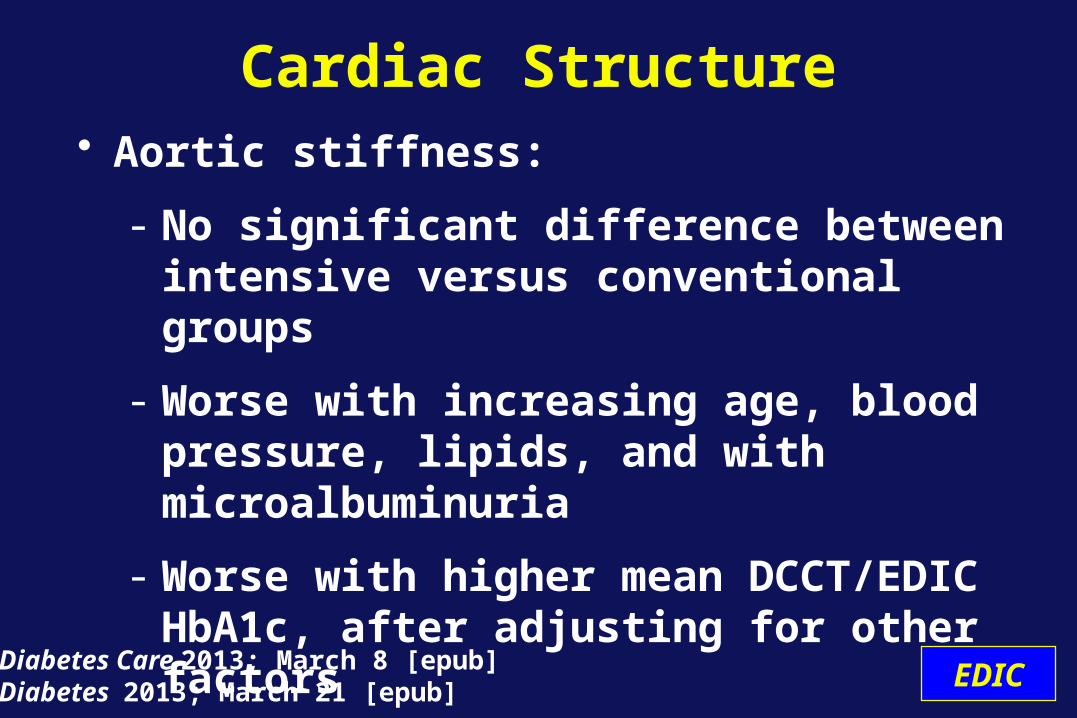
• Aortic stiffness:
- No significant difference between intensive versus conventional groups
- Worse with increasing age, blood pressure, lipids, and with microalbuminuria
- Worse with higher mean DCCT/EDIC HbA1c, after adjusting for other factors
Cardiac Structure
Diabetes Care 2013; March 8 [epub]Diabetes 2013; March 21 [epub]
EDIC
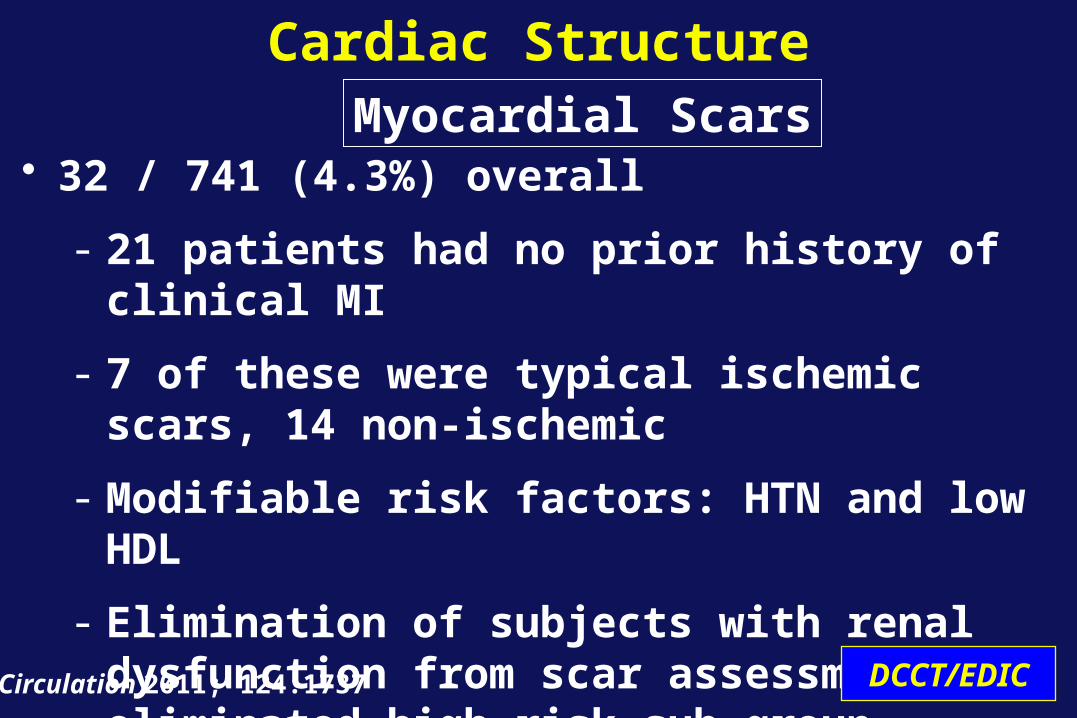
• 32 / 741 (4.3%) overall
- 21 patients had no prior history of clinical MI
- 7 of these were typical ischemic scars, 14 non-ischemic
- Modifiable risk factors: HTN and low HDL
- Elimination of subjects with renal dysfunction from scar assessment eliminated high risk sub-group
Cardiac StructureMyocardial Scars
Circulation 2011; 124:1737 DCCT/EDIC

• No differences between DCCT intensive versus conventional groups in cMRI measures of cardiac structure and function.
• Strong association with the history of glycemia over DCCT and EDIC combined.
Cardiac Structure and Function
DCCT/EDIC
Conclusions
The long-term beneficial effects of intensive therapy on CVD in the DCCT are:
• largely mediated by changes in glycemia during the DCCT
• mediated in part by reduction in the incidence of albuminuria
DCCT/EDIC
Atherosclerosis and Cardiac EventsConclusions
6.5 y of intensive therapy aimed at achieving near normoglycemia decreased:
• Progression of atherosclerosis as
measured by IMT and CAC• Aggregate CVD risk by 42% • Major CVD events by 57%.
DCCT/EDIC
Summary
Atherosclerosis and Cardiac Events
DCCT/EDIC
In the DCCT T1DM population, intensive glycemic therapy was
highly effective in decreasing the riskof cardiovascular disease
Summary
Atherosclerosis and Cardiac Events
Cheiroarthropathy
Defined as history of carpal tunnel syndrome, adhesive capsulitis, Dupuytren’s contracture, flexor tenosynovitis (“trigger finger”) and/or prayer sign on examination
DCCT/EDIC

Design
• Cross sectional analysis at EDIC yrs. 18/19• Targeted medical history and standardized
physical exam by certified staff• Self-administered questionnaire
DCCT/EDIC
Data Collection• History • Physical exam
–Prayer sign–Goniometry of shoulders
• Function measured with Disabilities of the Arm, Shoulder, and Hand (DASH) questionnaire–Self-administered, 30 item, validated –5 point scale, total score range (0-100)
DCCT/EDIC
Physical Assessment
• Visual assessment for presence of positive prayer sign
• Shoulder flexion measured by goniometry
• Subjects with deformities, old fractures, recent shoulder surgery, or stroke affecting upper extremities were excluded from measurements
DCCT/EDIC
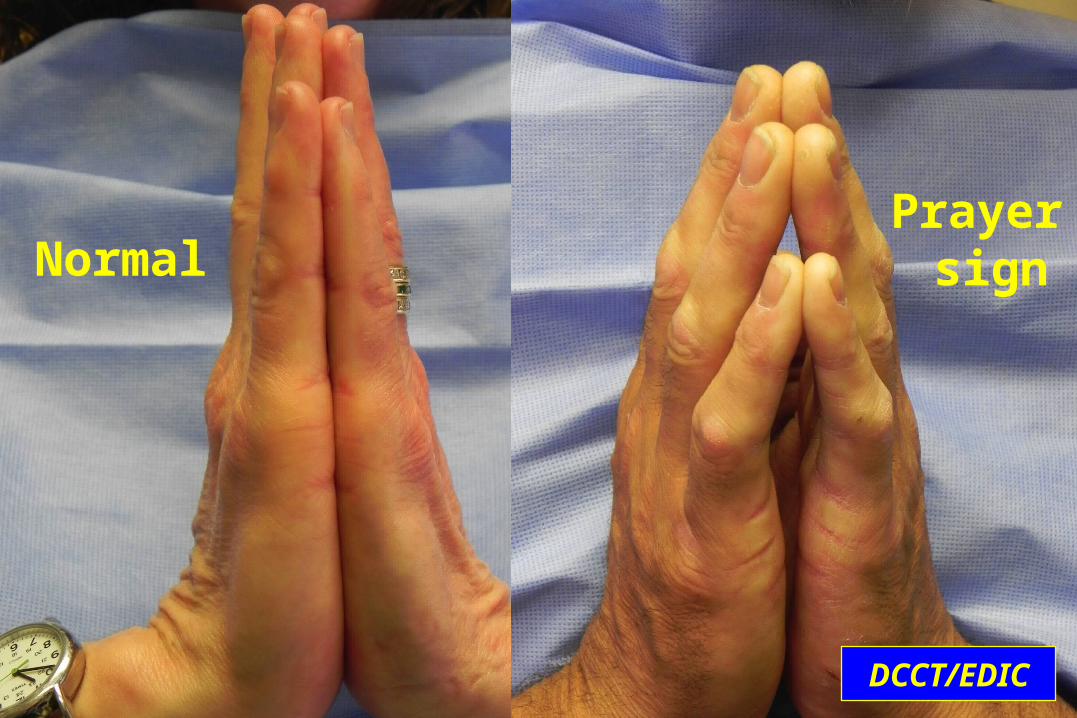
Prayer signNormal
DCCT/EDIC
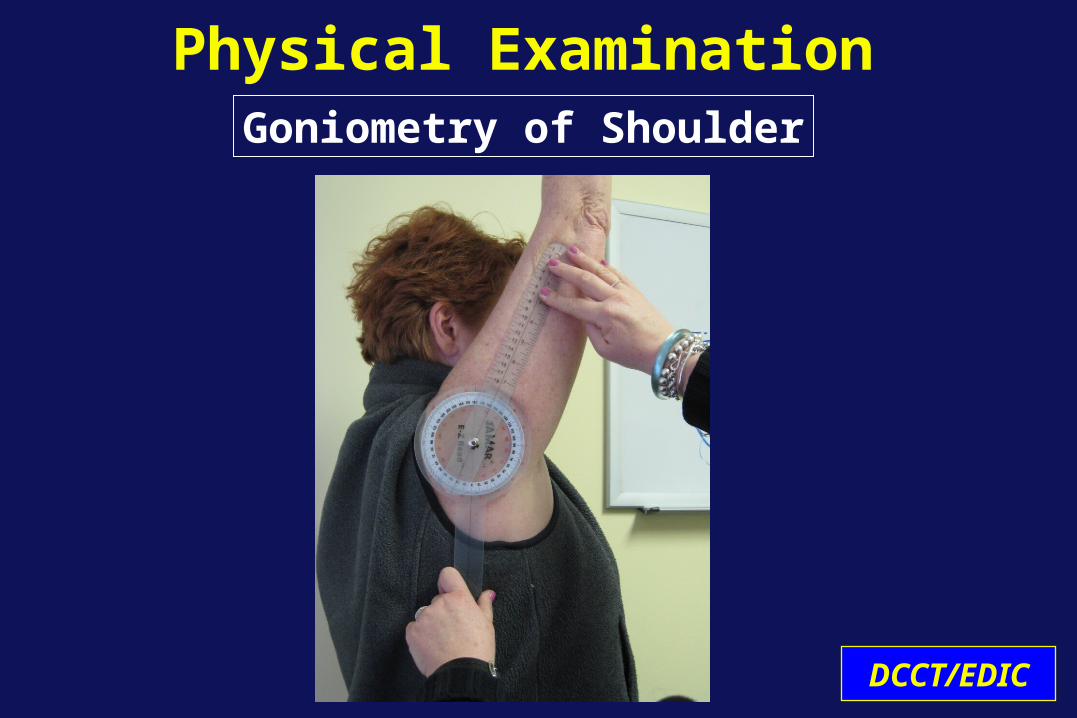
Physical ExaminationGoniometry of Shoulder
DCCT/EDIC

Data slides Removed pending publication
DCCT/EDIC
Recommendations and Future Directions
Rose A. Gubitosi-Klug, MD, PhDPrincipal Investigator
DCCT/EDIC Clinical Coordinating Center
DCCT/EDIC
DCCT/EDIC
Conclusions• Chronic glycemia and duration of diabetes
are the major factors in the development and progression of diabetes-specific complications in Type 1 diabetes.
• Intensive therapy that achieves lower glycemia is highly effective in reducing all complications, including severe disease.
• Lower HbA1c is better.
DCCT/EDIC
Recommendation
• Early intervention is most effective; if intensive therapy is delayed the momentum of complications is more difficult to slow.
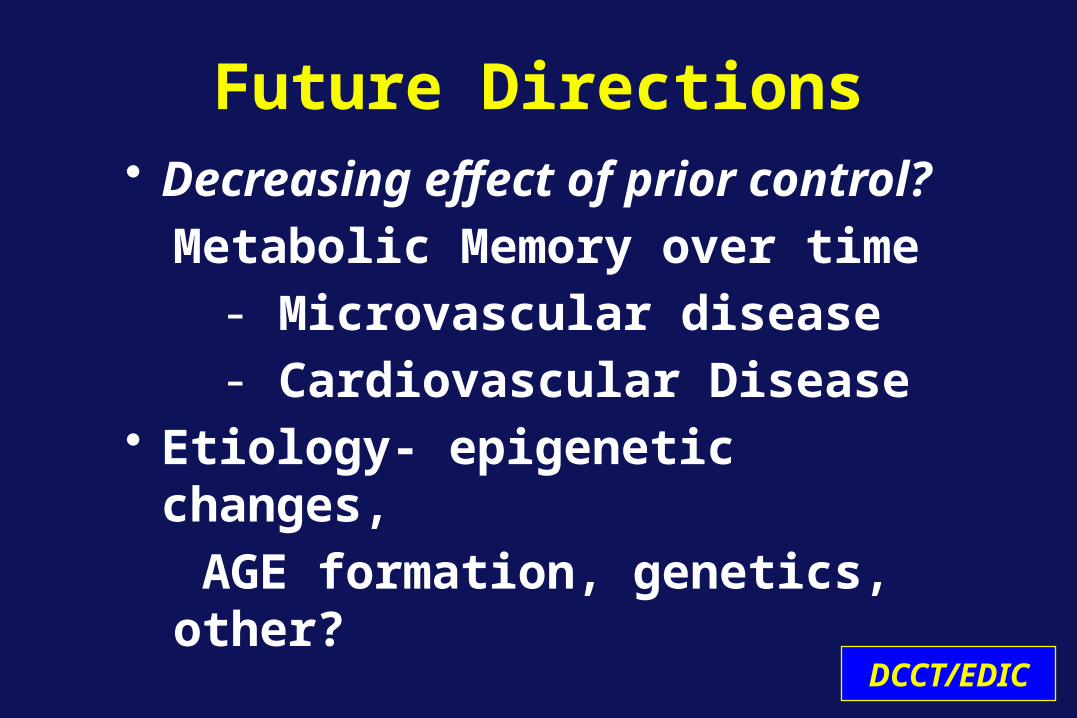
Future Directions• Decreasing effect of prior control?
Metabolic Memory over time- Microvascular disease- Cardiovascular Disease
• Etiology- epigenetic changes,
AGE formation, genetics, other?
DCCT/EDIC

DCCT/EDIC Ancillary Studies and Collaborations
DCCT/EDIC Core
University of TorontoGenetics
Medical University ofSouth Carolina
CVD-Program Project
Obesity, T2DM and Int. TherapyUniversity of Washington (Brunzell)
MonnierWeissSchaumbergRepository-oldRepository new
URO-EDIC 1
CVD ProjectUniv. Oklahoma
R 01
R 01IMT
JDRF
Cardiac MRIJohns Hopkins
CVD BiomarkersCleveland Clinic
NeurobehavioralJoslin (Jacobson)
2007-2012
R 01R 01
R 01
Dermal AGEsSCOUT
EpigeneticsCity of Hope
CAC
URO-EDIC 2Haptoglobin
GlycatedAlbumin
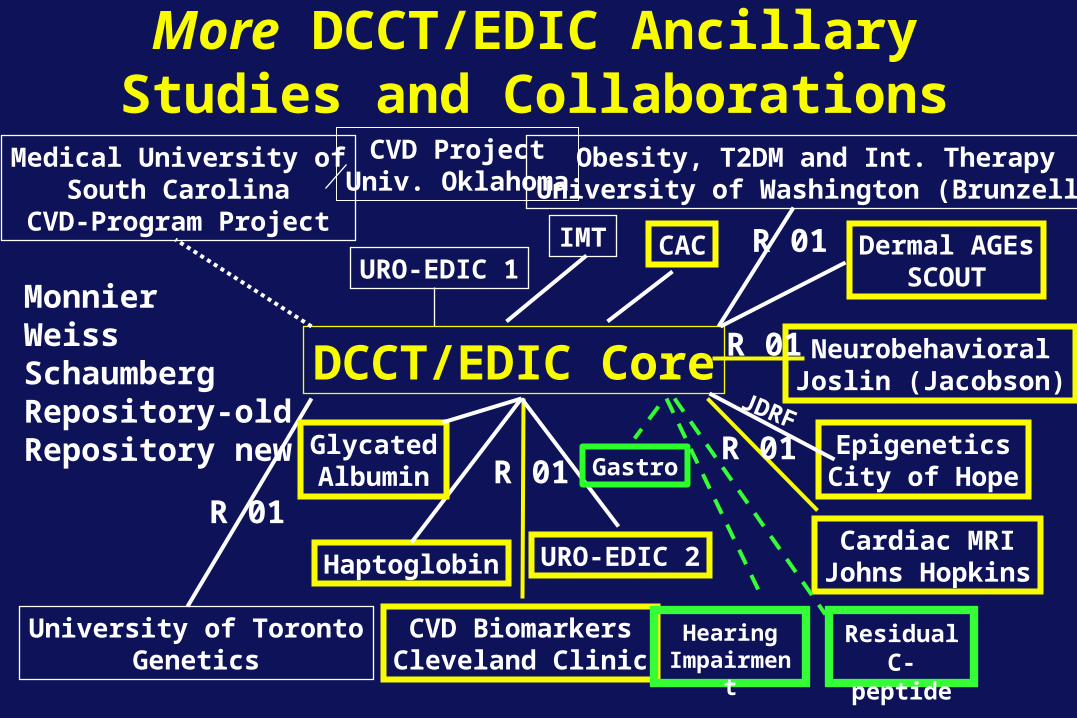
More DCCT/EDIC Ancillary Studies and Collaborations
DCCT/EDIC Core
University of TorontoGenetics
Medical University ofSouth Carolina
CVD-Program Project
Obesity, T2DM and Int. TherapyUniversity of Washington (Brunzell)
MonnierWeissSchaumbergRepository-oldRepository new
URO-EDIC 1
CVD ProjectUniv. Oklahoma
R 01
R 01IMT
JDRF
Cardiac MRIJohns Hopkins
CVD BiomarkersCleveland Clinic
NeurobehavioralJoslin (Jacobson)
R 01R 01
R 01
Dermal AGEsSCOUT
EpigeneticsCity of Hope
CAC
URO-EDIC 2Haptoglobin
GlycatedAlbumin
Hearing Impairment
ResidualC-peptide
Gastro

Effect of INT vs CONV Therapy on Residual Insulin Secretion
Ann Int Med 1998;128:517-23
Intensive
Conventional
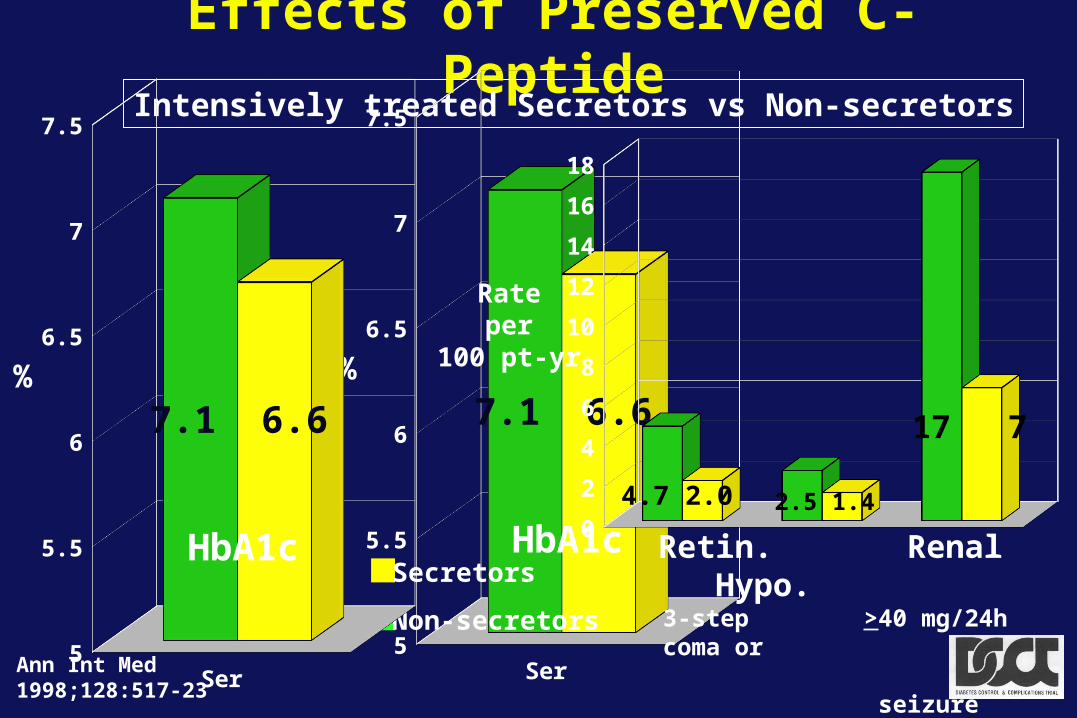
Effects of Preserved C-PeptideIntensively treated Secretors vs Non-secretors
Ann Int Med 1998;128:517-23
Series15
5.5
6
6.5
7
7.5
7.1 6.6
HbA1c
%
Secretors
Non-secretors
0
2
4
6
8
10
12
14
16
18
2.5 1.44.7 2.0
17 7
Retin. Renal Hypo. 3-step >40 mg/24h coma or seizure
Rateper
100 pt-yr
Series15
5.5
6
6.5
7
7.5
7.1 6.6
HbA1c
%
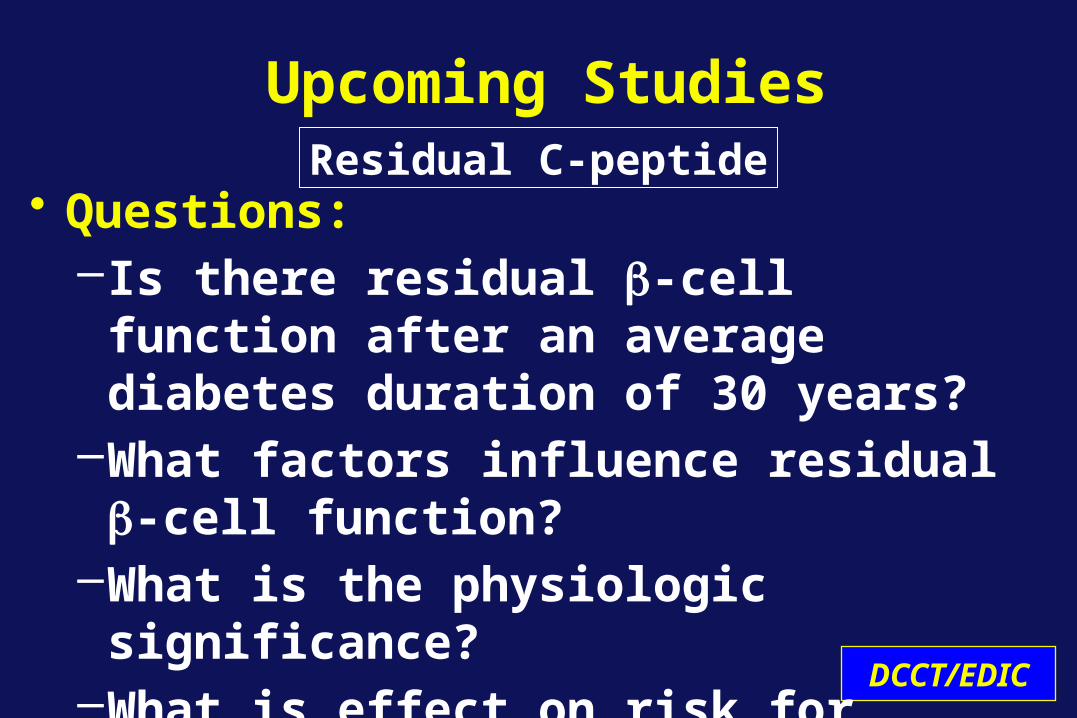
Upcoming Studies
DCCT/EDIC
• Questions: –Is there residual b-cell function after an
average diabetes duration of 30 years?–What factors influence residual b-cell
function? –What is the physiologic significance?–What is effect on risk for complications?
Residual C-peptide
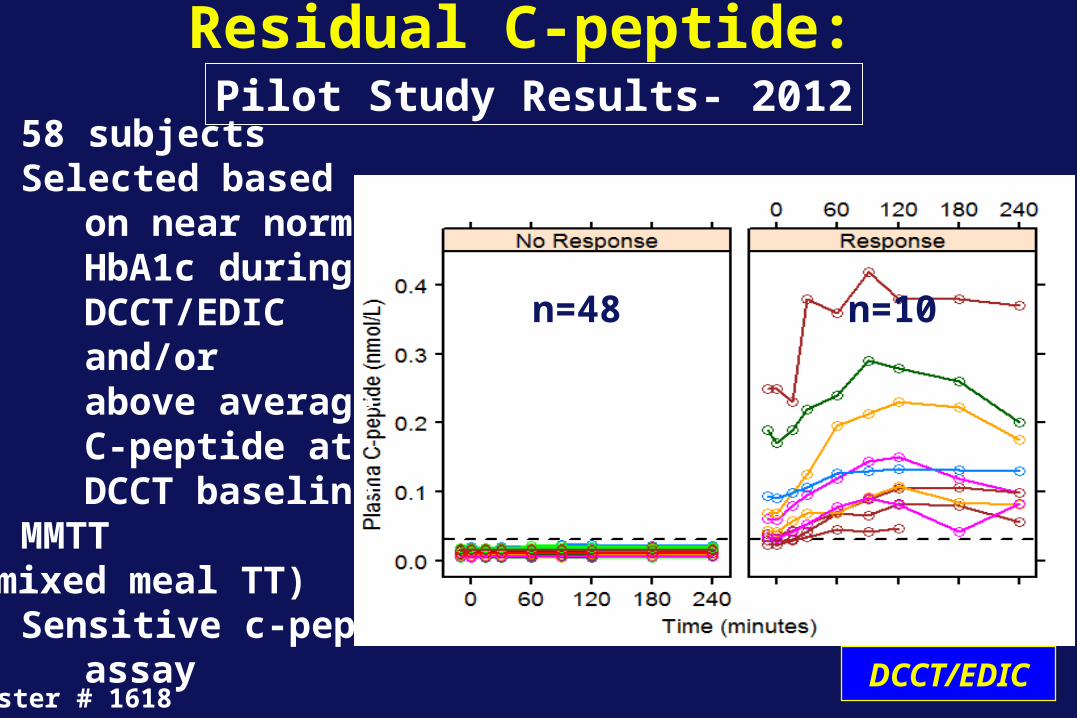
Residual C-peptide:
Poster # 1618
Pilot Study Results- 2012• 58 subjects• Selected based on near normal HbA1c during DCCT/EDIC and/or above average C-peptide at DCCT baseline• MMTT (mixed meal TT)• Sensitive c-pep assay
n=48 n=10
DCCT/EDIC
DCCT/EDIC
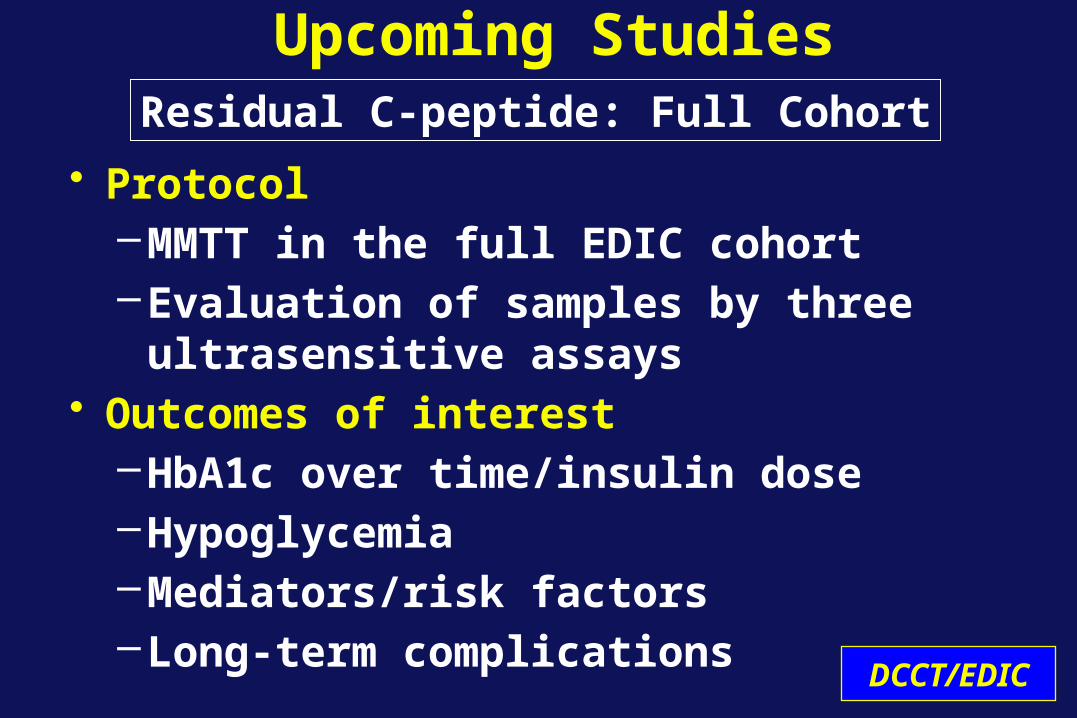
• Protocol–MMTT in the full EDIC cohort –Evaluation of samples by three
ultrasensitive assays• Outcomes of interest
–HbA1c over time/insulin dose–Hypoglycemia–Mediators/risk factors–Long-term complications
Residual C-peptide: Full Cohort
Upcoming Studies
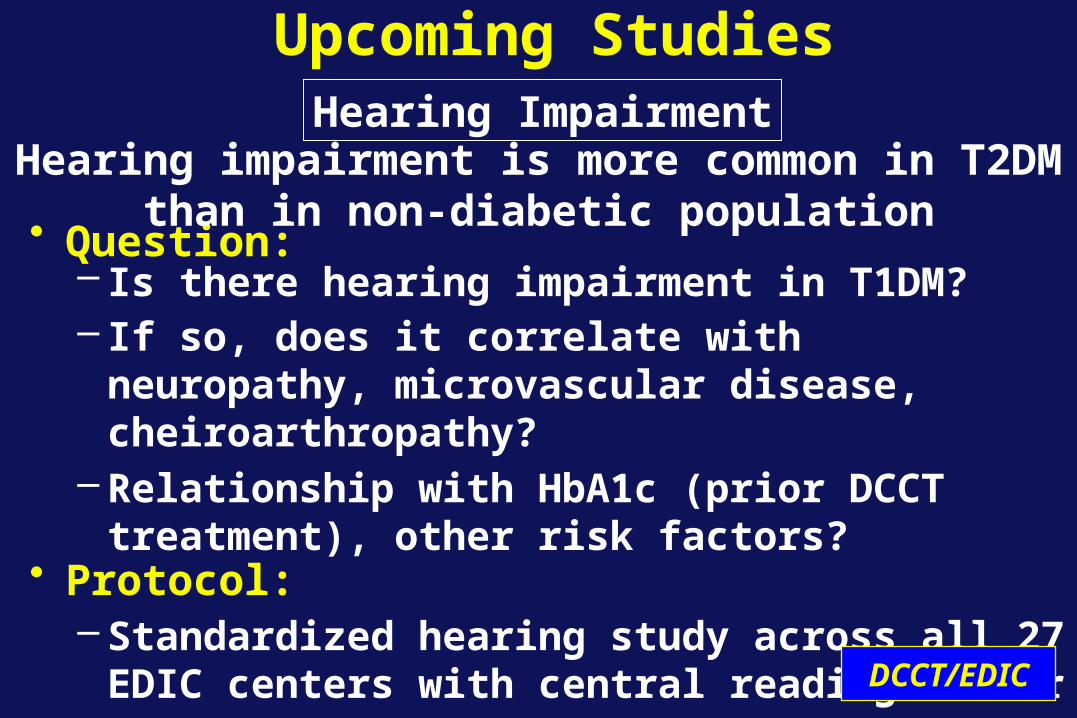
• Question: – Is there hearing impairment in T1DM?– If so, does it correlate with neuropathy,
microvascular disease, cheiroarthropathy?– Relationship with HbA1c (prior DCCT treatment),
other risk factors? • Protocol:
– Standardized hearing study across all 27 EDIC centers with central reading center
DCCT/EDIC
Upcoming StudiesHearing Impairment
Hearing impairment is more common in T2DM than in non-diabetic population
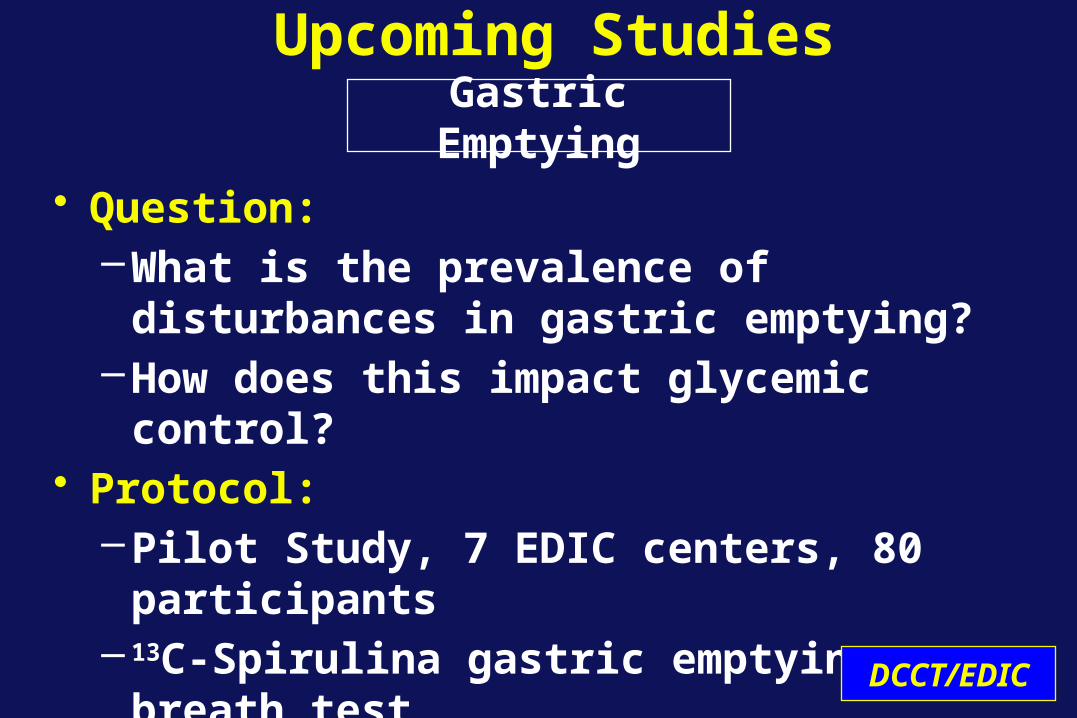
Gastric Emptying
• Question:–What is the prevalence of disturbances in
gastric emptying?–How does this impact glycemic control?
• Protocol:–Pilot Study, 7 EDIC centers, 80 participants– 13C-Spirulina gastric emptying breath test
DCCT/EDIC
Upcoming Studies
DCCT/EDIC 30th Anniversary Symposium Contributions and Progress
DCCT/EDIC
On behalf of the DCCT/EDIC Research GroupThank you for your attention