Embed Size (px)
Citation preview

Update on the Federal Air Quality Standards and Texas State
Implementation Plan
Marissa Gonzales and Heather Evans Air Quality Division
2012 Environmental Trade Fair

Air Quality Division • Update on the NAAQS and the SIP for Texas • MG and HE • May 1, 2012 • Page 2
Today’s Topics
• National Ambient Air Quality Standards (NAAQS)
• Status of Texas Air Quality Planning Activities
Air Quality Division • Update on the NAAQS and the SIP for Texas • MG and HE • May 2012• Page 3
National Ambient Air Quality Standards
Blue sky

Air Quality Division • Update on the NAAQS and the SIP for Texas • MG and HE • May 1, 2012 • Page 4
National Ambient Air Quality Standards (NAAQS)
• Required by the Federal Clean Air Act (FCAA)
• Set by the Environmental Protection Agency (EPA)
• Health-based standards
• Set for six criteria air pollutants: – Ground-Level Ozone – Particulate Matter (PM) – Nitrogen Dioxide (NO2) – Sulfur Dioxide (SO2) – Carbon Monoxide (CO) – Lead
Air Quality Division • Update on the NAAQS and the SIP for Texas • MG and HE • May 1, 2012 • Page 5
National Ambient Air Quality Standards
• The EPA is required to review these standards every five years. For more information on the review process go to the EPA’s NAAQS review Web page. (http://epa.gov/ttn/naaqs/review.html)
• States with counties failing to meet the NAAQS (nonattainment) are required to develop and submit State Implementation Plan (SIP) revisions to the EPA.

Air Quality Division • Update on the NAAQS and the SIP for Texas • MG and HE • May 1, 2012 • Page 6
• This slide contains a table that shows each criteria pollutant and the level that corresponds to its NAAQS. The information is:
• 8-Hour Carbon Monoxide (CO) NAAQS is 9 ppm • 1-Hour Carbon Monoxide (CO) NAAQS is 35 ppm • Rolling 3 Month Average Lead (Pb) NAAQS is 0.15 µg/m³ • Annual Nitrogen Dioxide (NO2) NAAQS is 0.053 ppm • 1-Hour Nitrogen Dioxide (NO2) NAAQS is 0.100 ppm • 24-Hour Particulate Matter (PM10) NAAQS is 150 µg/m³ • Annual Particulate Matter (PM2.5) NAAQS is 15 µg/m³ • 24 Hour Particulate Matter (PM2.5) NAAQS is 35 µg/m³ • 2008 8-Hour Ozone (O3) NAAQS is 0.075 ppm • 1-Hour Sulfur Dioxide (SO2) NAAQS is 75 ppb
Pollutant Level Averaging Time
CO 9 ppm 8-Hour
35 ppm 1-Hour
Lead 0.15 µg/m3 Rolling 3-Month Average
NO2
0.053 ppm Annual (Arithmetic Mean)
0.100 ppm 1-Hour
PM10 150 µg/m3 24-Hour
PM2.5
15.0 µg/m3 Annual (Arithmetic Mean)
35 µg/m3 24-Hour
Ozone 2008 0.075 ppm 8-Hour
Ozone 1997 0.08 ppm* 8-Hour
SO2 75 ppb 1-Hour
Current NAAQS
Note: Secondary NAAQS are the same as the primary NAAQS for all pollutants EXCEPT SO2, which has a secondary NAAQS for 0.5 ppm over three hours. More information can be found at EPA’s NAAQS webpage (http://epa.gov/air/criteria.html).
* In 1997, EPA revoked the one-hour ozone standard (0.12 ppm, not to be exceeded more than once per year) in all areas, although some areas have continued obligations under that standard (“anti-backsliding”).

Air Quality Division • Update on the NAAQS and the SIP for Texas • MG and HE • May 1, 2012 • Page 7
• This slide contains a table that shows each criteria pollutant and the schedule for the proposed rule and final rule
– The proposed rule for Ozone is to be announced October 2013. The final rule for Ozone is to be announced July 2014.
– The proposed rule for Sulfur Dioxide is to be announced December 2015, and the final rule is to be announced September 2016.
– The proposed rule for Particulate Matter is to be announced in the June 2012 and the final rule is to be announced June 2013.
– The proposed rule for Nitrogen Dioxide is to be announced June 2015, and the final rule is to be announced March 2016.
– The proposed rule for Lead is to be announced January 2014, and the final rule is to be announced November 2014.
– The proposed rule for Carbon Monoxide is to be announced May 2016, and the final rule is to be announced February 2017.
– The proposed rule for Nitrogen Oxides and Sulfur Oxides secondary standard was announced July 12, 2011, and the final rule was announced March 20, 2012.
Criteria Pollutant Proposed Rule Final Rule
Nitrogen Oxides (NOX) and Sulfur Oxides (SOX) Secondary Standard*
July 12, 2011 March 20, 2012
PM June 2012 June 2013
Ozone October 2013 July 2014
Lead January 2014 November 2014
NO2 June 2015 March 2016
SO2 December 2015 September 2016
CO May 2016 February 2017
NAAQS Review Schedule
*Dates are from previous revisions; the next revision schedule is yet to be determined.

Air Quality Division • Update on the NAAQS and the SIP for Texas • MG and HE • May 1, 2012 • Page 8
Calculating Eight-Hour Ozone Design Values
• Find the fourth highest eight-hour daily peak at each monitor.
• Average those fourth highest values from the most recent three years. Remember to do this for each monitor. This is the design value for each monitor.
• The design value for a county or Metropolitan Statistical Area (MSA) is the maximum design value from all of the monitors located within that county or MSA.
• A design value is valid if each year in the calculation has at least 75% valid data or if a design value with incomplete data is above the NAAQS.

Air Quality Division • Update on the NAAQS and the SIP for Texas • MG and HE • May 1, 2012 • Page 9
Calculating 2008 Eight-Hour Ozone Design Values: An Example
1. Monitor A has three years of complete data. 4th Highest Peak Eight-Hour Ozone for Monitor A was 95 in 2009, 88 in 2010 and 86 in 2011.
2. Take the 4th highest peak-hour ozone from each year and find the average.
3. Now truncate the average so there are no decimal places and you have the design value.
2009 2010 2011
Maximum Peak Eight-Hour Ozone 124 112 104
2nd Highest Peak Eight-Hour Ozone 105 100 101
3rd Highest Peak Eight Hour Ozone 98 92 96
4th Highest Peak Eight-Hour Ozone 95 88 86
Note: All units in parts per billion (ppb)

Air Quality Division • Update on the NAAQS and the SIP for Texas • MG and HE • May 1, 2012 • Page 10
Ozone Design Value Rounding Conventions
• Note that the 1997 eight-hour ozone standard is reported to two decimal places. – 0.084 ppm → 0.08 ppm → ATTAINMENT – 0.085 ppm → 0.09 ppm → NONATTAINMENT – Note that the standard is in parts per million
(ppm); if using parts per billion (ppb), 84 ppb would be attainment and 85 ppb would be nonattainment.
• The 2008 ozone standard is reported to three decimal places so rounding is no longer necessary. Anything past three decimal places is still truncated.

Air Quality Division • Update on the NAAQS and the SIP for Texas • MG and HE • May 1, 2012 • Page 11
Ozone Design Value Rounding Conventions
• Example – For the 2008 ozone standard of 0.075 ppm: – 0.075 ppm → ATTAINMENT – 0.076 ppm → NONATTAINMENT – If using ppb, 75 ppb would be attainment, and
76 ppb would be nonattainment.

Air Quality Division • Update on the NAAQS and the SIP for Texas • MG and HE • May 1, 2012 • Page 12
Region County 2011* 8hr
Ozone DV (ppb) DFW Tarrant 90 HGB Brazoria 89 HGB Harris 84 DFW Denton 83 DFW Dallas 82 DFW Collin 81 BPA Jefferson 79 DFW Johnson 79 HGB Galveston 78 DFW Parker 78 DFW Rockwall 77 NETX Gregg 77 DFW Hood 76 SAN Bexar 75 BPA Orange 75
NETX Smith 75 ARR Travis 75 DFW Ellis 74 HGB Montgomery 74 CC Nueces 72
WACO McLennan 72 NETX Harrison 72 ELP El Paso 71 VIC Victoria 70
BIG BEND Brewster 69** DFW Hunt 69 DFW Kaufman 68 LRGV Cameron 64 MEM Hidalgo 62
2011* Ozone Design Values
* 2011 data is as of March 20, 2012; it is not certified and is subject to change.
**Brewster County monitor is maintained by the US National Park Service; the design value is reported in EPA AQS.
Air Quality Division • Update on the NAAQS and the SIP for Texas • MG and HE • May 1, 2012 • Page 13
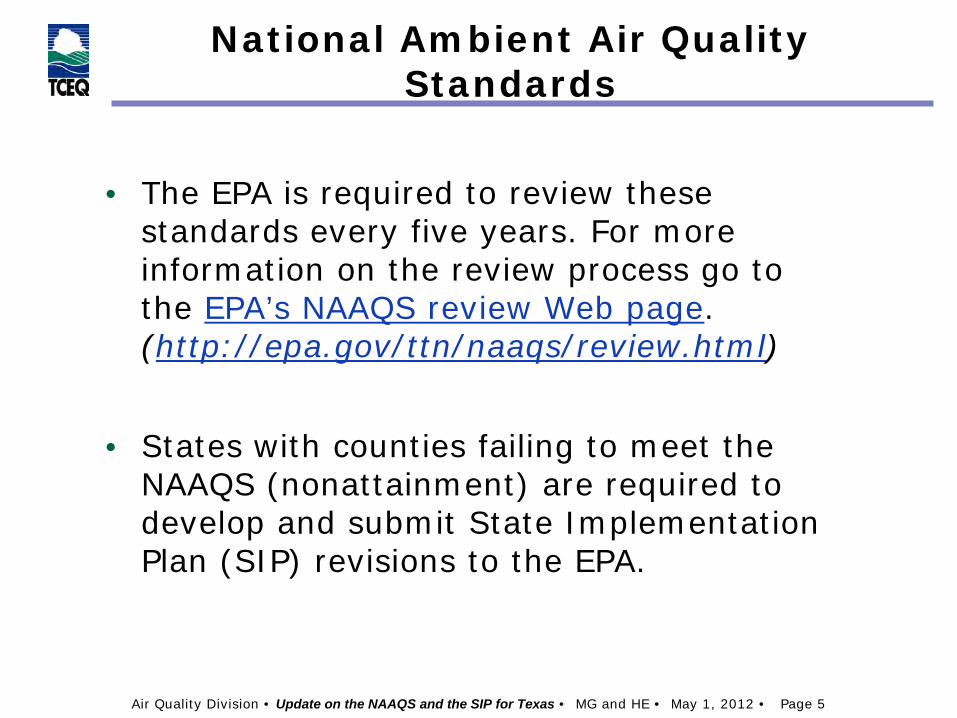
2011* SO2 Design Value
• Calculating SO2 Design Value – Three-year average of the 99th percentile one-hour
SO2 concentration – Requires at least 75% valid data; however, if
incomplete data give a design value higher than the NAAQS, that design value is used
• SO2 Design Values in Texas - all regulatory monitors currently meet the one-hour SO2 NAAQS
*2011 design values are as of March 20, 2012; they are not certified and are subject to change.

Air Quality Division • Update on the NAAQS and the SIP for Texas • MG and HE • May 1, 2012 • Page 14
2011* PM2.5 Design Values
• Calculating PM2.5 Design Values – Annual: Three-year average of the weighted annual
mean PM2.5 The weighted annual mean is the mean of the
four quarters. Each quarter requires at least 75% valid data.
– 24-Hour: Three-year average of the 98th percentile 24-hour PM2.5 concentration with at least 75% valid data per quarter
• PM2.5 Design Values in Texas – Annual: All areas are below the annual PM2.5 NAAQS
of 15.0 micrograms per cubic meter (µg/m3). – 24-Hour: All areas are below the 24-hour PM2.5
NAAQS of 35 µg/m3.
*2011 design values are as of March 20, 2012; they are not certified and are subject to change. Design Values may include exceptional event data.

Air Quality Division • Update on the NAAQS and the SIP for Texas • MG and HE • May 1, 2012 • Page 15
2011* PM10 Design Values
• 24-Hour: An exceedance-based standard that cannot be exceeded more than once per year on average over a three-year period
• PM10 monitors do not sample every day
• Number of expected exceedances used
• PM10 Design Values in Texas – 24-Hour:
El Paso County 2011* design value is 6.1 expected exceedances.
All other counties in Texas meet the PM10 24-Hour NAAQS.
*2011 design values as of March 20, 2012; they are not certified and are subject to change. Design Values may include exceptional event data.

Air Quality Division • Update on the NAAQS and the SIP for Texas • MG and HE • May 1, 2012 • Page 16
2011* NO2 Design Values
• Calculating NO2 Design Values
– Annual: Annual average of the one-hour NO2 concentrations
– One-Hour: Three-year average of the 98th percentile one-hour NO2 concentration
• NO2 Design Values in Texas
– Annual: All areas are below annual NO2 NAAQS of 0.053 ppm.
– One-Hour: All areas are below one-hour NO2 NAAQS of 0.100 ppm.
*2011 design values are as of March 20, 2012; they are not certified and are subject to change.
Air Quality Division • Update on the NAAQS and the SIP for Texas • MG and HE • May 1, 2012 • Page 17
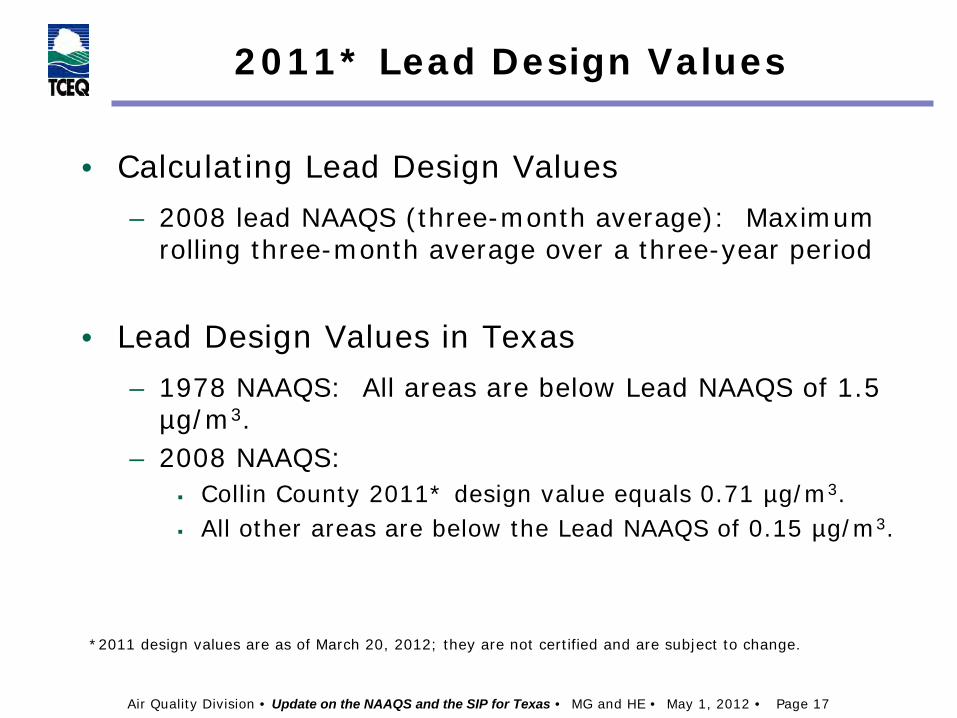
2011* Lead Design Values
• Calculating Lead Design Values
– 2008 lead NAAQS (three-month average): Maximum rolling three-month average over a three-year period
• Lead Design Values in Texas
– 1978 NAAQS: All areas are below Lead NAAQS of 1.5 µg/m3.
– 2008 NAAQS: Collin County 2011* design value equals 0.71 µg/m3. All other areas are below the Lead NAAQS of 0.15 µg/m3.
*2011 design values are as of March 20, 2012; they are not certified and are subject to change.
Air Quality Division • Update on the NAAQS and the SIP for Texas • MG and HE • May 1, 2012 • Page 18
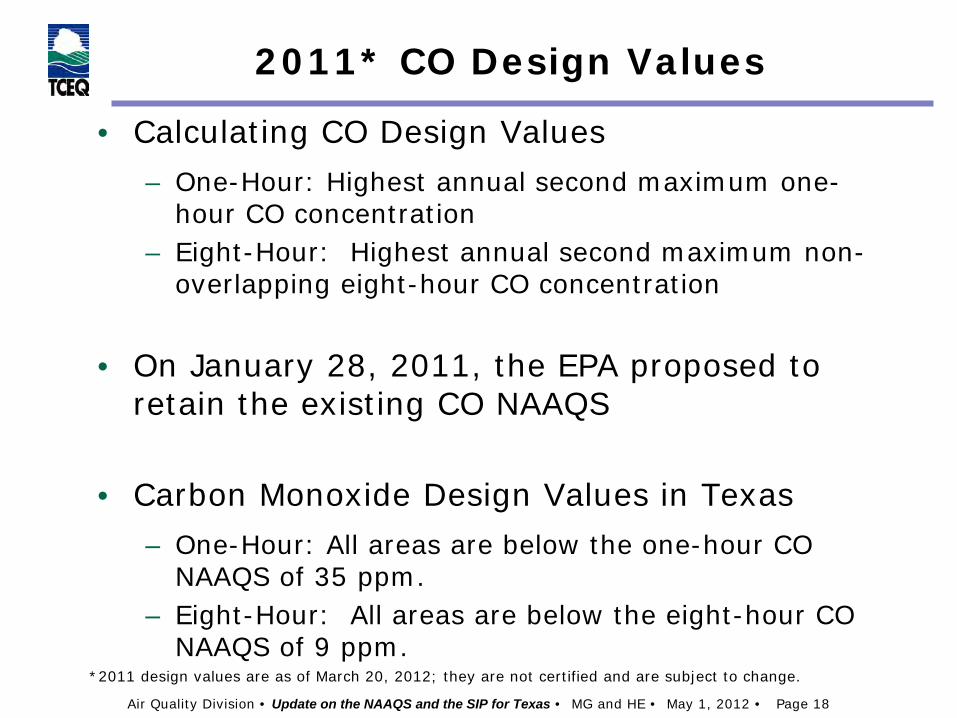
2011* CO Design Values
• Calculating CO Design Values
– One-Hour: Highest annual second maximum one-hour CO concentration
– Eight-Hour: Highest annual second maximum non-overlapping eight-hour CO concentration
• On January 28, 2011, the EPA proposed to retain the existing CO NAAQS
• Carbon Monoxide Design Values in Texas
– One-Hour: All areas are below the one-hour CO NAAQS of 35 ppm.
– Eight-Hour: All areas are below the eight-hour CO NAAQS of 9 ppm.
*2011 design values are as of March 20, 2012; they are not certified and are subject to change.
Air Quality Division • Update on the NAAQS and the SIP for Texas • MG and HE • May 1, 2012 • Page 19
Texas State Implementation Plan

Air Quality Division • Update on the NAAQS and the SIP for Texas • MG and HE • May 1, 2012 • Page 20
When is a SIP Revision Needed?
• EPA revises or adds a NAAQS
• EPA or the state revises or adds rules
• An area attains the NAAQS
• An area does not attain the standard during the specified timeframe
• An area is reclassified

Air Quality Division • Update on the NAAQS and the SIP for Texas • MG and HE • May 1, 2012 • Page 21
Consequences of an Inadequate SIP
Federal Implementation Plan
Federal highway funding cut-off
Federal air permits are more difficult to obtain

Air Quality Division • Update on the NAAQS and the SIP for Texas • MG and HE • May 1, 2012 • Page 22
Components of a SIP Revision

Air Quality Division • Update on the NAAQS and the SIP for Texas • MG and HE • May 1, 2012 • Page 23
Components of a SIP Revision
• Monitoring Data – Used to determine whether an area meets the NAAQS – Used to analyze trends
• Emissions Inventory – Used to quantify all sources of emissions – Used to determine potential control strategies
• Photochemical Modeling – Used to estimate the reductions needed to attain the NAAQS – Used to validate effectiveness of control strategies
• Control Measures – Implemented through rule revision, memorandums of
agreement, ordinances, or voluntary actions

Air Quality Division • Update on the NAAQS and the SIP for Texas • MG and HE • May 1, 2012 • Page 24
Emissions Inventory Source Examples
• Point – Refineries, electric generating facilities
• Area – Temporary generators, painting, gas stations, etc.
• On-road mobile – Cars, trucks
• Non-road mobile – Construction equipment, trains, planes
• Biogenic – Based on estimates of vegetation type/quantity

Air Quality Division • Update on the NAAQS and the SIP for Texas • MG and HE • May 1, 2012 • Page 25
Photochemical Modeling
• Computer simulation of atmospheric chemistry and meteorological conditions.
• Prediction tool to help determine the most effective way to reduce ozone pollution.

Air Quality Division • Update on the NAAQS and the SIP for Texas • MG and HE • May 2012• Page 26
Photochemical Modeling
Real World Situation Computer Grid Simulation

Air Quality Division • Update on the NAAQS and the SIP for Texas • MG and HE • May 1, 2012 • Page 27
Control Measures
• Technical work helps determine what types of measures
• Development includes stakeholder process
• Commission adopts rules
• Local governments adopt ordinances
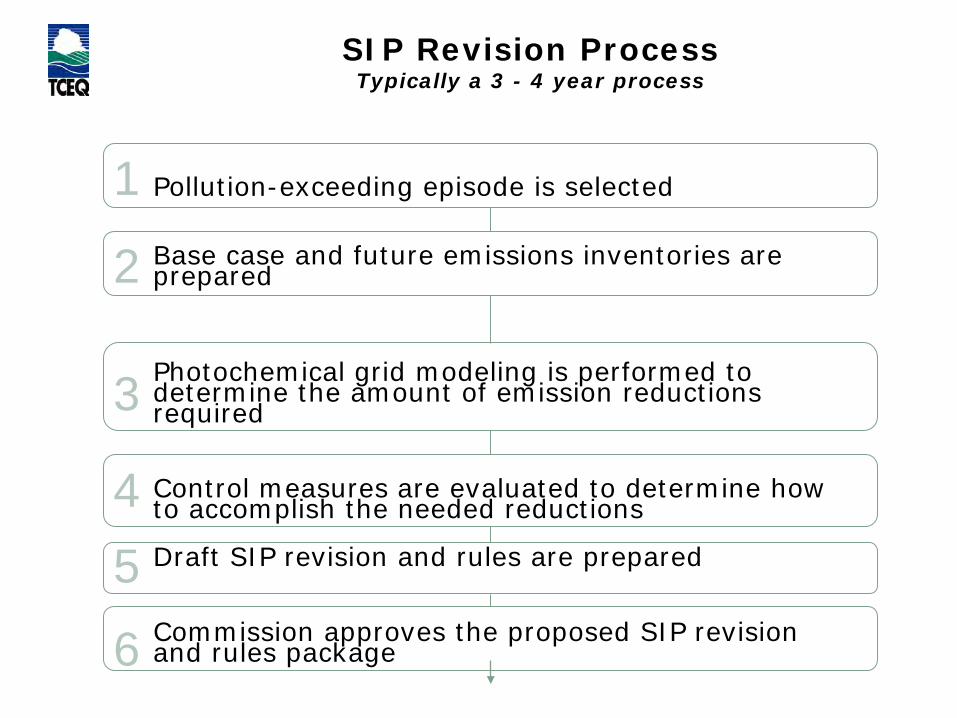
SIP Revision Process Typically a 3 - 4 year process
Pollution-exceeding episode is selected Base case and future emissions inventories are prepared Photochemical grid modeling is performed to determine the amount of emission reductions required Control measures are evaluated to determine how to accomplish the needed reductions Draft SIP revision and rules are prepared Commission approves the proposed SIP revision and rules package
1
2
3
4 5
6

Air Quality Division • Update on the NAAQS and the SIP for Texas • MG and HE • May 1, 2012 • Page 29
SIP Revision Process Typically a 3 - 4 year process
Formal public review and comment period with a public hearing
Response to comments are prepared and options are reviewed based on comments Proposed control measures are re-quantified and re-modeled Final revisions are made to SIP and rulemaking packages Commission adopts final rules and SIP revision packages The state submits the complete rule and SIP revision packages to the EPA
7
8
9
10
11
12

Status of Texas Air Quality
Planning Efforts

Air Quality Division • Update on the NAAQS and the SIP for Texas • MG and HE • May 1, 2012 • Page 31
Status of Texas Air Quality Planning Efforts
• Criteria Pollutants – Ozone – Lead – SO2
– NO2
– PM – CO
• Other Statewide Air Issues – Cross-State Air Pollution Rule (aka Transport) – Regional Haze

Air Quality Division • Update on the NAAQS and the SIP for Texas • MG and HE • May 2012• Page 32
Texas Air Quality Planning Areas

Air Quality Division • Update on the NAAQS and the SIP for Texas • MG and HE • May 2012• Page 33
Ozone

Air Quality Division • Update on the NAAQS and the SIP for Texas • MG and HE • May 1, 2012 • Page 34
1997 Eight-Hour Ozone Standard
• Standard is 0.08 ppm – Design value must be greater than or equal to
85 ppb
• Houston-Galveston-Brazoria (HGB) – Brazoria, Chambers, Fort Bend, Galveston,
Harris, Liberty, Montgomery, and Waller Counties
• Dallas-Fort Worth (DFW) – Collin, Dallas, Denton, Ellis, Johnson, Kaufman,
Parker, Rockwall, and Tarrant Counties

Air Quality Division • Update on the NAAQS and the SIP for Texas • MG and HE • May 1, 2012 • Page 35
2008 Eight-Hour Ozone Standard
• Standard is 0.075 ppm – Design value must be greater than 75 ppb
• HGB Area – TCEQ recommends same eight counties – EPA proposes adding Matagorda County
• DFW Area – TCEQ recommends same nine counties – EPA proposes adding Hood and Wise Counties

Air Quality Division • Update on the NAAQS and the SIP for Texas • MG and HE • May 1, 2012 • Page 36
• EPA to finalize designations by May 31, 2012
• First portion of implementation rules published 2/14/12
• Final guidance released - “Ozone Advance”
2008 Eight-Hour Ozone Standard

Air Quality Division • Update on the NAAQS and the SIP for Texas • MG and HE • May 1, 2012 • Page 37
HGB Area
• Severe ozone nonattainment area for the 1997 standard
• Attainment deadline no later than June 2019
• 3/10/10 – Attainment Demonstration and Reasonable Further Progress revisions adopted

Air Quality Division • Update on the NAAQS and the SIP for Texas • MG and HE • May 1, 2012 • Page 38
HGB Area
• 12/7/11 - Reasonably Available Control Technology analysis to include Control Techniques Guidelines adopted
• October 2012 – proposed SIP revision planned to update Motor Vehicle Emission Budgets – Applies to attainment demonstration and RFP
budgets – Necessary for transportation conformity purposes

Air Quality Division • Update on the NAAQS and the SIP for Texas • MG and HE • May 1, 2012 • Page 39
DFW Area
• Reclassified to serious nonattainment effective January 19, 2011
• Attainment deadline no later than June 2013
• Attainment Demonstration and RFP SIP revisions adopted December 2011

Air Quality Division • Update on the NAAQS and the SIP for Texas • MG and HE • May 1, 2012 • Page 40
Beaumont-Port Arthur (BPA) Area
• Attainment (maintenance) for 1997 standard
• Re-designation request and maintenance plan approved November 2010
• June 2012 – proposed SIP revision planned to update Motor Vehicle Emission Budgets – Applies to 2021 maintenance budgets
• Proposed as attainment/unclassifiable under the 2008 standard

Air Quality Division • Update on the NAAQS and the SIP for Texas • MG and HE • May 1, 2012 • Page 41
El Paso Area
• Attainment (maintenance) for 1997 standard
• Maintenance SIP approved in 2009
• Proposed as attainment/unclassifiable under 2008 standard

Air Quality Division • Update on the NAAQS and the SIP for Texas • MG and HE • May 1, 2012 • Page 42
Victoria Area
• Attainment for the 1997 standard
• Proposed as attainment/unclassifiable under 2008 standard
• Maintenance SIP revision was submitted to EPA March 2007
• Contingency plan SIP revision was adopted in July 2010

Air Quality Division • Update on the NAAQS and the SIP for Texas • MG and HE • May 1, 2012 • Page 43
Additional Areas
• Austin, Corpus Christi, Northeast Texas, and San Antonio all proposed as attainment-unclassifiable under 2008 standard
• Previously developed voluntary emission reduction programs (ozone flex, early action compacts) to maintain attainment status
• Ozone Advance could be pursued

Air Quality Division • Update on the NAAQS and the SIP for Texas • MG and HE • May 1, 2012 • Page 44
Additional Areas
• Lower Rio Grande Valley
• Brewster County (Big Bend)
• McLennan County (Waco)
• All proposed as attainment/unclassifiable under 2008 standard

Air Quality Division • Update on the NAAQS and the SIP for Texas • MG and HE • May 2012• Page 45
Lead

Air Quality Division • Update on the NAAQS and the SIP for Texas • MG and HE • May 1, 2012 • Page 46
Lead
• Portion of Collin County nonattainment for the 2008 lead NAAQS
• Attainment demonstration due by June 30, 2012
• SIP revision proposed by TCEQ in June 2011; scheduled for adoption May 30, 2012
• Interstate transport SIP revision for lead adopted by TCEQ August 2011

Air Quality Division • Update on the NAAQS and the SIP for Texas • MG and HE • May 2012• Page 47
Sulfur Dioxide

Air Quality Division • Update on the NAAQS and the SIP for Texas • MG and HE • May 1, 2012 • Page 48
2010 SO2 NAAQS
• Final designations expected summer 2012 – Jefferson Co. recommended for nonattainment
based on 2008-2010 data – 2009-2011 data shows attainment for Jefferson Co. – New data and revised recommendation sent to EPA – Data for other areas to be submitted when certified
• Infrastructure and transport SIP revisions due June 2013
• Attainment demonstration due February 2014

Air Quality Division • Update on the NAAQS and the SIP for Texas • MG and HE • May 1, 2012 • Page 49
2010 SO2 NAAQS
• Initially monitoring/modeling “hybrid” approach introduced to assess compliance or demonstrate attainment
• EPA recent letter indicates: – Stakeholder groups to be established to determine
implementation requirements – Areas with monitored violations to be
nonattainment – All other areas to be unclassifiable
Air Quality Division • Update on the NAAQS and the SIP for Texas • MG and HE • May 1, 2012 • Page 50
SO2 Litigation and Current Status
• Litigation ongoing (D.C. Circuit Court of Appeals) – Court decision possible in mid/late 2012
• The 2010 SO2 NAAQS remains effective (pending litigation outcome)
• Proposed guidance published October 2011
• Additional SO2 monitors required by Jan 2013

Air Quality Division • Update on the NAAQS and the SIP for Texas • MG and HE • May 2012• Page 51
Particulate Matter

Air Quality Division • Update on the NAAQS and the SIP for Texas • MG and HE • May 1, 2012 • Page 52
PM10 and PM2.5
• City of El Paso is moderate nonattainment area for 24-hour PM10 standard
• SIP revision adopted January 25, 2012 – Incorporates revised Memorandum of Agreement
and Chapter 111 rule change for PM10
• All areas in Texas classified as attainment/unclassifiable for PM2.5

Air Quality Division • Update on the NAAQS and the SIP for Texas • MG and HE • May 2012• Page 53
Nitrogen Dioxide

Air Quality Division • Update on the NAAQS and the SIP for Texas • MG and HE • May 1, 2012 • Page 54
2010 NO2 NAAQS
• Final rule published February 2010
• New monitoring network requirements
• Two near-road monitors required in DFW and HGB areas (1 in each) by January 1, 2013
• Two near-road monitors required in Austin and San Antonio areas (1 in each) by January 1, 2014
Air Quality Division • Update on the NAAQS and the SIP for Texas • MG and HE • May 1, 2012 • Page 55
2010 NO2 NAAQS
• Initial designations published February 2012
• All areas of the U. S. unclassifiable/attainment
• EPA to re-designate areas once three years of data collected from new monitors (likely 2016-2017 time frame)
• Infrastructure and Transport SIP proposal anticipated for June 2012; adoption in November 2012
Air Quality Division • Update on the NAAQS and the SIP for Texas • MG and HE • May 2012• Page 56
Carbon Monoxide

Air Quality Division • Update on the NAAQS and the SIP for Texas • MG and HE • May 1, 2012 • Page 57
CO NAAQS
• Final rule to retain the CO NAAQS published August 15, 2011
• Requires one CO monitor to be collocated with one required near-road NO2 monitor in Core Based Statistical Areas with populations of 1 million or more persons*
• All areas in Texas attainment for CO
Air Quality Division • Update on the NAAQS and the SIP for Texas • MG and HE • May 2012• Page 58
Cross State Air Pollution Rule
(CSAPR)

Air Quality Division • Update on the NAAQS and the SIP for Texas • MG and HE • May 1, 2012 • Page 59
CSAPR
• Replaces the Clean Air Interstate Rule (CAIR)
• Addresses 1997 ozone and PM2.5 and 2006 PM2.5 NAAQS
• Requires 28 states to reduce power plant emissions that cross state lines
• Relies on cap and trade programs, with state-level budget caps (and unit-specific allowances)

Air Quality Division • Update on the NAAQS and the SIP for Texas • MG and HE • May 2012• Page 60
CSAPR States

Air Quality Division • Update on the NAAQS and the SIP for Texas • MG and HE • May 1, 2012 • Page 61
EPA’s Cross-State Air Pollution Rule
• Based on July 2011 rule:
– Compliance date for PM2.5 program 1/1/12
– Compliance date for ozone program 5/1/12
– Texas included in both PM2.5 and ozone programs

Air Quality Division • Update on the NAAQS and the SIP for Texas • MG and HE • May 1, 2012 • Page 62
• December 2011 – U.S. Court of Appeals for the D.C. Circuit – Stayed the rule pending judicial review – Ordered CAIR to remain in place
• Oral arguments April 13, 2012
• EPA has continued with revisions to CSAPR regardless of stay ruling
CSAPR Litigation

Air Quality Division • Update on the NAAQS and the SIP for Texas • MG and HE • May 1, 2012 • Page 63
CSAPR Revisions
• February 2012 CSAPR rulemakings
• Final rule: – Revised state budgets and individual unit allocations
for some states; and
• Direct final rule/corresponding proposal: – Made further revisions to state budgets and individual
unit allocations for some states – Adverse comments received – Direct final to be withdrawn

Air Quality Division • Update on the NAAQS and the SIP for Texas • MG and HE • May 2012• Page 64
Regional Haze

Air Quality Division • Update on the NAAQS and the SIP for Texas • MG and HE • May 1, 2012 • Page 65
Regional Haze
• Rule requires states to improve visibility in 156 national parks and wilderness areas – In Texas, this includes Big Bend National Park
and Guadalupe Mountains National Park
• TCEQ’s Regional Haze SIP Revision submitted to EPA in March 2009
• EPA proposed limited disapproval for Texas (and other states) December 2011 due to reliance on CAIR

Air Quality Division • Update on the NAAQS and the SIP for Texas • MG and HE • May 1, 2012 • Page 66
Regional Haze
• Unclear how CSAPR will impact Regional Haze
• Next Regional Haze SIP Revision is due to EPA in 2014

Air Quality Division • Update on the NAAQS and the SIP for Texas • MG and HE • May 1, 2012 • Page 67
Contact Information
• Marissa Gonzales – Data Analysis Team – 512-239-1411 – [email protected]
• Heather Evans – SIP Team – (512) 239-4675 – [email protected]
• To join the SIP/Air Quality update e-mail list go to: www.tceq.texas.gov/airquality/sip/sipcontact.html

Questions?


![Detecting Carbon Monoxide Poisoning Detecting Carbon ...2].pdf · Detecting Carbon Monoxide Poisoning Detecting Carbon Monoxide Poisoning. Detecting Carbon Monoxide Poisoning C arbon](https://img.dokumen.tips/doc/110x75/5f551747b859172cd56bb119/detecting-carbon-monoxide-poisoning-detecting-carbon-2pdf-detecting-carbon.jpg)