Embed Size (px)
Citation preview

Brian Kelly Senior Orthodontic Adviser
NHSBSA Dental Services
Update from NHSBSA Dental Services

The NHSBSA has a statutory obligation to
monitor dental contracts on behalf of the
NHS in England and Wales


Contract Monitoring
NHSBSA Dental Services is responsible for
processing and analysing information received
from NHS dental contractors in order to:
• Monitor the performance of the contractor
• Prevent, detect and investigate fraud or other
unlawful activities

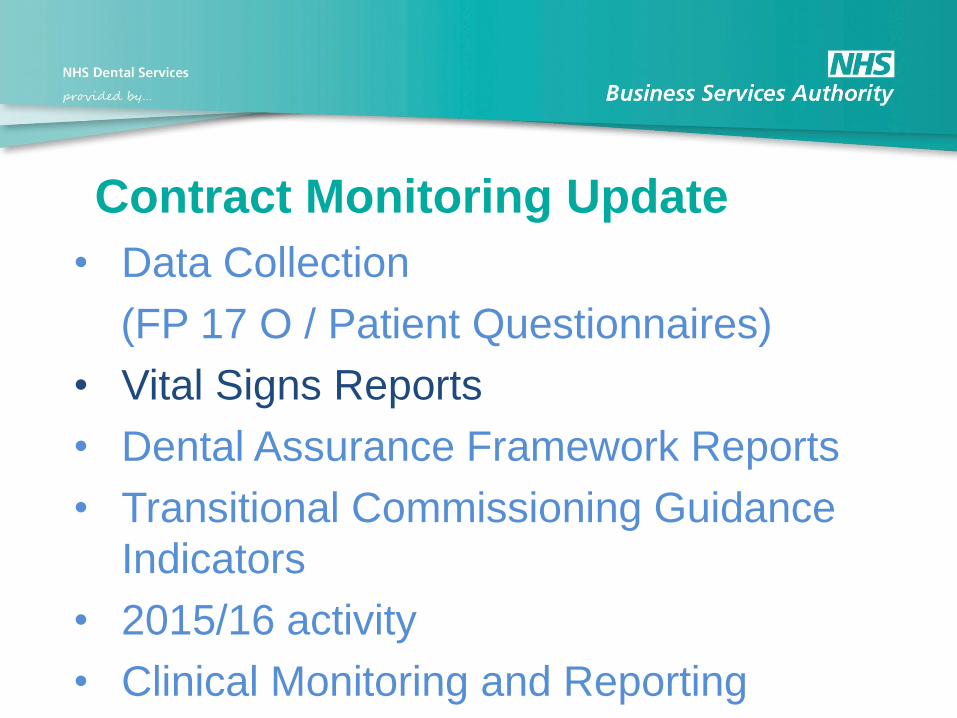
Contract Monitoring Update
• Data Collection
(FP 17 O / Patient Questionnaires)
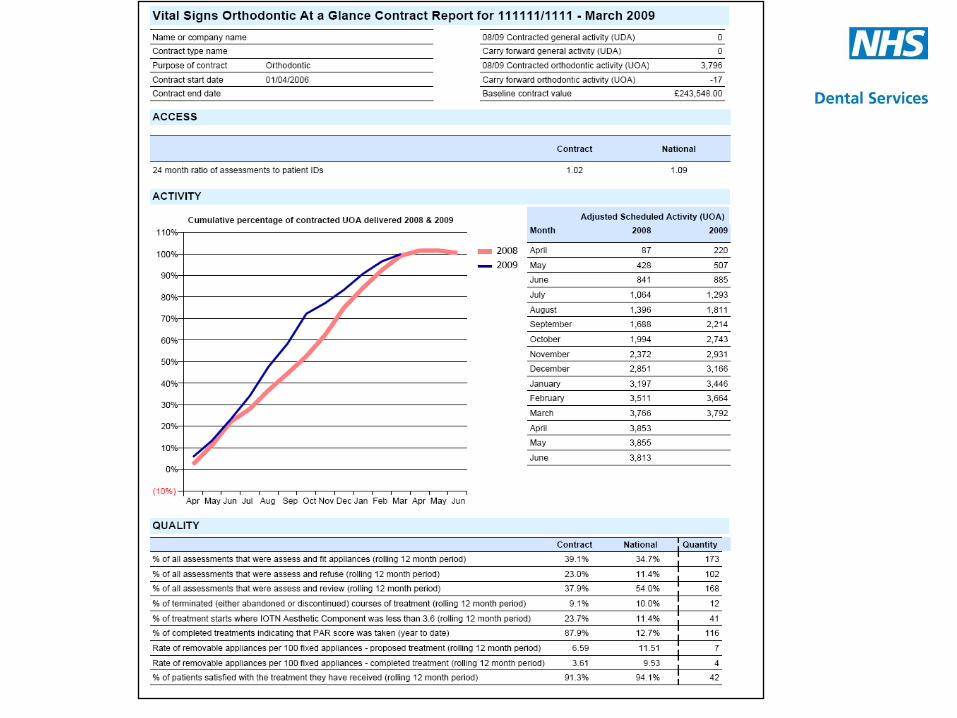
• Vital Signs Reports
• Dental Assurance Framework Reports
• Transitional Commissioning Guidance
Indicators
• 2015/16 activity
• Clinical Monitoring and Reporting

Contract Monitoring Update
• Data Collection
(FP 17 O / Patient Questionnaires)
• Vital Signs Reports
• Dental Assurance Framework Reports
• Transitional Commissioning Guidance
Indicators
• 2015/16 activity
• Clinical Monitoring and Reporting


Data Collection: FP17O
For 2015/2016:
• 5.7% of case starts and 12.9% of completions were submitted without the clinical data set completed
• Improvement needed most from „mixed‟ GDS contract holders

Data Collection:
Patient Questionnaires
• Random sample of case starts receive a
questionnaire within one month of the date of the
reported start
• ~ Between 2,000 and 3,000 patients per month
• ~ 30% response rate


Contract Monitoring Update
• Data Collection
(FP 17 O / Patient Questionnaires)
• Vital Signs Reports
• Dental Assurance Framework Reports
• Transitional Commissioning Guidance
Indicators
• 2015/16 activity
• Clinical Monitoring and Reporting
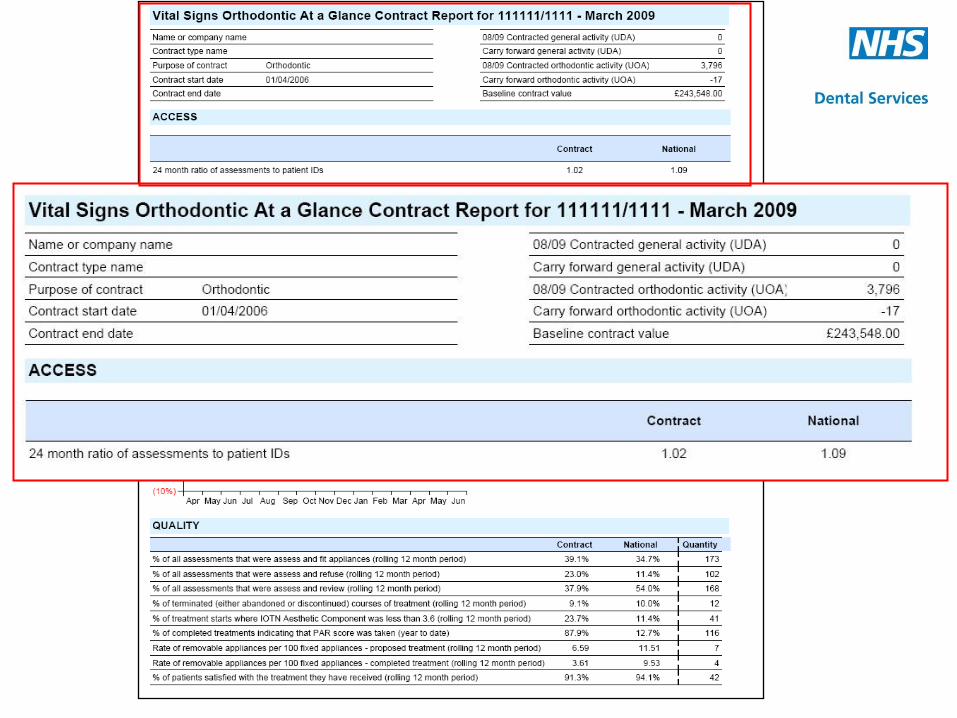
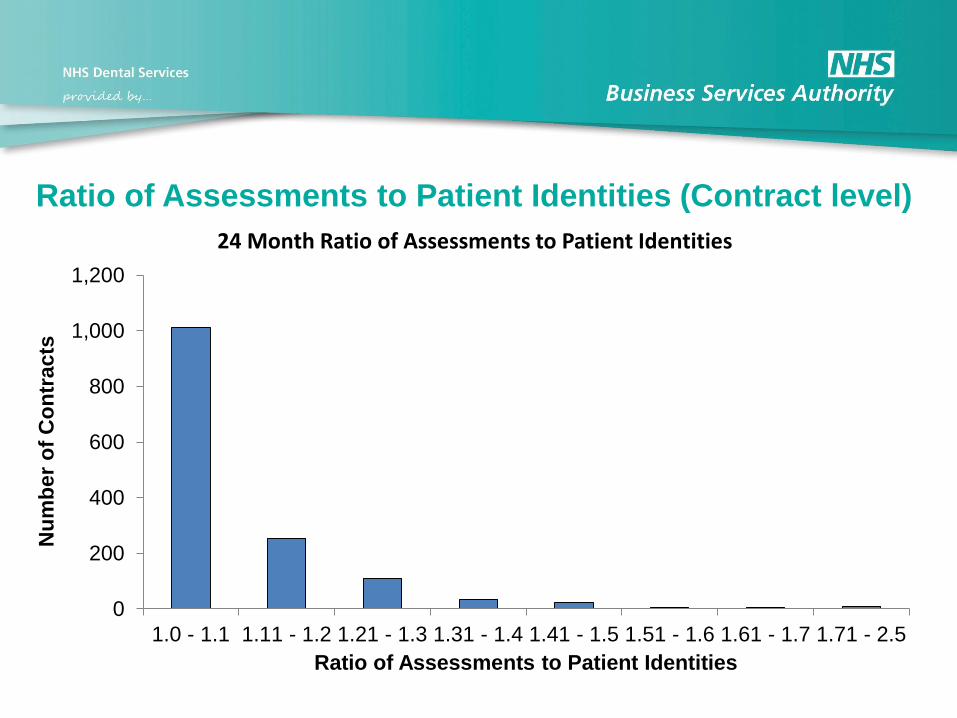
Ratio of Assessments to Patient Identities (Contract level)
0
200
400
600
800
1,000
1,200
1.0 - 1.1 1.11 - 1.2 1.21 - 1.3 1.31 - 1.4 1.41 - 1.5 1.51 - 1.6 1.61 - 1.7 1.71 - 2.5
Nu
mb
er
of
Co
ntr
acts
Ratio of Assessments to Patient Identities
24 Month Ratio of Assessments to Patient Identities

Ortho Vital Signs 2015/16
% of all assessments that were assess and fit
appliances (rolling 12 month period)
51.9
% of all assessments that were assess and refuse
(rolling 12 month period)
12.9
% of all assessments that were assess and review
(rolling 12 month period)
35.3
% of terminated courses where treatment was
abandoned or discontinued (rolling 12 month period)
7.4
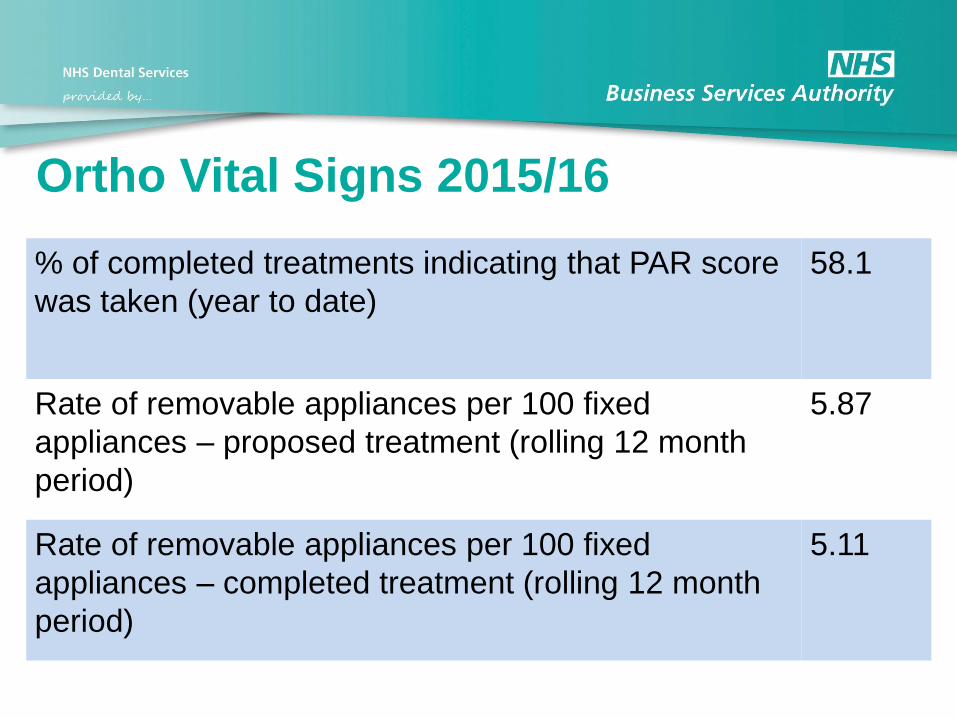
% of completed treatments indicating that PAR score
was taken (year to date)
58.1
Rate of removable appliances per 100 fixed
appliances – proposed treatment (rolling 12 month
period)
5.87
Rate of removable appliances per 100 fixed
appliances – completed treatment (rolling 12 month
period)
5.11
Ortho Vital Signs 2015/16

% of courses of treatment with removable appliances
only – proposed treatment (rolling 12 month period)
2.2
% of courses of treatment with removable appliances
only – completed treatment (rolling 12 month period)
1.7
% of patients satisfied with the treatment they have
received (rolling 12 month period)
96.5
Ortho Vital Signs 2015/16
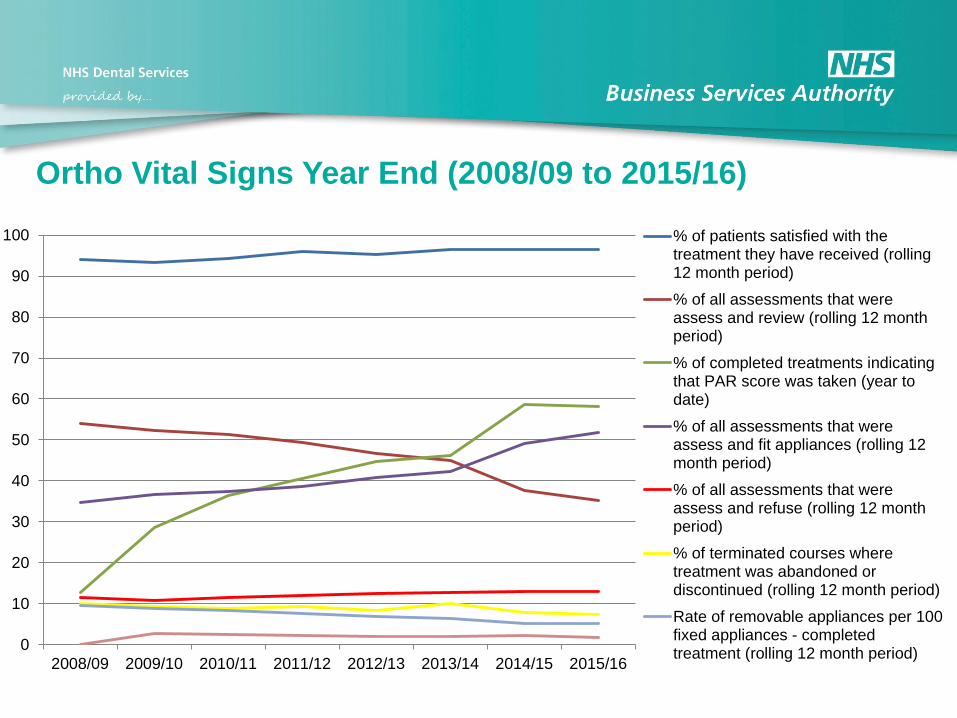
Ortho Vital Signs Year End (2008/09 to 2015/16)
0
10
20
30
40
50
60
70
80
90
100
2008/09 2009/10 2010/11 2011/12 2012/13 2013/14 2014/15 2015/16
% of patients satisfied with thetreatment they have received (rolling12 month period)
% of all assessments that wereassess and review (rolling 12 monthperiod)
% of completed treatments indicatingthat PAR score was taken (year todate)
% of all assessments that wereassess and fit appliances (rolling 12month period)
% of all assessments that wereassess and refuse (rolling 12 monthperiod)
% of terminated courses wheretreatment was abandoned ordiscontinued (rolling 12 month period)
Rate of removable appliances per 100fixed appliances - completedtreatment (rolling 12 month period)
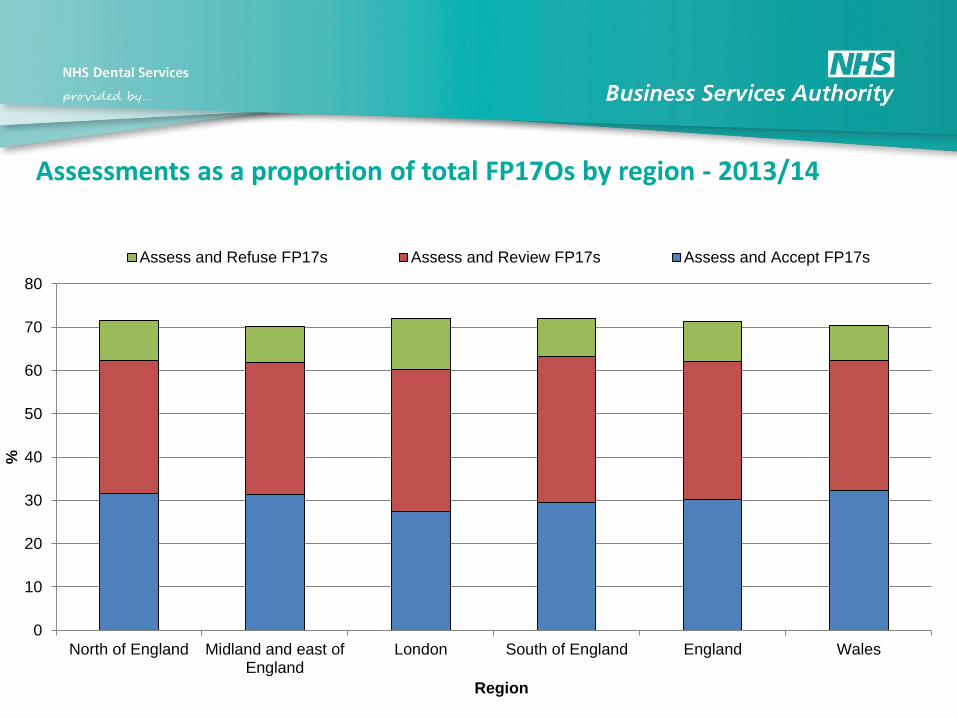
Assessments as a proportion of total FP17Os by region - 2013/14
0
10
20
30
40
50
60
70
80
North of England Midland and east ofEngland
London South of England England Wales
%
Region
Assess and Refuse FP17s Assess and Review FP17s Assess and Accept FP17s
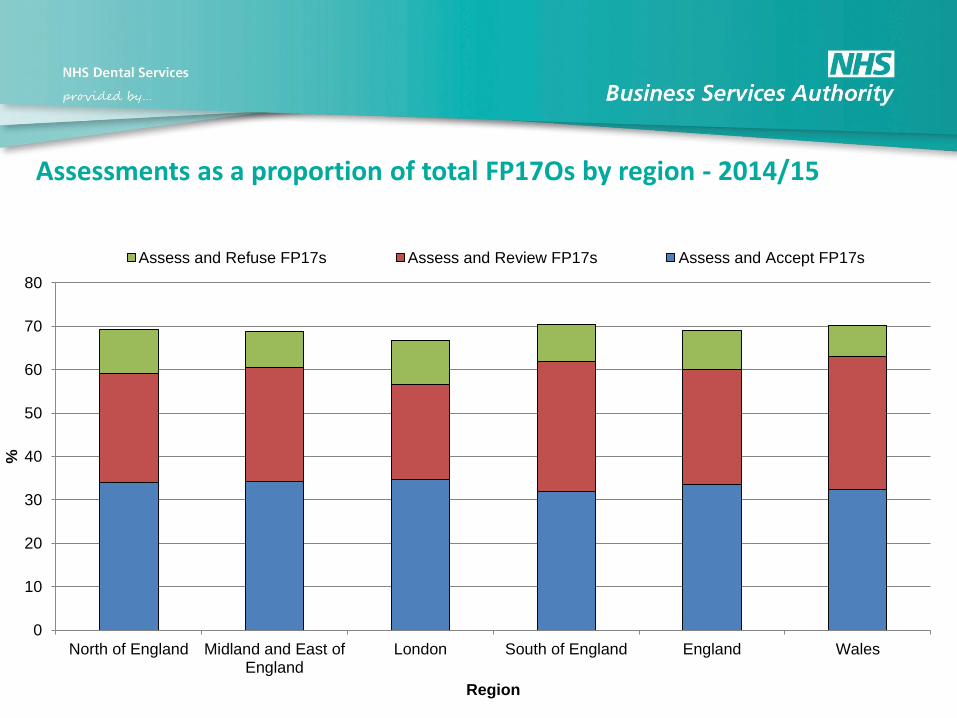
Assessments as a proportion of total FP17Os by region - 2014/15
0
10
20
30
40
50
60
70
80
North of England Midland and East ofEngland
London South of England England Wales
%
Region
Assess and Refuse FP17s Assess and Review FP17s Assess and Accept FP17s

Assessments as a proportion of total FP17Os by region – 2015/16
0
10
20
30
40
50
60
70
80
North of England Midland and East ofEngland
London South of England England Wales
Assess and Refuse FP17s Assess and Review FP17s Assess and Accept FP17s

Contract Monitoring Update
• Data Collection
(FP 17 O / Patient Questionnaires)
• Vital Signs Reports
• Dental Assurance Framework Reports
• Transitional Commissioning Guidance
Indicators
• 2015/16 activity
• Clinical Monitoring and Reporting

Dental Assurance Framework
Orthodontic Reports
(‘DAF Ortho Reports’)

Background
• Purpose : To support a more standardised approach to
contract performance management
• Not intended to supplant other commissioning guidance nor
the role of routine contracting processes
• Multi-agency group involved in scoping of the framework
• A series of indicators chosen covering four categories:
Delivery, Assessment, Treatment and Outcomes
• Designed as “Tier 1” analysis i.e. overarching and general
in nature

DAF Orthodontic Reports
• Reports available quarterly to Area Teams
• Contracts shown as “flags for attention” …further
assessment needed i.e. report is designed as a starting
point
• Size element used to avoid highlighting smaller contracts
simply because of their size
• Planned for providers to be able to see their results via the
Dental Portal / „Compass‟
• „Drill-down‟ data available to commissioners, investigating
factors that relate to a contract‟s performance
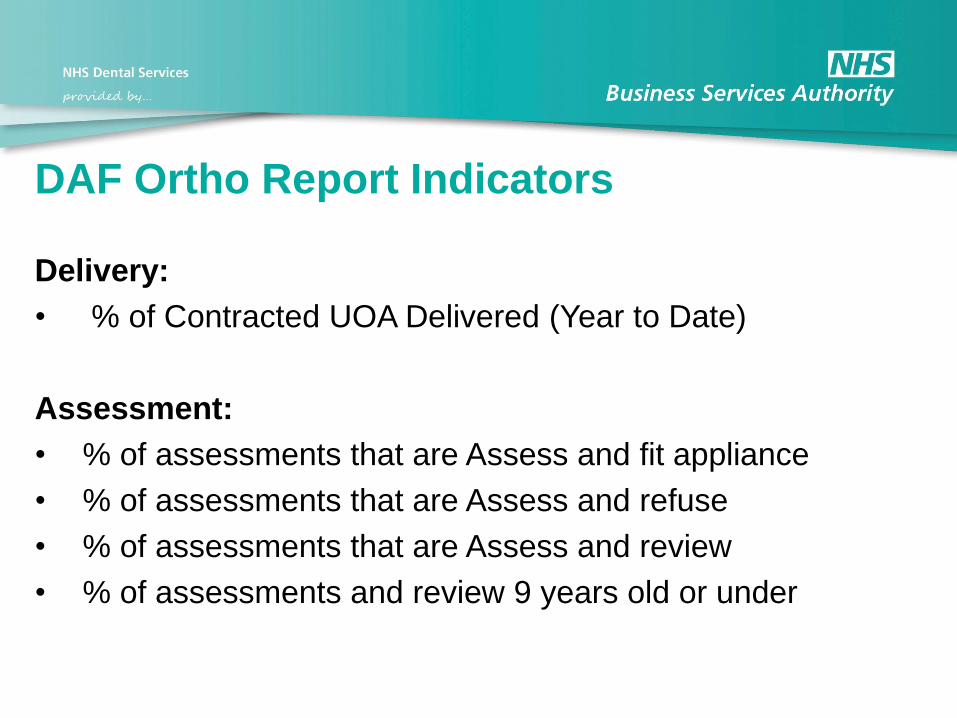
DAF Ortho Report Indicators
Delivery:
• % of Contracted UOA Delivered (Year to Date)
Assessment:
• % of assessments that are Assess and fit appliance
• % of assessments that are Assess and refuse
• % of assessments that are Assess and review
• % of assessments and review 9 years old or under

DAF Ortho Report Indicators
Treatment:
• Ratio of reported concluded to assess and fit
• % of concluded reported as using removable appliances
only
Outcomes:
• Ratio of UOAs per reported completed case
• % of contracts meeting their expected reporting of PAR
scores
• % of concluded cases where treatment is reported as
abandoned or discontinued

Overall Rates (Compares AT rates
with England)

Summary
Pri
ori
ty?
Contract & Name or
Company Name Tota
l Fl
ags
Un
de
r-d
eli
veri
ng
UO
A
%
Ass
ess
an
d f
it a
pp
lian
ce
%
Ass
ess
an
d r
efu
se
% A
sse
ss a
nd
re
vie
w
% a
sse
ssm
en
ts &
re
vie
w
wh
ere
pat
ien
t is
9 y
ear
s o
ld
or
un
de
r
Rat
io o
f co
ncl
ud
ed
tre
atm
en
t to
ass
ess
an
d f
it
% o
f co
ncl
ud
ed
*
usi
ng
rem
ova
ble
ap
pli
ance
s o
nly
.
Rat
io o
f U
OA
s p
er
com
ple
ted
cas
e
Re
po
rte
d P
AR
Sco
rin
g:
actu
al v
ers
us
exp
ect
ed
% o
f co
ncl
ud
ed
Co
Ts w
he
re
tre
atm
en
t ab
and
on
ed
or
dis
con
tin
ue
d
1 Contract 1 4 N Y Y N N Y N Y N N
2 Contract 2 4 N N N Y N Y N Y Y N
3 Contract 3 4 Y N N N N Y N Y Y N
4 Contract 4 3 Y N N N N Y N Y N N
5 Contract 5 3 N N N N N Y N Y Y N
“Priority” Contracts nominally identified by number of flags
Stressed throughout policies and guidance that further
assessment and triangulation of other information is required.

Contract Profile
Short Profile of each
contract including :
• Years open
• Age Profile
• IOTN
• PAR scoring
12 months Jul 2012 to Jun 2013
◄Choose contract from drop down to change data below
LA Name
PCO Code
Contract
Name or Company Name
Purpose of Contract
Contract Type
Contract Sub Type
Contract Start Date
Contract End Date
Years Contract Open
Contracted UOA 7,453
Carry Forward UOA Adjusted Scheduled UOA 7,453
Del ivery Level
Contract compared to England ; red worse performing , green better performing than national level (see Overall Rates tables for description)
Indicator Contract Flagged? England AT
Delivery 34.3 N 18.0 14.8
31.3 Y 41.4 42.4
20.7 Y 12.7 12.6
48.1 N 45.9 45.0
5.2 N 13.0 8.5
0.7 Y 0.9 0.7
0.6 N 2.0 2.6
36.0 Y 28.0 34.8
360(95.7) N n/a n/a
9.4 N 8.8 9.0
4
Contract Data & Profile (QXX) Anon Area Team
Reported PAR Scoring: actual versus expected
Measure
01/04/2006
7.2
21,746
0
Assessment% of assessments that are Assess and review
Ratio of concluded CoT to reported assess and fi t
appl iance% of concluded CoT reported as us ing removable
appl iances only.
Ratio of UOAs reported per reported completed case
Treatment
Outcomes
% of assess and review where patient i s 9 years old or
under
Total Flags
% of assessments that are Assess and refuse
Year To Date
UOA Scheduled
% of concluded CoT reported as abandoned or
discontinued
Risk of Early Del ivery
% of Contracted UOA Del ivered (PY to Date)
% of assessments that are Assess and fi t appl iance
5XX
none
Contract 1
LA Anon
xxxxxxx/xxxxx
Mr A Non
Orthodontic
PDS
Normal

Orthodontic DAF England March 2016 Delivery 2015 % 2016 % Difference
UOA
Delivered
Overall % of Contracted UOA Delivered (Year to
Date) 93.6 94.5 0.9
Flagged Total % of Contracted UOA Delivered
(Year to Date) 24.1 35.8 11.7
0
10
20
30
40
50
60
70
80
90
100
2015 2016
Pe
rce
nta
ge P
oin
ts
Year
Overall % of Contracted UOA Delivered (Year to Date)
Flagged Total % of Contracted UOA Delivered (Year to Date)

Orthodontic DAF England March 2016 Assessment 2015 % 2016 % Difference
Assessments
by category
Overall % of assessments that are Assess and fit
appliance 47.3 51.8 4.5
Flagged Total % of assessments that are Assess
and fit appliance 9.9 9.0 -0.9
Assessments
by category
Overall % of assessments that are Assess and
refuse 13.2 12.9 -0.3
Flagged Total % of assessments that are Assess
and refuse
6.3 4.3 -2.0
Assessments
by category
Overall % of assessments that are Assess and
review 39.5 35.3 -4.2
Flagged Total % of assessments that are Assess
and review 11.9 10.0 -1.9
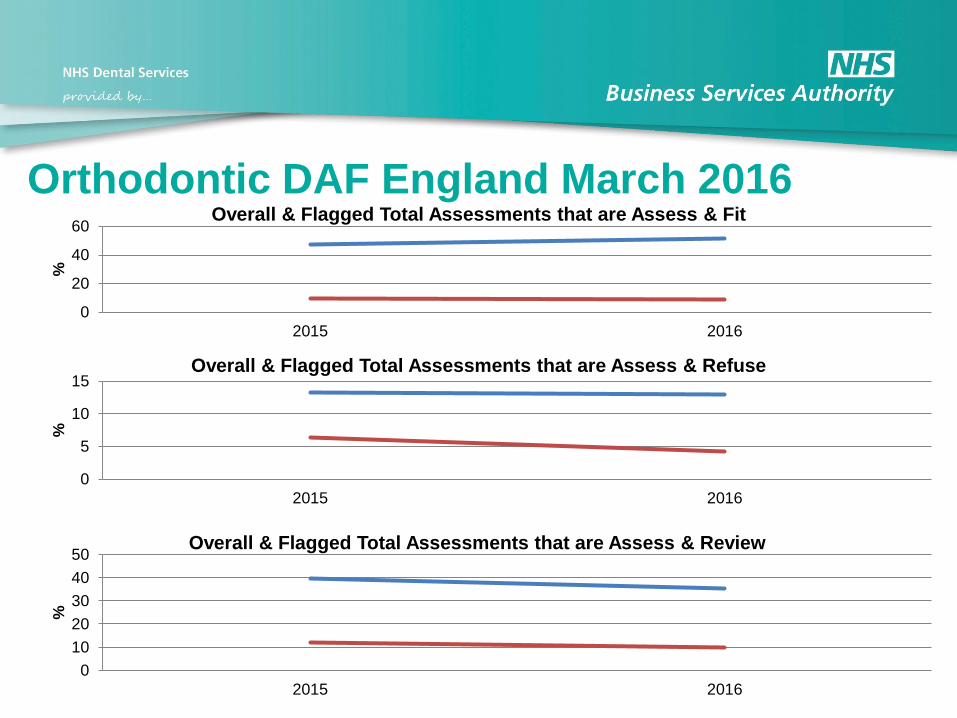
Orthodontic DAF England March 2016
0
20
40
60
2015 2016
%
Overall & Flagged Total Assessments that are Assess & Fit
0
5
10
15
2015 2016
%
Overall & Flagged Total Assessments that are Assess & Refuse
0
10
20
30
40
50
2015 2016
%
Overall & Flagged Total Assessments that are Assess & Review

Orthodontic DAF England March 2016 Assessment 2015 % 2016 % Difference
Age at
assessment
Overall % of reported assessments and review
where patient is 9 years old or under 13.2 12.4 -0.8
Flagged Total % of reported assessments and
review where patient is 9 years old or under 2.9 2.1 -0.8
0
2
4
6
8
10
12
14
2015 2016
Pe
rce
nta
ge P
oin
ts
Overall % of reported assessments and review where patient is 9 years old or under
Flagged Total % of reported assessments and review where patient is 9 years old or under

Orthodontic DAF England March 2016 Treatment 2015 % 2016 % Difference
Cases reported
complete as a
function assess
and fit appliance
Overall ratio of reported concluded (completed,
abandoned or discontinued) courses of
treatment to reported assess and fit appliance.
0.9 0.9 0.0
Flagged Total ratio of reported concluded
(completed, abandoned or discontinued)
courses of treatment to reported assess and fit
appliance.
24.2 16.6 -7.6
0
5
10
15
20
25
30
2015 2016
Pe
rce
nta
ge
Po
ints
Overall Ratio of reported concluded (completed,abandoned or discontinued) courses of treatmentto reported assess and fit appliance.
Flagged Total ratio of reported concluded(completed, abandoned or discontinued) coursesof treatment to reported assess and fit appliance.

Orthodontic DAF England March 2016 Treatment 2015 % 2016 % Difference
Type of
appliance
used
Overall % of concluded* (completed, abandoned or
discontinued) courses of treatment reported as using
removable appliances only. * currently only using
completed
1.7 1.6 -0.1
Flagged Total % of concluded* (completed,
abandoned or discontinued) courses of treatment
reported as using removable appliances only. *
currently only using completed
2.5 2.1 -0.4
0
1
1
2
2
3
3
2015 2016
Pe
rce
nta
ge P
oin
ts
Year
Overall % of concluded* (completed, abandonedor discontinued) courses of treatment reported asusing removable appliances only. * currently onlyusing completed
Flagged Total % of concluded* (completed,abandoned or discontinued) courses of treatmentreported as using removable appliances only.
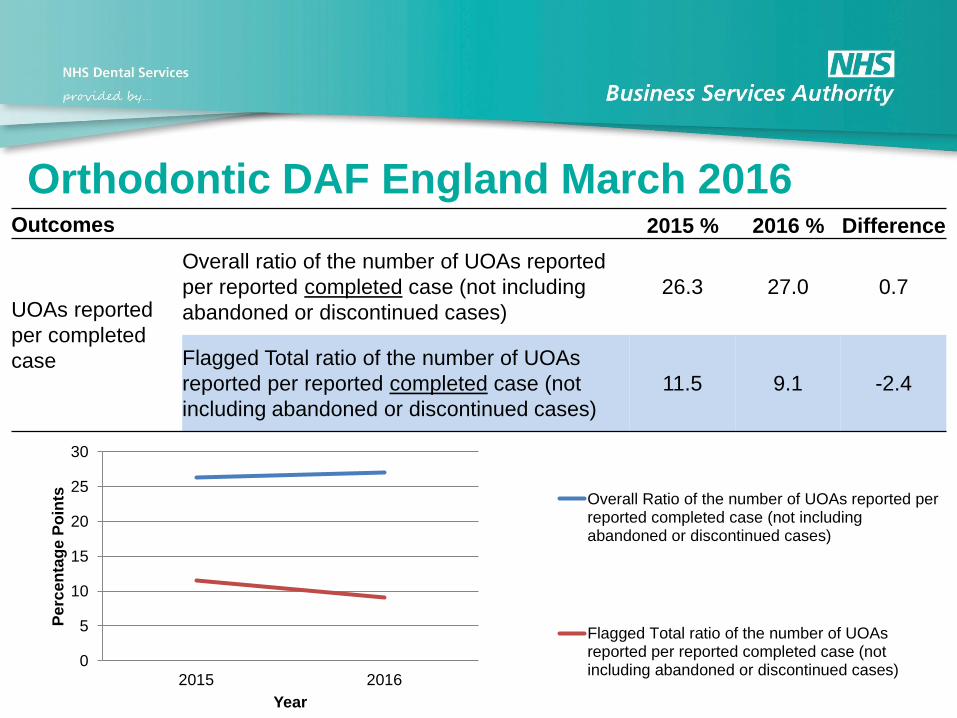
Orthodontic DAF England March 2016 Outcomes 2015 % 2016 % Difference
UOAs reported
per completed
case
Overall ratio of the number of UOAs reported
per reported completed case (not including
abandoned or discontinued cases)
26.3 27.0 0.7
Flagged Total ratio of the number of UOAs
reported per reported completed case (not
including abandoned or discontinued cases)
11.5 9.1 -2.4
0
5
10
15
20
25
30
2015 2016
Pe
rce
nta
ge P
oin
ts
Year
Overall Ratio of the number of UOAs reported perreported completed case (not includingabandoned or discontinued cases)
Flagged Total ratio of the number of UOAsreported per reported completed case (notincluding abandoned or discontinued cases)
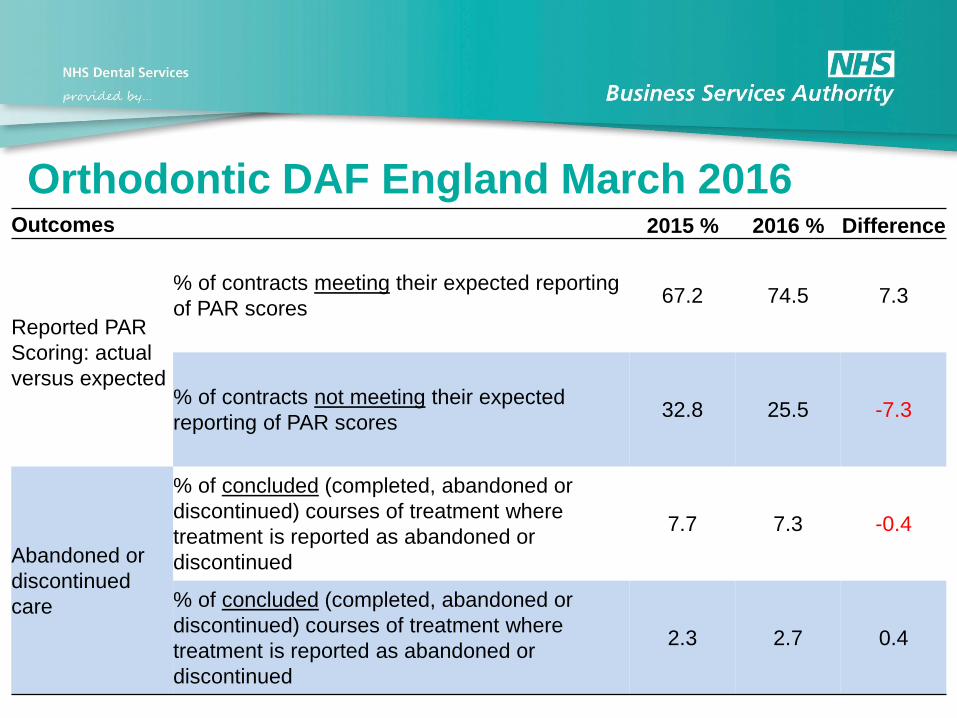
Orthodontic DAF England March 2016 Outcomes 2015 % 2016 % Difference
Reported PAR
Scoring: actual
versus expected
% of contracts meeting their expected reporting
of PAR scores 67.2 74.5 7.3
% of contracts not meeting their expected
reporting of PAR scores 32.8 25.5 -7.3
Abandoned or
discontinued
care
% of concluded (completed, abandoned or
discontinued) courses of treatment where
treatment is reported as abandoned or
discontinued
7.7 7.3 -0.4
% of concluded (completed, abandoned or
discontinued) courses of treatment where
treatment is reported as abandoned or
discontinued
2.3 2.7 0.4

Orthodontic DAF England March 2016
0
10
20
30
40
50
60
70
80
2015 2016
Pe
rce
nta
ge P
oin
ts
Year
Overall - % of contracts meeting their expected reporting of PAR scores
Overall % of contracts meeting their expectedreporting of PAR scores
Flagged Total % of contracts not meeting theirexpected reporting of PAR scores
0123456789
2015 2016
Pe
rce
nta
ge P
oin
ts
Year
Overall - % of terminated courses where treatment was abandoned or discontinued
Overall % of concluded (completed, abandonedor discontinued) courses of treatment wheretreatment is reported as abandoned ordiscontinued
Flagged Total % of concluded (completed,abandoned or discontinued) courses of treatmentwhere treatment is reported as abandoned ordiscontinued

Contract Monitoring Update
• Data Collection
(FP 17 O / Patient Questionnaires)
• Vital Signs Reports
• Dental Assurance Framework Reports
• Transitional Commissioning Guidance
Indicators
• 2015/16 activity
• Clinical Monitoring and Reporting

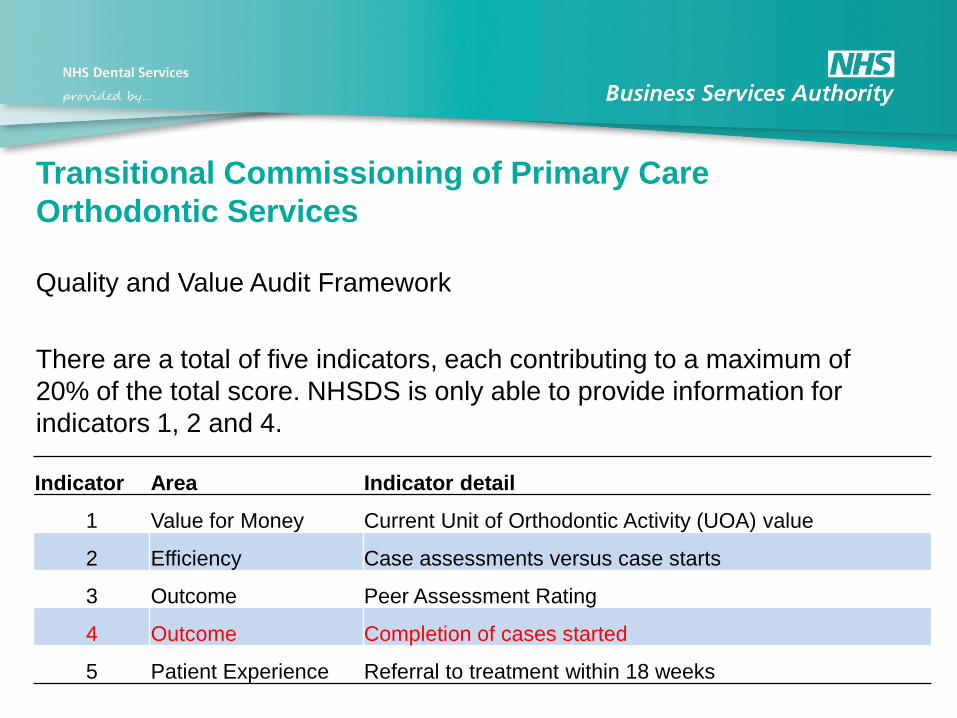
Transitional Commissioning of Primary Care
Orthodontic Services
Quality and Value Audit Framework
There are a total of five indicators, each contributing to a maximum of 20%
of the total score. NHSDS is only able to provide information for indicators
1, 2 and 4.
Indicator Area Indicator detail
1 Value for Money Current Unit of Orthodontic Activity (UOA) value
2 Efficiency Case assessments versus case starts
3 Outcome Peer Assessment Rating
4 Outcome Completion of cases started
5 Patient Experience Referral to treatment within 18 weeks*
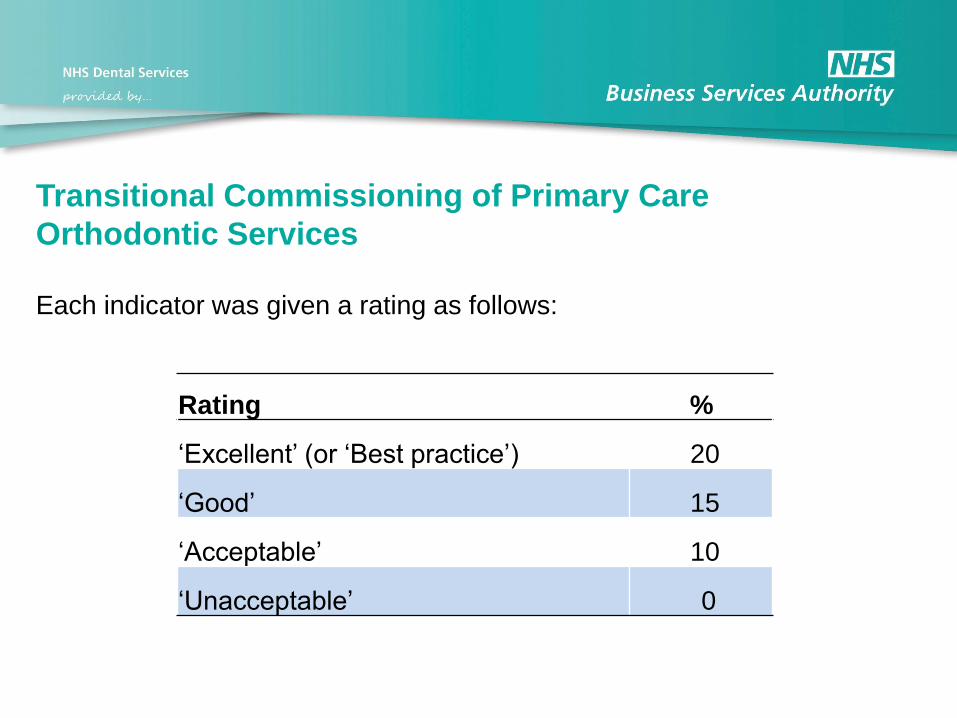
Transitional Commissioning of Primary Care
Orthodontic Services
Each indicator was given a rating as follows:
Rating %
„Excellent‟ (or „Best practice‟) 20
„Good‟ 15
„Acceptable‟ 10
„Unacceptable‟ 0

Transitional Commissioning of Primary Care
Orthodontic Services
Recommended action:
Overall rating % Action
90% + Extend contract by 3 years (rolling)
70%-85% Extend contract by 2 years (with 90% target)
50%-65% One year to improve to 70% +
<50% 6 months to improve to 70% +

Transitional Commissioning of Primary Care
Orthodontic Services
Quality and Value Audit Framework
There are a total of five indicators, each contributing to a maximum of
20% of the total score. NHSDS is only able to provide information for
indicators 1, 2 and 4.
Indicator Area Indicator detail
1 Value for Money Current Unit of Orthodontic Activity (UOA) value
2 Efficiency Case assessments versus case starts
3 Outcome Peer Assessment Rating
4 Outcome Completion of cases started
5 Patient Experience Referral to treatment within 18 weeks

Transitional Commissioning of Primary Care
Orthodontic Services
Indicator 2 Efficiency - Ratio of case assessments (assess and
accept/review/refuse) to case starts 2013 – 2014 Year
Percentage of contracts in each rating category by purpose of contract
(base 1,086 contracts with 10 or more case assessments)
Rating General Mixed Orthodontic Total
20% (1 to 1.4:1) 5.9 14.9 10.1 11.6
15% (1.5 to 1.9:1) 16.2 20.7 21.5 20.9
10% (2 to 3.9:1) 29.4 33.0 52.2 44.0
0% (> or = 4:1) 48.5 31.4 16.1 23.6
Total 100.0 100.0 100.0 100.0
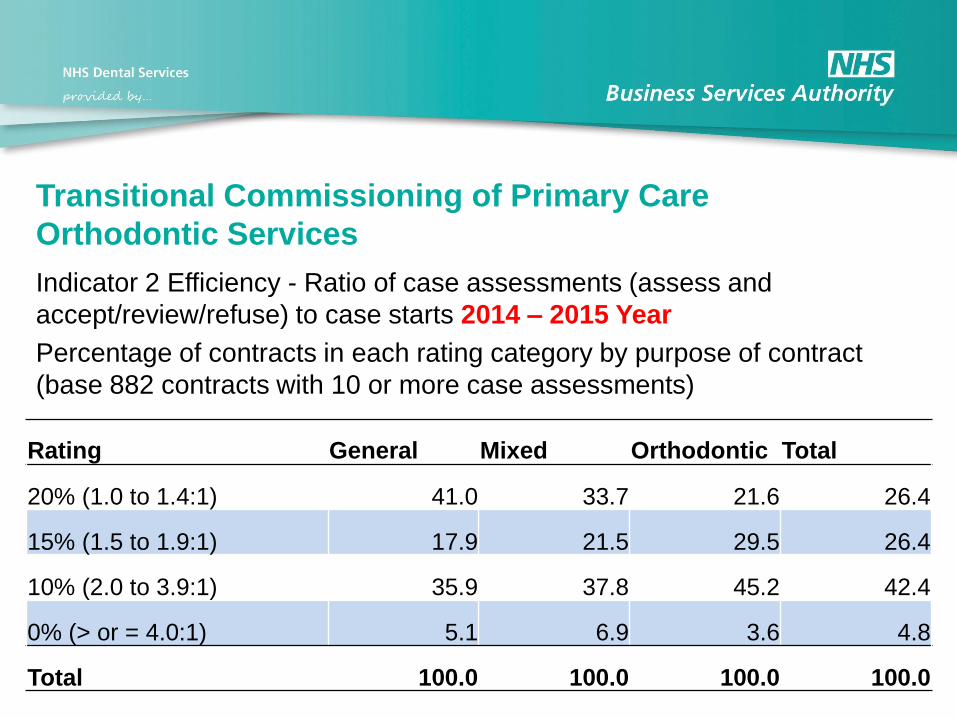
Transitional Commissioning of Primary Care
Orthodontic Services
Indicator 2 Efficiency - Ratio of case assessments (assess and
accept/review/refuse) to case starts 2014 – 2015 Year
Percentage of contracts in each rating category by purpose of contract
(base 882 contracts with 10 or more case assessments)
Rating General Mixed Orthodontic Total
20% (1.0 to 1.4:1) 41.0 33.7 21.6 26.4
15% (1.5 to 1.9:1) 17.9 21.5 29.5 26.4
10% (2.0 to 3.9:1) 35.9 37.8 45.2 42.4
0% (> or = 4.0:1) 5.1 6.9 3.6 4.8
Total 100.0 100.0 100.0 100.0

Transitional Commissioning of Primary Care
Orthodontic Services 2015/16
Indicator 2 Efficiency - Ratio of case assessments (assess and
accept/review/refuse) to case starts 2015 – 2016 Year
Percentage of contracts in each rating category by purpose of contract
(base 701 contracts with 10 or more case assessments)
Rating General Mixed Orthodontic Total
20% (1.0 to 1.4:1) 17.5 23.3 23.5 23
15% (1.5 to 1.9:1) 30.0 55.2 64.6 58.3
10% (2.0 to 3.9:1) 17.5 7.8 9.3 9.2
0% (> or = 4.0:1) 35.0 137. 2.6 9.5
Total 100.0 100.0 100.0 100.0
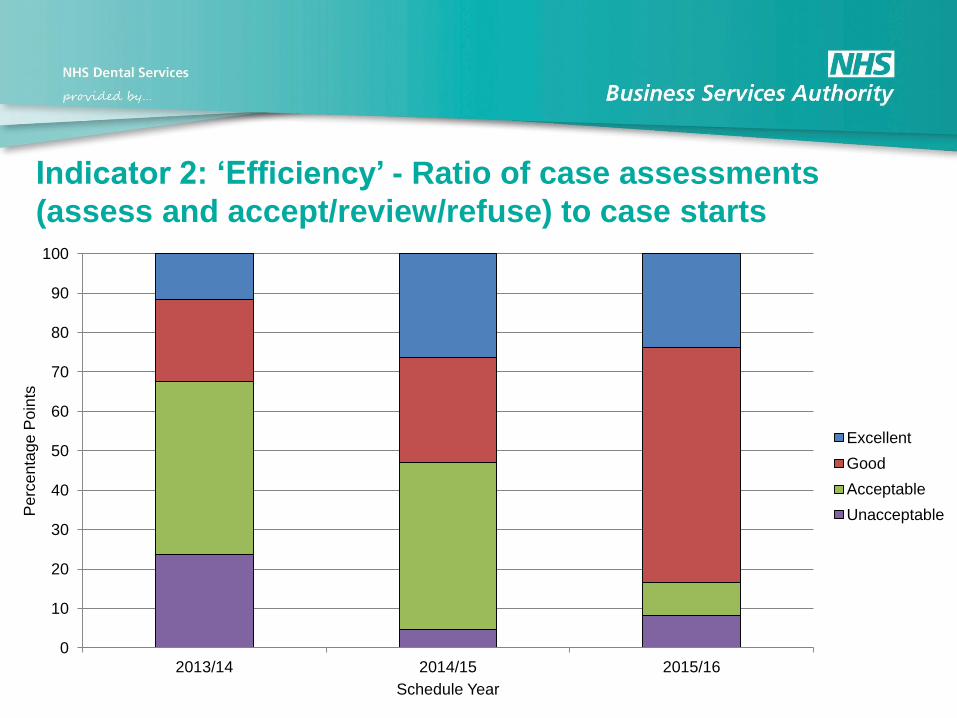
Indicator 2: ‘Efficiency’ - Ratio of case assessments
(assess and accept/review/refuse) to case starts
0
10
20
30
40
50
60
70
80
90
100
2013/14 2014/15 2015/16
Pe
rce
nta
ge
Po
ints
Schedule Year
Excellent
Good
Acceptable
Unacceptable
Transitional Commissioning of Primary Care
Orthodontic Services
Quality and Value Audit Framework
There are a total of five indicators, each contributing to a maximum of
20% of the total score. NHSDS is only able to provide information for
indicators 1, 2 and 4.
Indicator Area Indicator detail
1 Value for Money Current Unit of Orthodontic Activity (UOA) value
2 Efficiency Case assessments versus case starts
3 Outcome Peer Assessment Rating
4 Outcome Completion of cases started
5 Patient Experience Referral to treatment within 18 weeks
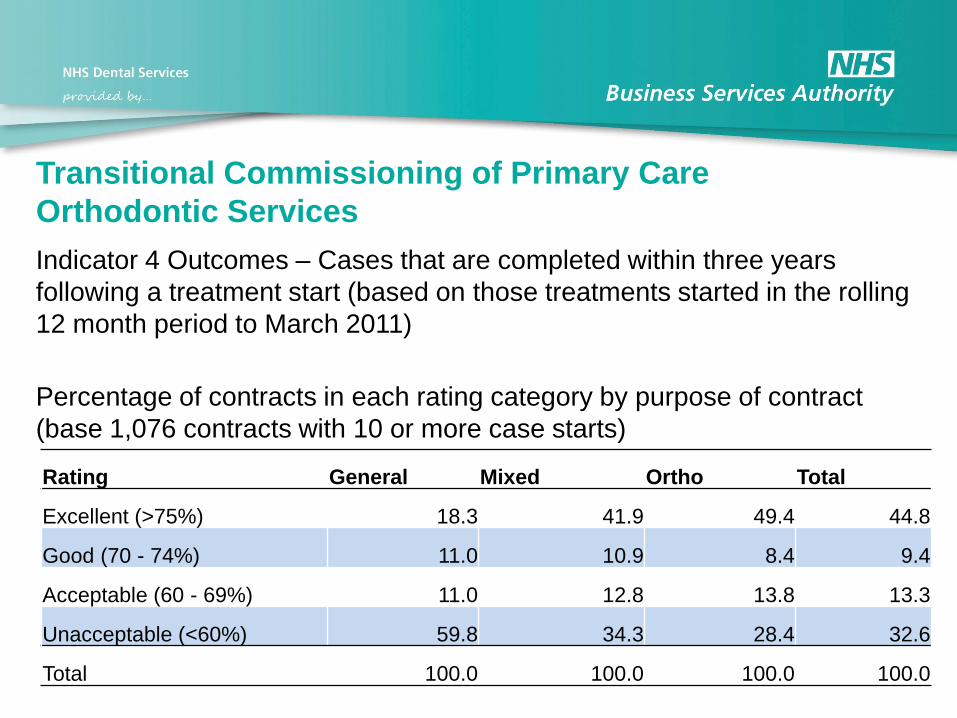
Transitional Commissioning of Primary Care
Orthodontic Services
Indicator 4 Outcomes – Cases that are completed within three years
following a treatment start (based on those treatments started in the rolling
12 month period to March 2011)
Percentage of contracts in each rating category by purpose of contract
(base 1,076 contracts with 10 or more case starts)
Rating General Mixed Ortho Total
Excellent (>75%) 18.3 41.9 49.4 44.8
Good (70 - 74%) 11.0 10.9 8.4 9.4
Acceptable (60 - 69%) 11.0 12.8 13.8 13.3
Unacceptable (<60%) 59.8 34.3 28.4 32.6
Total 100.0 100.0 100.0 100.0
Data Analysis: FP17O Reported
Completions
It is a statutory requirement to inform the NHSBSA
within two months of completion / termination of
treatment.


Data Analysis: FP17O
Reported Completions 2011/12
• Orthodontic case starts: 193,418
• Reported completions: 141,591 (73.2%)
• „Matched‟ completions 07/08: 68.9%
Data Analysis: FP17O
Reported completions 2012/13
• Orthodontic case starts: 209,072
• Reported completions: 162,370 (77.7%)

Data Analysis: FP17O
Reported completions 2013/14
• Orthodontic case starts: 201,977
• Reported completions: 165,827 (82.1%)
Data Analysis: FP17O
Reported completions 2014/15
• Orthodontic case starts: 203,152
• Reported completions: 163,561 (80.5%)
Data Analysis: FP17O
Reported completions 2015/16
• Orthodontic case starts: 205,688
• Reported completions: 166,327 (80.9%)
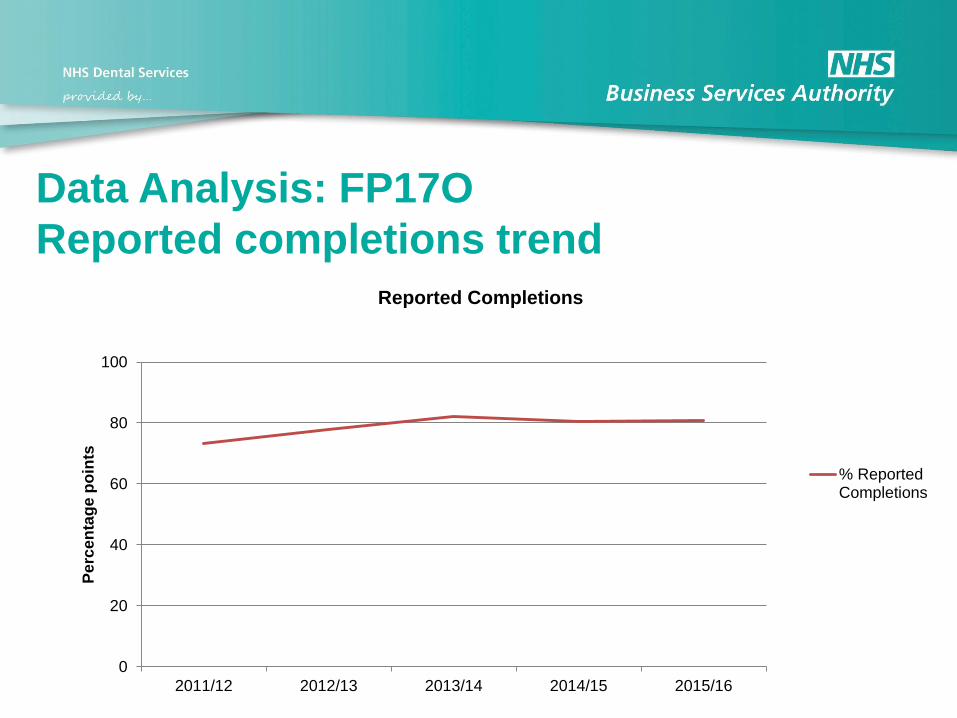
Data Analysis: FP17O
Reported completions trend
0
20
40
60
80
100
2011/12 2012/13 2013/14 2014/15 2015/16
Pe
rce
nta
ge p
oin
ts
Reported Completions
% ReportedCompletions

Orthodontic Treatment Completions
A longitudinal analysis of orthodontic treatments
• An analysis was undertaken of orthodontic courses of
treatment started in 2010, covering England & Wales, to
assess how, when and if the courses of treatment were
completed over a five year period.

Table 1: Summary of patient cohort for 2010 (not rounded) outcomes based on data available at January 2015
Treatment Outcome FP17Os Sub-total Total Percentage of
Total (%) Percentage of Sub-total (%)
Treatment abandoned 9,700
5 6
Treatment completed 144,472
72 91
Treatment discontinued 4,936
2 3
159,108
100
Unknown outcome 41,300
21
Second assess and appliance fitted 683
0
41,983
Total
201,091 100
Assess and appliance fitted
201,091

0
10
20
30
40
50
60
70
80
90
100
0 3 6 9 12 15 18 21 24 27 30 33 36 39 42
Pro
po
rtio
n o
f C
ou
rses
of
Trea
tmen
t (%
)
Time Elapsed since treatment started (months)
Orthodontic Treatment pattern of activity for known outcomes
Abandoned/Discontinued Completed Open

0
10
20
30
40
50
60
70
80
90
100
0 6 12 18 24 30 36 42
Pro
po
rtio
n o
f p
atie
nts
th
at s
tart
ed
tre
atm
en
t (%
)
Time Elapsed since treatment started (months)
Survival Rate Analysis - Proportion of patients continuing with orthodontic treatment for known outcomes - completed vs abandoned/discontinued - aged 11 - 17
Completed Abandoned/Discontinued Combined
Orthodontic Treatment Completions:
A longitudinal analysis of reported completions
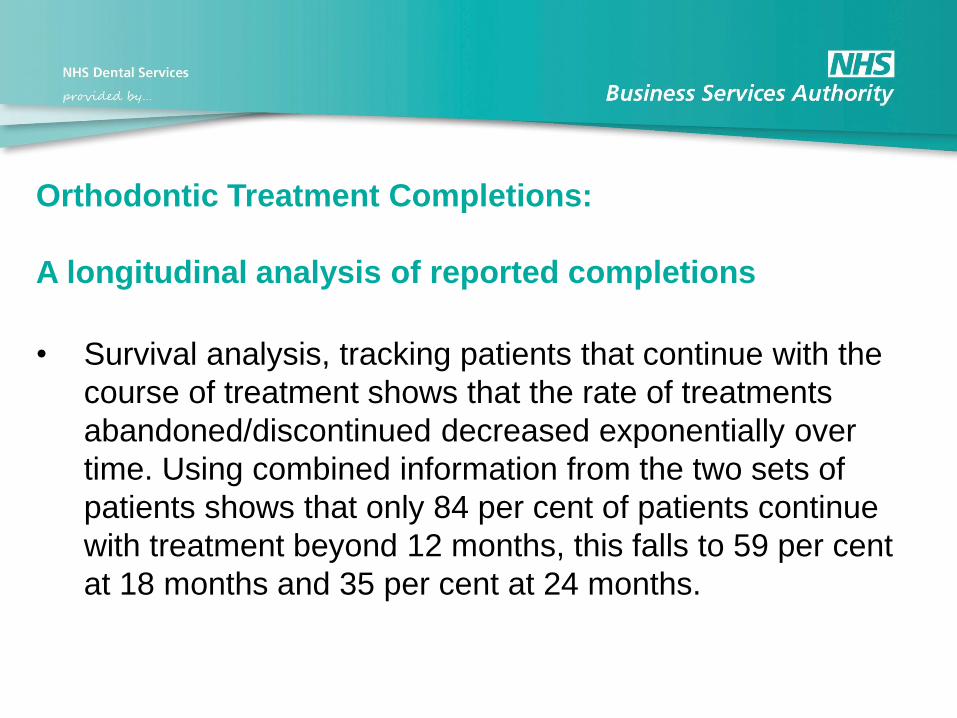
• Survival analysis, tracking patients that continue with the
course of treatment shows that the rate of treatments
abandoned/discontinued decreased exponentially over
time. Using combined information from the two sets of
patients shows that only 84 per cent of patients continue
with treatment beyond 12 months, this falls to 59 per cent
at 18 months and 35 per cent at 24 months.

Orthodontic Treatment Completions:
A longitudinal analysis of reported completions
• The median life-time (period for survival rate to fall to 50
per cent for reported completions) was 12 – 15 months
for abandoned/discontinued cases, compared with 18 –
24 months for completed cases.
• The overall averages for patients aged 11 – 17 that
subsequently abandoned/discontinued their treatment
was 13 - 14 months and for patients that completed their
treatment it was 20 - 21 months.
Orthodontic Treatment Completions:
A longitudinal analysis of reported completions
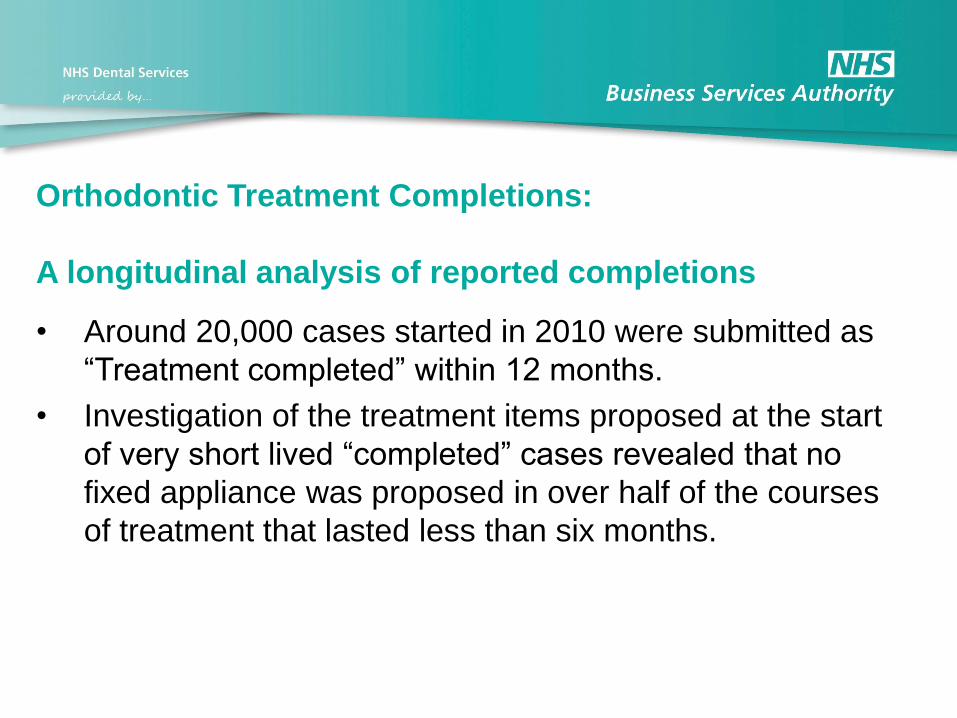
• Around 20,000 cases started in 2010 were submitted as
“Treatment completed” within 12 months.
• Investigation of the treatment items proposed at the start
of very short lived “completed” cases revealed that no
fixed appliance was proposed in over half of the courses
of treatment that lasted less than six months.

Range of treatment items proposed at start of completed courses of treatment
Table 6: Range of treatment items proposed at start of completed courses of treatment
Proportion of courses of treatment with clinical data item (%)
Duration
No Clinical Data
Removable Appliance
Fixed Appliance
Functional Appliance
Retainer Number of
Patients (000’s)
0 – 6 months
9.9 43.2 48.6 5.1 44.8 4
6 – 12 months
7.3 9.7 84.4 3.8 77.0 17
12 – 24 months
6.2 10.0 90.7 8.8 83.2 72
Over 24 months
7.1 19.6 88.0 17.8 81.9 51
Orthodontic Treatment Completions:
A longitudinal analysis of reported completions
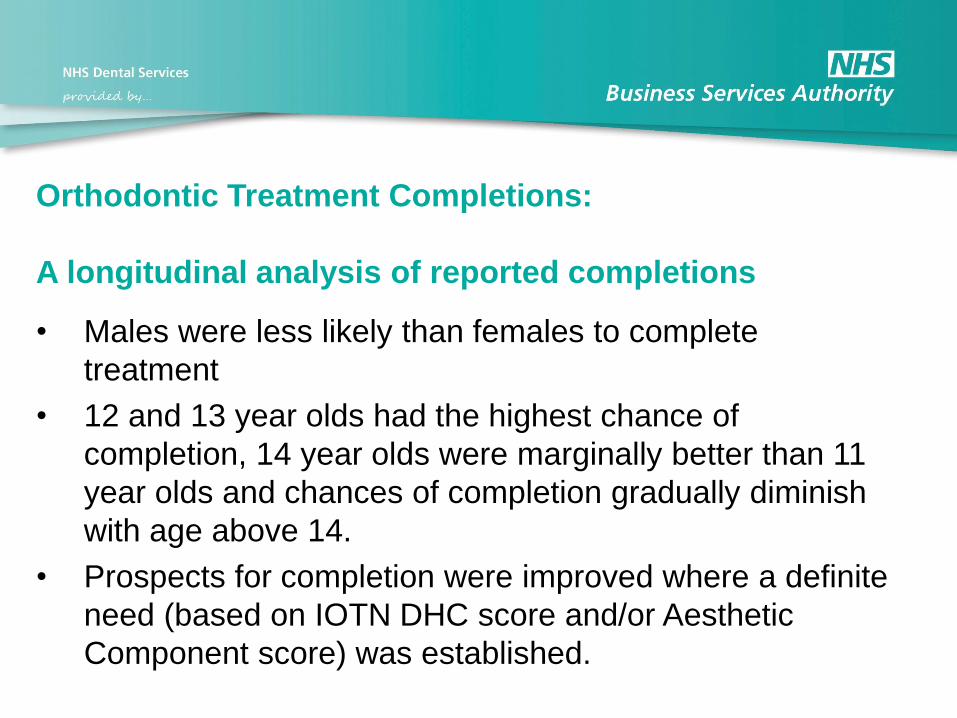
• Males were less likely than females to complete
treatment
• 12 and 13 year olds had the highest chance of
completion, 14 year olds were marginally better than 11
year olds and chances of completion gradually diminish
with age above 14.
• Prospects for completion were improved where a definite
need (based on IOTN DHC score and/or Aesthetic
Component score) was established.

Orthodontic Treatment Completions:
A longitudinal analysis of reported completions
• Contracts that failed to provide termination FP17Os also
failed to achieve as many completions as expected
(based on the outcome FP17Os they had submitted).
There were 29 outlier contracts highlighted from the 2010
dataset.

Contract Monitoring Update
• Data Collection
(FP 17 O / Patient Questionnaires)
• Vital Signs Reports
• Dental Assurance Framework Reports
• Transitional Commissioning Guidance
Indicators
• 2015/16 activity
• Clinical Monitoring and Reporting

Reported IOTN scores for Assess and Refuse cases
2013-2014 (England & Wales)
39.3
30.9
12.1
8.3
5.6
2.4 1.5
IOTN 3 (Ineligible) IOTN 2
IOTN 4 Missing IOTN
IOTN 5 IOTN 1
IOTN 3 (Eligible)

38.9
29.8
12.5
8.7
6.2
2.3 1.5
IOTN 3 (Ineligible) IOTN 2
IOTN 4 Missing IOTN
IOTN 5 IOTN 1
IOTN 3 (Eligible)
Reported IOTN scores for Assess and Refuse cases
2014-2015 (England & Wales)
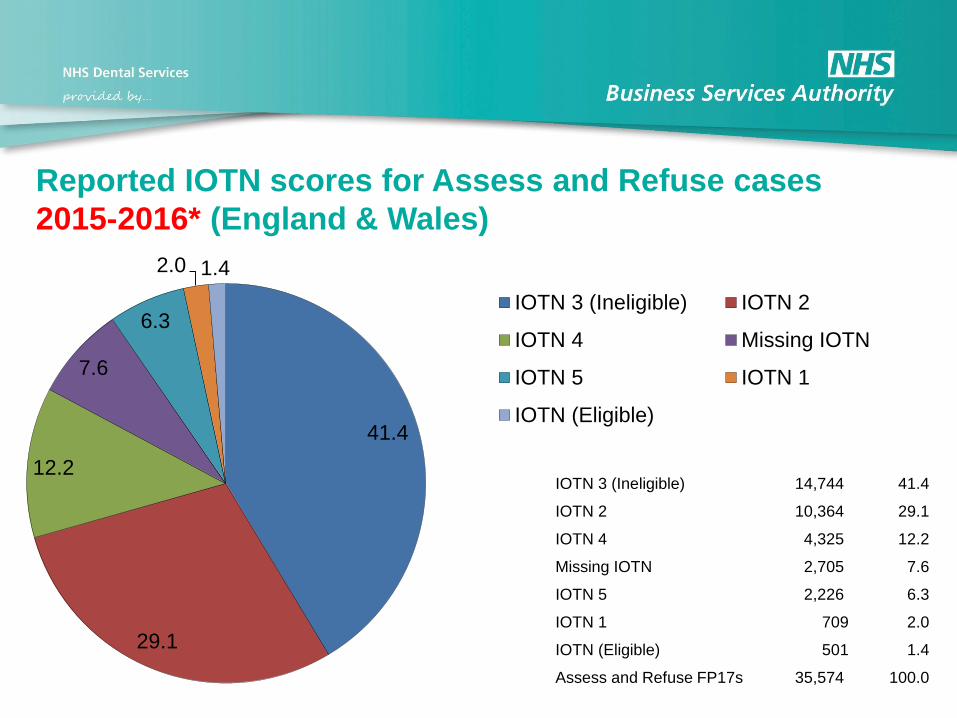
Reported IOTN scores for Assess and Refuse cases
2015-2016* (England & Wales)
41.4
29.1
12.2
7.6
6.3
2.0 1.4
IOTN 3 (Ineligible) IOTN 2
IOTN 4 Missing IOTN
IOTN 5 IOTN 1
IOTN (Eligible)
IOTN 3 (Ineligible) 14,744 41.4
IOTN 2 10,364 29.1
IOTN 4 4,325 12.2
Missing IOTN 2,705 7.6
IOTN 5 2,226 6.3
IOTN 1 709 2.0
IOTN (Eligible) 501 1.4
Assess and Refuse FP17s 35,574 100.0

Reported IOTN scores for Case Starts 2013-2014
(England & Wales)
75.8
16.5
5.0
2.5 0.1 0.1 0.1
IOTN 4 IOTN 5
IOTN 3 (Eligible) Missing IOTN
IOTN 3 (Ineligible) IOTN 2
IOTN 1
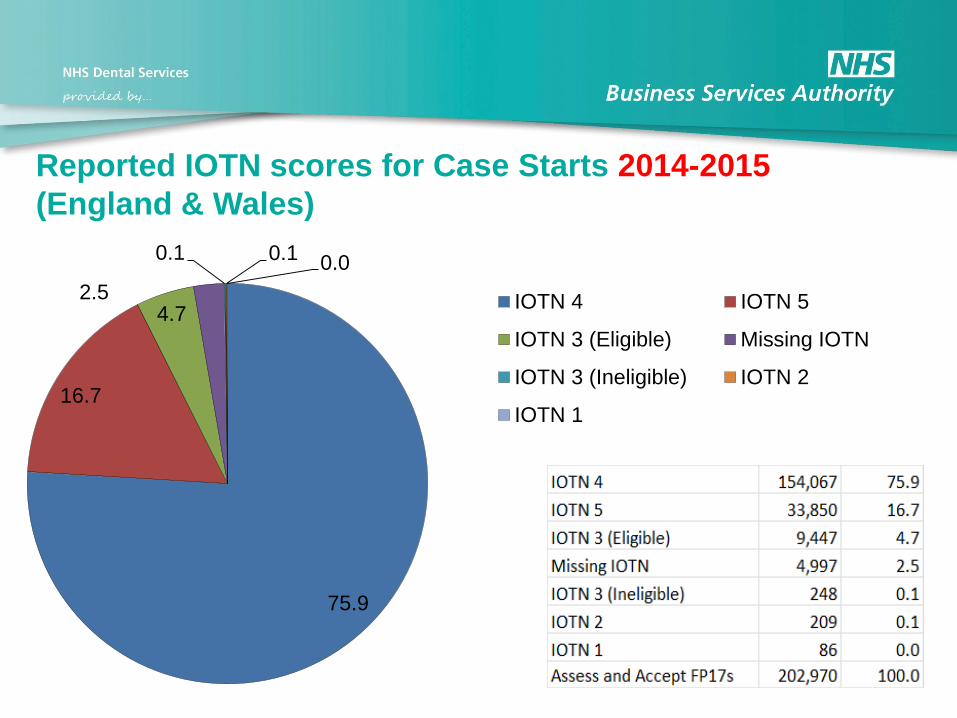
Reported IOTN scores for Case Starts 2014-2015
(England & Wales)
75.9
16.7
4.7 2.5
0.1 0.1 0.0
IOTN 4 IOTN 5
IOTN 3 (Eligible) Missing IOTN
IOTN 3 (Ineligible) IOTN 2
IOTN 1
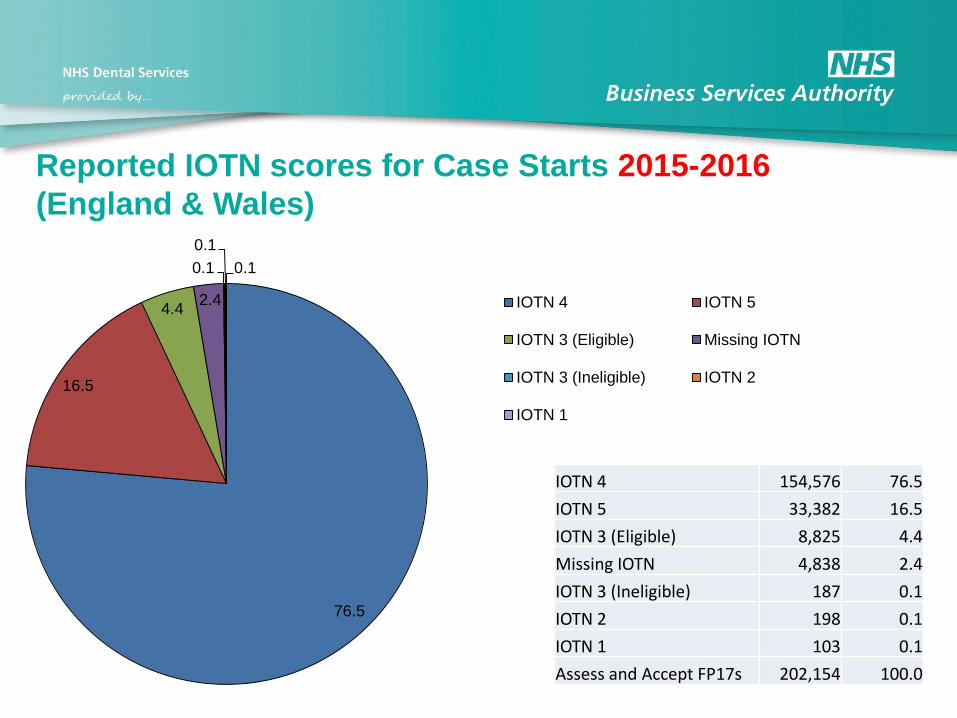
Reported IOTN scores for Case Starts 2015-2016
(England & Wales)
IOTN 4 154,576 76.5
IOTN 5 33,382 16.5
IOTN 3 (Eligible) 8,825 4.4
Missing IOTN 4,838 2.4
IOTN 3 (Ineligible) 187 0.1
IOTN 2 198 0.1
IOTN 1 103 0.1
Assess and Accept FP17s 202,154 100.0
76.5
16.5
4.4 2.4
0.1
0.1
0.1
IOTN 4 IOTN 5
IOTN 3 (Eligible) Missing IOTN
IOTN 3 (Ineligible) IOTN 2
IOTN 1
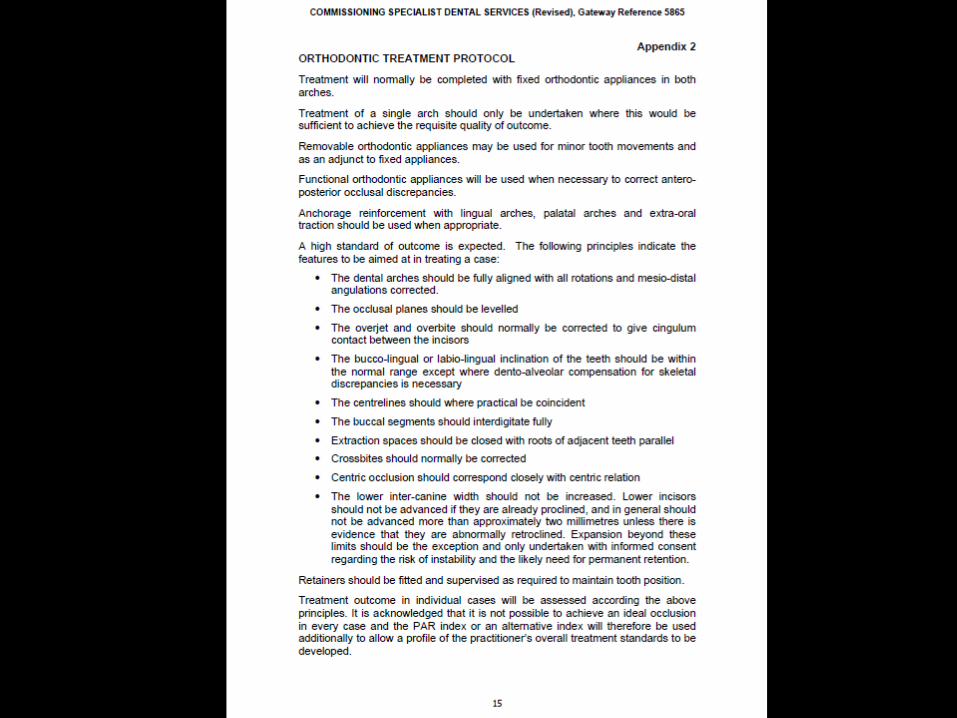
ORTHODONTIC TREATMENT PROTOCOL
Commissioning Specialist Dental Services
DH Gateway Reference 5865
Treatment will normally be completed with fixed
orthodontic appliances in both arches.
Treatment of a single arch should only be undertaken
where this would be sufficient to achieve the requisite
quality of outcome.
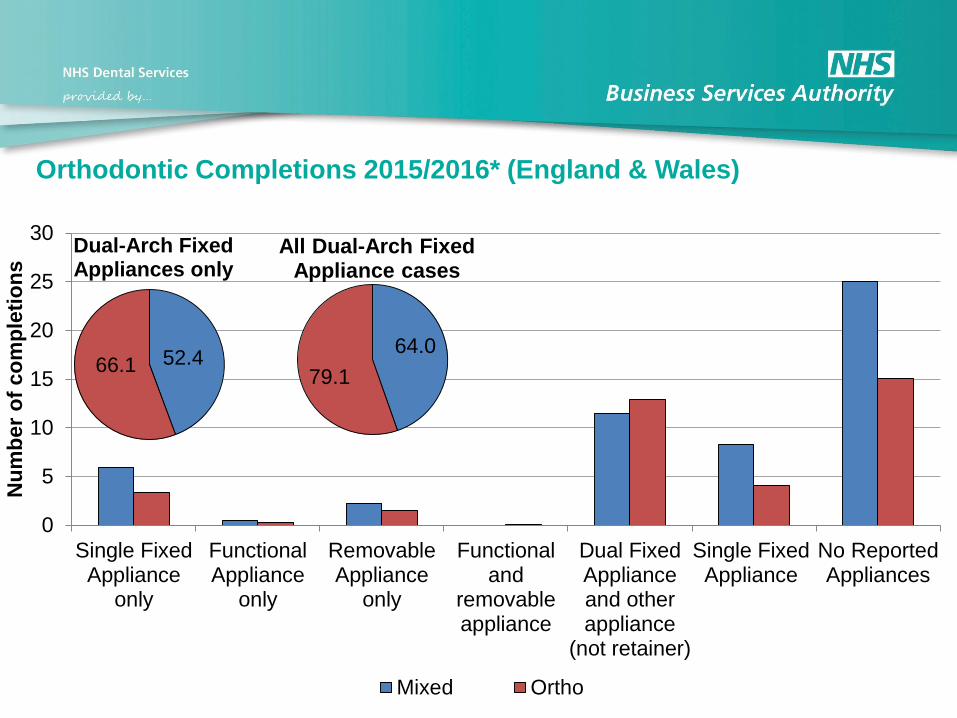
Orthodontic Completions 2015/2016* (England & Wales)
0
5
10
15
20
25
30
Single FixedAppliance
only
FunctionalAppliance
only
RemovableAppliance
only
Functionaland
removableappliance
Dual FixedApplianceand otherappliance
(not retainer)
Single FixedAppliance
No ReportedAppliances
Nu
mb
er
of
co
mp
leti
on
s
Mixed Ortho
52.4 66.1
Dual-Arch Fixed Appliances only
64.0
79.1
All Dual-Arch Fixed Appliance cases

Trend for appliances used 2008-09 to 2015-16* (E&W)
0
10
20
30
40
50
60
70
80
90
Tre
nd
Year
Dual-arch Fixed Appliance (total)
Dual-arch Fixed Appliance Only
No Reported Appliance
Dual-arch Fixed Appliance + Other
Single Fixed Appliance + Other
Single Fixed Appliance Only
Removable Appliance Only
Functional Appliance Only
Functional and Removable Appliance
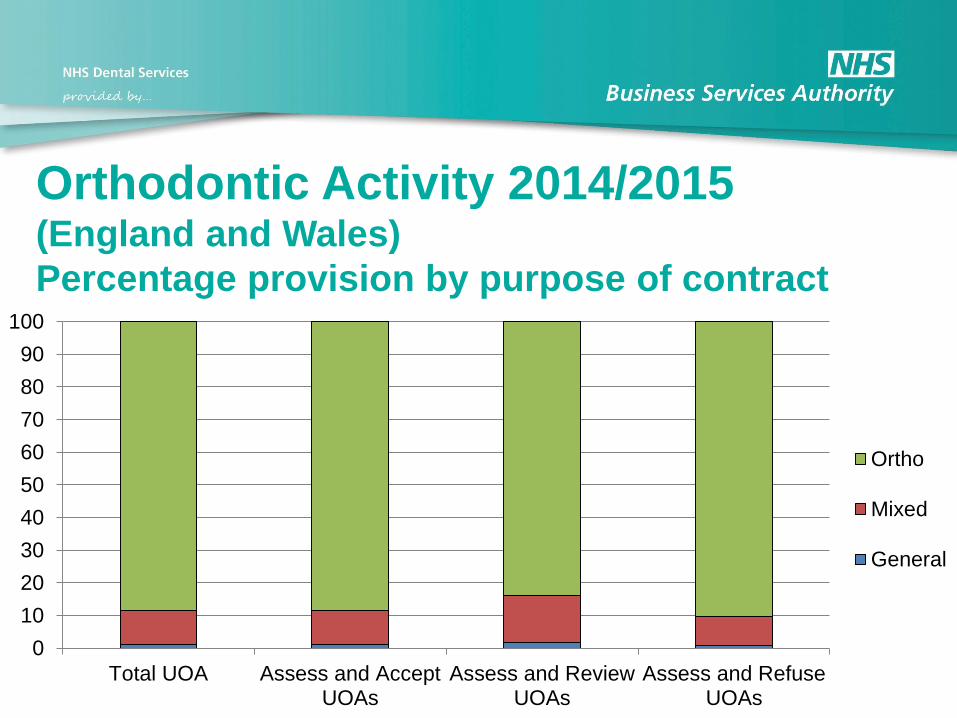
Orthodontic Activity 2014/2015 (England and Wales)
Percentage provision by purpose of contract
0
10
20
30
40
50
60
70
80
90
100
Total UOA Assess and AcceptUOAs
Assess and ReviewUOAs
Assess and RefuseUOAs
Ortho
Mixed
General

Orthodontic Cases by Contract Type 2014-2015
(England & Wales)
0
10
20
30
40
50
60
70
80
90
GDS Contract PDS Contract TDS Contract
Nu
mb
er
of
Cases
Contract type
Assess andRefuse FP17s
Assess andReview FP17s
Assess andAccept FP17s
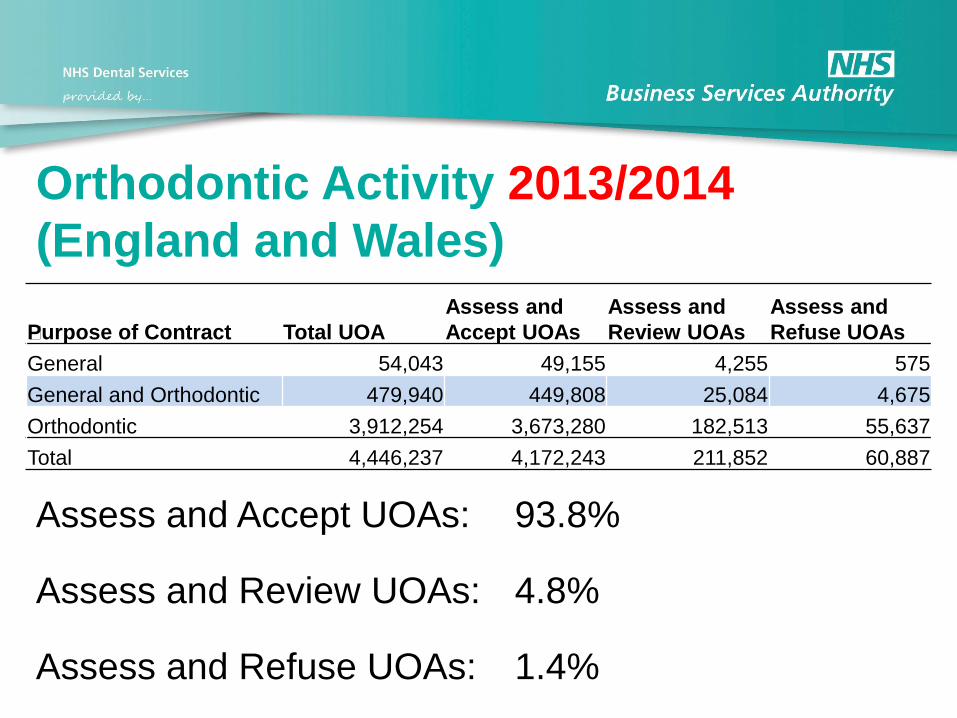
Orthodontic Activity 2013/2014
(England and Wales)
Assess and Accept UOAs: 93.8%
Assess and Review UOAs: 4.8%
Assess and Refuse UOAs: 1.4%
Purpose of Contract Total UOA
Assess and
Accept UOAs
Assess and
Review UOAs
Assess and
Refuse UOAs
General 54,043 49,155 4,255 575
General and Orthodontic 479,940 449,808 25,084 4,675
Orthodontic 3,912,254 3,673,280 182,513 55,637
Total 4,446,237 4,172,243 211,852 60,887
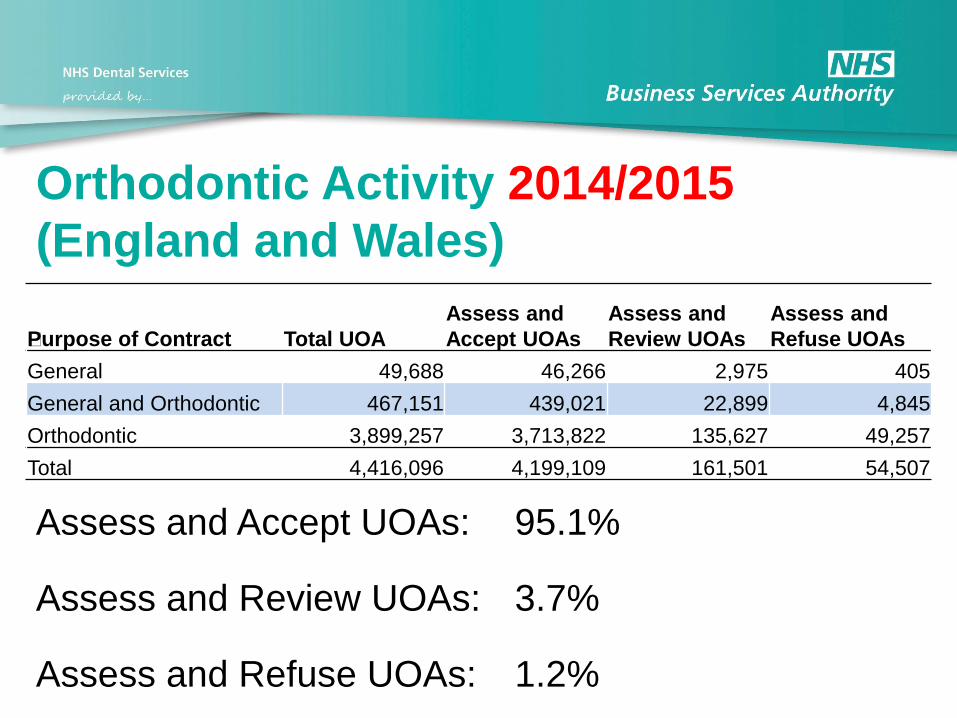
Orthodontic Activity 2014/2015
(England and Wales)
Assess and Accept UOAs: 95.1%
Assess and Review UOAs: 3.7%
Assess and Refuse UOAs: 1.2%
Purpose of Contract Total UOA
Assess and
Accept UOAs
Assess and
Review UOAs
Assess and
Refuse UOAs
General 49,688 46,266 2,975 405
General and Orthodontic 467,151 439,021 22,899 4,845
Orthodontic 3,899,257 3,713,822 135,627 49,257
Total 4,416,096 4,199,109 161,501 54,507

Orthodontic Activity 2015/2016*
(England and Wales)
Assess and Accept UOAs: 95.7%
Assess and Review UOAs: 3.1%
Assess and Refuse UOAs: 1.2%
Purpose of Contract Total UOA
Assess and
Accept UOAs
Assess and
Review UOAs
Assess and
Refuse UOAs
General 30,303 28,325 1,700 265
General and Orthodontic 322,666 306,782 12,380 3,318
Orthodontic 2,733,257 2,618,629 82,392 31,927
Total 3,086,225 2,953,736 96,472 35,510

0
100,000
200,000
300,000
2009-10 2010-11 2011-12 2012-13 2013-14 2014-15 2015-16*
Assess and Accept FP17s
0
5,000
10,000
2009-10 2010-11 2011-12 2012-13 2013-14 2014-15 2015-16*
Assess and Accept (treatment starts) FP17Os under 10s
0
100,000
200,000
300,000
2009-10 2010-11 2011-12 2012-13 2013-14 2014-15 2015-16*
10-17 Years old - Assess and Accept FP17s
0500
1,0001,5002,000
2009-10 2010-11 2011-12 2012-13 2013-14 2014-15 2015-16*
18+ Years old - Assess and Accept FP17s

0
1,000
2,000
3,000
4,000
5,000
6,000
2009-10 2010-11 2011-12 2012-13 2013-14 2014-15 2015-16*
FP
17O
s
Year
Assess and Accept (treatment starts) FP17Os under 10s

Contract Monitoring Update
• Data Collection
(FP 17 O / Patient Questionnaires)
• Vital Signs Reports
• Dental Assurance Framework Reports
• Transitional Commissioning Guidance
Indicators
• 2015/16 activity
• Clinical Monitoring and Reporting

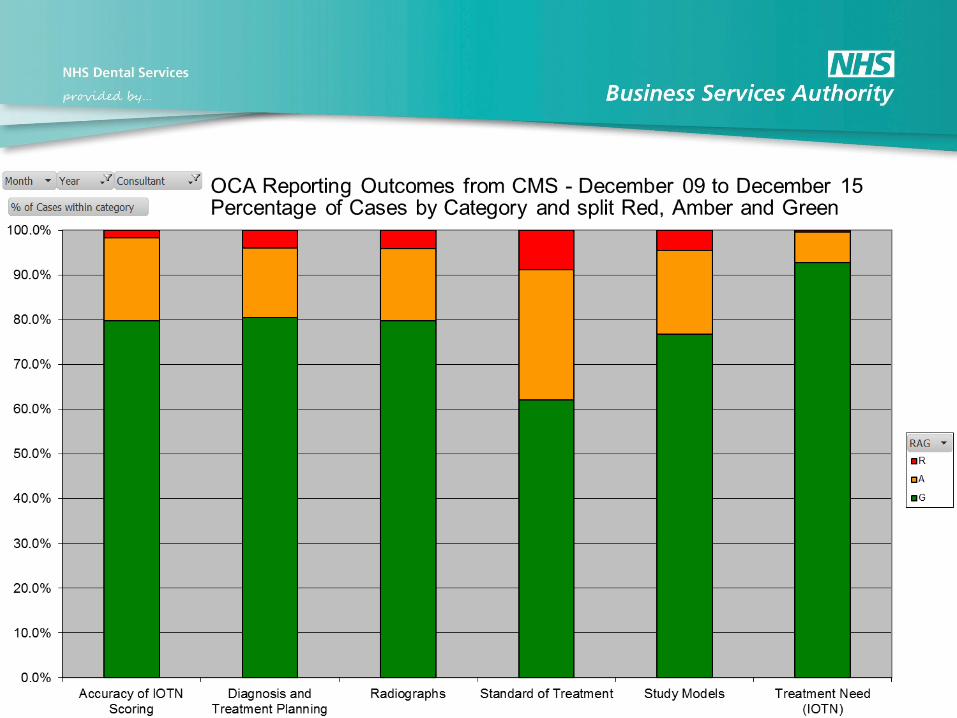
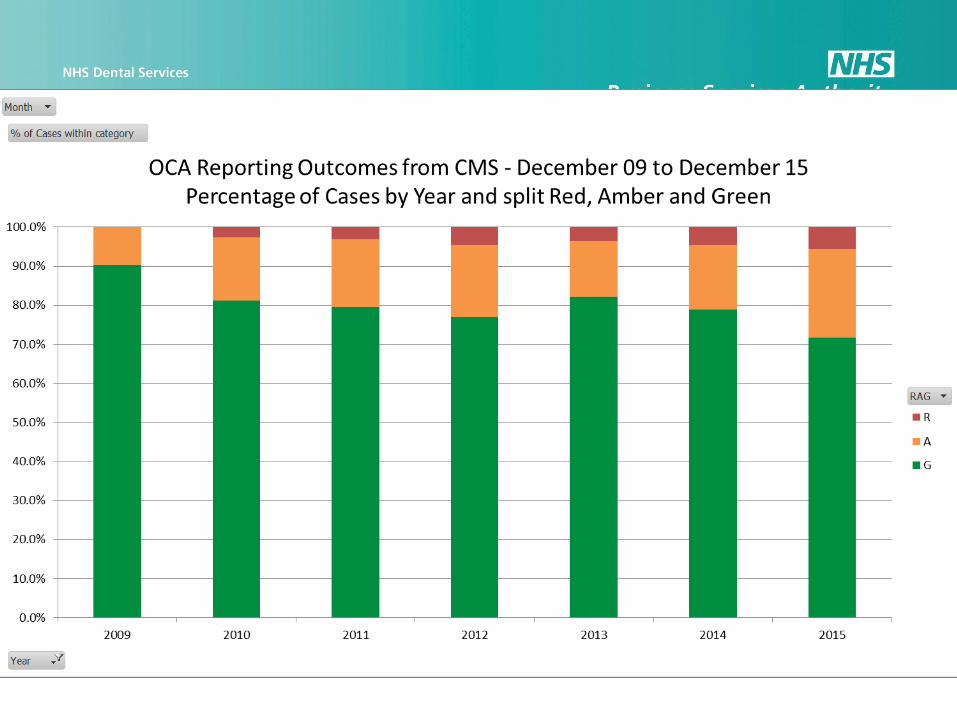
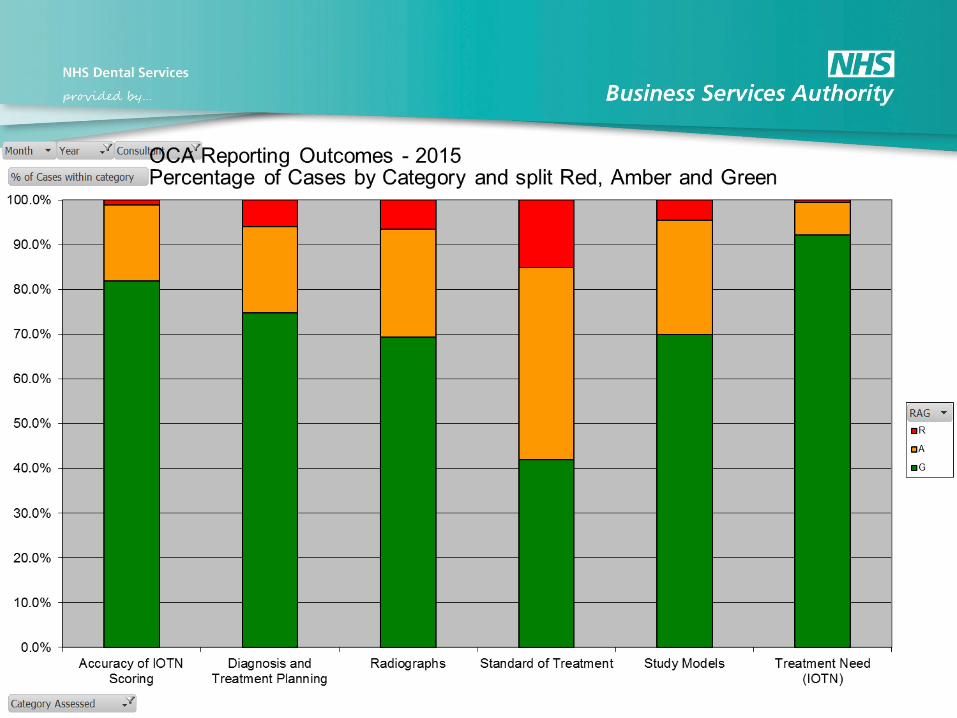
Clinical Monitoring and Reporting
• Five completed cases per Performer
chosen by the NHSBSA
• 450 Performers per annum
• 3-year rolling programme

Clinical Monitoring and Reporting
• Full records requested including pre- and
post-treatment study models, radiographs
and photographs
• Since 1st January 2014 providers have been
requested to submit 3D digital study models
rather than plaster duplicates
• Details are included in the request letter and
available on the NHSBSA website


Clinical Monitoring and Reporting
• Performers are requested to complete
an Orthodontic Case Assessment pro-
forma (rather than forwarding actual
written patient records)
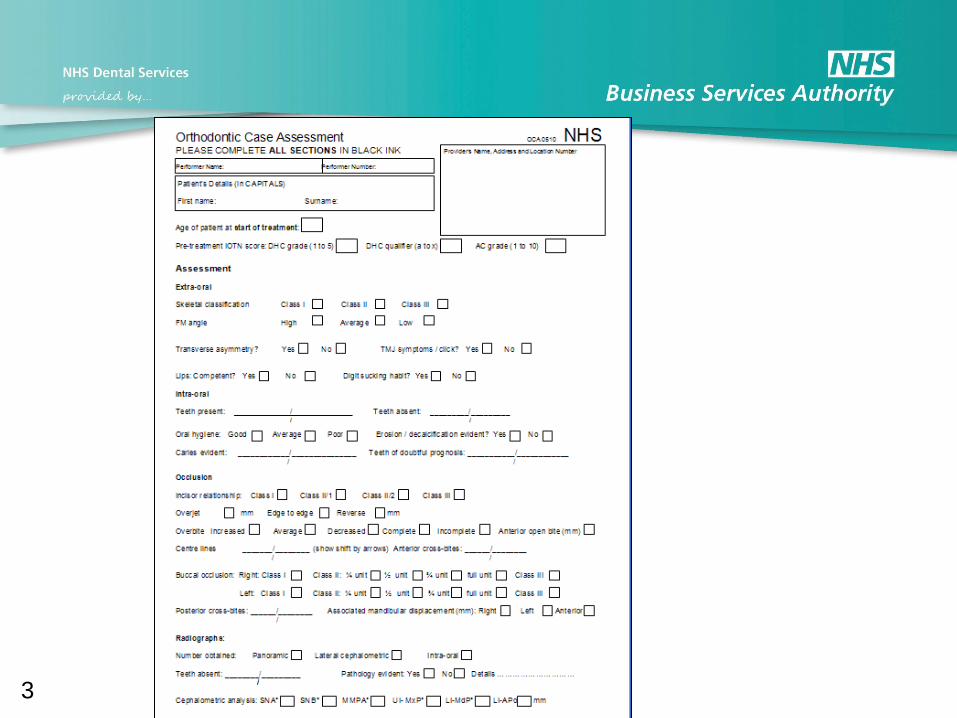
3

4

Clinical Monitoring and Reporting
• Written summary sent to both contractor
and performer
• Observations requested within 14 days
• Report plus observations forwarded to
PCO (AT/LHB)

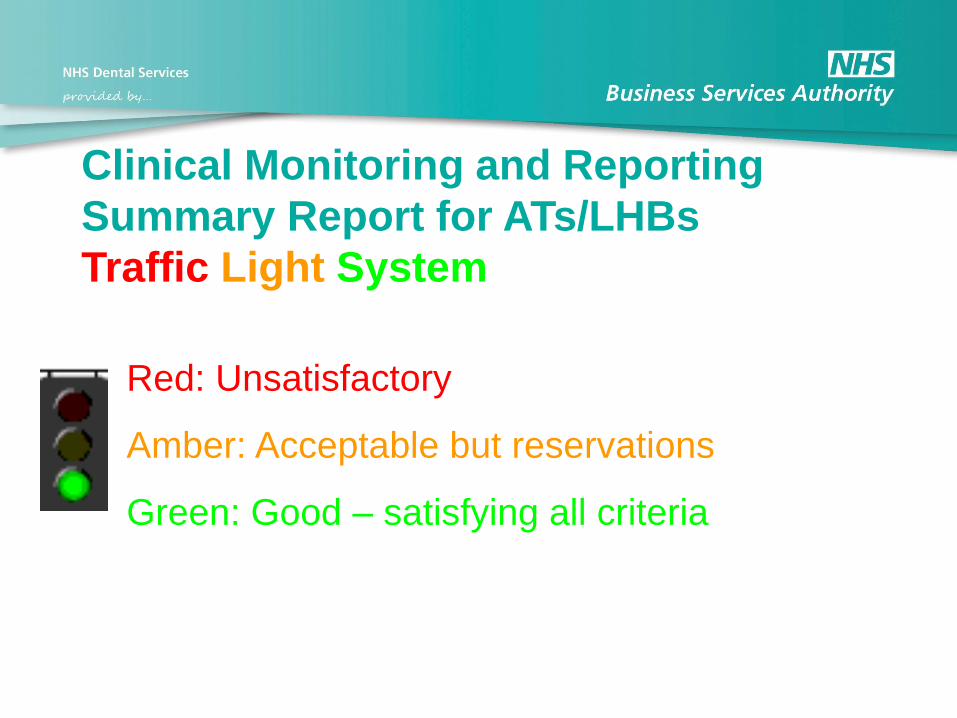
Clinical Monitoring and Reporting
Summary Report for ATs/LHBs
Traffic Light System
Red: Unsatisfactory
Amber: Acceptable but reservations
Green: Good – satisfying all criteria
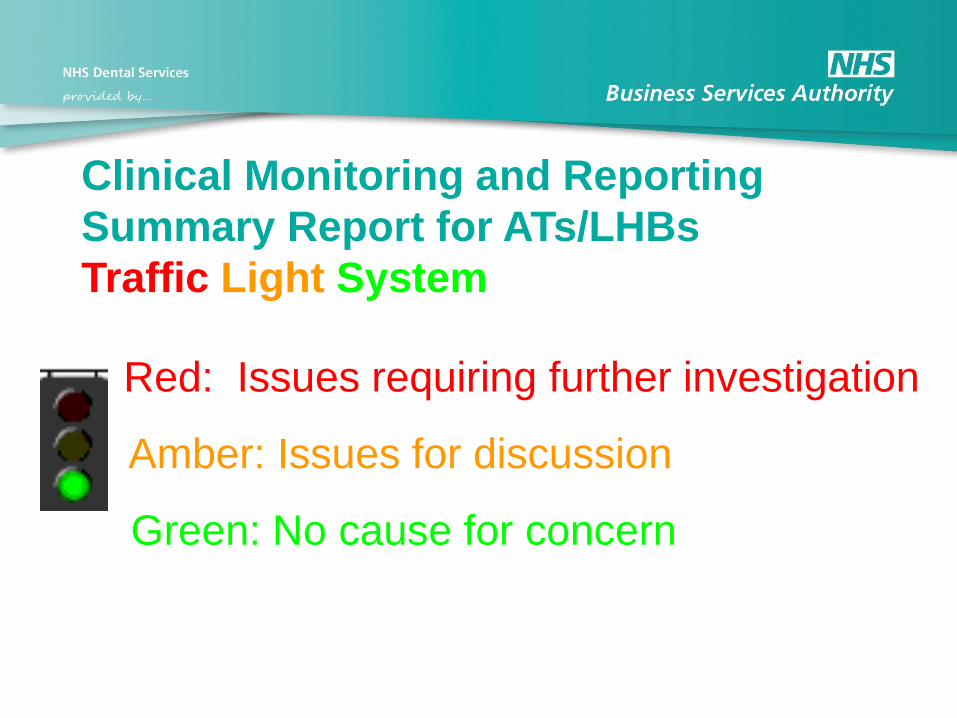
Clinical Monitoring and Reporting
Summary Report for ATs/LHBs
Traffic Light System
Red: Issues requiring further investigation
Amber: Issues for discussion
Green: No cause for concern

Clinical Monitoring and Reporting
• Should concerns arise closer scrutiny could
be arranged using a larger sample or
(rarely) a practice visit
ORTHODONTIC TREATMENT PROTOCOL
Commissioning Specialist Dental Services
DH Gateway Reference 5865
„A high standard of outcome is expected. The
following principles indicate the features to be aimed
at in treating a case…….‟


Brian Kelly Senior Orthodontic Adviser
NHSBSA Dental Services
Update from NHSBSA Dental Services