Embed Size (px)
Citation preview

Working Paper/Document de travail2008-5
Unsecured Debt, Consumer Bankruptcy, and Small Business
by Césaire A. Meh and Yaz Terajima
www.bank-banque-canada.ca

Bank of Canada Working Paper 2008-5
February 2008
Unsecured Debt, Consumer Bankruptcy,and Small Business
by
Césaire A. Meh and Yaz Terajima
Monetary and Financial Analysis DepartmentBank of Canada
Ottawa, Ontario, Canada K1A [email protected]
Bank of Canada working papers are theoretical or empirical works-in-progress on subjects ineconomics and finance. The views expressed in this paper are those of the authors.
No responsibility for them should be attributed to the Bank of Canada.
ISSN 1701-9397 © 2008 Bank of Canada

ii
Acknowledgements
We would like to thank participants at the 2005 Bank of Canada–University of Western Ontario
joint workshop on “Housing and the Macroeconomy”, the 2005 NBER summer institute
workshop “Aggregate Implications of Microeconomic Consumption Behavior”, Econometric
Society World Congress 2005 in London, Society of Computational Economics 2005, the Federal
Reserve Bank of Philadelphia, Université Laval, and University of Montreal. We also thank
Jason Allen, Francisco Covas, Carlos De Resende, Shubhasis Dey, Walter Engert, Martin Gervais,
Dirk Krueger, Wenli Li, Igor Livshits, Vincenzo Quadrini, and Victor Rios-Rull for comments.

iii
Abstract
In this paper we develop a quantitative model of entrepreneurial activity (risk-taking) and
consumer bankruptcy choices and use the model to study the effects of bankruptcy regulations on
entrepreneurial activity, bankruptcy rate and welfare. We show that eliminating bankruptcy
exemptions leads to a modest increase in the fraction of entrepreneurs, a large decrease in the
overall bankruptcy rate and a significant welfare gain. In contrast, eliminating the whole
consumer bankruptcy system leads to a large fall in the fraction of entrepreneurs and a substantial
welfare loss. These two findings suggest that the consumer bankruptcy system is desirable but it
must be well-designed with regard to bankruptcy asset exemptions. In particular, excessive
bankruptcy exemptions can be counter-productive. Finally, we argue that entrepreneurial activity
is important when studying different bankruptcy rules or regulations.
JEL classification: D31, E21, J23Bank classification: Economic models; Financial stability; Financial system regulation and poli-cies
Résumé
Les auteurs construisent un modèle quantitatif formalisant les choix des ménages quant à
l’entrepreneuriat (prise de risque) et à la faillite. Ce modèle leur permet d’étudier l’incidence des
règles de défaillance sur l’entrepreneuriat, le taux de faillite personnelle et le bien-être. Ils
montrent que l’abandon des dérogations prévues aux mesures de liquidation donne lieu à une
légère hausse de la proportion d’entrepreneurs, à une chute notable du taux global de faillite et à
un accroissement sensible du bien-être. À l’inverse, l’abolition de toute possibilité de recours à la
faillite personnelle réduit beaucoup la proportion d’entrepreneurs et le bien-être. Il ressort de ces
deux résultats que la procédure de faillite est un dispositif législatif utile, qui doit toutefois être
bien conçu en ce qui concerne les biens exemptés de saisie. En effet, des dérogations trop
généreuses peuvent être contre-productives. En conclusion, les auteurs soutiennent que l’étude
des lois et règlements relatifs à la faillite doit tenir compte du rôle important de l’entrepreneuriat.
Classification JEL : D31, E21, J23Classification de la Banque : Modèles économiques; Stabilité financière; Réglementation et poli-tiques relatives au système financier

1 Introduction
In this paper, we construct a quantitative model of entrepreneurship and consumer bankruptcy anduse the model to address the following question: what are the effects of bankruptcy regulation onentrepreneurship, bankruptcy rate and welfare? This is motivated by the following observations:
• Entrepreneurial activity is widely regarded as essential for innovation, capital accumulation,and development.1
• The consumer bankruptcy data show that a substantial fraction of debtors in bankruptcyunder Chapter 7 of the U.S. bankruptcy code are entrepreneurs. Specifically, Sullivan, Warren,and Westbrook (2000) and Sullivan, Warren, and Westbrook (1989) show that about 20% ofbankruptcy filings are accounted for by small businesses.
• A distinctive feature of bankrupt entrepreneurs is that they carry extremely large amounts ofunsecured debt. In fact, they account for more than half of all unsecured debt listed amongbankrupts.
• Entrepreneurs hold almost 3.5 times as much unsecured debt as non-entrepreneurs. Theirdebt-to-income ratio is higher than that of non-entrepreneurs.
Despite these observations, the interaction between consumer bankruptcy and entrepreneurshiphas received relatively little attention in quantitative macroeconomic models. In this paper, wepropose a quantitative model that is consistent with these facts and then use it to examine the effectsof tightening bankruptcy rules on entrepreneurial activity, bankruptcy rate and welfare. Specifically,we consider the elimination of bankruptcy asset exemptions (i.e., the level of household assets thata debtor declaring bankruptcy can keep) and the elimination of the whole consumer bankruptcysystem.
We observe the presence of entrepreneurs in consumer bankruptcy because the U.S. personalbankruptcy system, although designed for consumers, also functions as a bankruptcy system forsmall businesses. When firms are noncorporate, debts of the firm are personal liabilities of theentrepreneur-owner. If the business fails, the owner of the firm can declare personal bankruptcyunder Chapter 7, since both business and personal debts will be discharged.2 Small business ownersdeclaring bankruptcy under Chapter 7 must give up all assets they own in excess of a pre-determinedexemption level. However, all their future earnings are exempt from the obligation to repay pre-bankruptcy debt and they can start new businesses and take new jobs—this is known as the “freshstart” in bankruptcy.
The quantitative assessment of consumer bankruptcy laws on entrepreneurship and welfare en-tails the evaluation of two opposite effects. On the one hand, in incomplete markets, the personal
1Entrepreneurship is an important component of the aggregate economy. See Haltiwanger and Krizan (1999) andBednarzik (2000) for the link between job growth and entrepreneurship, and Schumpeter (1934) and Banerjee andNewman (1993) for the entrepreneurship-economic growth nexus. See Cagetti and de Nardi (2006), Quadrini (2000),and Meh (2005) for entrepreneurship as an important factor in explaining wealth accumulation and its distribution.
2Personal bankruptcy law is also important for many small corporations that fail. This is because creditors frequentlydemand personal guarantees from business owners, thus sidestepping the legal shield of an incorporated business.
1

bankruptcy system, by giving both the option to discharge debt and to have bankruptcy asset ex-emptions, provides partial insurance against business failure and job loss. Because entrepreneurshipis risky, this partial insurance allows business owners to smooth consumption across state and as aresult provides risk averse agents with incentives to undertake entrepreneurial activity.3 On the otherhand, financial intermediaries charge a higher premium on borrowing to cover for default risks. To theextent that financial constraints exist, such high interest rates may discourage entrepreneurship andlimit the ability of households to smooth consumption across time. There is indeed evidence suggest-ing that entrepreneurs face financial constraints (Evans and Jovanovic (1989)) and that bankruptcymakes it difficult for entrepreneurs to get funding in U.S. states with generous exemptions (Berkowitzand White (2004)). We denote the first effect, the insurance effect and the second the credit supplyeffect. Evaluating the effects of bankruptcy laws mainly involves assessing the trade-off betweenthe insurance and credit supply effects. These effects also exist with non-entrepreneurs, but withentrepreneurs, there are direct implications for economic performance.
To conduct our quantitative analysis, we use an overlapping generation model of entrepreneurialand bankruptcy choices that feature these two opposing effects. Every period, households can chooseto undertake risky entrepreneurial activity or to be workers. Workers face uninsurable idiosyncraticearnings shocks while entrepreneurs face not only earnings risks but also uninsurable idiosyncraticinvestment risks. Entrepreneurial activity requires a minimum scale. Households can save witha risk-free asset and borrow from competitive financial intermediaries to smooth consumption, tobecome entrepreneurs, and to increase the scale of their businesses. Borrowing entails a financialintermediation cost per unit of funds borrowed. Every period, we allow households (workers andentrepreneurs) to choose to default on their non-contingent unsecured debts. The default choice ismodelled as a decision to file for personal bankruptcy under U.S. Chapter 7 where unsecured debts arefully discharged in exchange for assets in excess of pre-determined exemptions. Naturally, this defaultoption leads financial intermediaries to charge a default premium on loans to households. FollowingChatterjee, Corbae, Nakajima, and Rıos-Rull (2007) and Livshits, MacGee, and Tertilt (2007), weassume that when making loans, financial intermediaries can observe a household’s current income,occupation, level of business capital, savings, debt holdings and age. As a result, the equilibriumprice of loans to borrowers is a function of their current income, occupation, portfolio (savings andbusiness investment), age and level of debt.
Our quantitative model successfully replicates the above regularities on entrepreneurship andbankruptcy. In particular, the model accounts for the extraordinarily high level of debt of en-trepreneurs in bankruptcy, the high bankruptcy rate of entrepreneurs relative to workers, and thehigh debt-to-income ratio of entrepreneurs relative to workers. The model also generates the hump-shape profile of the bankruptcy rate over the life-cycle. Given the success of our model in replicatingthe data, we use it to conduct two policy experiments that are meant to capture the tighteningof bankruptcy rules as recently approved in the U.S. The first policy experiment consists of theelimination of the bankruptcy exemption. In such a case the only benefit associated with declaringbankruptcy is the full discharge of debt (the fresh start). The second policy reform is the eliminationof the entire bankruptcy system which implies that the default option is removed. We find that elim-
3Moskowitz and Vissing-Jorgensen (2002) provide evidence on risk in entrepreneurship.
2

inating the bankruptcy exemption leads to an increase in the number of entrepreneurs, a decrease inthe bankruptcy rate, and most importantly a significant welfare gain. The welfare gain comes fromthe increase in entrepreneurial activity and the ability to better smooth consumption over time withthe decrease in interest rate. The credit supply effect of the bankruptcy exemption thus dominatesthe insurance effect.
In contrast, eliminating the entire consumer bankruptcy system leads to a large decrease inthe number of entrepreneurs and a significant welfare loss. The insurance effect of the consumerbankruptcy system is more valuable than the credit supply effect and thus promotes entrepreneurshipand smoothes consumption across states. The fact that the bankruptcy exemption is welfare-reducingwhile the whole bankruptcy system is welfare-improving provides a very clear message: the consumerbankruptcy system is essential for its insurance role but must be well designed in the sense thatbankruptcy exemptions have to be low.
Another key finding of this paper is that entrepreneurial activity plays a central role in consumerbankruptcy law analysis. When entrepreneurship is not explicitly modelled, the welfare implicationsof bankruptcy regulations are small and may even have different directions relative to an economyin which entrepreneurial activity is accounted for. For example, in the model without entrepreneurs,eliminating bankruptcy asset exemptions leads to a small welfare gain (0.024% of life time consump-tion) while the welfare gain is large in the model with entrepreneurs (1.78%). With respect to theelimination of the entire consumer bankruptcy system, the direction of the welfare effects variesdepending on whether or not entrepreneurs are included in the economy. In contrast to the casewhen entrepreneurs are considered, eliminating the entire consumer bankruptcy system in the modelwithout entrepreneurs increases welfare, although the welfare gain is relatively small. This result isconsistent with Athreya (2002) and also with Livshits, MacGee, and Tertilt (2006) when there areno expense shocks and only earnings shocks are present.
A number of recent papers have focused on studying the magnitude of the economic effects of per-sonal bankruptcy reform in quantitative dynamic equilibrium models (eg., Athreya (2001), Athreya(2004), Chatterjee, Corbae, Nakajima, and Rıos-Rull (2007), Li and Sarte (2006), Livshits, MacGee,and Tertilt (2006) These papers have, however, ignored entrepreneurship. As we have shown in thispaper, accounting for entrepreneurial activity is crucial for studying the determinants of bankruptcyand for understanding the economic implications of bankruptcy policy. Chatterjee, Corbae, Naka-jima, and Rıos-Rull (2007) make theoretical and quantitative contributions in a macroeconomicmodel with a bankruptcy option in which prices of unsecured loans depend on loan size and house-hold characteristics. They show that means-testing under Chapter 7 leads to large welfare gains.Livshits, MacGee, and Tertilt (2006) in a bankruptcy model with wage garnishment, illustrate theimportance of expense shocks and life-cycle effects when comparing bankruptcy rules. Li and Sarte(2006) consider aggregate production and the choice between Chapter 7 and Chapter 13 and findthat eliminating consumer bankruptcy and lowering the bankruptcy exemption increase welfare. Intheir model, however, all households borrow at the same interest rate regardless of their type or theamount borrowed. In contrast to Li and Sarte (2006), Athreya (2002), who also assumes a singleinterest for all borrowers, finds that eliminating the bankruptcy system improves welfare. None ofthese models account for entrepreneurial activity and the effects of the consumer bankruptcy system
3

on income through risk-taking.Our paper is also related to an independent work of Akyol and Athreya (2007), who also study
bankruptcy with occupational choices. In their model, however, only entrepreneurs are allowed to filefor bankruptcy under Chapter 7 and workers are not. This is not only inconsistent with the data, butit also substantially exaggerates the effects of the bankruptcy asset exemption on entrepreneurshipand welfare. Another important feature of their framework that also contributes to exaggeratethe effects of the bankruptcy exemption is that in their economy, only poor households with littleemployment prospects move to entrepreneurship. This feature makes self-employment a disguisedform of unemployment and more sensitive to bankruptcy. In our work, on the other hand, individualswith good employment prospects could decide to enter entrepreneurship if they have good businessideas.
Our paper is related to several empirical studies of bankruptcy.4 Fan and White (2003) in theirprobit analysis show that in states with high homestead exemptions (exemption of on housing equityfor homeowners), the probability of becoming self-employed is high. This result may, however, bedue to state-specific effects such as tax laws, banking regulations, and geographical location. Oneof their results that may support the case for state-specific effects is that renters in these stateshave also a high probability of becoming self-employed since renters do not home equity. Moreover,given the reduced form approach of their analysis, they are unable to conduct a policy experiment.Using cross-country analysis, Armour and Cumming (2005) argue that the tighter is the personalbankruptcy law the lower is the self-employment rate across countries. For instance, they find thata ten-year reduction in the time to discharge unsecured debt increases self-employment rates byapproximately 1.5%in the countries considered. This result is consistent with our finding, thoughmuch like Fan and White, their analysis suffers from country-specific effects.
The plan of the paper is as follows. In the next section we briefly describe the bankruptcylaw in the U.S., its link to entrepreneurship, and data unsecured debt and debt-income ratio inthe population. Section 3 presents the model economy. Section 4 parameterizes the model andSection 5 discusses the benchmark results. Section 6 conducts the quantitative analysis using theparameterized version of the model. Section 7 considers the importance of entrepreneurship forbankruptcy analysis. Section8 concludes.
2 Consumer bankruptcy law and entrepreneurship
Bankruptcy law In many countries, households can declare bankruptcy on their unsecured debts,such as credit card debts. In the U.S., for example, households can choose either to file under Chapter7, “total liquidation” or Chapter 13, “payout plan”.5 Chapter 7 fully discharges the unsecured debts,but requires household debtors to give up all assets above an exemption level. Future earnings ofdebtors are exempt from the obligation to repay. This is known as the “fresh start” in bankruptcy.Filing under Chapter 7 precludes the debtor from declaring bankruptcy under Chapter 7 for six
4Congressional Budget Office (2000) provides an excellent review of the empirical literature.5The equivalent of Chapter 7 and Chapter 13 in Canada are the “Straight Bankruptcy” and the “Consumer Proposal”
respectively.
4

years. Most bankruptcy filings (about 70% of total) are done under Chapter 7.Under Chapter 13, debtors do not receive any immediate discharge of their unsecured debts.
Instead they must propose a plan to use some of their future earnings to repay part of or all theirunsecured debt over 3 to 5 years while keeping all their assets. If they respect this rescheduling planthe remaining unsecured debts are fully discharged. This procedure is generally less favorable tohouseholds (such as business owners) than Chapter 7 because often they do not have any nonexemptassets. This may explain why most bankruptcy filings are done under Chapter 7. Since Chapter 7is the most preferred bankruptcy procedure by households, we therefore model incentives to file forpersonal bankruptcy as a decision under Chapter 7.
Although the bankruptcy law is uniform across the U.S., bankruptcy exemptions are set by thestates and vary widely. A bankruptcy exemption is the level of household assets that a debtordeclaring bankruptcy can keep. Most states have several types of exemptions: for equity in owner-occupied housing (the homestead exemption), for equity in cars, for cash, and for various types ofgoods. In most states, the homestead is the largest, and other exemptions are small.
Causes of bankruptcy Sullivan, Warren, and Westbrook (2000) study a survey of bankrupthouseholds in 1991 where they asked these debtors the reasons for their bankruptcy. They find that67.5% of bankrupt debtors identify job loss (particularly, unemployment or personal business failure)as the main cause of bankruptcy.6 Hence, anything, such as business failure, that causes householdincome to fall exposes them to the risk for bankruptcy filings. The next two immediate reportedcauses of personal bankruptcy are family (divorce, unexpected children) and medical problems. Othersources are for example, credit problem and housing difficulties.
Entrepreneurs in bankruptcy Sullivan, Warren, and Westbrook (1989) show that a substantialfraction of bankrupts are entrepreneurs. Specifically, they find that 20% were either entrepreneursat the time of filing or had been entrepreneurs before they filed for bankruptcy. Given that thefraction of entrepreneurs in the population is lower than the fraction of entrepreneurs in bankruptcy,entrepreneurs are over-represented in bankruptcy so that they are about twice more likely to bebankrupt than workers. A key feature of entrepreneurs in bankruptcy is that they typically haveextremely high debt levels, with particularly high levels of unsecured debt although they representonly 20% of all bankrupt debtors. Entrepreneurs account for more than half of the total unsecureddebt. This is illustrated in Table 1 which presents the balance sheets of entrepreneurs and workers(non-entrepreneurs) in bankruptcy. The table shows that entrepreneurs have not only higher assetsthan workers, but also higher debts (secured and unsecured debts) than workers. For example, themean of unsecured debts for entrepreneurs is almost $40,000 for entrepreneurs and only just lessthan $10,000 for workers.
Entrepreneurs are more heavily burdened by debts. This is shown in Table 2 which presentsdebt-income ratios of workers and entrepreneurs. The average debt-income ratio of entrepreneurs is7.1 which implies that a typical entrepreneur debtor in bankruptcy would owe debts greater than
6Multiple responses were permitted during the survey.
5

Table 1: Distribution of Debts and Assets for En-trepreneurs and Workers in Bankruptcy
Total Unsecured SecuredDebt Debt Debts Assets
Entrepreneurs
Mean $85,824 $38,087 $47,897 $55,43425th percentile 24,931 7,966 6,362 8,985Median 53,193 19,039 25,976 40,59275th percentile 109,899 46,305 59,000 71,727
Workers
Mean $26,753 $9,827 $16,850 $22,83525th percentile 8,715 3,475 2,068 2,196Median 16,953 6,063 8,010 10,59575th percentile 35,750 10,577 25,275 37,942
Source: Sullivan, Warren and Westbrook (1989), Table 6.1.
seven years’ income. By contrast, a typical worker would owe debts equal to less than three years’income—i.e., debt-income ratio equal to 2.5.
Table 2: Distribution Debt-Income Ratios for Entrepreneurs and Work-ers in Bankruptcy
Entrepreneurs WorkersMean 7.1 2.525th percentile 1.4 0.7Median 2.7 1.375th percentile 7.5 2.3
Source: Sullivan, Warren and Westbrook (1989), Table 6.2.
Unsecured debts by occupation So far we have reported information on entrepreneurs andworkers in the bankruptcy sample. It is also important to have know the amount of unsecured debtand debt income ratio in the economy in a non-bankruptcy data set. To do so, we use the Survey ofConsumer Finance of 2001 to present average amount of unsecured debt and the debt-income-ratioof entrepreneurs and workers. The results are reported in Table 3. There are a few things to notefrom the table. First, entrepreneurs have higher debt-income ratio than workers. Put differently,entrepreneurs owe on average more than seven years of income in unsecured debts while workers owejust five years of income. Second, entrepreneurs hold more that 30% of total unsecured debt andtheir unsecured debt is almost three and half times the unsecured debts of workers.
6

Table 3: Unsecured debts and Debt-Income Ratios for Entrepreneursand Workers in the SCF
Entrepreneurs Workers
Unsecured debt to income ratio 7.14 5.14Unsecured debt $10,009 $3,034Fraction of Unsecured debt 31.03% 69.97%
Source: Survey of Consumer Finances, 2001.
There is also indirect evidence (not from the SCF) that suggests that entrepreneurs use creditcards to finance their businesses. In 1998 a study from Arthur Anderson reported in Sullivan, Warren,and Westbrook (2000) argue that 47% of small businesses use credit cards to finance investment.
The effects of bankruptcy law on entrepreneurship Entrepreneurs benefit from higher per-sonal bankruptcy exemptions because exemptions provide partial wealth insurance, but at the costof a reduction in credit availability (credit rationing and higher interest rate) as the exemption levelrises. Using the family-level panel data, Survey of Income and Program Participation (SIPP) andthe variation of bankruptcy exemptions across states, Fan and White (2003) investigate whetherhouseholds are more likely to become entrepreneurs if they live in states with higher homestead ex-emptions. They find that households who are homeowners are about 35% more likely to be businessowners if they live in states with unlimited exemption—hence, the wealth insurance effect of home-stead exemptions encourages business ownership. Moreover, Berkowitz and White (2004), using the1993 National Survey of Small Business Finance (NSSBF), find that small firms are more likely to bedenied credit if they are located in states with unlimited homestead exemptions than low homesteadexemptions, and that even when they receive the loan, the loans are on average smaller and lendingrates are higher. Armour and Cumming (2005) provide cross-country evidence and show that thetighter is the personal bankruptcy law the lower is the self-employment rate across countries.
3 Model economy
The model is similar to Chatterjee, Corbae, Nakajima, and Rıos-Rull (2007) and Livshits, MacGee,and Tertilt (2006) and the main difference is that entrepreneurial activity is explicitly modelled.Specifically, the key characteristics are as follows: first, the model features a bankruptcy choiceas well as an entrepreneurial choice. Second, there are two sources of idiosyncratic uncertainty:uninsurable idiosyncratic investment risks and earnings risks. There is no aggregate uncertainty.
3.1 Preferences
The model economy is populated by overlapping generations of individuals who live for J peri-ods. The population grows at a constant rate n. Each individual of age j maximizes her expected
7

discounted lifetime utility,
E0
J∑j=1
βj−1u
(cj
sj
), u
(c
s
)=
(cs
)1−σ − 11− σ
, (1)
where β > 0 is the intertemporal discount factor, σ > 1 is the coefficient of relative risk aversion, cj
is the consumption good at age j, and sj > 0 is an exogenous parameter that captures the evolutionof family sizes over the life-cycle. The introduction of the family size over the life-cycle is importantfor explaining the hump-shaped life-cycle profile of consumption (Attanasio and Rios-Rull (1999)).
3.2 Endowments and stochastic processes
In each period, age-j agents are endowed with earnings y(ε, j) = yjε, where yj is the deterministicaverage life-cycle profile of earnings and ε ∈ E = ε1, ..., εNε is an idiosyncratic earnings shock. Theshock ε is observed at the beginning of the period and follows a first-order Markov process with atransition probability Qε (ε′, ε).7 The shock received by age-1 agents are drawn from the stationarydistribution Q∗
ε(ε).Every period, each age-j household can run a risky technology that returns, G(k, η), in the next
period with capital input k. The variable η is an idiosyncratic business shock that is unknown when k
is chosen. The shock, η ∈η, ..., η
, follows a first-order Markov process with a transition probability,
Qη (η′, η). Age-1 agents draw η from the invariant distribution Q∗η(η) of Qη. We assume that there
is a minimum size of business k. We call households that decide to run the risky technology withk ≥ k entrepreneurs and the remaining of the population workers. The gross return, G, is given bythe following equation:
G(η, k) = ηkν + (1− δ)k. (2)
The first component is the output produced and ν < 1 is the return-to-scale parameter. Thesecond component is the non-depreciated capital, where δ is the depreciation rate.
3.3 Financial intermediation
There is a competitive intermediation sector that processes all borrowing and lending. The returnon savings s ≥ 0 is given by the risk-free rate r∗. Household can borrow unsecured debts (d ≥ 0),that is non-collateralized debts, such as credit cards loans. When making loans to households,financial intermediaries incur transaction cost φ per unit of loan. Individuals can declare bankruptcyon unsecured debts. Following Chatterjee, Corbae, Nakajima, and Rıos-Rull (2007) and Livshits,MacGee, and Tertilt (2006), we assume that financial intermediaries charge individual-specific priceson unsecured debts to capture the type-specific risk of bankruptcy. The underlying assumption isthat, when making unsecured loans to a household, intermediaries observe the level of total unsecuredloans, the business investments, the current earnings shock, the current business shock, and theage of the borrower. As a result, the price of the unsecured debt charged to a household with a
7All variables denoted by prime (’) refer to next period variables.
8

portfolio P = (s, k, d), shocks, x = (ε, η), and age, j, is given by qd (s, k, d, ε, η, j) which in turnleads to an endogenous borrowing limit. The corresponding gross interest rate of this unsecured loanis Rd (s, k, d, ε, η, j) = 1/qd (s, k, d, ε, η, j). Because of perfect competition financial intermediariesmake zero profit on unsecured loans made to each type of households. This implies there is no crosssubsidization of interest rates across different types of borrowers. Let us define Λ (x,P ′, j) to be theprobability that an age-j household with next period portfolio, P ′ = (s′, k′, d′), and current shocks,x, will file for bankruptcy in the next period. The zero profit condition on unsecured loans to eachtype of household borrower implies the following expression:
qd (P ′, x, j) = [1− Λ (P ′, x, j)] qd (3)
+ Λ (P ′, x, j) E
[max s′ + G (η′, k′)− χ, 0
d′ |b = 1]
qd
where qd = 11+r∗+φ is the price of unsecured loans when the probability of default is zero, χ is the
government specified bankruptcy exemption, and Λ is the probability of default (which is defined inthe equilibrium). The variable b ∈ 0, 1 represents the decision of whether to declare bankruptcy ornot. Note that the definition of the price of qd takes into account how much financial intermediariescan collect when individuals declare bankruptcy. This is explained below in section 3.4.
3.4 Bankruptcy provisions
Households can declare bankruptcy on their unsecured debts. Bankruptcy in the model will besimilar to U.S. Chapter 7 fresh start provision.8 Filing for bankruptcy leads to a full discharge ofunsecured debt d of the household borrower. The household must, however, give up any assets inexcess of a specified bankruptcy exemption level, χ, to the creditor. More specifically, the amountof asset that a household with a business of size, k, a business shock, η, and savings, s, can keep inbankruptcy is given by the following expression:
min G(η, k) + s, χ , (4)
where the first term represents business income plus savings.In addition to losing non-exempted assets a bankrupt household is also subject to the following
punishment. The bankrupt households lose a fraction λ of their current labor income. The parameterλ summarizes all non-exemption costs associated with bankruptcy filing: (i) the stigma cost, (ii) thepecuniary costs of a bad credit rating, and (iii) the exclusion from the credit market.
We end this section by assuming that a household cannot die with debts or assets. Therefore atage J we have the following: d = 0, s = 0, and k = 0.
8In the U.S. households can also file under Chapter 13. Contrary to Chapter 7, filing under Chapter 13 does notdischarge all unsecured debts, instead the debts are rescheduled. In the U.S., however, around 70% of all bankruptcyfilings occur under Chapter 7.
9

3.5 Timing of events
It is convenient to define a ≡ s + G (η, k)− d + y (ε, j) as the resources at hand after the bankruptcydecision. The timing of events within a period is as follows. At the beginning of the period, house-holds observe the earnings and business shocks, x = (ε, η). Given shocks, x, and the beginning-of-period composition of the household’s portfolio, P = (s, k, d), the agent decides whether to declarebankruptcy or not. If the household declares bankruptcy, the non-exempted assets are seized by thecreditor, a fraction, λ, of current labor income is lost, and all unsecured debts are fully discharged.Bankrupt households and non-bankrupt households differ mainly in their debt or asset position.Households choose their current consumption, savings, borrowing, and business investments deci-sions. This is summarized as follows.
-
t t+1
?
Pre-bankruptcy state:
j, ε, η, s, d, k
6
Bankruptcy decision:
b
?
Post-bankruptcy state:
j, ε, η, a
6
Consumption-portfolio decisions:
c, s′, d′, k′
?
j + 1, ε′, η′, s′, d′, k′
Time
3.6 The individual’s decision problem
We define Vj(x, a) to be the post-bankruptcy decision value function of an age-j household withcurrent shocks, x = (ε, η), and debt, d. Similarly, define Wj(x,P, a) as the pre-bankruptcy decisionvalue function of an age-j household whose beginning-of-period shocks are x and beginning-of-periodportfolio is P. We assume that the value function at age J + 1 is VJ+1(·) = 0.
The pre-bankruptcy decision value function of an age-j individual is given by
Wj (x,Ω; χ) = maxb∈0,1
Vj (x, a;χ) (5)
where
a =
s + G (η, k)− d + y (ε, j) if b = 0
min s + G (η, k) , χ+ (1− λ)y (ε, j) if b = 1(6)
10

If the household chooses not to declare bankruptcy (b = 0), then his or her post-bankruptcydecision asset level is given by saving, plus business income, minus debt and plus labor income. Ifthe household chooses to declare bankruptcy (b = 1) his or her asset level is the exempted assetsplus labor income net of bankruptcy costs.
The post-bankruptcy decision value function is defined as follows:
Vj (ε, η, a) = maxc,s′,k′,d′
u
(c
nj
)+ βE [Wj+1 (ε′, η′, s′, k′, d′) |ε, η] (7)
subject to
c +s′
1 + r∗+ k′ − qd (s′, k′, d′, ε, η, j) d′ = a. (8)
c, d′, s′ ≥ 0, and k′ ≥ k or k′ = 0. (9)
Equation (8) is the budget constraint. On the right hand side of the budget constraint are assets(or resources at hand), a. On the left hand side of the budget constraint, c is the current consumption,s′ is savings with the price q∗ = 1/(1 + r∗), d′ is unsecured loans with the price function qd(x,P ′, j)defined in equation (3), and k′ is business investments for the next period. If k′ = 0, the householdchooses to become a worker in the next period and if k′ ≥ k the household becomes an entrepreneur.Equation (9) presents the lower limits on the choice variables.
3.7 Equilibrium
We are now ready to define the competitive equilibrium.
Definition 1 Given the risk-free bond price, q∗ and the bankruptcy exemption, χ, a recursive com-petitive equilibrium is a set of value functions, V (·) and W (·), and a set of policy functions, s(·), d(·),k(·), c(·), and b(·), an unsecured debt price function, qd(·), and a probability of declaring bankruptcy,Λ(x,P ′, j) such that
1. V (·) and W (·) solve the household problem, and s(·), d(·), k(·), c(·), and b(·) are the associateddecision rules;
2. The unsecured debt price function, qd(·) is obtained by the zero profit conditions for financialintermediaries in equation (3);
3. The default probability is defined by
Λ(x,P ′, j) =∑x′
b(x′,P ′, j + 1
)Qε
(ε′, ε
)Qη
(η′, η
). (10)
11

4 Benchmark Parametrization
To obtain numerical solutions and conduct policy analysis, we need to choose particular values forthe parameters of the model economy. The parameters to be calibrated are related to the householdspreferences, the stochastic process for labor efficiency, the stochastic process of business income,technology in the entrepreneurial sector, technology in the intermediation sector, and the bankruptcysystem.
4.1 Demographics
We choose the model period to be 5 years. Agents start their life at age 20 and die at age 80 with 12periods (J = 12). The annual population growth rate is 0.01 (n = 1.015 − 1). The life-cycle profileof family size sj , is calculated by multiplying the reciprocal of the average family size of each agegroup from 2001 SCF, j, by the family equivalence scale given by Nelson (1993).
4.2 Preferences
The preference parameters include the coefficient of relative risk aversion, σ, and the discount factor,β. The relative risk aversion parameter, σ, is set 2.0. This number is in the range of estimatessuggested by Auerbach and Kotlikoff (1987) and Prescott (1986). The annual discount factor is set0.96 so that β = 0.965.
4.3 Labor ability
The average age-profile of earnings yj is taken from Hansen (1993) and adjusted for social security.The persistent idiosyncratic shock, ε, is assumed to follow a four-state Markov process with transitionprobability Qε. To calibrate Qε, it is assumed that the logarithm of the household’s labor earningsfollows a first-order autoregressive process:
ln (εt+1) = ρε ln (εt) + ξt+1, ξt+1 ∼ N(0, σ2ξ ). (11)
Following Storesletten, Telmer, and Yaron (2004) and Livshits, MacGee, and Tertilt (2006) weset annual the value of ρε = 0.99 and σ2
ξ = 0.016. To convert these values into the five year periodwe assume that: ρε = 0.995 and σ2
ξ =(1 + ρε + ρ2
ε + ρ3ε + ρ4
ε
)× 0.016.
Given (ρε, σξ) , the procedure described in Tauchen and Hussey (1991) is used to approximatethe above autoregression by a four-state Markov chain.
4.4 Intermediation technology
Two parameters need to be set in this section: the exogenous risk-free rate, r∗, and the transactioncost parameter,φ. The annual risk-free rate is set equal to 4%, which is the average return oncapital reported by McGrattan and Prescott (2000). The risk-free rate for a five year period is thusr∗ = (1.04)5 − 1 = 21.67%. The transaction costs are calibrated to match the observed interest ratespread between secured and unsecured debt. Following Athreya (2004), the annual transaction cost
12

on unsecured borrowing are 6.4%. The five-year interest rate on unsecured borrowing is (1.104)5−1 =64%. This implies that the transaction cost for the five-year period is the difference between thefive-year borrowing rate and the five-year risk free rate: φ = 64%− 21.67% = 42.33%.
4.5 Business technology
There are three parameters to be set in this section: the returns-to-scale parameter, ν, the minimumbusiness size k, and the depreciation rate, δ. Following Cagetti and de Nardi (2006), we set ν to 0.7.The minimum size is set to match the fraction of entrepreneurs in the data. Using the 2001 Surveyof Consumer Finance the fraction of population that is business owner is 12%. This number rangesbetween 8% and 18% (see Gentry and Hubbard (2000) and Quadrini (1999)). Finally, the annualdepreciation rate is set to δ = 0.062.
4.6 Bankruptcy law
The bankruptcy law in this economy is characterized by two parameters: the bankruptcy exemption,χ, and the bankruptcy cost of filing, λ. In the U.S., while bankruptcy is a matter of federal lawand the procedure is uniform across the country, Congress gave the states the right to set their ownbankruptcy exemption levels, and these vary widely. Most states have several type of exemptionswhich can be broadly classified into two groups: the homestead exemption and the non-homesteadexemption. The homestead exemption is the exemption on the equity in owner-occupied principalresidence. The non-homestead exemption is: for equity in cars, for cash, and for various types ofgoods (furniture, clothing, cooking utensils, farm implements, family bibles, and tools for trade, etc).In most states, the homestead exemption is the largest, and the non-homestead exemption is small.In the U.S. the average national homestead bankruptcy is $25,000 and while the non-homesteadexemption is $6,797 in 1994. In the model, we will consider bankruptcy exemption as the sum ofboth homestead and non-homestead exemptions. In the U.S., the average annual earnings is about$58,000 in 1994. The annual mean total bankruptcy exemption to mean earnings ratio is 0.79.Normalizing mean earnings to unity implies that χ = 0.158 = 0.79÷ 5.
The parameter, λ, is calibrated to match the overall bankruptcy rate. Fay, Hurst, and White(2002) report that the national bankruptcy rate varies between 0.33 percent and 0.88 percent overthe period 1984-1995. The targeted annual bankruptcy rate in the model is chosen to 0.88. Thebankruptcy rate for the five year period is obtained by multiplying the annual bankruptcy rate byfive.
The bankruptcy rate of entrepreneurs is obtained by using (i) the fact that 20% of bankruptsare entrepreneurs (Sullivan, Warren, and Westbrook (2000)), (ii) the fraction of entrepreneurs in theeconomy (12%) and (iii) the overall bankruptcy rate. The bankruptcy rate of entrepreneurs is givenby 0.20 times the overall bankruptcy rate and divided by the measure of entrepreneurs.
13

4.7 Stochastic process of business shocks
We assume that the transition probability function, Qη, of the business shock is a four-state discreteapproximation, a la Tauchen and Hussey (1991), to an AR(1):
ln ηt = (1− ρη)µη + ρη ln ηt−1 + ζt, with ζt ∼ N(0, σ2ζ ). (12)
Q∗η is the invariant distribution of the transition matrix Qη. We have four parameters (λ, k, µη, σζ)
that are set endogenously to match the following five targets in equilibrium: (1) the fraction ofentrepreneurs in the population, 12 percent, where entrepreneurs are defined as business owners whohave active management in the 2001 Survey of Consumer Finances. (2) The fraction of bankrupthouseholds that are entrepreneurs. Sullivan, Warren, and Westbrook (1989) report that 20 percentof bankrupt households are entrepreneurs. (3) The overall five-year bankruptcy rate of 4.4 percent.(4) The entrepreneurs’ income to workers’ income ratio is 2.72 in the 2001 SCF. The annual valuesfor the targets are summarized in Table 4
Table 4: Moments Targeted in the Benchmark in Annual Values
Moment Values Source
Fraction of Entrepreneurs 12% SCF (2001)Fraction of bankrupts that are entrepreneurs 20% Sullivan, Warren, and Westbrook (1989)Overall annual bankruptcy rate 0.88% Athreya (2004)Entrepreneurs’income to workers’ income 2.72 SCF(2001)
The fixed parameters and the endogenously set parameters (λ, k, µη, σζ , ρη) are listed in Table 5.
Table 5: Calibrated Parameters of the Benchmark Economy
Parameters Values
Fixed parametersσ Relative risk aversion 2β Discount factor 0.815J Lifetime 12ν Degree of return to scale 0.700ρε Coefficient of autocorrelation of labor income 0.951σ2
ξ Annual variance of labor income 0.007r∗ Risk-free rate (%) 21.67φ Annual transaction costs on unsecured debt 0.064χ Bankruptcy exemption 0.158
Endogenously calibrated parametersµη Average business shock 0.224σζ Standard deviation of business shock 0.657ρη Coefficient of autocorrelation of business shocks —k Minimum business size 1.273λ Bankruptcy punishment 0.466
14

5 Benchmark results and properties of model
In this section, we present the calibration results and the properties of the model. Table 6 reportsthe target statistics and the implied results from the model. The table shows that, the modelmatches relatively well the targets. For example, in the data the overall annual bankruptcy rateand the fraction of entrepreneurs are 0.88% and 12% respectively; the model obtains 0.89% and 12%respectively for these variables.
Table 6: Moments Targeted in the Benchmark in Annual Values
Moment Targets Model
Fraction of Entrepreneurs (%) 12.00 12.00Overall annual bankruptcy rate (%) 0.88 0.89Entrepreneur annual bankruptcy rate (%) 1.467 1.49Entrepreneurs’income to workers’ income 2.72 2.60
Our model economy provides attractive implications by occupational status. Table 7 presentsdebt and bankruptcy statistics for entrepreneurs and workers. With the exception of the bankruptcyrate of entrepreneurs, the statistics in this table are not targeted, they are implied by the model.Therefore, they provide an additional way to gauge the success of our model in terms of beingconsistent with the data. Several key results emerge from the table. First, it is apparent from thetable that entrepreneurs account for most of the debts in bankruptcy. This is consistent with thestylized facts of Sullivan, Warren, and Westbrook (2000) that we reported in Table 1. Entrepreneursaccount for about 60% of total debt in default. Put it differently, the amount of debt defaulted ofentrepreneurs is more than six times the amount of debt discharged of workers. This is explainedby the fact that entrepreneurship is risky and business owners borrow a large amount of fundsfor entrepreneurial activity. Second, entrepreneurs account for more than 30% of total debts inthe economy. Third, the average interest rate among workers, which is weighted by the numberof workers, is lower than that among entrepreneurs. This is justified by the fact that the defaultpremium for entrepreneurs is on average higher than that for worker since entrepreneurs face greaterdefault risks.
Properties of loan interest rates Figure 5 shows the interest rate schedule of entrepreneursand workers as a function of the debt (d) to asset (k + s)ratio. There is not a unique interest ratefor an individual household, it is a function of the amount of debt, portfolio, and household’s type.For illustration, we report the interest rate schedule for low η, middle-aged households and mediumearnings shock ε and fixed asset at (k + s = 1.5). On the figure, blue and green lines represententrepreneurs (k > 0) and workers (k = 0) respectively. There are a few points to note. First, theloan interest rate schedule is increasing with debt to asset ratio. The higher is the debt level, themore vulnerable are households to fluctuations in income which in turn increases the default rate.
15

Table 7: Bankruptcy, Debt and Loan Interest Rates for Entrepreneursand Workers in the Benchmark Economoy
Entrepreneurs Workers Ratio Entrep.to Workers
Annual bankruptcy rate (%) 1.490 0.726 2.1Average debt 1.51 0.47 3.2Average amount of debt defaulted 0.13 0.0199 6.5Average annual borrowing interest rate (%) 11.12 10.07 1.1Fraction of total debt held 30.46% 69.54%Fraction of total debt defaulted 64.64% 35.36%
Second, for higher debt to asset ratios, the loan interest rate schedule for entrepreneurs is above thatfor workers. This is because business and earnings shocks are persistent and the default rate amongentrepreneurs is much higher than that among workers.
Figure 2 reports the interest rate schedule for different levels of business productivity η. As canbe seen from the figure, the interest rate schedule is lower when business productivity is higher.Given the persistent nature of the business productivity shock, the probability of default decreaseswith business productivity.
Our benchmark economy features several interesting life-cycle results. We define young, middle-aged, and old as households of age less than 35, between 36 and 65, and above 65 respectively. As canbe seen from panel A of Table 8, the model does relatively a good job of matching the hump-shapeof bankruptcy rate over the life-cycle.9
The second panel also shows that the number of entrepreneurs replicates the age-profile of en-trepreneurship. This is due to the fact the presence of financial constraints and the cost of externalfinancing makes wealth holding an important element for starting a business. Young agents have nottime to accumulate enough wealth while middle-age households and old have accumulated assets tobecome entrepreneurs.
Table 8: Bankruptcy and Entrepreneurship Rates over the Life-Cycle
Baseline Data(%) (%)
Bankruptcy rateYoung 1.52 2.90Middle 6.32 3.07Old 5.53 0.42
Fraction of entrepreneursYoung 6.17 7.05Middle 19.06 17.07Old 10.65 11.24
9The bankruptcy rates over the life-cycle in data are from Table A4 in Sullivan, Warren, and Westbrook (2000).
16

0.7 0.8 0.9 1 1.1 1.2 1.30
0.1
0.2
0.3
0.4
0.5
0.6
0.7
0.8
0.9
1
Annual Interest Rate Schedule(middle age, middle ε, low η)
d / (k+s)
rs=0 and k=1.5s=1.5 and k=0
Figure 1: Loan Interest Rates for an Entrepreneur and a Worker
To summarize this section, in our framework:
• Entrepreneurial households are more likely to file for personal bankruptcy than non-entrepreneurs(workers). This pattern holds not only for the overall economy but also within age groups.
• Although, entrepreneurs represent 20% of all bankrupts households they account for 60% of alldebts in bankruptcy.
• Entrepreneurs account for a significant fraction of all consumer debt. More specifically, theyhold 30% of total debts.
6 Policy experiments
In this section we use our model to study the economic consequences of changes in bankruptcyregulation that seek to tighten bankruptcy rules under Chapter 7. We consider two bankruptcyregulations:
1. The reduction of bankruptcy asset exemptions. Lowering asset exemptions is an element of thebankruptcy reform that has been approved by President Bush (Bankruptcy Abuse Preventionand Consumer Protection Act of 2005).
17

0.7 0.8 0.9 1 1.1 1.2 1.30
0.1
0.2
0.3
0.4
0.5
0.6
0.7
0.8
0.9
1
Annual Interest Rate Schedule, Baseline(middle age, low ε, s=0, k=1.5)
d / (k+s)
rη 1η 2η 3η 4
Figure 2: Loan Interest Rates for an Entrepreneur with Different Business Productivity
2. The full elimination of the personal bankruptcy system. This policy eliminates the partialinsurance coming from full discharge of unsecured debt as well as the insurance coming fromthe exemptions.
6.1 The elimination of bankruptcy exemptions
In this section we present the effects of our first policy, a tightening of bankruptcy rules underChapter 7 that eliminates the asset exemption (χ = 0). With the exemption eliminated, the onlybenefit that remains from filing for bankruptcy is the insurance that comes from the discharge ofdebt.
Before discussing, we present qualitatively the different effects arising from reducing bankruptcyexemptions. Reducing exemptions leads to the following effects. First, a lower exemption impliesgreater confiscation of assets, and at the margin less benefit from filing for bankruptcy. This ef-fect tends to decrease bankruptcy filings. Second, a lower exemption reduces the partial insuranceprovided by the presence of exemption. This tends to discourage entrepreneurial activity. Third,because more assets are confiscated in bankruptcy, a lower exemption reduces incentives to save andto accumulate capital. Finally, because the creditor can confiscate more assets in the event of default,and because the incentive to default decreases, the interest rate charged to the individual falls. Thistends to (i) increase unsecured borrowing and (ii) encourage entrepreneurial activity to the extentthat entrepreneurs’ financial constraints are relaxed.
18

6.1.1 Aggregate effects and welfare implications
Table 9 reports the implications of eliminating the bankruptcy exemption on entrepreneurship, theoverall bankruptcy rate, the amount of debt, the average borrowing interest rate, and welfare.
Bankruptcy, entrepreneurship and debts It is apparent from the table that the eliminationof the bankruptcy exemption generates the expected results regarding bankruptcy filings. Indeed,the bankruptcy rate is much lower after the reform and falls by about 33%.
Table 9: The Effects of Eliminating Bankruptcy Asset Exemptions
Baseline No Exemptions Change(%)
Fraction of entrepreneurs (%) 12.00 12.68 5.7Bankruptcy rate (%) 0.892 0.602 -32.5Average annual borrowing interest rate (%) 10.65 10.55 -2.4Average unsecured debt 0.68 0.91 34.3Amount of debt defaulted 0.044 0.031 -29.4Total business capital per entrepreneurs 1.34 1.37 2.2
Welfare (equivalence consumption variation %) 1.78
The table also shows that the number of entrepreneurs increases after eliminating the bankruptcyexemption. To understand this result, recall that the bankruptcy exemption has two opposite effectson entrepreneurship. On one hand, bankruptcy provides partial insurance against business failureand thus encourages entrepreneurial activity. One the other hand, a direct consequence of this partialinsurance is an increase in the default rate. To compensate for this high default risk, the financialintermediary charges a higher premium. This high borrowing rate tightens borrowing constraints ofentrepreneurs and tends to discourage entrepreneurship. The change in entrepreneurial activity isthe net effect of these two opposing forces: the partial insurance and credit supply effects. As thetable shows, the average borrowing rate drops substantially after the reform (since the default ratefalls) and the number of entrepreneurs and entrepreneurial investments increase. This suggests thatthe increase in entrepreneurial activity comes from the credit supply effect.
Because of the lower borrowing rate, the amount of debt increases significantly. In fact, it increasesby more than 34%. Despite a large increase in the amount of debt held, the average amount of debtdefaulted decreases substantially. The decrease in the amount of debt discharge falls by almost 30%.
Welfare implications Our measure of welfare is the ex ante expected lifetime utility of a newbornagent with zero asset in our economy. To describe welfare, we will report the equivalent consumptionvariation (ECV), which is the percentage increase in lifetime consumption required to compensate
19

for the difference in welfare between the two policy regimes. A positive number means that the newpolicy regime is a better regime under the welfare criteria.
The second panel of Table 9 shows that the elimination of the bankruptcy exemption leads to asignificant welfare gain of 1.78% of lifetime consumption. The welfare gain stems from the decreasein the borrowing rate which not only allows for better consumption smoothing over the life-cyclebut also increases entrepreneurial activity by relaxing their financial constraints. Another factorthat contributes to the improvement in welfare is that the removal of bankruptcy asset exemptioneliminates relatively bad projects with high business risk that were undertaken because of the par-tial insurance coming from the exemption. This improvement in welfare suggests that tighteningbankruptcy rule through exemption reductions is desirable. This result is consistent with Li andSarte (2006).
6.1.2 Aggregate effects by occupation
Table 10 presents statistics for entrepreneurs and non-entrepreneurs. The table shows that takingaway the bankruptcy exemption reduces bankruptcy rates among both entrepreneurs and workers,though more so among entrepreneurs. More specifically, the bankruptcy rate among entrepreneursdecreases by almost 40%, while the rate among workers falls by about 30%. The decrease in thebankruptcy rate is larger among entrepreneurs because of the following effects: (i) with less insurancethe quality of start-up businesses is higher for a given wealth holdings of entrepreneurs and thusrelatively less risky on average, and (ii) a higher fraction of individuals with relatively high wealth,who will thus need to borrow less, enter entrepreneurship since there is less insurance in case ofbusiness failure. Note that, despite the fact that the default rate of entrepreneurs decreases moreafter the reform, it is still higher than the default rate of workers. This is not surprising sinceentrepreneurs are on average subject to greater risks and carry more debts than workers.10 With thedefault rate decreasing more among entrepreneurs than among workers, the average interest ratesfaced by entrepreneurs decrease by more than those facing workers. In fact, the average interest rateof workers decreases only modestly. The table also shows that the amount of debt defaulted fallsfor both entrepreneurs and workers, though less dramatically for workers. Moreover, the amountof debt carried by entrepreneurs rises less than the one of workers. This comes from the fact thatentrepreneurs rely relatively less on borrowing.
6.1.3 Life-cycle effects
We present default rates, the fraction of entrepreneurs, and the amount of debt over the life-cycle afterthe policy change. The first panel of Table 11 shows that bankruptcy rates retain their hump shapedprofile, though with a decrease in bankruptcy filing for each age group. The decrease in bankruptcyrates is largest for the eldest cohort. This is because, without exemptions, all the accumulatedsavings of the old will be confiscated by the financial intermediary if they default.
10Given that the quality of business increases after the reform, this means that the optimal size of business increasesand as a result entrepreneurs will prefer a lower interest borrowing rate.
20

Table 10: The Effects of Eliminating Bankruptcy Exemptions for En-trepreneurs and Workers
Baseline No Exemptions Change
Bankruptcy rate (%)Entrepreneur 1.49 0.862 -38.83%Worker 0.726 0.484 33.33%
Average debtEntrepreneur 1.51 1.58 4.12%Worker 0.47 0.73 55.41%
Average amount of debt defaultedEntrepreneur 0.13 0.08 -38.99%Worker 0.0199 0.0165 -17.06%
Average annual borrowing interest rate (%)Entrepreneur 11.12 10.65 -0.47Worker 10.07 10.06 -0.01
The second panel of Table 11 shows that the number of entrepreneurs in each age group increases.The number of young entrepreneurs increases by 10% while the number of middle-aged and oldentrepreneurs increases by 6% and 2% respectively. There is a larger increase in the number of youngentrepreneurs because young entrepreneurs were initially constrained. The reduction of borrowinginterest rates generated by lower default risk allows them to borrow to become entrepreneurs.
Table 12 presents the amount of debt and average interest rate by age cohort after the reform.As expected, the amount of debt increases for each age cohort. The highest increase in debt isfor the youngest cohort, where the amount of debt after the reform more than double. This highincrease comes from the fact that the young were initially constrained and can now borrow at lowinterest interest rates. These increases in the amount of debt are consistent with the decreases inthe borrowing interest rates for each age cohort.
6.2 The elimination of the personal bankruptcy system
This section analyzes the effects of eliminating bankruptcy provisions entirely. This means thatthere is no debt discharge nor any exemption and therefore the insurance against bad luck broughtby personal bankruptcy system is no longer present. In this new economy, households will borrowup to the point they can pay back their debt with certainty.
Table 13 presents the implications of complete elimination of the personal bankruptcy system.Because borrowers will pay back their debt with probability one, the financial intermediary does notcharge any risk premium and therefore the average borrowing interest falls and it is just equal tor∗ + φ = 10.4%. In contrast to the case where the bankruptcy exemption is eliminated, the tableshows that eliminating the entire consumer bankruptcy system considerably decreases the fraction of
21
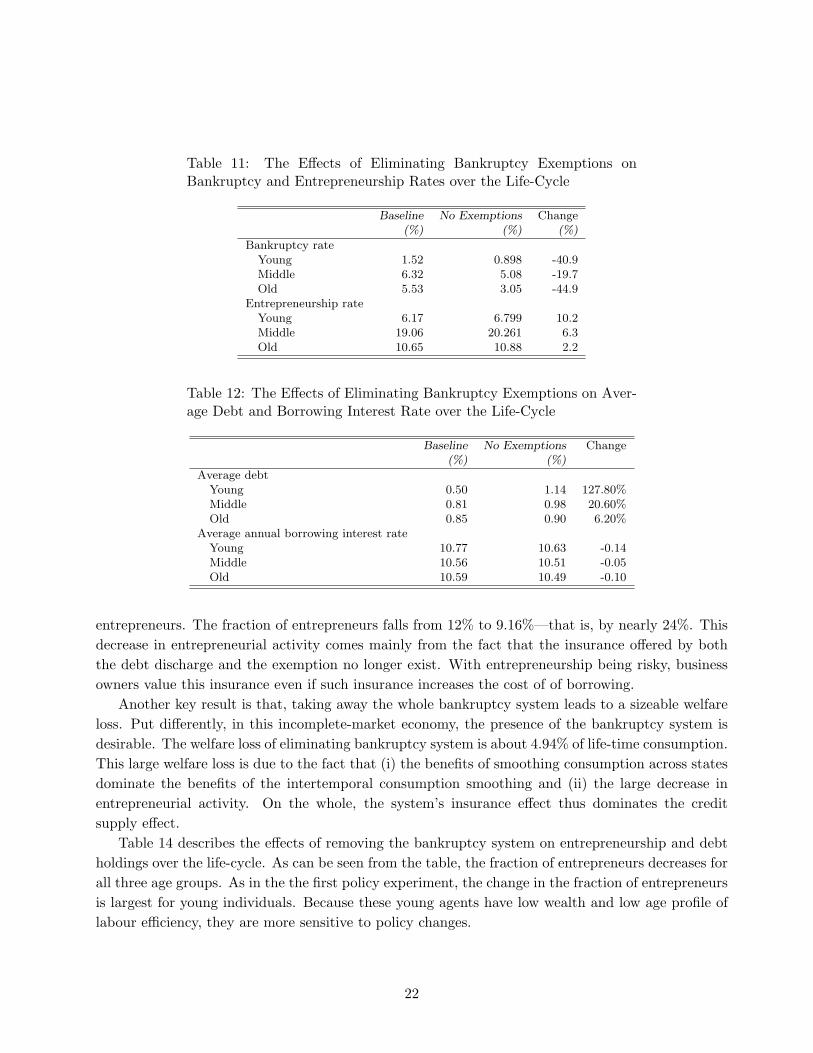
Table 11: The Effects of Eliminating Bankruptcy Exemptions onBankruptcy and Entrepreneurship Rates over the Life-Cycle
Baseline No Exemptions Change(%) (%) (%)
Bankruptcy rateYoung 1.52 0.898 -40.9Middle 6.32 5.08 -19.7Old 5.53 3.05 -44.9
Entrepreneurship rateYoung 6.17 6.799 10.2Middle 19.06 20.261 6.3Old 10.65 10.88 2.2
Table 12: The Effects of Eliminating Bankruptcy Exemptions on Aver-age Debt and Borrowing Interest Rate over the Life-Cycle
Baseline No Exemptions Change(%) (%)
Average debtYoung 0.50 1.14 127.80%Middle 0.81 0.98 20.60%Old 0.85 0.90 6.20%
Average annual borrowing interest rateYoung 10.77 10.63 -0.14Middle 10.56 10.51 -0.05Old 10.59 10.49 -0.10
entrepreneurs. The fraction of entrepreneurs falls from 12% to 9.16%—that is, by nearly 24%. Thisdecrease in entrepreneurial activity comes mainly from the fact that the insurance offered by boththe debt discharge and the exemption no longer exist. With entrepreneurship being risky, businessowners value this insurance even if such insurance increases the cost of of borrowing.
Another key result is that, taking away the whole bankruptcy system leads to a sizeable welfareloss. Put differently, in this incomplete-market economy, the presence of the bankruptcy system isdesirable. The welfare loss of eliminating bankruptcy system is about 4.94% of life-time consumption.This large welfare loss is due to the fact that (i) the benefits of smoothing consumption across statesdominate the benefits of the intertemporal consumption smoothing and (ii) the large decrease inentrepreneurial activity. On the whole, the system’s insurance effect thus dominates the creditsupply effect.
Table 14 describes the effects of removing the bankruptcy system on entrepreneurship and debtholdings over the life-cycle. As can be seen from the table, the fraction of entrepreneurs decreases forall three age groups. As in the the first policy experiment, the change in the fraction of entrepreneursis largest for young individuals. Because these young agents have low wealth and low age profile oflabour efficiency, they are more sensitive to policy changes.
22

Table 13: The Effects of Eliminating Bankruptcy System
Baseline No Bankruptcy Change(%)
Fraction of entrepreneurs (%) 12.00 9.16 -23.7Bankruptcy rate (%) 0.89 0.00 -100.0Average annual borrowing interest rate (%) 10.65 10.40Average unsecured debt 0.68 0.90 32.4Amount of debt defaulted 0.044 0.00 -100.0
Welfare (equivalence consumption variation %) -4.94
Table 14: The Effects of Eliminating Bankruptcy System over the Life-Cycle
Baseline No Bankruptcy Change(%)
Entrepreneurship rate (%)Young 6.17 2.955 -52.1Middle 19.06 16.18 -15.1Old 10.65 9.276 -12.9
Average unsecured debtYoung 0.50 1.15 128.8Middle 0.81 0.95 17.1Old 0.85 0.88 2.9
7 Importance of entrepreneurship
A key point in this paper is that entrepreneurship plays an important role in understanding bankruptcyoptions. To make this point, we will compare our two bankruptcy reforms in two different economies:one economy with entrepreneurs and another without entrepreneurs. We will contrast the effects ofa given bankruptcy reform in the two economies in terms of the change in bankruptcy rates and thewelfare implications. We take away the occupational choice so that everybody is a worker. Table 15summarizes the findings of these experiments.
Before discussing the implications of the policy reforms, it is important to note that the bankruptcyrate is lower in the baseline economy without entrepreneurs than in the economy with entrepreneurs.This is not surprising since in the economy with no entrepreneurs, the only source of uncertaintyresponsible for default is earnings risk. In the economy with entrepreneurs, on the other hand, thereis an additional source of uncertainty: investment risk. In such an economy, with entrepreneursfacing greater risks and taking on more debt to finance investments, the probability of default ishigher. This can be seen from Table 15 where the overall annual bankruptcy rate in the economywith workers only is 0.776% while it is 0.88% in the model with entrepreneurs.
We now return to the policy experiments. It is apparent from the last two columns of Table 15
23

that, entrepreneurship plays an important role in understanding bankruptcy regulations. The secondcolumn shows that the elimination of the bankruptcy exemption still leads to an improvement welfarein the model without entrepreneurs, but the improvement in welfare is relatively small. The reductionin interest rates that comes from a lower default premium facilitates intertemporal smoothing ofconsumption over the life-cycle. Finally, the last column illustrates that eliminating the entirebankruptcy system leads to a welfare gain in the economy without entrepreneurs though it leadsto a welfare loss in the economy with entrepreneurs. However, this welfare gain is also relativelysmall. This finding is in line with Athreya (2002). With no more investment risks in the economywithout entrepreneurs, the need to smooth consumption across states is less desirable.
Overall, the presence of entrepreneurship increases the welfare effects of bankruptcy regulation.Specifically, accounting explicitly for entrepreneurship makes the bankruptcy exemption less desirableand the entire bankruptcy system more attractive. This suggests that accounting for entrepreneurshipis essential in consumer bankruptcy analysis.
Table 15: The Effects of Eliminating Bankruptcy Exemptions and theBankruptcy System on Bankruptcy Rate and Welfare in Economies withand without Entrepreneurs (in Percentage)
Baseline No Exemption No Bankruptcy
Without Entrepreneurs
Bankruptcy rate 0.776 0.576 0.00Welfare (consumption equivalence) 0.024 0.081
With Entrepreneurs (baseline)
Bankruptcy rate 0.892 0.602 0.00Welfare (consumption equivalence) 1.78 -4.96
8 Conclusion
In this paper, we developed a quantitative model of consumer bankruptcy and entrepreneurship andused it to assess the importance of the whole bankruptcy procedure and bankruptcy asset exemptions.A key feature of the model is the presence of two types of uninsurable idiosyncratic uncertainty:earnings risks and investment risks where entrepreneurs face both types of risks while workers faceonly earnings risks. Because entrepreneurs are subject to an additional risk, their default probabilityis higher on average than that of workers. Another key feature of the model is that interest rates onconsumer loans depend on observable individual characteristics (such as income, labor productivityand business productivity) and the amount of consumer debt owed by the household.
We showed that eliminating bankruptcy asset exemptions leads to a modest increase in en-trepreneurship, a large decrease in the overall bankruptcy rate, and an increase in the amount of
24

debt. More importantly, this policy reform generates a significant welfare gain. In contrast, elimi-nating the entire bankruptcy system leads a sizeable welfare loss and a large decrease in the numberof entrepreneurs. The results of these two policy experiments provide a very important message: theconsumer bankruptcy system is desirable but it must be well designed in a way that carefully limitsasset exemptions.
A second key message from this paper is that entrepreneurial activity is important for quantita-tively assessing the macroeconomic and welfare implications of bankruptcy regulations. For example,in the model without entrepreneurs, the elimination of the entire consumer bankruptcy system gen-erates a welfare gain (although small) though it leads to a large welfare loss when entrepreneurialactivity is explicitly modeled.
Our model can be extended in several important directions. An interesting extension is to takeinto account durable goods (such as housing and cars). With housing, we would be able to studydifferent types of exemptions in particular homestead exemption which is the largest exemption inthe data. Another interesting extension is to allow the coexistence of secured and unsecured debt asa high fraction of consumer debts is secured (e.g., mortgages).
25

References
Akyol, A., and K. Athreya (2007): “Unsecured Credit and Self-Employment,” Working paper,Federal Reserve Bank of Richmond.
Armour, J., and D. Cumming (2005): “Bankruptcy Law and Entrepreneurship,” Working PaperNo. 300, ESRC Centre for Business Research.
Athreya, K. (2001): “The growth of unsecured credit : are we better off?,” Economic QuarterlyReview of the Federal Reserve Bank of Richmond, summer, 11–33.
(2002): “Welfare Implications of the Bankruptcy Reform Act of 1999,” Journal of MonetaryEconomics, 49(8), 1567–1595.
(2004): “Shame as it ever was : stigma and personal bankruptcy,” Economic QuarterlyReview of the Federal Reserve Bank of Richmond, spring, 1–19.
Auerbach, A., and L. Kotlikoff (1987): Dynamic Fiscal Policy. Cambridge: Cambridge Uni-versity Press.
Banerjee, A., and A. Newman (1993): “Occupational Choice and the Process of Development,”Journal of Political Economy, 101(2), 274–298.
Bednarzik, R. (2000): “The Role of Entrepreneurship in US and European Job Growth,” MonthlyLabor Review, July, 3–16.
Berkowitz, J., and M. White (2004): “Bankruptcy and Small Firms’ Access to Credit,” RandJournal of Economics, 35(1), 69–84.
Cagetti, M., and M. de Nardi (2006): “Entrepreneurship, Frictions, and Wealth,” Journal ofPolitical Economy, 114(5), 835–870.
Chatterjee, S., D. Corbae, M. Nakajima, and J.-V. Rıos-Rull (2007): “A QuantitativeTheory of Unsecured Consumer Credit with Risk of Default,” Econometrica, 75(6), 48–58.
Congressional Budget Office (2000): “Personal Bankruptcy: A Literature Review,”Manuscript, Macroeconomic Analysis Division of the Congressional Budget Office.
Evans, D., and B. Jovanovic (1989): “An Estimated Model of Entrepreneurial Choice underLiquidity Constraints,” Journal of Political Economy, 97(4), 808–827.
Fan, W., and M. White (2003): “Personal bankruptcy and the level of entrepreneurial activity,”Journal of Law and Economics, 46, 543–567.
Fay, S., E. Hurst, and M. White (2002): “The Household Bankruptcy Decision,” AmericanEconomic Review, 92(3), 706–718.
26

Gentry, W., and R. Hubbard (2000): “Tax Policy and Entrepreneurial Entry,” Manuscript,Columbia University.
Haltiwanger, J., and C. Krizan (1999): “Small Business and Job Creation in the United States:The Role of New and Young Businesses,” in Are Small Firms Important?: Their Role and Impact,ed. by Z. Acs. Kluwer Academic Publishing Company.
Hansen, G. (1993): “The Cyclical and Secular Behaviour of the Labour Input: Comparing EfficiencyUnits and Hours Worked,” Journal of Applied Econometrics, 8(1), 71–80.
Li, W., and P.-D. Sarte (2006): “US consumer bankruptcy choice: The importance of generalequilibrium effects,” Journal of Monetary Economics, 53(3), 613–631.
Livshits, I., J. MacGee, and M. Tertilt (2006): “Accounting for the Rise in ConsumerBankruptcies,” Working Paper 6, University of Western Ontario, RBC Financial Group EconomicPolicy Research Institute.
(2007): “Consumer Bankruptcy: A Fresh Start,” American Economic Review, 97(1), 402–418.
McGrattan, E., and E. Prescott (2000): “Is the stock market overvalued?,” Quarterly Reviewof the Federal Reserve Bank of Minneapolis, fall, 20–40.
Meh, C. (2005): “Entrepreneurship, Wealth Inequality and Taxation,” Review of Economic Dy-namics, 8(3), 688–719.
Moskowitz, T., and A. Vissing-Jorgensen (2002): “The Private Equity Premium Puzzle,”American Economic Review, 92(4), 745–778.
Prescott, E. (1986): “Theory Ahead of Business Cycle Measurement,” Federal Reserve Bank ofMinneapolis Quarterly Review, 10(3), 9–22.
Quadrini, V. (1999): “The Importance of Entrepreneurship for Wealth Concentration and Mobil-ity,” Review of Income and Wealth, 45(1), 1–19.
(2000): “Entrepreneurship, Saving and Social Mobility,” Review of Economic Dynamics,3(1), 1–40.
Schumpeter, J. (1934): The Theory of Economic Development. Cambridge: Harvard UniversityPress.
Storesletten, K., C. Telmer, and A. Yaron (2004): “Consumption and Risk Sharing Overthe Life Cycle,” Journal of Monetary Economics, 51(3), 609–633.
Sullivan, T., E. Warren, and J. Westbrook (1989): As We Forgive Our Debtors. New Yorkand Oxford: Oxford University Press.
27

(2000): The Fragile Middle Class. New Haven and London: Yale University Press.
Tauchen, G., and R. Hussey (1991): “Quadrature-Based Methods for Obtaining ApproximateSolutions to Nonlinear Asset Pricing Models,” Econometrica, 59(2), 371–396.
28