Embed Size (px)
Citation preview

John R. Kasich, Governor Mary Taylor, Lt. Governor Scott J. Nally, Director
Ju
ne 2
01
1
Unsafe Water Supply Investigation
Putnam Community Water Association
Devola, Washington County

i
Acknowledgements
Ohio EPA thanks all of the individuals that helped with this investigation. Special thanks go to
the Devola and Putnam Community Water Association for providing access to their property and
rights of way. The project team, including staff from Friends of the Lower Muskingum River,
USGS, and Ohio EPA Division of Drinking and Ground Waters (Central Office and Southeast
District Office), discussed options and developed the sampling plan. The sampling plan was
coordinated with the Washington County General Health District.
The Geoprobe crew from the Ohio EPA’s Special Investigations Field Unit (SIFU) of the Division
of Emergency and Remedial Response (DERR) provided field GPS support and completed the
borings and sampling program with assistance from DDAGW staff. Staff from the Water Quality
Management Branch of the U.S. EPA provided data analysis and coordination of
pharmaceutical and personal care product samples.
Ohio EPA staff in Central Office completed the data analysis and drafted the Final Report.
DDAGW, CO: Michael Eggert, Jeff Patzke, Chris Kenah, Michael Slattery, Linda Slattery DDAGW, SEDO: Steve Williams, Ben Reed DERR: Karl Reinbold, Jeff Wander, Victoria Sigler Putnam Community Water Association: Jay Huck U.S. EPA: Kathy Schenck, Chris Impellitteri U.S. Geological Survey: Mary Ann Thomas, Ralph Haefner Washington County General Health Department: Ken Robinson

ii
1. Executive Summary Putnam Community Water Association (PCWA) has provided water to Devola since the 1960’s. In late 2009, multiple samples exceeded the nitrate maximum contaminant level (MCL). Elevated nitrate at the MCL in ground water at public water systems (PWSs) is not common in Ohio, but the Lower Muskingum River Valley Aquifer is an area with a history of elevated levels and positive trends. PCWA water supply wells exhibit some of the highest nitrate values in this area. Dr. Meckstroth, the Health Commissioner of the Washington County General Health District, requested an unsafe water supply investigation per Ohio Revised Code (ORC) 6103.17 in a May 12, 2010 letter to Ohio EPA Director Korleski. The director responded that an investigation would be initiated in a June 7 letter to Dr. Meckstroth. The purpose of the investigation was to evaluate the sources of nitrate flowing to the Putnam Community Water Association wellfield. The study area is located in Washington County, approximately five miles up the Muskingum River from its intersection with the Ohio River at Marietta. The hypothesis tested was that the unsewered portion of Devola is contributing elevated nitrate concentrations to the Putnam wellfield. The areas selected for ground water sampling included sewered and unsewered areas of Devola and the agricultural areas in the buried valley west of Devola. Ohio EPA staff worked with the Putnam Community Water Association, the Washington County General Health District, the Friends of the Lower Muskingum, and the Water Quality Management Branch, U.S. EPA to complete this project. In August 2010, sixteen Geoprobe borings were completed and water level data and ground water samples were collected at multiple locations and at various depths (at and below the water table). The objectives were to:
Identify ground water flow directions to the Putnam wellfield and the Muskingum River;
Determine nitrate concentration (and other nutrients) at the water table and below the water table associated with various land uses; and
Analyze ground water samples for additional parameters that will help trace or identify the sources of nitrate (Cl, Br, isotopes, redox parameters, and personal care products).
The nitrate and chloride concentrations demonstrate distinct differences between the agricultural, sewered, and unsewered areas. Figure A exhibits the nitrate concentrations in the ground water at the deepest portion of the aquifer penetrated by the Geoprobe borings. Overall, the nitrate and chloride concentrations are significantly higher in the unsewered area than in the agricultural area to the west or the sewered area to the east (east of Lindsey Ave. in Figure A). The conclusion of this study is the ground water flow from the unsewered area of Devola is contributing significantly to the exceedence of the nitrate MCL at the Putnam Community Water Association. This is supported by:
Water table surface confirms that the majority of the flow lines to the production wells originate in the unsewered area;
Elevated nitrate and chloride in ground water quality data for the unsewered area as compared to the sewered and agricultural areas in and around Devola;
Water quality data identifies distinct data clusters for the agricultural, sewered and unsewered areas of Devola in plots of nitrate or chloride versus chloride/bromide ratios;

iii
Water quality data for PCWA wells plot within the unsewered data cluster in plots of nitrate or chloride versus chloride/bromide ratios;
Distinct decrease of nitrate concentrations at the unsewered- sewered boundary in Devola;
The PCWA water supply entry point isotopic data plots in between the isotopic data of the Devola sewer influent and the Muskingum River; and
Ability to relate annual variation in the PCWA water supply nitrate concentrations to flow conditions of the Muskingum River.
These multiple lines of evidence converge to confirm the hypothesis that the unsewered area of Devola is contributing significantly to the exceedences of the nitrate MCL at the Putnam Community Water Association. The nitrate and chloride in the PCWA distribution water are being recycled and reused with addition of new nitrogen and chloride to the water discharged from septic systems and dry wells and subsequent flow down gradient to the Putnam wellfield. The nitrate sources are dominantly residential wastewater with lesser contributions from lawn fertilizer and rainfall and sources for the chloride include discharge from ion exchange water softeners and road salt. This is not to say that there are no agricultural inputs of nitrate to the Putnam wellfield. However, the nitrate concentrations of the ground water originating in the agricultural areas are not as high as those in water flowing from the unsewered portions of Devola.
Figure A. Nitrate concentration in filtered total depth samples.
iv
TABLE OF CONTENTS
Page
Acknowledgements ...................................................................................................................... i Executive Summary .................................................................................................................... ii Table of Contents ....................................................................................................................... iv List of Figures ............................................................................................................................. v List of Tables .............................................................................................................................. v Introduction ................................................................................................................................. 1
Background ........................................................................................................................... 1
Location and Physical Setting ............................................................................................... 3
Sample Plan ............................................................................................................................... 4
Purpose of Investigation ........................................................................................................ 4
Sample Locations and Collection .......................................................................................... 4
Parameter Selection .............................................................................................................. 6
Quality Assurance Plan ......................................................................................................... 7
Sample Results ........................................................................................................................... 7
Water Table Surface ............................................................................................................. 7
Nitrate Concentrations ........................................................................................................... 9
Chloride Concentrations ........................................................................................................ 9
Chloride-Bromide Ratios ..................................................................................................... 15
Other Parameters ................................................................................................................ 17
Cross Sections .................................................................................................................... 18
Nitrogen and Oxygen Isotopes of Nitrate ............................................................................. 22
Nitrogen Loading ................................................................................................................. 24
Pharmaceutical and Personal Care Products Data .............................................................. 25
Long Term Trends ............................................................................................................... 26
Conclusions .............................................................................................................................. 29 References Cited ...................................................................................................................... 31 Appendix A List of Borings and Samples Collected
Appendix B Water Table and Location Measurements
Appendix C Inorganic Results
Appendix C2 Field Data
Appendix C3 Samples with Additional Parameters

v
Appendix D1 Summary of Terminology and Presentation of Nitrogen and Oxygen Data
Appendix D2 Isotope Data
LIST OF FIGURES
Figure 1. Nitrate time series for Putnam Community Water Association ................................ 2
Figure 2. Nitrate time series for Masonic Park ....................................................................... 2
Figure 3. Geoprobe boring locations plotted on a topographic base map ............................... 4
Figure 4. Geoprobe boring locations plotted on an air base map ........................................... 5
Figure 5. Contours of the water table surface ........................................................................ 8
Figure 6. Nitrate concentration in filtered water table samples ............................................. 10
Figure 7. Nitrate concentration in filtered total depth samples .............................................. 10
Figure 8. Chloride concentration in filtered water table samples .......................................... 13
Figure 9. Chloride concentration in the filtered total depth samples ..................................... 13
Figure 10. Nitrate versus chloride and associated land use ................................................... 14
Figure 11. Chloride – Cl/Br ratio relationships for the Devola area ......................................... 16
Figure 12. Plot of Nitrate to Cl/Br ratio for Devola Investigation ............................................. 17
Figure 13. Location of Schematic Cross Sections .................................................................. 19
Figure 14. Cross section A-A’ with nitrate concentration contoured ....................................... 20
Figure 15. Cross sections B-B’ and C-C’ with nitrate contours ............................................... 21
Figure 16. Plot of stable isotopes of nitrogen and oxygen in dissolved nitrate ........................ 23
Figure 17. Cross section through PCWA well field illustrating the elevated
gradient from the river to PCWA wells…….……………….…………………..…26
Figure 18. Correlation between the Muskingum River discharge and
Putnam nitrate concentrations ......................................................................... 27
Figure 19. Correlation of the annual curves of Muskingum River discharge and
Putnam nitrate ................................................................................................. 28
LIST OF TABLES Table 1. Geochemical Results in Borings by Land Use Areas ............................................ 11
Table 2. Average Annual Nitrogen Loading in Unsewered Area ......................................... 24

Unsafe Water Supply Investigation Putnam Community Water Association
Devola, Washington County
Ohio EPA, Division of Drinking and Ground Waters
Introduction
Putnam Community Water Association (PCWA) has provided water to Devola since the 1960’s. In late 2009, nitrate values exceeded the maximum contaminant level (MCL) for multiple samples. Elevated nitrate at the MCL in ground water at public water systems (PWSs) is not common in Ohio, but the Lower Muskingum River Valley Aquifer is an area with a history of elevated levels and increasing trends. Dr. Meckstroth, the Health Commissioner of the Washington County General Health District, requested an unsafe water supply investigation per Ohio Revised Code (ORC) 6103.17 in a May 12, 2010 letter to Ohio EPA Director Korleski. The director responded that an investigation would be initiated in a June 7 letter to Dr. Meckstroth. The goal of this investigation was to identify the sources of nitrate flowing to the PCWA water supply wells to help avoid acute exceedances of the MCL. Ohio EPA worked with the PCWA Community Water Association, the Washington County General Health District, the Friends of the Lower Muskingum, and the Water Quality Management Branch, U.S. EPA to complete this investigation. Background Putnam Community Water Association serves water to Devola in Washington County, Ohio. PCWA relies on ground water derived from an alluvial aquifer adjacent to the Muskingum River as its primary source of drinking water. PCWA’s wellfield includes four closely spaced wells that withdraw about 250,000 gallons per day. Historically, the nitrate concentration has been frequently above 8 mg/L and exhibited an increasing trend. In 2008, multiple low values were recorded (4 mg/L) with a rapid upward trend leading to multiple results over the 10 mg/L MCL in 2009 as illustrated in Figure 1. The nitrate time series exhibits a significant amount of variability, which suggests that complex recharge patterns influence the water quality of production water.
In late 2009 (November 18 to January 5, 2010) nitrate samples consistently exceeded the nitrate MCL. In 2010 nitrate samples decreased but several samples reported levels around 10 mg/L. In October 2010, Ohio EPA issued Final Findings and Orders requiring Putnam Community Water Association to submit a plan with at least three options for addressing the nitrate MCL issue. A nitrate issue that may be related occurs at the Masonic Park Public Water System, approximately a mile northwest of the PWCA wellfield in an area of agricultural land use. Figure 2 illustrates the increasing trend of nitrate since 2000 at Masonic Park. The samples collected after the 6/18/09 sample (12.5 mg/L), which exceeded the nitrate MCL, were below 10 mg/L until an October 2010 sample reported 10.7 mg/L. Masonic Park is located close to a nursery that may be contributing to the local nitrate concentrations in the ground water. Additionally, the surrounding agricultural land use may be contributing significant nitrate to ground water. Either way, understanding the nitrate sources at the Masonic Park will be helpful in understanding the nitrate inputs for the PCWA wells.

Unsafe Water Investigation - Devola – Page 2
Figure 1. Nitrate time series for Putnam Community Water Association
Figure 2. Nitrate time series for Masonic Park
2000 2001 2002 2003 2004 2005 2006 2007 2008 2009 2010
0
2
4
6
8
10
12
14
Nitra
te-n
itrite
as N
, m
g/L Nitrate MCL = 10.0 mg/L
Putnam Community PWS Nitrate Time Series2000-2010 data for Entry Point 001
Unsafe Water Investigation - Devola – Page 3
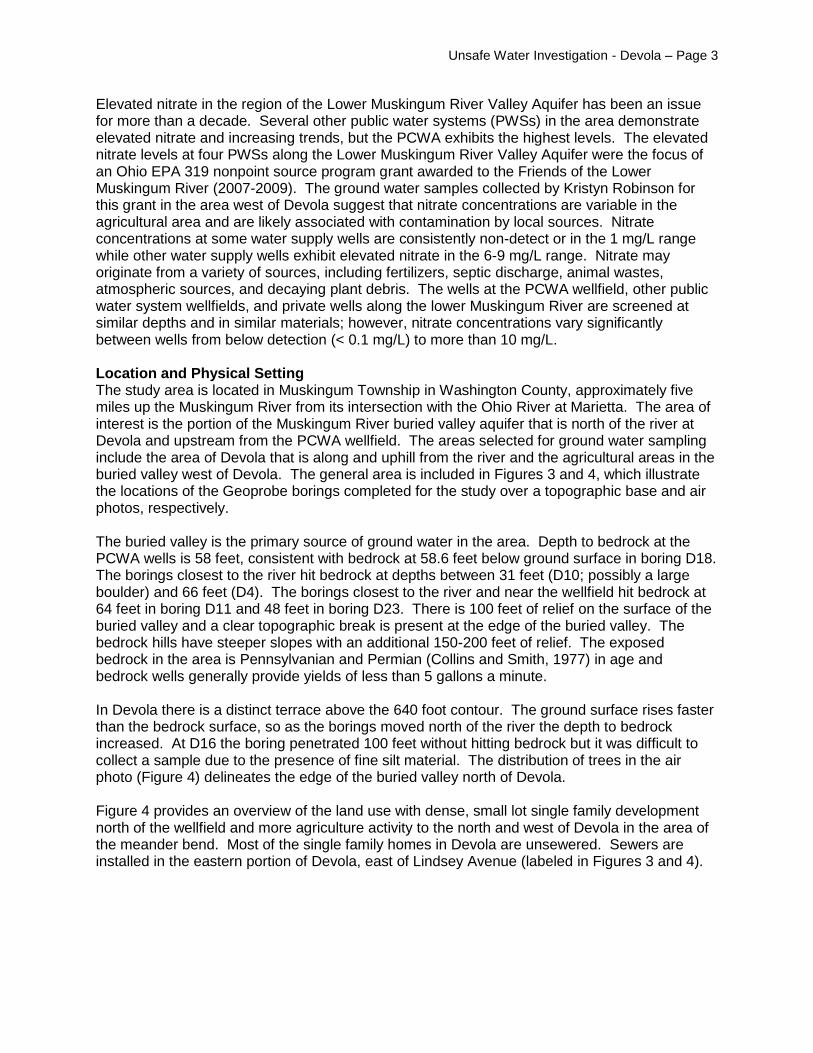
Elevated nitrate in the region of the Lower Muskingum River Valley Aquifer has been an issue for more than a decade. Several other public water systems (PWSs) in the area demonstrate elevated nitrate and increasing trends, but the PCWA exhibits the highest levels. The elevated nitrate levels at four PWSs along the Lower Muskingum River Valley Aquifer were the focus of an Ohio EPA 319 nonpoint source program grant awarded to the Friends of the Lower Muskingum River (2007-2009). The ground water samples collected by Kristyn Robinson for this grant in the area west of Devola suggest that nitrate concentrations are variable in the agricultural area and are likely associated with contamination by local sources. Nitrate concentrations at some water supply wells are consistently non-detect or in the 1 mg/L range while other water supply wells exhibit elevated nitrate in the 6-9 mg/L range. Nitrate may originate from a variety of sources, including fertilizers, septic discharge, animal wastes, atmospheric sources, and decaying plant debris. The wells at the PCWA wellfield, other public water system wellfields, and private wells along the lower Muskingum River are screened at similar depths and in similar materials; however, nitrate concentrations vary significantly between wells from below detection (< 0.1 mg/L) to more than 10 mg/L. Location and Physical Setting The study area is located in Muskingum Township in Washington County, approximately five miles up the Muskingum River from its intersection with the Ohio River at Marietta. The area of interest is the portion of the Muskingum River buried valley aquifer that is north of the river at Devola and upstream from the PCWA wellfield. The areas selected for ground water sampling include the area of Devola that is along and uphill from the river and the agricultural areas in the buried valley west of Devola. The general area is included in Figures 3 and 4, which illustrate the locations of the Geoprobe borings completed for the study over a topographic base and air photos, respectively. The buried valley is the primary source of ground water in the area. Depth to bedrock at the PCWA wells is 58 feet, consistent with bedrock at 58.6 feet below ground surface in boring D18. The borings closest to the river hit bedrock at depths between 31 feet (D10; possibly a large boulder) and 66 feet (D4). The borings closest to the river and near the wellfield hit bedrock at 64 feet in boring D11 and 48 feet in boring D23. There is 100 feet of relief on the surface of the buried valley and a clear topographic break is present at the edge of the buried valley. The bedrock hills have steeper slopes with an additional 150-200 feet of relief. The exposed bedrock in the area is Pennsylvanian and Permian (Collins and Smith, 1977) in age and bedrock wells generally provide yields of less than 5 gallons a minute. In Devola there is a distinct terrace above the 640 foot contour. The ground surface rises faster than the bedrock surface, so as the borings moved north of the river the depth to bedrock increased. At D16 the boring penetrated 100 feet without hitting bedrock but it was difficult to collect a sample due to the presence of fine silt material. The distribution of trees in the air photo (Figure 4) delineates the edge of the buried valley north of Devola. Figure 4 provides an overview of the land use with dense, small lot single family development north of the wellfield and more agriculture activity to the north and west of Devola in the area of the meander bend. Most of the single family homes in Devola are unsewered. Sewers are installed in the eastern portion of Devola, east of Lindsey Avenue (labeled in Figures 3 and 4).

Unsafe Water Investigation - Devola – Page 4
Figure 3. Geoprobe boring locations plotted on a topographic base map
Sample Plan Purpose of Investigation The purpose of the investigation was to evaluate the sources of nitrate flowing to the Putnam Community Water Association wellfield. The Geoprobe was used to collect water level data and ground water samples at multiple locations and at various depths (at and below the water table). The objectives were to:
Identify ground water flow directions to the PCWA wellfield and the Muskingum River;
Determine nitrate concentration (and other nutrients) at the water table and below the water table associated with various land uses; and
Analyze ground water samples for additional parameters that will help trace or identify the sources of nitrate (Cl, Br, isotopes, redox parameters, and personal care products).
Sample Locations and Collection The locations of the 16 Geoprobe borings, completed in August 2010, are indicated in Figures 3 and 4. The sample plan included borings located further from the Muskingum River, however, two of the borings completed at higher elevations in the buried valley (D16 and D25) did not provide good static ground water elevation or water samples. The greater depth of the water

Unsafe Water Investigation - Devola – Page 5
table and an abundance of fine silt made sampling difficult to unsuccessful. Consequently, several borings were relocated to areas just south of the terrace in Devola.
Figure 4. Geoprobe boring locations plotted on an air photo base map. The borings west of Devola are in an area dominated by agricultural land use. The borings in Devola west of Lindsey Avenue were selected to document the septic contribution from the unsewered area. Borings east of Lindsey Avenue were chosen to document the nitrate concentration in sewered portions of Devola. The borings along the Muskingum River evaluate the nitrate concentrations flowing to the Muskingum River from agriculture areas, unsewered and sewered areas, or document river recharge into the buried valley aquifer. Ground water samples were collected from the Geoprobe borings at two or three depths to document nitrate concentrations and the redox state through the aquifer. The samples were collected by driving the probe to depth and then collecting water at specific depths as the drilling rods were pulled out. Consequently, the sequence of the sampling was from the bottom of the boring to the water table surface. To collect the first water sample the drilling rods were pulled up 4 feet exposing the 4 foot screen. Once exposed the screen remained exposed as the drill rods were pulled to sample shallower depths. Generally, samples were collected with the screen at the bottom of the boring (sample labeled TD) and with the top of the screen at the

Unsafe Water Investigation - Devola – Page 6
water table (sample labeled WT). In several cases a sample was collected mid-way between the WT and TD sample (sample labeled MID). A list of the borings, refusal depths, sample times, sample depths, static water levels, and comments about the borings is included in Appendix A. Once the screen was set at the sample depth, a check valve pump was used to remove fines and to purge the screen and tubing to assure the sample collected represents water from the aquifer at the screen depth interval. A minimum of 2.5 gallons was purged before a ground water sample was collected. The initial plan was to collect unfiltered samples for the non-preserved and the H2SO4 preserved portions of the sample and to collect a filtered sample for the HNO3 preserved portion of the sample used for analyzing metals. This was done for a couple of samples but the turbidity was so high that it was decided to filter all the samples to provide water for analysis typical of drinking water wells. The check valve pump does not provide sufficient pressure to push water through the 0.45 micron in-line filters so water from the check valve pump was discharged to a clean gallon container. When sufficient water was stored, a peristaltic pump was used to push the turbid water through the disposable in-line filters to the sample containers. As an indication of the high turbidity, at a couple of sites three in-line filters were used to filter a gallon of water. All isotope samples were filtered as well. Field parameters were collected at every site using a flow-through cell with probes for temperature, TDS, conductivity, oxidation reduction potential (ORP), pH, dissolved oxygen, turbidity, and nitrate. The field data was measured in unfiltered water. Check valve pump discharge was sent to the flow-through cell after the purging process was complete. This worked well; however, at a couple of sites significant volumes of silt settled out in the flow-through cell. The high turbidity may have influenced the readings generated by the probes. Parameter Selection The parameters selected for analysis were intended to document variations in nitrate concentrations, to evaluate the oxidation state of the aquifer, to collect tracers for determining the source of the elevated nitrate, and to characterize the ground water associated with the sewered, unsewered, and agricultural areas. Ground water samples were analyzed for:
Nutrients (nitrate, ammonia, and TKN) for a direct measure of the nitrate concentrations along distinct flow paths to the production wells;
Chloride and bromide as a tracer for salts in septic discharge;
Iron, manganese, and sulfate for documenting oxidation state in the aquifer;
Alkalinity as a measure of bicarbonate (inorganic carbon), and TOC as a measure of organic carbon input, which could be elevated in the unsewered portions of Devola;
Field parameters (ORP, pH, temperature, TDS, conductivity, dissolved oxygen and turbidity);
Stable isotopes of nitrogen and oxygen in nitrate, and the stable isotopes of water; and
Personal care products or pharmaceuticals. Isotope and inorganic samples were collected for analysis at all locations including PCWA wells 3 and 4. To enhance the analysis of the isotope results, samples of likely nitrate sources and mixing end members were collected (sewage, surface water etc.). The inorganic samples were analyzed by Ohio EPA’s Division of Environmental Services. The isotope samples were sub-mitted to the Stable Isotope Geosciences Facility at the College of Geosciences, Texas A&M. Samples for pharmaceutical and personal care products (PPCPs) were collected at boring D14 and PCWA wells 3 and 4. These samples were analyzed by the U. S. EPA lab in Cincinnati.

Unsafe Water Investigation - Devola – Page 7
The samples were analyzed using an ultra-high pressure liquid chromatography ion trap/Fourier transform mass spectrometry (UPLC/MS/MS) method. The method analyzed multiple hormones associated with birth control products, an herbicide, and a ubiquitous antibacterial agent used in personal care products. Quality Assurance Plan The QA/QC guidelines outlined in DDAGW’s Ambient Ground Water Quality Monitoring Program’s Operating Procedures Document (2002) were followed as closely as possible. Two duplicate samples (D6-MID and D19-MID) and two equipment blanks were collected. The equipment blanks consisted of nanopure flushed through a washed and rinsed screen within a washed and rinsed rod and collected as a blank. No trip blanks were needed since VOC samples were not collected.
Sample Results
Water Table Surface The depth to the water table was measured for all boring samples. The surface elevations, along with latitude and longitude, of the boring were determined with GPS capabilities. The accuracy of the elevations is approximately one tenth of a foot, which is similar to the measured accuracy of the static water level. Appendix B includes a table of the boring location, measured depth to water table, the average of the measured water table, and a derived elevation of the water table using the GPS elevation. Figure 5 displays contours of the average water table in borings within the area surrounding the PCWA wellfield. Ground water flow lines are perpendicular to water table contours. Thus, Figure 5 documents the ground water flows from the unsewered portion of Devola to the PCWA wellfield. There is also some contribution from the agricultural areas west of Devola to the wellfield, but this is limited to flow lines that originate in the fields, along the Muskingum River. There are often questions about whether the static water level measured in a Geoprobe boring is a stable measurement. The result of plotting the average static water levels in the Devola borings, however, produces reasonable contours consistent with the local geologic and physical setting. The static water levels measured at the bottom of the borings (TD samples) was the same or lower than levels measured for the sample collected at the water table indicating downward vertical movement of recharge water. The difference ranged from 0 to 1.2 feet, with only 2 borings exhibiting a difference greater than 0.5 feet. This confirms we are dealing with an unconfined aquifer without confining pressure at depth. Results from two borings are inconsistent with the contours plotted in Figure 5, but sampling process at these sites identified suspect measurements. At boring D10 near the dam, bedrock (or a large boulder) was encountered at 31 feet (the shallowest depth to bedrock encountered) and ground water production form this boring was very low (unable to collect a normal sample); so the static water level measured was not considered accurate. At the east end of the sample area, boring D25 recorded a static water elevation of 581.4 feet which is several feet below the expected water table elevation of 585 to 586 feet. At D25, the screen did not deploy properly (determined when the rods were pulled), and it was difficult to get a good water level measurement. The abundance of silty material caused the sampling problems at D25. At boring D16 (labeled NA in Figure 5), no water levels were measured because the probe would not go down the rods due to excessive siltation (silt?). All things considered, the consistency of the water table level information supports the validity of the plotted contours.

Unsafe Water Investigation - Devola – Page 8
Figure 5. Contours of the water table surface based on average static water levels in borings. Limited water level data from three borings in the agricultural area west of Devola do not allow contouring with any confidence. The water table is approximately 10 feet higher in elevation than the water levels around the PCWA wellfield, consistent with the presence of the dam just west of Devola. The water levels measured close to the river (D4 and D5) are slightly higher (0.2-0.9 feet) than measured in D6 (Figures 3 & 4). This was a surprise and may be related to the significant difference between the static water level measured at total depth (54 feet) and at the water table (52.84 feet). The sample collected at the bottom of the boring was very turbid due to the abundance of fine silt (three in-line filters used). The abundance of silt in other borings led to difficulty in measuring good static water levels, so the deep water level at D6 may be inaccurate. If the static water level measured for the water table sample is used rather than the average water table, boring D6 is similar to the level at D4. Even with this adjustment, the static water level is higher at D5 than D6. Possible explanations for the elevated water table along the bank of the Muskingum River include a transient recharge event associated with high water in the river, the presence of a high permeability channel controlling ground water flow in the buried valley, or the water table at D6 is influenced by discharge and evaporation in local, abandoned gravel pits. It is also possible that ground water flow around the flank of the dam, 3000 feet downstream from D5, may influence the local ground water surface at D5 and D6. Additional borings are needed to develop accurate contours of the local water table in the agricultural area.
Unsafe Water Investigation - Devola – Page 9
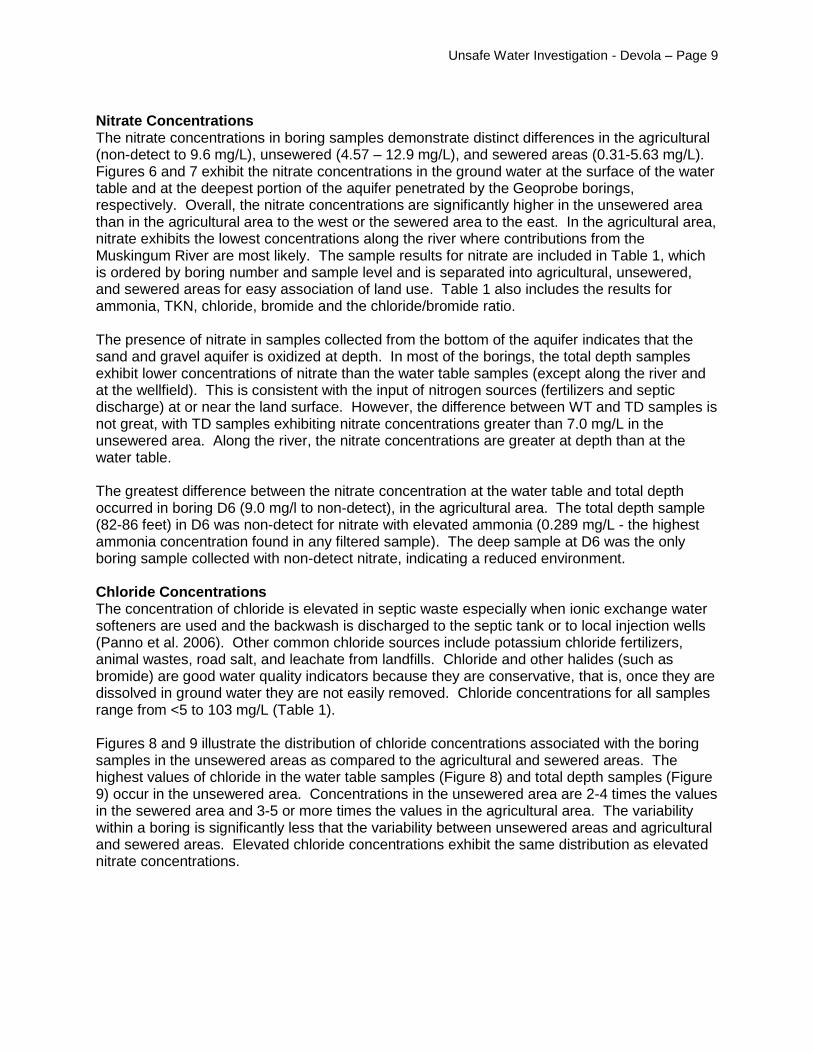
Nitrate Concentrations The nitrate concentrations in boring samples demonstrate distinct differences in the agricultural (non-detect to 9.6 mg/L), unsewered (4.57 – 12.9 mg/L), and sewered areas (0.31-5.63 mg/L). Figures 6 and 7 exhibit the nitrate concentrations in the ground water at the surface of the water table and at the deepest portion of the aquifer penetrated by the Geoprobe borings, respectively. Overall, the nitrate concentrations are significantly higher in the unsewered area than in the agricultural area to the west or the sewered area to the east. In the agricultural area, nitrate exhibits the lowest concentrations along the river where contributions from the Muskingum River are most likely. The sample results for nitrate are included in Table 1, which is ordered by boring number and sample level and is separated into agricultural, unsewered, and sewered areas for easy association of land use. Table 1 also includes the results for ammonia, TKN, chloride, bromide and the chloride/bromide ratio. The presence of nitrate in samples collected from the bottom of the aquifer indicates that the sand and gravel aquifer is oxidized at depth. In most of the borings, the total depth samples exhibit lower concentrations of nitrate than the water table samples (except along the river and at the wellfield). This is consistent with the input of nitrogen sources (fertilizers and septic discharge) at or near the land surface. However, the difference between WT and TD samples is not great, with TD samples exhibiting nitrate concentrations greater than 7.0 mg/L in the unsewered area. Along the river, the nitrate concentrations are greater at depth than at the water table. The greatest difference between the nitrate concentration at the water table and total depth occurred in boring D6 (9.0 mg/l to non-detect), in the agricultural area. The total depth sample (82-86 feet) in D6 was non-detect for nitrate with elevated ammonia (0.289 mg/L - the highest ammonia concentration found in any filtered sample). The deep sample at D6 was the only boring sample collected with non-detect nitrate, indicating a reduced environment. Chloride Concentrations The concentration of chloride is elevated in septic waste especially when ionic exchange water softeners are used and the backwash is discharged to the septic tank or to local injection wells (Panno et al. 2006). Other common chloride sources include potassium chloride fertilizers, animal wastes, road salt, and leachate from landfills. Chloride and other halides (such as bromide) are good water quality indicators because they are conservative, that is, once they are dissolved in ground water they are not easily removed. Chloride concentrations for all samples range from <5 to 103 mg/L (Table 1). Figures 8 and 9 illustrate the distribution of chloride concentrations associated with the boring samples in the unsewered areas as compared to the agricultural and sewered areas. The highest values of chloride in the water table samples (Figure 8) and total depth samples (Figure 9) occur in the unsewered area. Concentrations in the unsewered area are 2-4 times the values in the sewered area and 3-5 or more times the values in the agricultural area. The variability within a boring is significantly less that the variability between unsewered areas and agricultural and sewered areas. Elevated chloride concentrations exhibit the same distribution as elevated nitrate concentrations.

Unsafe Water Investigation - Devola – Page 10
Figure 6. Nitrate concentration in filtered water table samples.
Figure 7. Nitrate concentration in filtered total depth samples.

Unsafe Water Investigation - Devola – Page 11
Table 1. Geochemical results in Borings by Land Use Areas
Boring Sample Level* Filtered Nitrate as N Ammonia TKN Chloride Bromide Cl/Br
Agricultural Area
D-4 WT Y 3.21 <0.050 0.34 7.7 49.6 155.24
D-4 TD Y 4.02 <0.050 0.25 16.8 73.4 228.88
D-5 WT Y 0.91 <0.050 <0.20 <5.0 27 NA
D-5 TD Y 2.02 <0.050 <0.20 34.8 115 302.61
D-6 WT Y 9.00 <0.050 <0.20 18.2 23.2 784.48
D-6 MID Y 9.60 <0.050 <0.20 17.9 28.2 634.75
D-6 MID Y 8.57 0.068 <0.20 17.9 28.5 628.07
D-6 TD Y <0.10 0.289 0.32 8.8 40.4 217.82
D-10 WT Y 1.95 0.059 0.48 NS NS NA
Unsewered Area
D-11 WT Y 7.59 <0.050 <0.20 28.9 24 1204.17
D-12 WT Y 5.96 <0.050 0.57 25.6 24.6 1040.65
D-12 TD Y 4.59 <0.050 0.44 28.1 27.2 1033.09
D-14 WT Y 9.76 <0.050 0.69 63 24.3 2592.59
D-14 MID Y 9.37 <0.050 0.78 95.1 32.9 2890.58
D-14 TD Y 7.63 <0.050 0.59 87.5 31.8 2751.57
D-16 TD Y 7.28 <0.050 0.20 89.2 41.4 2154.59
D-17 WT Y 8.03 0.107 0.30 71.7 36 1991.67
D-17 TD Y 8.52 0.068 0.26 87.5 48.3 1811.59
D-17 WT N 8.08 0.302 <0.20 103 35.8 2877.09
D-17 TD N 8.72 0.072 0.25 52.4 49.3 1062.88
D-18 WT Y 9.10 <0.050 <0.20 87.8 25.7 3416.34
D-18 MID Y 8.47 0.058 <0.20 83.5 36.2 2306.63
D-18 TD Y 9.59 <0.050 0.20 65.9 56.7 1162.26
D-18 WT N 10.7 0.078 <0.20 78.2 23.6 3313.56
D-18 MID N NS NS NS 103 35.5 2901.41
D-18 TD N 9.94 0.286 <2.00 102 <100** NA

Unsafe Water Investigation - Devola – Page 12
Boring Sample Level Filtered Nitrate as N Ammonia TKN Chloride Bromide Cl/Br
D-19 WT Y 12.0 <0.050 0.86 95.1 36.4 2612.64
D-19 MID Y 9.71 <0.050 0.44 93.9 33.7 2786.35
D-19 MID Y 9.00 <0.050 0.56 94 33.2 2831.33
D-19 TD Y 9.28 <0.050 0.73 93.2 48.2 1933.61
D-22 WT Y 9.53 <0.050 0.32 96.1 57.3 1677.14
D-22 TD Y 12.9 0.058 0.71 100 38.5 2597.4
D-23 WT Y 4.57 <0.050 <0.20 24.8 27.7 895.31
D-23 TD Y 5.18 <0.050 <0.20 29.1 27.3 1065.93
PWS 3 MIX N 7.13 <0.050 0.50 82 44.8 1830.36
PWS 4 MIX N 8.90 <0.050 0.50 89.7 39.1 2294.12
Sewered area
D-24 WT Y 5.63 <0.050 0.90 53.6 34.8 1540.23
D-24 TD Y 0.31 0.058 0.36 43.9 65.1 674.35
D-25 WT Y 3.14 0.243 0.42 27.4 47.2 580.51
D-25 TD Y 1.86 <0.050 <0.20 29.6 50 592
D-26 WT Y 3.87 <0.050 0.33 10.7 31.2 342.95
D-26 TD Y 5.33 <0.050 0.32 22.4 36.3 617.08
Units are mg/L except for Bromide which is µg/L. The Cl/Br ratio is unitless. * Sample Level: WT = Water Table; MID = Mid Level TD = Total Depth MIX refers to PWS production well sample (from a long screen) ** Complications with analysis NS – No Sample NA – Not Applicable

Unsafe Water Investigation - Devola – Page 13
Figure 8. Chloride concentration in filtered water table samples.
Figure 9. Chloride concentration in the filtered total depth samples.

Unsafe Water Investigation - Devola – Page 14
The lowest chloride concentrations occur in the water table samples in the borings along the river, except in the area of the wellfield. The total depth samples in the borings along the river are also at the low end of the chloride results but the total depth samples are higher than the water table samples from the same boring. This is probably explained by contributions from the Muskingum River or vertical recharge. A January 2010 sample from the Muskingum River recorded a chloride concentration of 38.3 mg/L, which is above the August results in the water table samples along the river. It is possible that the January river sample was elevated as a result of road salt contributions, but rivers receive chloride from municipal waste water treatment plants and industrial discharge throughout the year. The Heidelberg University National Center for Water Quality Research data for the Muskingum River at McConnelsville (1994-2004) recorded a range of chloride concentrations of 10-110 mg/L with the higher chloride associated with lower discharge. Figure 10 illustrates a direct relationship between concentrations of chloride and nitrate. The cluster of results that plot in the area of high chloride and high nitrate in Figure 10 are from samples collected in the unsewered area of the study. Sample results from PCWA wells 3 and 4 plot within this data cluster. The results from the agricultural area and the sewered area plot in areas of lower chloride and nitrate in Figure 10. The waste streams that contribute nitrate and chloride are distinct (septic discharge and fertilizer vs. softener discharge and road salt) but both are associated with residential land use with discharge through septic systems and dry wells in the unsewered area.
Figure 10. Nitrate versus chloride and associated land use.

Unsafe Water Investigation - Devola – Page 15
The borings along the boundary of the agricultural area (boring D12) or along the river (borings D11 and D23) have sample results that are transitional, for both nitrate and chloride, between the unsewered and sewered or the unsewered and agricultural areas (Figure 10). The results of borings D12 may be the best indicator of the general nitrate concentration in the agricultural area since the ground water flow lines sampled by D12 originate in the agricultural area to the west. The high nitrate in the D6 samples appears to be anomalous for the agricultural area, but the chlorite concentration is not elevated. D6 may be associated with an area of elevated nitrate related to the high levels reported at the Masonic Park Public Water system. Chloride-Bromide Ratios Chloride and bromide are conservative ions in ground water. Bromide has a slightly higher aqueous solubility but chloride is more abundant. For these reasons they can be used to discriminate natural and anthropogenic sources of contamination (Katz, Eberts, Kauffman, 2011). A plot of chloride vs. Cl/Br is used to illustrate mixing relationships between dilute ground water and halite, sewage, and brines. The areas for sewage or uncontaminated ground water indicated on a chloride vs. Cl/Br plot are general areas that reflect natural variability. Boundaries are not bright lines but rather grey areas, but these areas help identify likely sources of contaminants. For example, Panno et al. (2006) recorded Cl/Br ratios from 65 to 5404 (high values influenced by water-softener salt) in septic effluent, and Davis et al. (1998) reported septic Cl/Br ratios ranging between 300 and 600. Thomas (2000) reports that Cl/Br ratios above 400 are associated with anthropogenic contamination. Vengosh and Pankratov (1998) use Cl/Br ratios of 550-900 to distinguish septic influence from low Cl/Br ratio anthropogenic sources like street runoff (without road salt) or agricultural return flow. Clearly the variability of source water and input into septic systems makes sewage influent a poorly defined field in chloride vs. Cl/Br plots. Combining the data summarized above, the imprecise sewage field is defined by Cl/Br ratios between 600 and 1100 with chloride concentrations between 50 and 100 for this report. A Cl/Br ratio of 400 is used to identify the upper limit of unimpacted waters (Thomas, 2000). As with nitrate and chloride, the chloride to bromide ratio exhibits elevated levels (and a wider range) in the unsewered area compared to the agricultural and sewered areas. This is primarily driven by the chloride values. Bromide concentrations (range of 23-115 µg/L) do not exhibit strong correlations with local land use, but the highest concentrations do occur in the agricultural area. Figure 11 illustrates the chloride versus Cl/Br ratio relationships (modified after Francey et al., 2004). The majority of the data collected in Devola plot along and below the GW + halite curve, suggesting that the relationships are controlled by halite dissolution and sewage contamination. The halite source is most likely septic waste and ion exchange softener salt discharge mixed with some road salt in the unsewered area. The softener salt is traveling within the same waste stream as nitrate, discharged through drywells, septic system drain fields or near surface discharge infiltrating to the aquifer. This helps explain the direct correlation of chloride and nitrate. The distribution of data points is generally zoned with the agricultural area plotting in the area of the lowest Cl and Cl/Br ratios and the unsewered area located in the area of the highest Cl concentrations and Cl/Br ratios. The samples collected in the sewered areas are generally intermediate between these extremes. The transitional borings, which occur along the agricultural-unsewered boundary (D12) or close to the river (D11 & D23), also plot in this intermediate zone. The D17 and D18 samples that are located below the unsewered data cluster are both the total depth samples for the borings. D24 is located in the sewered area and may be influenced by leakage from sewer lines as discussed later in the C-C’ cross section discussion.

Unsafe Water Investigation - Devola – Page 16
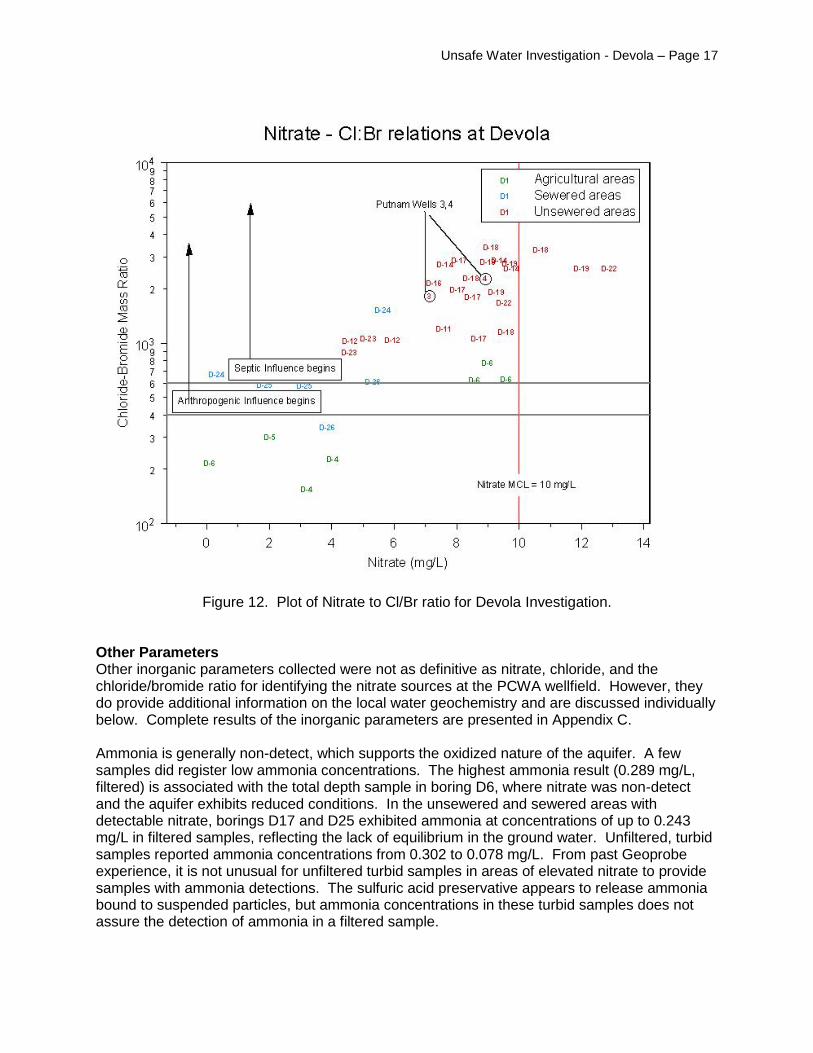
Figure 11. Chloride - Cl/Br ratio relationships for the Devola area. Figure 12 plots nitrate concentrations against the chloride/bromide ratio to separate nitrogen enriched samples. The relationships exhibited are similar to those in Figure 11 with distinct populations of data associated with agriculture, sewered and unsewered land use. The Cl/Br ratios for the lower limit of anthropogenic influence (400) and septic influence (600) are indicated in Figure 12 as is the nitrate MCL (10 mg/L). The limited boring data in agricultural areas exhibit Cl/Br ratios below anthropogenic influence with nitrate concentration below 5 (except D-6, WT & MID). The results from the unsewered area exhibit elevated Cl/Br ratios (>1500) and nitrate (7-13 mg/L). Boring samples from the sewered area plot in the area between the unsewered and agricultural data clusters in the nitrate vs. Cl/Br plot (Figure 12). It is significant that results from PCWA wells 3 and 4 plot within the unsewered data cluster. Several samples are anomalous or transitional with respect to nitrate and the Cl/Br ratio. The high nitrate in the D6 WT and MID samples is anomalous for the limited agricultural data set, but the TD sample for D6 (ND for nitrate) plots with the agricultural data. It is possible the elevated nitrate in D6 is associated with fertilizer sources that may be influencing the Masonic Park well. The WT sample in boring D24 (sewered area) may be influenced by a local sewage line and plots closer to the unsewered data cluster. Borings D11 and D12 exhibit transitional geochemical characteristics between the agricultural and unsewered areas, which is probably due to the fact that the flow lines that D11 and D12 evaluate originate in agricultural areas.
Unsafe Water Investigation - Devola – Page 17
Figure 12. Plot of Nitrate to Cl/Br ratio for Devola Investigation. Other Parameters Other inorganic parameters collected were not as definitive as nitrate, chloride, and the chloride/bromide ratio for identifying the nitrate sources at the PCWA wellfield. However, they do provide additional information on the local water geochemistry and are discussed individually below. Complete results of the inorganic parameters are presented in Appendix C. Ammonia is generally non-detect, which supports the oxidized nature of the aquifer. A few samples did register low ammonia concentrations. The highest ammonia result (0.289 mg/L, filtered) is associated with the total depth sample in boring D6, where nitrate was non-detect and the aquifer exhibits reduced conditions. In the unsewered and sewered areas with detectable nitrate, borings D17 and D25 exhibited ammonia at concentrations of up to 0.243 mg/L in filtered samples, reflecting the lack of equilibrium in the ground water. Unfiltered, turbid samples reported ammonia concentrations from 0.302 to 0.078 mg/L. From past Geoprobe experience, it is not unusual for unfiltered turbid samples in areas of elevated nitrate to provide samples with ammonia detections. The sulfuric acid preservative appears to release ammonia bound to suspended particles, but ammonia concentrations in these turbid samples does not assure the detection of ammonia in a filtered sample.

Unsafe Water Investigation - Devola – Page 18
TKN, the third nitrogen parameter analyzed, generally exhibited non-detect to low values (0.20-0.90 mg/L). The higher TKN values occur in the unsewered and sewered area samples for the water table samples and in the unsewered area samples in the total depth samples. Total organic carbon (TOC) was analyzed and all the samples were non-detect except two. Sample D18-WT- filtered, in the unsewered area, recorded 2.3 mg/L and sample D25-WT - filtered collected in the sewered area recorded 2.4 mg/L. The widespread non-detect values suggest that the value of TOC does not vary significantly in the Devola-Putnam study area. More precise analysis may make TOC a more useful parameter but no significant conclusion can be drawn from the results obtained. Alkalinity was analyzed as a measure of bicarbonate, and the results range from 127-395 mg/L. With the majority of the data between 225 -325mg/L, there appears to be little difference in alkalinity associated with land use. The highest and lowest values are associated with agricultural areas. Iron, manganese, sulfate, and nitrate, were collected to help document the oxidation state in the aquifer. Elevated nitrate confirmed the aquifer was generally oxidized. Iron was non-detect with a few exceptions (D4, D24 and D25) and manganese was detected at low concentrations (15 – 745 µg/L) suggesting limited solution of manganese. The highest manganese concentration (1260 µg/L) was recorded in the total depth sample from D6, where nitrate was non-detect. The iron and manganese behaved as expected in oxic to sub-oxic conditions. Sulfate is generally low (8-75 mg/L) except for two borings (D17 and D18) in which the filtered TD and WT samples record elevated sulfate (3860-4200 mg/L). The unfiltered samples for these borings recorded results in the range of 20.8 – 28.0 mg/L. The D18 MID, filtered sample recorded sulfate of 20.8 mg/L. There is no obvious explanation for this marked variability. A local source of sulfate may be present, like oxidizing iron sulfides, releasing iron oxides and sulfate in the oxidized aquifer, but the available data does not provide a solid explanation. Cross Sections Schematic cross sections were generated to illustrate the nitrate distribution within the local geologic setting. The locations of the cross sections are indicated in Figure 13 which includes the water table contours. Section A-A’ runs parallel to the Muskingum River and the ground water flow paths are generally perpendicular to the cross section. Sections B-B’ and C-C’ are roughtly perpendicular to the river and the ground water flow paths are parallel to the line of section, towards the river. The boundary of the unsewered and sewered (Lindsey Avenue) is perpendicular to section A-A” and its location is indicated. The GPS surface elevation, the depth to the water table, and depth to bedrock determined from the Geoprobe borings are the main elements used to construct the geologic cross sections along with local geologic reports. The borings included in each section are labeled. The sample intervals in each boring are indicated with the nitrate result listed. The nitrate concentrations are contoured. The PWCA wellfield location is indicated on section B-B’ with the 12-13 foot screen at the bottom of the aquifer. Figure 14 displays section A-A’, and sections B-B’ and C-C’ are presented in Figure 15. The geology is simple with the buried valley sand and gravels overlying the Pennsylvanian bedrock (Angle et al., 2002). The nitrate data presented is a single sample event and does not provide information on the variability of nitrate concentration over time at any sample point. However, PCWA has been reporting nitrate concentrations close to or over the nitrate MCL since late 2009, so the elevated values of nitrate from the production wells is consistent with recent and historical concentrations.

Unsafe Water Investigation - Devola – Page 19
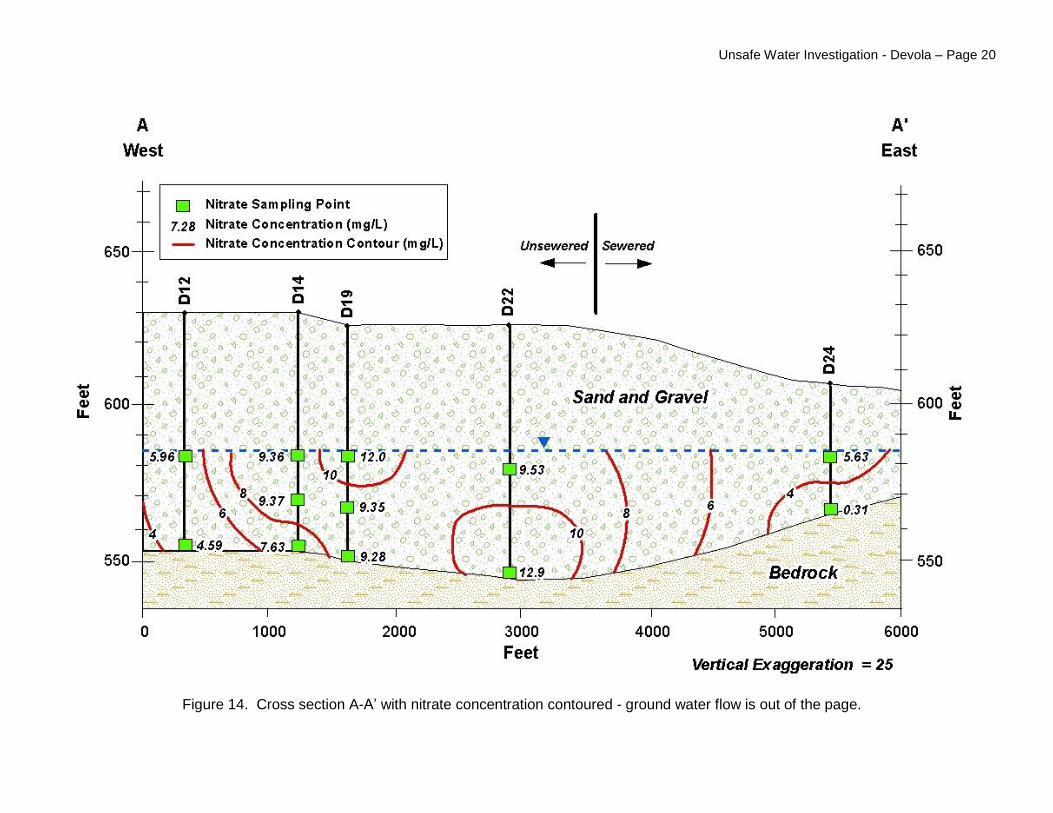
Figure 13. Location of Schematic Cross Sections. In Figure 14, the central portion of the section A-A’ (borings D14, D19, and D22) exhibit significantly higher concentrations of nitrate than in the west or east ends of the section (D12 or D24 respectively). Contours of 4, 6, 8, and 10 mg/L nitrate are sketched on the cross section and nitrate concentrations exceeding 8 mg/L are present from west of boring D14 to east of boring D22. The boundary between the unsewered and sewered area is approximately 650 feet east of boring D22 and this is the area where nitrate concentrations start to decrease. The PCWA wellfield is located 600 feet from section A-A’ and along the river, in the area of boring D19. The contours suggest the highest concentrations of nitrate are flowing to the PCWA wellfield from the area north to northeast of the wellfield. This is consistent with the unsewered area being a major source of elevated nitrate since these flow lines originate in the area of the unsewered portion of Devola. The flow lines from the west include some portion of agricultural land use and exhibit lower nitrate concentrations, like boring D12 with nitrate concentrations of 4.5 to 5.96 mg/L. Boring D12 exhibits transitional geochemical characteristics between the agricultural and unsewered areas as discussed in the nitrate, chloride, and Cl/Br ratio sections of this report.
Unsafe Water Investigation - Devola – Page 20
Figure 14. Cross section A-A’ with nitrate concentration contoured - ground water flow is out of the page.

Unsafe Water Investigation - Devola – Page 21
Figure 15. Cross sections B-B’ and C-C’ with nitrate contours.
Ground water flow is towards the river.

Unsafe Water Investigation - Devola – Page 22
Sections B-B’ and C-C’ in Figure 15 are oriented perpendicular to the Muskingum River. Both sections illustrate the river bank slope and the presence of a terrace above the current flood plain. The water table rises slightly upslope, but the land surface rises more rapidly resulting in deep water tables further from the river (60-70 feet deep, 1500 feet from the river). The nitrate contours in these sections are not particularly informative, but the general concentrations of nitrate in sections B-B’ and C-C’ are noteworthy. These sections document the significant difference between nitrate concentrations in the unsewered and sewered areas. Section B-B’ is located in the unsewered area and is dominated with nitrate concentrations of 8-10 mg/L, which are distinctly higher that the 1-6 mg/L nitrate observed in section C-C’ in the sewered area. In section C-C’ the 5.63 mg/L nitrate in the surface sample in boring D24 is higher than the other surface samples in the section. The chloride (53.6 mg/L) and Cl/Br ratio (1540) values for this sample (D24 WT) are anomalously high for section C-C’ and plot near the sewage field in the chloride versus Cl/Br ratio Plot (Figure 11). These values are transitional between the geochemistry of the unsewered and the sewered areas (Figures 8, 11 and 12). Boring D24 is close to a sewer line and it is possible that leakage from the sewer line is contributing nitrate and chloride to produce these anomalous values. The other nitrate value greater than 5 mg/L in section C-C’ (5.33 mg/L in D26 total depth sample) is located at depth along the river. This sample had lower chloride concentrations (22.4 mg/L) and lower Cl/Br ratio (617), which is not anomalous for the sewered area. Nitrogen and Oxygen Isotopes of Nitrate Samples for stable isotopes of nitrogen and oxygen were collected to help identify the source of the nitrate found in the ground water at the PCWA wellfield. Isotope samples were collected for all the borings and for select samples that were considered potential end members of mixing curves including: sewage, Muskingum River water, public water system wells along the Muskingum River, and private wells in the vicinity of the PWCA wellfield. Data have been received for samples collected by Kristyn Robinson, Friends of the Lower Muskingum River, in June 2010. These data support the conclusions drawn from the nitrate, chloride and Cl/Br ratio data. Isotope data for the geoprobe borings sample has not been received. A short summary of the terminology and presentation of stable isotope data for nitrogen and oxygen is provided in Appendix D1 for readers that are unfamiliar with stable isotopes. The results of the June 2010 samples collected in the Lower Muskingum River Basin are plotted in Figure 16. The x-axis records the δ15N values and the δ18O values are plotted on the y-axis. The various boxes drawn on this graph indicate fields into which nitrogen sources broadly plot. Note that the chemical fertilizer field (upper left) coincides with the value δ18O of +23.5 ‰ (orange line), indicating that the source of oxygen in nitrate from chemical fertilizer is the atmosphere. This contrasts with the results of the June 2010 samples (small triangles). To clarify whether sewage effluent is a potential nitrate source to ground water in the study area, isotopic analysis was performed on influent samples to several local wastewater treatment plants (Devola, Lowell, and Beverly). These sewage samples, blue triangles in Figure 16, plot on the right side of the manure and septic waste field. The location of these points is similar to the value of a composite sample of home sewage effluent from septic tanks in Wayne County (Ohio EPA, 2006). The final nitrate isotopic composition of the sewage samples is influenced most strongly by nitrification of ammonia. Microbes convert ammonium to nitrate where sufficient oxygen is present. The initial nitrate formed has a lower δ 15N value than the ammonium left behind. As organisms transform all the NH4 +, the δ 15N values of the product nitrate become increasingly enriched in δ15N.

Unsafe Water Investigation - Devola – Page 23
With the PCWA wellfield located close to the Muskingum River, induced recharge should pull Muskingum River water into the production wells. Samples of Muskingum River water were collected for stable isotopes of nitrogen and oxygen in nitrate at several dams. The Muskingum River results plot on the left side of the manure and septic waste field in Figure 16 (green triangles). This is a common isotopic signature for dissolved nitrate in rivers, since wastewater treatment plants discharge treated waste water into rivers. Samples for isotope analysis were collected from several public water systems in the lower Muskingum River Basin. At PCWA and Lowell, entry point samples were collected. At Beverly and Tri-County, individual wells were sampled. The isotopic composition of nitrate dissolved in these entry point and well samples are plotted and labeled in Figure 16 as orange triangles. The Tri-County wells and the Lowell entry point samples all plot in the soil nitrogen field. Beverly Well 5 results plot close to the Muskingum River sample (Beverly boat ramp) suggesting induced river water dominants the isotopic signature of water pumped from Well 5. Well 5 is located 300 feet from the Muskingum River in a location where a high proportion of induced river water is expected.
Figure 16. Plot of stable isotopes of nitrogen and oxygen in dissolved nitrate.

Unsafe Water Investigation - Devola – Page 24
The PCWA entry point (Putnam EP002) result is the only sample that plots to the right of the Muskingum River results, in the center of the manure and septic waste field. In addition, this PCWA EP002 result plots along a mixing line between the Devola Dam results and the Devola Waste Water Treatment Plant influent from the sewered area. The significance of this relationship is that it confirms that PCWA distribution water in June 2010 is a mixture of water dominated by water discharged from homes in the unsewered area and Muskingum River water. This confirms the conclusion that the unsewered portion of Devola contributes significant recharge to the PCWA wellfield based on multiple lines of evidence from Geoprobe data, including: nitrate, chloride, chloride/bromide ratios, and ground water flow directions. Nitrogen Loading Order of magnitude calculations for nitrogen loading in the unsewered area were generated. Table 2 lists the average annual loading for the primary nitrogen sources: septic discharge, nitrogen in rainfall, and fertilizer application. The main difference between these inputs is that the septic discharge is released below the soil zone, but the rainfall and fertilizer are applied on the surface. In addition, lawn fertilizers are generally applied during times of high plant demand. Consequently, significant portions of the nitrogen in fertilizer and rainfall are consumed by plants and microbes during infiltration as compared to septic discharged to dry wells. The portion of the nitrate consumed varies as a function of temperature and plant activity. Another issue is that septic discharge is a relatively constant flow and is concentrated on a small area. This increases the probability of generating saturated zones below dry wells and septic leach fields, that allow vertical flow (piping) in higher permeability zones resulting in a more rapid rate of flow to the water table.
Table 2. Average Annual Nitrogen Loading in Unsewered Area
Nitrogen Source Pounds N /Acre
Septic discharge (post leach field) 80 1
Rainfall 7 2
Fertilizer 40 3
1 The unsewered area includes approximately 320 houses in 160 acres with a population of around 3 people per household. Using a median nitrate concentration of 44 mg/L below the leach field (nitrate as N, from Rosen, Kropf, and Thomas, 2006) and water use of 100 gallons per person, the nitrogen loading from septic system discharge is approximately 80 pounds per acre per year. 2 The National Atmospheric Deposition Program reports the nitrate loading in the upper Ohio River basin as 6-8 kg/hector (NADP Web Site). The site closest to Devola recorded 8 kg/hectare in 2009, resulting in an annual nitrogen loading from rainfall of 7 pounds per acre. 3 Agricultural application of nitrogen range up to 150-200 pounds per acre (Iowa State Extension – corn nitrogen rate calculator). The Seedland web site recommends applying an annual rate of 2-6 pounds N per 1000 ft2 depending on type of grass
(average of 170 pounds N per acre). However, most home owners do not apply fertilizer 4 times a year as recommended, so the rate of nitrogen applied is significantly less. The Horsley Witten Group (2009) reports that on Cape Cod homeowners applied fertilizer only 1.44 times a year. At recommended spreading rates this results in application rates of 36 % of the recommended annual application. In addition, in residential areas at least 30-40 % of the area is not lawn. Thus, the application rate in residential areas is estimated to be approximately 40 pounds nitrogen per acre (170 #/acreX36%X65%).

Unsafe Water Investigation - Devola – Page 25
If the 80 pounds of nitrogen in septic discharge mixes with 10 inches of infiltrated rain water (Angle, et al., 2002) with 7 pounds of nitrogen, the average calculated nitrate concentration (nitrate as N) is 21 mg/L (calculated by dividing annual total weight of nitrogen divided by total annual recharge to the aquifer). This value is certainly high because it assumes there is no nitrogen loss after the septic discharge leaves the leach field/drywell and infiltrating rain water does not lose nitrogen. Nevertheless, this concentration is the correct order of maginitude compared to our boring results in the unsewered area. The loss of nitrogen as recharge moves to the water table will lower the average calculated concentration moving it closer to our boring concentrations. The June 2010 isotope results support the conclusion that most of the nitrogen associated with fertilizer and rainfall are removed leaving the strong septic isotopic signal in PCWA distribution water (Figure 16, Putnam EP002). Pharmaceutical and Personal Care Products Data Five samples were collected for analysis of pharmaceutical and personal care products (PPCP). A sample was collected at PCWA wells 3 and 4 and three samples were collected at boring D14 (TD, MID and WT). These samples were analyzed by the Water Supply and Water Resources Division at the U.S. EPA lab in Cincinnati. The samples were concentrated by solid phase extraction and the extracts were analyzed using ultra-high pressure liquid chromatography ion trap/Fourier transform mass spectrometry (UPLC/MS/MS). Quantization was performed using stably labeled analogues as internal standards. The analytes included in the UPLC/MS/MS method were ethynylestradiol, estradiol, estriol, estrone, testosterone, dihydrotestosterone, atrazine, and triclosan. The Water Supply and Water Resources Division of the U. S. EPA was setting up this method and agreed to include several of our samples. All five of the PPCP samples were either non-detect or below the detected calibration standard. The lowest detected calibration standards were 0.1 ng for atrazine, testosterone, progesterone, estriol, estradiol, ethynylestradiol, estrone, and triclosan and 1.25 ng for dihydrotestosterone for 600 ml sample volume. These values are equivalent to 0.167 ng/L and 2.08 ng/L, respectively. Quality control for method performance included recovery of an extraction surrogate, recovery of target analytes added to reagent water or to selected field samples, and evaluation of precision between field duplicates. The surrogate bisphenol A-d16 was added to every sample at 5 ng/600 mL prior to solid phase extraction and was recovered at levels between 50 and 150% for all samples and controls. Target analytes were added to reagent water, one sample of well 3, and one sample of D14 MID at a concentration of 1 ng/600 mL for all targets except dihydrotestosterone, which was added at 5 ng/600 mL. Recoveries of the individual analytes from spiked samples and the control were between 50 and 150% (Kathleen Schenck, U.S.EPA personal communication). The majority of the effort to document the presence of PPCPs is focused on surface water with little data on ground water due to lower concentrations of PPCPs in ground water. Thus, the lack of PPCP detection is not a surprise. It suggests that flow rates of the septic wastes from the unsewered areas to the PCWA wells is slow enough to allow absorption or natural breakdown of these pharmaceutical and personal care parameters before the water reaches the production wells. Thus, the limited sampling for pharmaceutical and personal care products does not support the premise for rapid recycling. However, considering the other data collected, the lack of detections of pharmaceuticals does not suggest that the recycling of septic waste is not occurring, it only indicates the rate of recycling is slow enough to allow the decomposition or removal of the pharmaceutical parameters analyzed.

Unsafe Water Investigation - Devola – Page 26
Long Term Trends The Geoprobe boring results discussed in this report are a single sampling event in a dynamic system. Resampling would document some variability in the values at individual locations, but the general interpretation of the contribution of elevated nitrate from the unsewered area of Devola is unlikely to change. The long history of elevated nitrate at the Putnam Community Water Association, as documented in Figure 1, supports the long term contribution of nitrate from the unsewered portion of Devola. Figure 1 exhibits several significant excursions to lower nitrate concentrations. To fully understand the nitrate contributions to the PCWA wellfield, an explanation for the significant excursions to lower nitrate concentrations needs to be provided. The obvious explanation for occasional, reduced nitrate levels at PCWA is increased recharge of low nitrate water from the Muskingum River. This conclusion is supported by the isotopic data presented in Figure 16. Muskingum River nitrate concentrations range from 0.5-2.5 mg/L (Heidelberg Water Quality Lab), so induced recharge has the potential to dilute elevated nitrate concentrations present in the PCWA production water. The water table delineated by the Geoprobe static water levels document that the maximum water table gradient from Devola to the wellfield is approximately 2 feet per thousand feet. When the river rises significantly, say 5-6 feet, the gradient from the river to the wellfield is approximately 25 feet per thousand feet. Figure17, D-D’ (a portion of cross section B-B’), illustrates the simple geometry of the elevated gradient from the river to the PCWA wells during periods of high discharge.
Figure 17. Cross section through PCWA well field illustrating the elevated gradient from the river to PCWA wells during periods of high discharge.
Consequently, if the Muskingum River remains elevated for long periods, the river acts as a losing stream. The infiltration of significant volumes of Muskingum River water into the aquifer

Unsafe Water Investigation - Devola – Page 27
will dilute the high nitrate ground water flowing from the unsewered portions of Devola. This dilution has a double effect. The first is that the rise in river level and increased gradient from the river to the wells acts to drive induced recharge from the river to the wells. This increased flow from the river displaces flow of higher nitrate concentration from the unsewered portion of Devola. The second influence is the infiltration of river water recharging the buried valley aquifer reduces or dilutes the nitrate concentration of ground water flow from the unsewered area in portions of the aquifer close to the river. For this second effect to be significant, the river stage must remain elevated for long periods of time to allow significant volumes of river water to flow into the buried valley aquifer. In March and into April 2008, the stream gauging station at McConnelsville recorded discharge of over 30,000 cfs for more than a month (USGS Surface Water data) an anomalous flow in both discharge and duration probably due to melting of a heavy snow pack or extensive rainfall. The anomalous discharge and long duration magnifies the dynamic relationship between the Muskingum River discharge and the nitrate concentration in the PCWA PWS wells. Figure 18 illustrates the correlation between the Muskingum River discharge at McConnelsville and the nitrate concentrations at PCWA for the year 2008. The curves for the river discharge and the nitrate at PCWA are smoothed (using a smoothing spline function) to illustrate the correlations. The Muskingum River nitrate concentration for 1994 to 2004 (Heildelberg College, plotted by year day) is also included in Figure 18 to illustrate the lower nitrate concentration in the river compared to the nitrate concentration at the PCWA wells.
Figure 18. Correlation between the Muskingum River and PCWA nitrate concentrations. The discharge scale is on the right axis and the nitrate scale is on the left axis.
Unsafe Water Investigation - Devola – Page 28
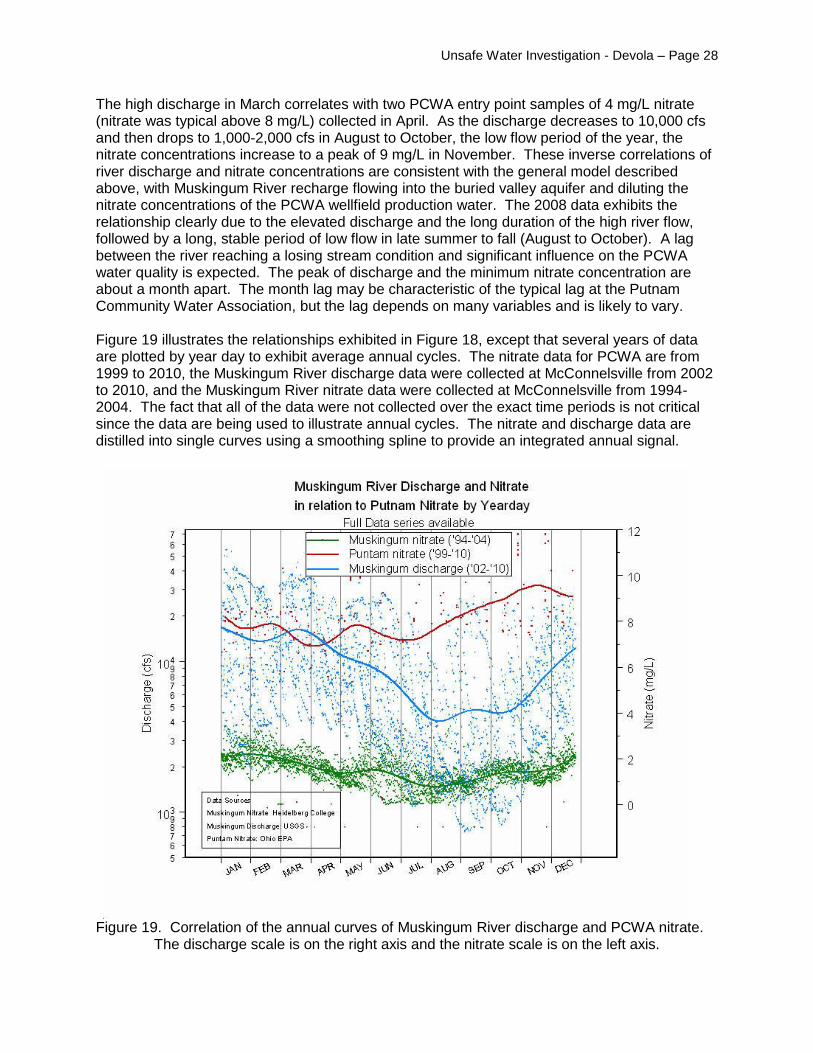
The high discharge in March correlates with two PCWA entry point samples of 4 mg/L nitrate (nitrate was typical above 8 mg/L) collected in April. As the discharge decreases to 10,000 cfs and then drops to 1,000-2,000 cfs in August to October, the low flow period of the year, the nitrate concentrations increase to a peak of 9 mg/L in November. These inverse correlations of river discharge and nitrate concentrations are consistent with the general model described above, with Muskingum River recharge flowing into the buried valley aquifer and diluting the nitrate concentrations of the PCWA wellfield production water. The 2008 data exhibits the relationship clearly due to the elevated discharge and the long duration of the high river flow, followed by a long, stable period of low flow in late summer to fall (August to October). A lag between the river reaching a losing stream condition and significant influence on the PCWA water quality is expected. The peak of discharge and the minimum nitrate concentration are about a month apart. The month lag may be characteristic of the typical lag at the Putnam Community Water Association, but the lag depends on many variables and is likely to vary. Figure 19 illustrates the relationships exhibited in Figure 18, except that several years of data are plotted by year day to exhibit average annual cycles. The nitrate data for PCWA are from 1999 to 2010, the Muskingum River discharge data were collected at McConnelsville from 2002 to 2010, and the Muskingum River nitrate data were collected at McConnelsville from 1994-2004. The fact that all of the data were not collected over the exact time periods is not critical since the data are being used to illustrate annual cycles. The nitrate and discharge data are distilled into single curves using a smoothing spline to provide an integrated annual signal.
Figure 19. Correlation of the annual curves of Muskingum River discharge and PCWA nitrate. The discharge scale is on the right axis and the nitrate scale is on the left axis.

Unsafe Water Investigation - Devola – Page 29
The relationships exhibited in Figure 19 are not as dramatic as in Figure 18. Nevertheless, the association of higher nitrate values at PCWA with low flow conditions in the Muskingum River during August to October and peaking in November is clear. A review of Figure 1, the PCWA nitrate time series, confirms the higher concentrations of nitrate occur late in the year. This is especially clear in the data for 2006 to 2010, which is consistent with the annual curves illustrated in Figure 18. In summary, when Muskingum River discharge is at the year’s minimum, the gradient from the river to the wells is low and recharge from the unsewered area of the Devola dominates the ground water flow to the wells, producing higher nitrate concentrations. At peak river flows and especially during extended periods of high flow, like melt from a heavy snow pack or extended periods of rainfall, the recharge from the river to the wells and the buried valley aquifer increases (Figure 17), with a resulting decrease in nitrate due to increased contribution of river water with relatively low nitrate concentrations. There is certainly some lag time associated with the time needed for river recharge to flow to the production wells. Thus, short spikes of high flow will not influence the nitrate concentration of the PCWA wells significantly. In addition, there is likely a critical river level and/or duration necessary to significantly increase the river contribution to the producing wells, so in years where river discharge never exceeds this threshold, the nitrate levels in the PCWA wells will not exhibit a significant decrease. In contrast, in very wet years or years of heavy snow pack that melts over an extended period of time, recharge from the river to the wellfield can have a significant impact on the nitrate concentration, as was observed in 2008.
Conclusions
The conclusion of this study is the ground water flow from the unsewered area of Devola is contributing significantly to the exceedence of the nitrate MCL at the Putnam Community Water Association. As described in this report, this conclusion is supported by:
Water table surface confirms that the majority of the flow lines to the production wells originate in the unsewered area;
Elevated nitrate and chloride in ground water quality data for the unsewered area as compared to the sewered and agricultural areas in and around Devola;
Water quality data identifies distinct data clusters for the agricultural, sewered and unsewered areas of Devola in plots of nitrate or chloride versus chloride/bromide ratios;
Water quality data for PCWA wells plot within the unsewered data cluster in plots of nitrate or chloride versus chloride/bromide ratios;
Distinct decrease of nitrate concentrations at the unsewered- sewered boundary in Devola;
PCWA entry point isotopic data plots in between the isotopic data of the Devola sewer influent and the Muskingum River; and
Ability to relate annual variation in the PCWA nitrate concentrations to flow conditions of the Muskingum River.
These multiple lines of evidence converge to confirm the hypothesis that the unsewered area of Devola is contributing significantly to the exceedences of the nitrate MCL at the Putnam Community Water Association. The nitrate and chloride in the PCWA distribution water are being recycled and reused with addition of new nitrogen and chloride to the water discharged
Unsafe Water Investigation - Devola – Page 30
from septic systems and dry wells and subsequent flow down gradient to the PCWA wellfield. The nitrate sources are dominantly residential wastewater with lesser contributions from lawn fertilizer and rainfall and sources for the chloride include discharge from ion exchange water softeners and road salt. This is not to say that there are no agricultural inputs of nitrate to the PCWA wellfield. However, the nitrate concentrations of the ground water originating in the agricultural areas are not as high as those in water flowing from the unsewered portions of Devola. The inorganic results document that the aquifer is generally oxidized. In addition, the nitrate, chloride, and chloride/bromide ratios delineate distinct data clusters for agricultural, sewered and unsewered areas. The unsewered area exhibits the highest chloride and nitrate concentrations with nitrate in the range of 7-12.3 mg/L and chloride in the range of 60-103 mg/L. The ground water under the sewered area to the east exhibits significantly lower nitrate (1-5 mg/L) and chloride (10-50 mg/L) concentrations than the unsewered area. Likewise, the agricultural areas to the west appears to have significantly lower nitrate and chloride concentrations as based on the borings in the agricultural areas and borings along the boundary between the agricultural and unsewered areas. The ground water flow direction based on static water measurements from the Geoprobe borings confirm that ground water flow from the unsewered portion of Devola dominates the ground water flow to the PCWA wellfield, at least during the August sampling that corresponds with low flow conditions for the Muskingum River. Some volume of ground water flows from the agriculture area to the west based on the lower nitrate and chloride in borings D11 and D12. The high nitrate concentrations to the north and northeast of the wellfield confirm the flux of high nitrate ground water flowing from the unsewered portion of Devola to the wellfield. The Muskingum River contribution to the PCWA wellfield is dependent upon the discharge of the river. During high flow events, the Muskingum River becomes a losing stream and river recharge to the wellfield and aquifer can influence the nitrate concentrations by contributing low nitrate recharge. The isotopic results from June 2010 samples confirm that the PCWA wellfield is a mix of septic discharge and Muskingum River water. It appears that the elevated nitrate at PCWA will continue the steady increase that the time series documents over the past decade. It is likely that several winters with heavy snows and the resulting slow melt or extended rainfall will generate long periods of elevated flow in the Muskingum River. Long duration, high discharge events will dilute the nitrate concentrations at PCWA’s wellfield. However, when normal conditions return, the elevated nitrate concentrations in ground water will return quickly to levels causing MCL violations. This problem appears to be getting worse, because water with elevated nitrate is being recycled from the distribution system to the wellfield with addition of nitrate to the discharged wastewater with each cycle.
Unsafe Water Investigation - Devola – Page 31
References Cited
Ambient Ground Water Quality Monitoring Program, Operating Procedures Document for Sample Collection and Data Management; 2002. Ohio EPA, Division of Drinking and Ground Waters. Angle, Michael P., Josh Jonak, and Dave Walker; 2002. Ground Water Pollution Potential of Washington County. Ohio Department of Natural Resources, Division of Water, Ground Water Pollution Potential Report no. 55, 49 pp. Clark, Ian and Peter Fritz; 1997. Environmental Isotopes in Hydrogeology. Lewis Publishers. Collins, Horace R., and Bradely E. Smith; 1977. Geology and Mineral resources of Washington County, Ohio. ODNR Division of Geologic Survey Bulletin 66.134 pp. Davis, S.N., D.O. Whittemore, and J. Fabryka-Martin; 1998. Uses of chloride/bromide ratios in studies of potable water. Ground Water 36, no. 2, 338-350. Francy, Donna S., Rebecca N. Bushon, Julie Stopar, Emma J. Luzano, and G. Shay Fout; 2004. Environmental Factors and Chemical and Microbiological Water-Quality Constituents Related to the Presence of Enteric Viruses in Ground Water from Small Public Water Supplies in Southeastern Michigan. USGS Scientific Investigations Report 2004-5219, 54 pp. Heidelberg University National Center for Water Quality Research. Web address: http://www.heidelberg.edu/wql Horsley Witten Group; 2009. Evaluation of turfgrass nitrogen fertilizer leaching rates in soils on Cape Cod, Massachusetts. Prepared for the Massachusetts Department of Environmental Protection. 23 pp. Iowa State University – Agronomy Extension: http://extension.agron.iastate.edu/soilfertility/nrate.aspx Katz, Brian G., Sandra M. Eberts, Leon J. Kauffman; 2011. Using Cl/Br ratios and other indicators to assess potential impacts on groundwater quality from septic systems: a review and examples from principal aquifers in the United States. Journal of Hydrogeology 397, 151-166. National Atmospheric Deposition Program; 2009. National Trends Network, Web address: http://nadp.sws.uiuc.edu/ntn/ Ohio EPA; December 2006. Report of Finings - Unsafe Water Supply Investigation, Wooster Township, Wayne County. Ohio EPA, Division of Drinking and Ground Waters, 37 pp. Panno, S.V., K.C. Hackley, H.H. Hwang, S.E. Greenberg, I.G. Landsberger, and D.J. O’Kelly; 2006. Characterization and Identification of Na-Cl Sources in Ground Water. Ground Water 44, 176-187. Rosen, Michael R., Christian Kropf, and Karen A. Thomas; 2006. Quantification of the Contribution of Nitrogen from Septic Tanks to Ground Water in Spanish Springs Valley, Nevada. USGS Scientific Investigations Report 2006-5206, 12 pp.

Unsafe Water Investigation - Devola – Page 32
Seedland web site for lawn fertilizers: http://www.lawnfertilizers.com Thomas, M.A.; 2000. The Effects of Residential Development on Ground-Water Quality near Detroit, Michagan. Journal of the American Water Resources Association 36, 1023-1038. USGS Surface Water data for Ohio. National Water Information System: Web Interface: http://waterdata.usgs.gov/oh/nwis/sw Vengosh, A., and I. Pqnkratov; 1998. Chloride/Bromide and Chloride/Fluoride Ratios of Domestic Sewage Effluents and Associated Contaminated Ground Water. Ground Water 36, 815-824.

Boring # Boring Date/Time Sample
Number *
Sample
Date/time
Screen Interval
Feet BGS
Refusal BGS
(NA = no
basement)
Water
Table
Feet BGS
Boring # Average
Water
Table
Sample
Number
TD Water
Table
# filters
(1 unless
noted)Comment
D4 8/17/2010 14:40 66 D4 25.2 25.3
D4-TD 8/17/2010 15:30 62-66 25.3 D4-TD
D4-WT 8/17/2010 16:15 30-34 25.1 D4-WT
D5 8/12/2010 13:20 44 D5 17.5 17.5
D5-TD 8/12/2010 14:15 40-44 17.55 D5-TD
D5-WT 8/12/2010 15:30 20-24 17.55 D5-WT 2In first boring did not get production at 19-23 feet. Redrove
new boring to get D5-WT and had good production.
D6 8/12/2010 8:20 86 D6 53.3 54
D6-TD 8/12/2010 9:28 82-86 54 D6-TD 3
D6-MID 8/12/2010 10:43 66-70 53 D6-MID Duplicate A & B
D6-WT 8/12/2010 11:50 54-58 52.84 D6-WT Collected Equipment Blank
D10 8/12/2010 8:00 31 D10 27.6 27.6
D10-WT 8/12/2010 9:00 27-31 27.6 D10-WT 2 Low production - 1/4 cubie collected, no field data
D11 8/13/2010 8:10 64 D11 30.2 30.2
D11-WT 8/13/2010 10:30 32-36 30.2 D11-WTCould not get production between 40-64; silt issues? Drove
2nd boring to 32-36 for D11-WT sample
D12 8/17/2010 11:55 78 D12 45.5 45.5
D12-TD 8/17/2010 12:45 74-78 45.5 D12-TD
D12-WT 8/17/2010 13:15 48-52 45.5 D12-WT
D14 8/17/2010 8:00 77.5 D14 46.1 46.5
D14-TD 8/17/2010 9:00 72-76 46.4 D14-TD PPCP
D14-MID 8/17/2010 9:50 60-64 46 D14-MID PPCP, dupe & spike
D14-WT 8/17/2010 10:45 48-52 45.9 D14-WT PPCP
D16 8/11/2010 10:10 NA D16 ? ?
D16-TD8/11/2010 11:50
84-88 ? D16-TDno good measurement, probe would not go down hole silting
up?
D17 8/10/2010 15:55 NA D17 78.2 78.5
D17-TD 8/10/2010 17:00 92-96 78.5 D17-TD Did not hit refusal
D17-WT 8/10/2010 18:00 79-83 78 D17-WT
D18 8/10/2010 10:40 58.6 D18 27.9 28.3
D18-TD 8/10/2010 11:35 54.6-58.6 28.35 D18-TD
D18-MID 8/10/2010 12:40 41-45 27.7 D18-MID
D18-WT 8/10/2010 13:45 29-33 27.75 D18-WT
D19 8/16/2010 15:15 76 D19 42.9 43.5
D19-TD 8/16/2010 16:00 72-76 43.2 D19-TD
D19-MID 8/16/2010 17:00 58-62 42.9 D19-MID Duplicate A & B
D19-WT 8/16/2010 17:45 45-49 42.7 D19-WT Collected Equipment Blank
D22 8/13/2010 11:50 78.5 D22 41.5 41.5
D22-TD 8/13/2010 12:40 74.5-78.5 41.5 D22-TD lots of silt & v.fine sand in bucket
D22-WT 8/13/2010 14:00 46-50 41.5 D22-WT
Devola Unsafe Water Supply Investigation
Appendix A - List of Borings and Samples Collected
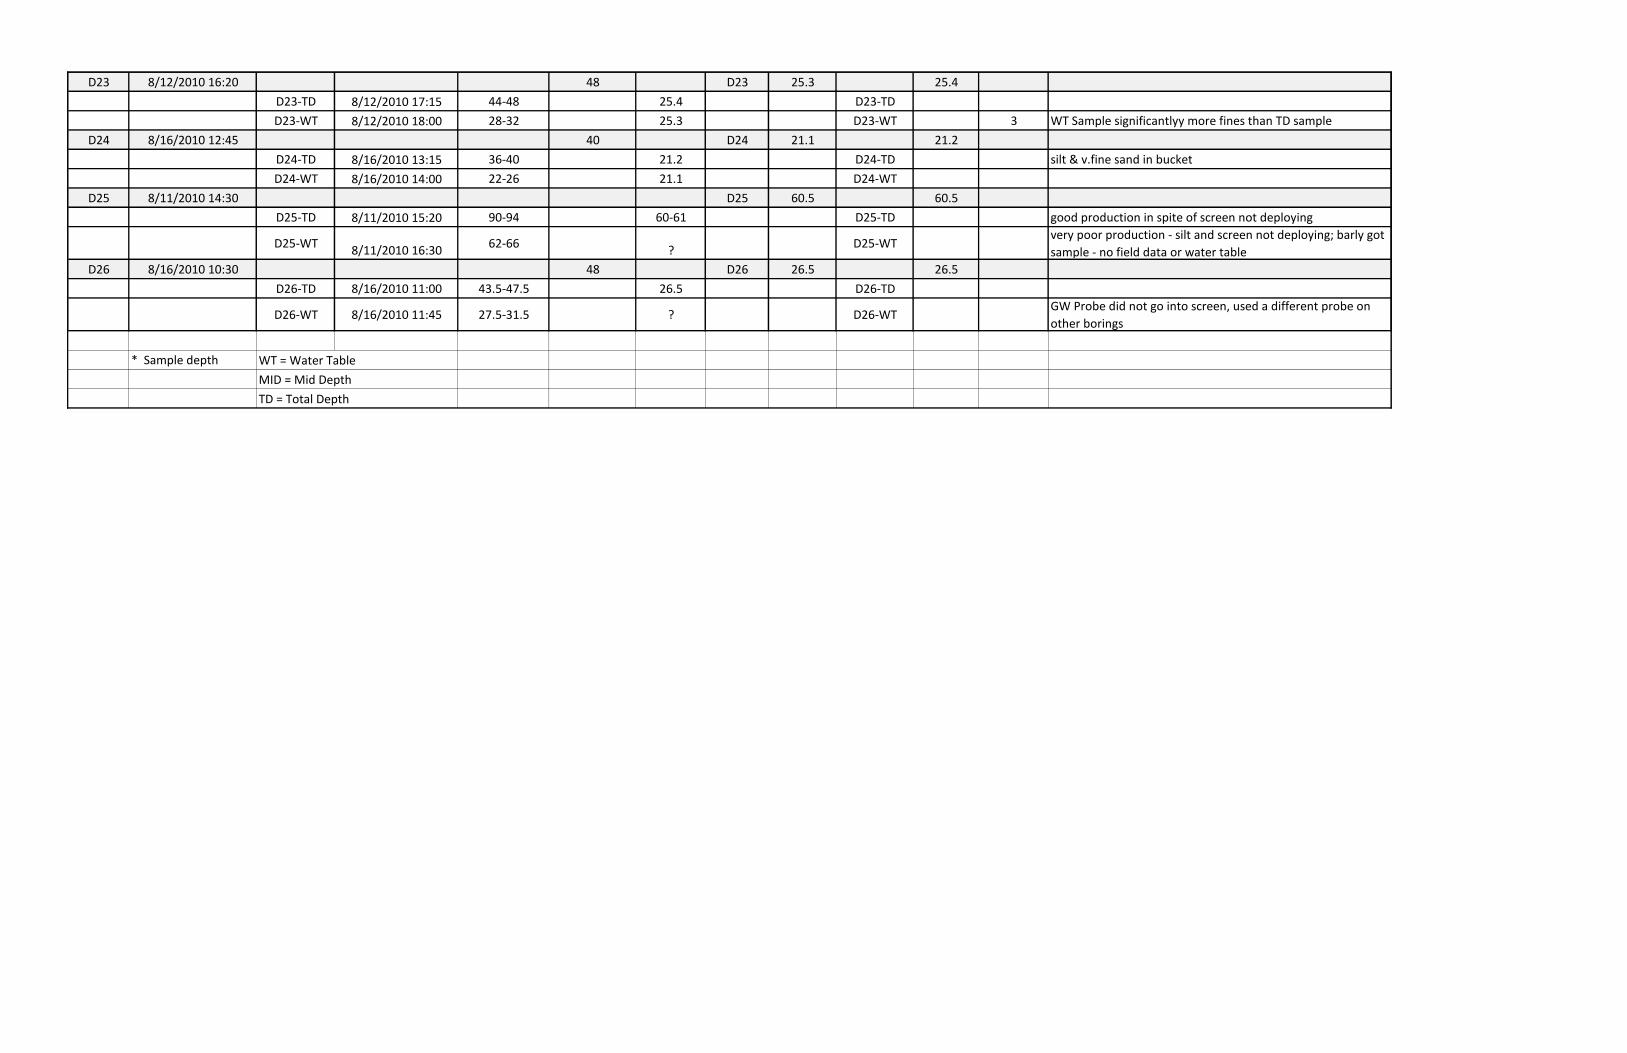
D23 8/12/2010 16:20 48 D23 25.3 25.4
D23-TD 8/12/2010 17:15 44-48 25.4 D23-TD
D23-WT 8/12/2010 18:00 28-32 25.3 D23-WT 3 WT Sample significantlyy more fines than TD sample
D24 8/16/2010 12:45 40 D24 21.1 21.2
D24-TD 8/16/2010 13:15 36-40 21.2 D24-TD silt & v.fine sand in bucket
D24-WT 8/16/2010 14:00 22-26 21.1 D24-WT
D25 8/11/2010 14:30 D25 60.5 60.5
D25-TD 8/11/2010 15:20 90-94 60-61 D25-TD good production in spite of screen not deploying
D25-WT8/11/2010 16:30
62-66?
D25-WTvery poor production - silt and screen not deploying; barly got
sample - no field data or water table
D26 8/16/2010 10:30 48 D26 26.5 26.5
D26-TD 8/16/2010 11:00 43.5-47.5 26.5 D26-TD
D26-WT 8/16/2010 11:45 27.5-31.5 ? D26-WTGW Probe did not go into screen, used a different probe on
other borings
* Sample depth WT = Water Table
MID = Mid Depth
TD = Total Depth

Boring #Boring
Date/Time
Refusal
Depth
BGS *
Average
Water
Table BGS
*
WT
sample
Water
Table *
MID
Sample
Water
Table *
TD sample
Water
Table *
Latitude LongitudeSurface
Elevation
Elevation
Average
WT
Elevation
Total Depth
WT
D4 8/17/2010 14:40 66 25.2 25.1 25.3 39.48400829 81.49803025 616.889 591.7 591.6
D5 8/12/2010 13:20 44 17.55 17.55 17.55 39.47694409 81.4980964 609.899 592.3 592.3
D6 8/12/2010 8:20 86 53.3 52.84 53 54 39.47729029 81.4935298 644.772 591.5 590.8
D10 1 8/12/2010 8:00 31 27.6 27.6 ** 27.6 39.47086555 81.49109258 606.791 579.2 579.2
D11 2 8/13/2010 8:10 64 30.2 30.2 39.46923517 81.48579429 612.842 582.6 612.8
D12 8/17/2010 11:55 78 45.5 45.5 45.5 39.47057329 81.48524549 629.229 583.7 583.7
D14 8/17/2010 8:00 77.5 46.1 45.9 46 46.4 39.46952203 81.48242877 629.825 583.7 583.4
D16 3 8/11/2010 10:10 NA ? ? ? 39.47184451 81.48172325 664.522 NA NA
D17 8/10/2010 15:55 NA 78.25 78 78.5 39.47063642 81.48177265 662.251 584.0 583.8
D18 8/10/2010 10:40 58.6 27.9 27.75 27.7 28.35 39.46791162 81.48187385 609.836 581.9 581.5
D19 8/16/2010 15:15 76 42.9 42.7 42.9 43.2 39.4690911 81.48112182 626.492 583.6 583.3
D22 8/13/2010 11:50 78.5 41.5 45.1 41.5 39.46812256 81.47660941 626.141 584.6 584.6
D23 8/12/2010 16:20 48 25.35 25.3 25.4 39.46591622 81.47710582 609.468 584.1 584.1
D24 8/16/2010 12:45 40 21.15 21.1 21.2 39.46479762 81.46874493 605.666 584.5 584.5
D25 4 8/11/2010 14:30 94 60.5 ? 60.5 39.46726912 81.46884571 641.9 581.4 581.4
D26 5 8/16/2010 10:30 48 26.5 ? 26.5 39.46360308 81.47056824 610.406 583.9 583.9
* Feet Below Ground Surface
** Questionable measurement
1 Very low production from D10
2 No production from 40-62
3 Water tape probe would not go down casing - silt issues
4 TD sample - water tape measurement 60-61; no measurement possible for D25-WT sample
5 No water tape measurement for D26-WT sample
Devola Unsafe Water Supply Investigation
Appendix B - Water Table and Location Measurements

BORING SAMPLE LOCATIONSAMPLE
LEVEL
SAMPLE
DEPTHFILTERED
LAND
USE
SAMPLE
NUMBER
ALKALINITY
mg/L
AMMONIA
mg/L
BROMIDE
ug/L
CHLORIDE
mg/L
IRON
ug/L
MANGANESE
ug/L
NITRATE
mg/L
SULFATE
mg/l
TKN
mg/L
TOC
mg/L
CL/BR
unitless
D-4 Boring D4-WT-FILT WT 30-34 Y Ag 124301 395 < 0.05 49.6 7.7 73 130 3.21 26.9 0.34 < 2 155.24
D-4 Boring D4-TD-FILT TD 62-66 Y Ag 124300 275 < 0.05 73.4 16.8 80 485 4.02 36.1 0.25 < 2 228.88
D-5 Boring D5-WT-FILT WT 20-24 Y Ag 124115 127 < 0.05 27 < 5 < 50 27 0.91 21.3 < 0.2 < 2 NA
D-5 Boring D5-TD-FILT TD 40-44 Y Ag 124114 277 < 0.05 115 34.8 < 50 117 2.02 38.6 < 0.2 < 2 302.61
D-6 Boring D6-WT-FILT WT 54-58 Y Ag 124095 269 < 0.05 23.2 18.2 < 50 323 9.00 63.3 < 0.2 < 2 784.48
D-6 Boring D6-MID-FILT Dup A MID 66-70 Y Ag 124093 253 < 0.05 28.2 17.9 < 50 445 9.60 44.1 < 0.2 < 2 634.75
D-6 Boring D6-MID-FILT Dup B MID 66-70 Y Ag 124094 243 0.068 28.5 17.9 < 50 677 8.57 43.9 < 0.2 < 2 628.07
D-6 Boring D6-TD-FILT TD 82-86 Y Ag 124092 242 0.289 40.4 8.8 < 50 1260 < 0.1 8.5 0.32 < 2 217.82
D-10 Boring D10-WT-FILT WT 27-31 Y Ag 124097 NA 0.059 NA NA NA NA 1.95 NA 0.48 NA NA
D-11 Boring D11-WT-FILT WT 32-36 Y Unsewer 124118 309 < 0.05 24 28.9 < 50 41 7.59 32.6 < 0.2 < 2 1204.17
D-12 Boring D12-WT-FILT WT 48-52 Y Unsewer 124299 324 < 0.05 24.6 25.6 < 50 123 5.96 28.7 0.57 < 2 1040.65
D-12 Boring D12-TD-FILT TD 74-78 Y Unsewer 124298 228 < 0.05 27.2 28.1 < 50 118 4.59 29.4 0.44 < 2 1033.09
D-14 Boring D14-WT-FILT WT 48-52 Y Unsewer 124297 282 < 0.05 24.3 63 < 50 153 9.76 29 0.69 < 2 2592.59
D-14 Boring D14-MID-FILT MID 60-64 Y Unsewer 124296 282 < 0.05 32.9 95.1 < 50 263 9.37 28.7 0.78 < 2 2890.58
D-14 Boring D14-TD-FILT TD 72-76 Y Unsewer 124295 278 < 0.05 31.8 87.5 < 50 150 7.63 27.1 0.59 < 2 2751.57
D-16 Boring D16-TD-FILT TD 84-88 Y Unsewer 124098 231 < 0.05 41.4 89.2 < 50 227 7.28 25.1 < 0.2 < 2 2154.59
D-17 Boring D17-WT-FILT WT 79-83 Y Unsewer 124101 242 0.107 36 71.7 < 50 306 8.03 4040 0.3 < 2 1991.67
D-17 Boring D17-TD-FILT TD 92-96 Y Unsewer 124102 246 0.068 48.3 87.5 < 50 302 8.52 4090 0.26 < 2 1811.59
D-17 Boring D17-WT WT 79-83 N Unsewer 124106 244 0.302 35.8 103 NA NA 8.08 28.2 < 0.2 < 2 2877.09
D-17 Boring D17-TD TD 92-96 N Unsewer 124107 245 0.072 49.3 52.4 NA NA 8.72 27.5 0.25 < 2 1062.88
D-18 Boring D18-WT-FILT WT 29-33 Y Unsewer 124103 229 < 0.05 25.7 87.8 < 50 138 9.10 3860 < 0.2 < 2 3416.34
D-18 Boring D18-MID-FILT MID 41-45 Y Unsewer 124105 259 0.058 36.2 83.5 < 50 392 8.47 20.8 < 0.2 < 2 2306.63
D-18 Boring D18-TD-FILT TD 54.6-58.6 Y Unsewer 124104 250 < 0.05 56.7 65.9 < 50 530 9.59 4200 < 0.2 < 2 1162.26
D-18 Boring D18-WT WT 29-33 N Unsewer 124108 224 0.078 23.6 78.2 NA NA 10.70 23.2 < 0.2 2.2 3313.56
D-18 Boring D18-MID MID 41-45 N Unsewer 124109 260 NA 35.5 103 NA NA NA 26.4 NA NA 2901.41
D-18 Boring D18-TD TD 54.6-58.6 N Unsewer 124110 246 0.286 <100 102 NA NA 9.94 27.5 < 2.0 < 2 NA
D-19 Boring D19-WT-FILT WT 45-49 Y Unsewer 124309 279 < 0.05 36.4 95.1 < 50 244 12.00 42.1 0.86 < 2 2612.64
D-19 Boring D19-MID-FILT Dup A MID 58-62 Y Unsewer 124307 255 < 0.05 33.7 93.9 < 50 190 9.71 29.4 0.44 < 2 2786.35
D-19 Boring D19-MID-FILT Dup B MID 58-62 Y Unsewer 124308 250 < 0.05 33.2 94 < 50 218 9.00 29.5 0.56 < 2 2831.33
D-19 Boring D19-TD-FILT TD 72-76 Y Unsewer 124306 252 < 0.05 48.2 93.2 < 50 78 9.28 28.2 0.73 < 2 1933.61
D-22 Boring D22-WT-FILT WT 46-50 Y Unsewer 124120 316 < 0.05 57.3 96.1 < 50 92 9.53 39 0.32 < 2 1677.14
D-22 Boring D22-TD-FILT TD 74.5-78.5 Y Unsewer 124119 230 0.058 38.5 100 < 50 34 12.90 33.9 0.71 < 2 2597.4
D-23 Boring D23-WT-FILT WT 28-32 Y Unsewer 124117 255 < 0.05 27.7 24.8 < 50 34 4.57 34 < 0.2 < 2 895.31
D-23 Boring D23-TD-FILT TD 44-48 Y Unsewer 124116 259 < 0.05 27.3 29.1 < 50 15 5.18 36.4 < 0.2 < 2 1065.93
3 Putnam Comm PWS Well 3 MIX 45-57 N Unsewer 124312 259 < 0.05 44.8 82 NA NA 7.13 31.7 0.5 < 2 1830.36
4 Putnam Comm PWS Well 4 MIX 45-57 N Unsewer 124313 264 < 0.05 39.1 89.7 < 50 < 10 8.90 31.4 0.5 < 2 2294.12
D-24 Boring D24-WT-FILT WT 22-26 Y Sewer 124305 325 < 0.05 34.8 53.6 < 50 186 5.63 75.1 0.9 < 2 1540.23
D-24 Boring D24-TD-FILT TD 36-40 Y Sewer 124304 244 0.058 65.1 43.9 170 170 0.31 71.3 0.36 < 2 674.35
D-25 Boring D25-WT-FILT WT 62-66 Y Sewer 124100 250 0.243 47.2 27.4 < 50 745 3.14 41.2 0.42 2.4 580.51
D-25 Boring D25-TD-FILT TD 90-94 Y Sewer 124099 225 < 0.05 50 29.6 430 105 1.86 53.1 < 0.2 < 2 592
D-26 Boring D26-WT-FILT WT 27.5-31.5 Y Sewer 124303 165 < 0.05 31.2 10.7 < 50 207 3.87 27.6 0.33 < 2 342.95
D-26 Boring D26-TD-FILT TD 43.5-47.5 Y Sewer 124302 239 < 0.05 36.3 22.4 < 50 139 5.33 46.8 0.32 < 2 617.08
D-EQ1 Equipment Blank 124096 < 5 < 0.05 < 20 < 5 119 < 10 < 0.1 < 5 < 0.2 < 2 NA
Equipment Blank 124310 < 5 < 0.05 < 20 < 5 305 < 10 < 0.1 < 5 < 0.2 < 2 NA
NA = Not Analyzed or Not Applicable
Devola Unsafe Water Supply Investigation
Appendix C1 - Inorganic Results

BORING SAMPLE LOCATIONSAMPLE
LEVEL
SAMPLE
DEPTHFILTERED
SAMPLE
NUMBER
LAND
USE
SONDE
LOG#
TEMP. O C
SP. COND.
umhos/cm
TDS
mg/L
DO
% SATURATED
DO
mg/L
PH
S.U.
ORP
mV
NITRATE
MG/l
TURBIDITY
NTULOCATION
D-4 Boring D4-WT-FILT WT 30-34 Y 124301 Ag log37 14.7 764 497 29.6 3 6.75 -103 8.1 446 D4
D-4 Boring D4-TD-FILT TD 62-66 Y 124300 Ag log36 15.12 626 407 14.2 1.42 7.1 -450 12.6 1432 D4
D-5 Boring D5-WT-FILT WT 20-24 Y 124115 Ag log16 16.09 302 196 45.8 4.5 5.9 185 2.4 1090 D5
D-5 Boring D5-TD-FILT TD 40-44 Y 124114 Ag log15 14.99 693 451 28.4 2.86 6.78 -37 5.5 1922 D5
D-6 Boring D6-WT-FILT WT 54-58 Y 124095 Ag log14 18.18 768 499 115.7 10.89 6.98 18 11.7 2000 D6
D-6 Boring D6-MID-FILT Dup A MID 66-70 Y 124093 Ag log13 16.78 668 434 104.2 10.1 7.15 -28 14.1 1976 D6
D-6 Boring D6-MID-FILT Dup B MID 66-70 Y 124094 Ag log13 16.78 668 434 104.2 10.1 7.15 -28 14.1 1976 D6
D-6 Boring D6-TD-FILT TD 82-86 Y 124092 Ag log12 16.99 497 323 33.7 3.25 7.18 -226 0.2 1873 D6
D-10 Boring D10-WT-FILT WT 27-31 Y 124097 Ag No Log NA NA NA NA NA NA NA NA NA D10
D-11 Boring D11-WT-FILT WT 32-36 Y 124118 Unsewer log19 15.05 784 510 101.2 10.17 6.97 157 11.1 1946 D11
D-12 Boring D12-WT-FILT WT 48-52 Y 124299 Unsewer log35 16.17 734 477 101.9 10 6.99 25 23.5 871 D12
D-12 Boring D12-TD-FILT TD 74-78 Y 124298 Unsewer log33 15.65 570 371 92.3 9.16 7.19 62 17.3 1956 D12
D-14 Boring D14-WT-FILT WT 48-52 Y 124297 Unsewer log31 15.2 830 539 96.2 9.64 7.03 44 43.6 1033 D14
D-14 Boring D14-WT-FILT WT 48-52 Y 124297 Unsewer log32 ** 20.89 827 537 113.1 10.08 7.19 127 44.4 2.9 D14
D-14 Boring D14-MID-FILT MID 60-64 Y 124296 Unsewer log30 16.64 914 594 87.1 8.46 7.06 -33 24.3 1964 D14
D-14 Boring D14-TD-FILT TD 72-76 Y 124295 Unsewer log29 14.97 886 576 84.3 8.49 7.01 28 31.6 1533 D14
D-16 Boring D16-TD-FILT TD 84-88 Y 124098 Unsewer log10 20.52 843 548 62.4 5.61 7.21 29 19.9 2013 D16
D-17 Boring D17-WT-FILT WT 79-83 Y 124101 Unsewer log9 18.4 818 531 78.3 7.33 7.3 40 4.3 1997 D17
D-17 Boring D17-TD-FILT TD 92-96 Y 124102 Unsewer log8 18.25 901 586 75 7.05 7.22 104 7.7 2000 D17
D-17 Boring D17-WT WT 79-83 N 124106 Unsewer log9 18.4 818 531 78.3 7.33 7.3 40 4.3 1997 D17
D-17 Boring D17-TD TD 92-96 N 124107 Unsewer log8 18.25 901 586 75 7.05 7.22 104 7.7 2000 D17
D-18 Boring D18-WT-FILT WT 29-33 Y 124103 Unsewer log7 16.27 728 473 105.6 10.34 6.91 147 48.6 1966 D18
D-18 Boring D18-MID-FILT MID 41-45 Y 124105 Unsewer log4 ** 21.5 443 288 103.2 9.1 7.37 156 22 4 D18
D-18 Boring D18-TD-FILT TD 54.6-58.6 Y 124104 Unsewer log2 ** 23.18 929 604 91.4 7.79 7.36 142 36 2 D18
D-18 Boring D18-WT WT 29-33 N 124108 Unsewer log7 16.27 728 473 105.6 10.34 6.91 147 48.6 1966 D18
D-18 Boring D18-MID MID 41-45 N 124109 Unsewer log3 15.85 823 535 89 8.79 7.2 35 153 1959 D18
D-18 Boring D18-TD TD 54.6-58.6 N 124110 Unsewer log1 16.43 900 585 79.2 7.73 7.29 13 29.3 1969 D18
D-19 Boring D19-WT-FILT WT 45-49 Y 124309 Unsewer log28 15.74 1018 662 98.1 9.7 7.08 38 38.6 1957 D19
D-19 Boring D19-MID-FILT Dup A MID 58-62 Y 124307 Unsewer log27 15.61 916 595 89.5 8.88 7.16 -14 25.9 1955 D19
D-19 Boring D19-MID-FILT Dup B MID 58-62 Y 124308 Unsewer log27 15.61 916 595 89.5 8.88 7.16 -14 25.9 1955 D19
D-19 Boring D19-TD-FILT TD 72-76 Y 124306 Unsewer log26 16.65 906 589 94.2 9.15 7.14 26 33 1973 D19
D-22 Boring D22-WT-FILT WT 46-50 Y 124120 Unsewer log21 17.47 707 460 59.8 5.71 6.98 -23 25.3 173 D22
D-22 Boring D22-TD-FILT TD 74.5-78.5 Y 124119 Unsewer log20 16.94 908 590 60.9 5.88 7.21 142 20.2 1239 D22
D-23 Boring D23-WT-FILT WT 28-32 Y 124117 Unsewer log18 15.43 647 420 28.5 2.84 6.95 -227 11.4 1952 D23
D-23 Boring D23-TD-FILT TD 44-48 Y 124116 Unsewer log17 15.83 682 443 28.5 2.82 6.96 102 9.3 1950 D23
3 Putnam Comm PWS Well 3 MIX 45-57 N 124312 Unsewer No Log NA NA NA NA NA NA NA NA NA PWS 3
4 Putnam Comm PWS Well 4 MIX 45-57 N 124313 Unsewer No Log NA NA NA NA NA NA NA NA NA PWS 4
D-24 Boring D24-WT-FILT WT 22-26 Y 124305 Sewer log25 17.56 952 619 70.6 6.72 6.84 29 11.1 1821 D24
D-24 Boring D24-TD-FILT TD 36-40 Y 124304 Sewer log24 17.3 726 472 13.8 1.32 7.26 -73 0.5 1985 D24
D-25 Boring D25-WT-FILT WT 62-66 Y 124100 Sewer No Log NA NA NA NA NA NA NA NA NA D25
D-25 Boring D25-TD-FILT TD 90-94 Y 124099 Sewer log11 18.67 633 412 15.3 1.43 7.2 -143 8.7 1704 D25
D-26 Boring D26-WT-FILT WT 27.5-31.5 Y 124303 Sewer log23 14.24 456 297 51.1 5.23 6.28 80 5.2 1932 D26
D-26 Boring D26-TD-FILT TD 43.5-47.5 Y 124302 Sewer log22 14.91 653 425 15 1.51 7.07 -7 6.6 1860 D-26
D-EQ1 Equipment Blank 124096 No Log NA NA NA NA NA NA NA NA NA
Equipment Blank 124310 No Log NA NA NA NA NA NA NA NA NA
** Log 2, Log 4 & Log 32 - Field data was measured in filtered sample In most cases the field data was measered in unfiltered water runing through sonde.
Appendix C2 - Field Data
Devola Unsafe Water Supply Investigation

SAMPLE.LOCATION D14-WT-FILT D14-MID-FILT D14-TD-FILT Putnam Well 3 Putnam Well 4
SAMPLE.DEPTH, feet BGS 48-52 60-64 72-76 45-57 45-57
FILTERED Y Y Y N N
SAMPLE NUMBER 124297 124296 124295 124312 124313
ALKALINITY, mg/L 282 282 278 259 264
ALUMINUM, µg/L <200 <200 <200 NA <200
AMMONIA, mg.L 0.05 0.05 0.05 0.05 0.05
ARSENIC, µg/L <2.0 <2.0 <2.0 <2.0 <2.0
BARIUM, mg/L 122 142 157 NA 132
BROMIDE, µg/L 24.3 32.9 31.8 44.8 39.1
CADMIUM, µg/L <0.20 <0.20 <0.20 <0.20 <0.20
CALCIUM, mg/L 108 108 110 NA 102
CHLORIDE, mg/L 63.0 95.1 87.5 82.0 89.7
CHROMIUM, µg/L <2.0 <2.0 <2.0 <2.0 <2.0
COD, mg/L <20 <20 <20 <20 <20
COPPER, µg/L <2.0 2.3 2.8 4.9 8.5
FLUORIDE, mg/L <0.20 <0.20 <0.20 <0.20 <0.20
HARDNESS, mg/L 340 336 345 NA 321
IRON, mg/L <50 <50 <50 NA <50
LEAD, µg/L <2.0 <2.0 <2.0 <2.0 <2.0
MAGNESIUM, mg/L 17 16 17 NA 16
MANGANESE, µg/L 153 263 150 NA <10
NICKEL, µg/L 4.8 7.4 4.9 3.5 2.0
NITRATE, mg/L 9.76 9.37 7.63 7.13 8.90
POTASSIUM, mg/L 2 2 2 NA 2
SELENIUM, µg/L <2.0 <2.0 <2.0 <2.0 <2.0
SODIUM, mg/L 46 62 56 NA 56
STRONTIUM, µg/L 141 153 158 NA 163
SULFATE, mg/L 29.0 28.7 27.1 31.7 31.4
TKN, mg/L 0.69 0.78 0.59 0.50 0.50
TOC, mg/L <2 <2 <2 < 2 < 2
TDS, mg/L 500 556 592 488 526
TOTAL.PHOSPHATE, mg/L <0.010 <0.010 <0.010 <0.010 <0.010
ZINC, µg/L <10 39 <10 NA 24
Cl/Br unitless 2593 2891 2752 1830 2294
TDS, mg/L 539 594 576 NA NA
DO % SATURATED 96.2 87.1 84.3 NA NA
DO, mg/L 9.6 8.5 8.5 NA NA
PH, S.U. 7.0 7.1 7.0 NA NA
ORP, mV 44 -33 28 NA NA
SONDE NITRATE, mg/L 43.6 24.3 31.6 NA NA
TURBIDITY, NTU 1033 1964 1533 NA NA
NA = Not Analyzed or Not Measured
Appendix C3 - Samples with Additional Parameters
Devola Unsafe Water Supply Investigation
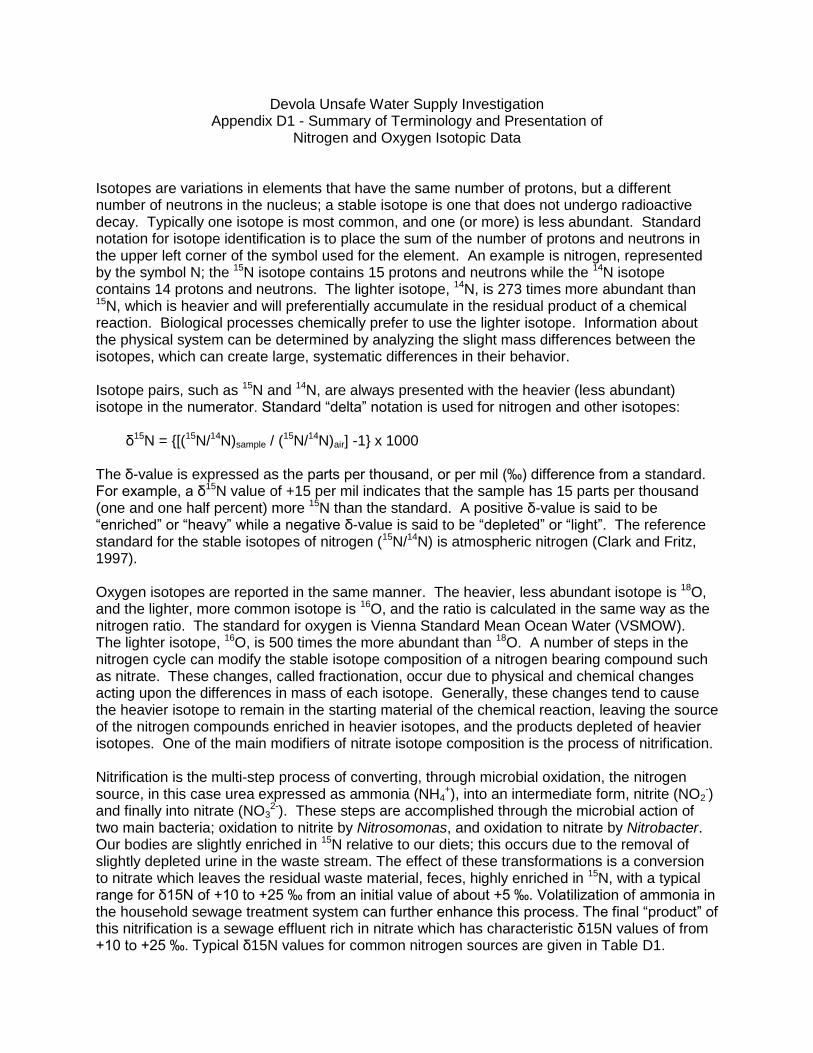
Devola Unsafe Water Supply Investigation Appendix D1 - Summary of Terminology and Presentation of
Nitrogen and Oxygen Isotopic Data Isotopes are variations in elements that have the same number of protons, but a different number of neutrons in the nucleus; a stable isotope is one that does not undergo radioactive decay. Typically one isotope is most common, and one (or more) is less abundant. Standard notation for isotope identification is to place the sum of the number of protons and neutrons in the upper left corner of the symbol used for the element. An example is nitrogen, represented by the symbol N; the 15N isotope contains 15 protons and neutrons while the 14N isotope contains 14 protons and neutrons. The lighter isotope, 14N, is 273 times more abundant than 15N, which is heavier and will preferentially accumulate in the residual product of a chemical reaction. Biological processes chemically prefer to use the lighter isotope. Information about the physical system can be determined by analyzing the slight mass differences between the isotopes, which can create large, systematic differences in their behavior. Isotope pairs, such as 15N and 14N, are always presented with the heavier (less abundant) isotope in the numerator. Standard “delta” notation is used for nitrogen and other isotopes: δ15N = {[(15N/14N)sample / (
15N/14N)air] -1} x 1000 The δ-value is expressed as the parts per thousand, or per mil (‰) difference from a standard. For example, a δ15N value of +15 per mil indicates that the sample has 15 parts per thousand (one and one half percent) more 15N than the standard. A positive δ-value is said to be “enriched” or “heavy” while a negative δ-value is said to be “depleted” or “light”. The reference standard for the stable isotopes of nitrogen (15N/14N) is atmospheric nitrogen (Clark and Fritz, 1997). Oxygen isotopes are reported in the same manner. The heavier, less abundant isotope is 18O, and the lighter, more common isotope is 16O, and the ratio is calculated in the same way as the nitrogen ratio. The standard for oxygen is Vienna Standard Mean Ocean Water (VSMOW). The lighter isotope, 16O, is 500 times the more abundant than 18O. A number of steps in the nitrogen cycle can modify the stable isotope composition of a nitrogen bearing compound such as nitrate. These changes, called fractionation, occur due to physical and chemical changes acting upon the differences in mass of each isotope. Generally, these changes tend to cause the heavier isotope to remain in the starting material of the chemical reaction, leaving the source of the nitrogen compounds enriched in heavier isotopes, and the products depleted of heavier isotopes. One of the main modifiers of nitrate isotope composition is the process of nitrification. Nitrification is the multi-step process of converting, through microbial oxidation, the nitrogen source, in this case urea expressed as ammonia (NH4
+), into an intermediate form, nitrite (NO2-)
and finally into nitrate (NO32-). These steps are accomplished through the microbial action of
two main bacteria; oxidation to nitrite by Nitrosomonas, and oxidation to nitrate by Nitrobacter. Our bodies are slightly enriched in 15N relative to our diets; this occurs due to the removal of slightly depleted urine in the waste stream. The effect of these transformations is a conversion to nitrate which leaves the residual waste material, feces, highly enriched in 15N, with a typical range for δ15N of +10 to +25 ‰ from an initial value of about +5 ‰. Volatilization of ammonia in the household sewage treatment system can further enhance this process. The final “product” of this nitrification is a sewage effluent rich in nitrate which has characteristic δ15N values of from +10 to +25 ‰. Typical δ15N values for common nitrogen sources are given in Table D1.
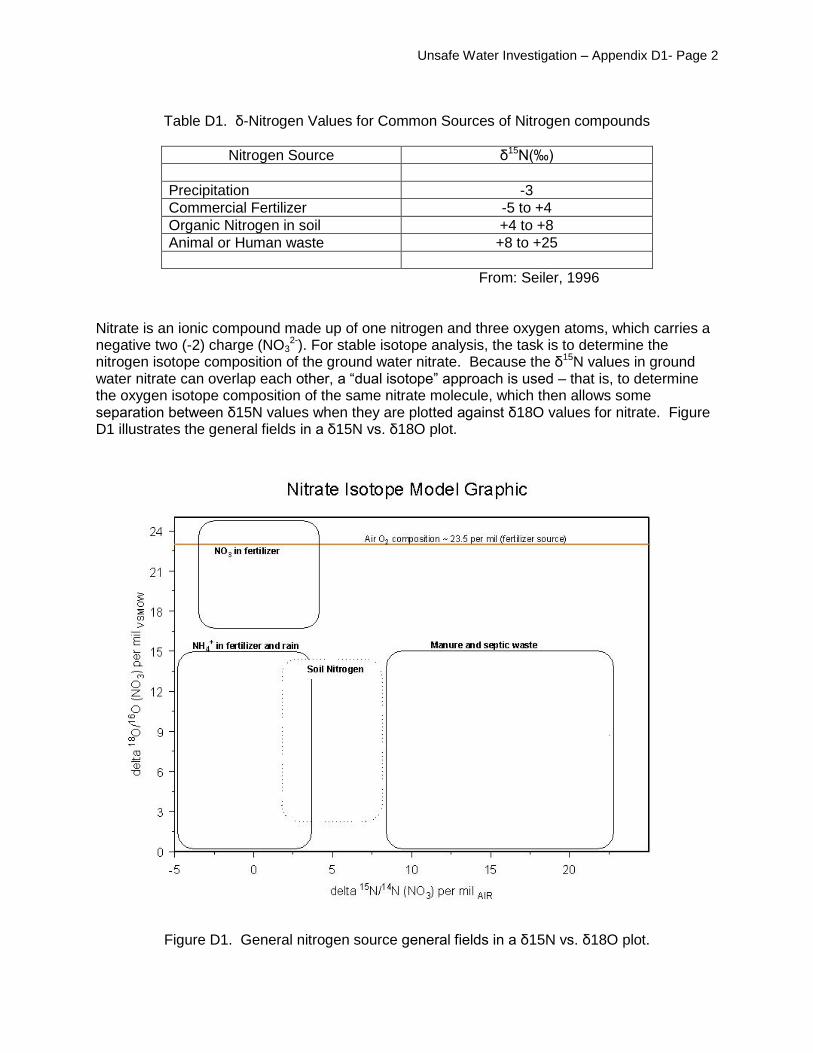
Unsafe Water Investigation – Appendix D1- Page 2
Table D1. δ-Nitrogen Values for Common Sources of Nitrogen compounds
Nitrogen Source δ15N(‰)
Precipitation -3
Commercial Fertilizer -5 to +4
Organic Nitrogen in soil +4 to +8
Animal or Human waste +8 to +25
From: Seiler, 1996 Nitrate is an ionic compound made up of one nitrogen and three oxygen atoms, which carries a negative two (-2) charge (NO3
2-). For stable isotope analysis, the task is to determine the nitrogen isotope composition of the ground water nitrate. Because the δ15N values in ground water nitrate can overlap each other, a “dual isotope” approach is used – that is, to determine the oxygen isotope composition of the same nitrate molecule, which then allows some separation between δ15N values when they are plotted against δ18O values for nitrate. Figure D1 illustrates the general fields in a δ15N vs. δ18O plot.
Figure D1. General nitrogen source general fields in a δ15N vs. δ18O plot.

Location Lable delta 15
N/14
N (NO3) delta 18O/16O (NO3)
per mil AIR per mil VSMOW
Beverly Well 5 EP Beverly Well 05 11.181 3.023
Muskingum River at Beverly boat ramp Beverly Boat Ramp 11.661 4.019
Beverly WWTP Influent WWTP Influent "Beverly" 20.653 6.524
Putnam Entry Point 002 Putnam EP002 13.542 6.033
Muskingum River at Devola Dam Devola Dam 9.677 5.235
Devola WWTP Influent WWTP Influent "Devola" 18.856 7.643
Muskingum River at Lowell lock Lowell lock 11.987 3.093
Lowell WWTP Influent WWTP Influent "Lowell" 20.905 8.023
Lowell entry point Lowell EP002 6.811 2.665
Tri-county well #1 Tri County Wells 1 6.775 4.582
Tri-county well #2 Tri County Wells 2 4.078 5.099
Tri-county well #3 Tri County Wells 3 5.112 5.092
Devila Unsafe Water Supply Investigation
Appendix D2 - Isotope Data