Embed Size (px)
Citation preview

UNM BBER Data Users Conference
November 14th, 2013
NMDWS Industry & Occupation Projections

Why Do We Make Projections?

Who Uses Industry And Occupational Projections? -High school and college students, their parents and teachers to learn about the available jobs in their area,-Career changers, career development specialists and guidance counselors,-State workforce agencies to match employment with education and economic development efforts,-Policymakers to best invest tax dollars to training,-Education and training officials to make decisions about education and training policy, funding, and program offerings, -Other federal agencies, researchers, and academics use the projections to understand trends in the economy and labor market. How often are they updated? -The National projections are updated every two years. -New Mexico and several other states update the industry and occupational projections every year for all areas.

How Are Projections Developed?
Nearly Every State and 4 Territories Develop Projections Using The Same Modeling Program

Inputs To The Models
- NEW MEXICO QCEW INDUSTRY EMPLOYMENT TIME SERIES

- NATIONAL EMPLOYMENT TIME SERIES

- NATIONAL VARIABLES
• Composite Index - 10 Leading Indicators• Average Weekly Hours in Manufacturing• Average Weekly Initial UI Claims• Manufacturer's New orders - Cons. Goods• Vendor Performance• Manufacturer's New Orders - non-Defense cap goods• Building Permits - New Housing• S & P 500• Money Supply (M2)• Consumer Expectations• Light Vehicle Sales• NAPM: US Mfg Composite• Total Business Inventories• CPI - Urban: All items• Total Housing Starts - Private• PPI - Finished Goods - Except Food• Total Non-Farm Employment• Total non-Farm Employment - Goods Producing• Interest Rate Spread

- NEW MEXICO VARIABLES
• New Mexico Population• New Mexico Employment• NM Median Household Income• NM Per Capita Income• New Mexico Unemployment Rate• NM Natural Gas Marketed Production• NM Building Permits

Start By Projecting Industry Growth
• Long Term Industry Projections – are for a ten-year horizon. Current cycle is 2011-2021.
• Short Term Industry projections – are for a two-year horizon. Current cycle is 2012-2014.

Add All The Inputs To Projections Models….
Inputs plus variables go in here...
…Industry Projections come out here!
Project-o-matic with shift-share; time-series; and OLS regression models

New Mexico LTIP 2011 - 2021New Mexico Industry Projections 2011 - 2021 2011 2021 Annual
Industry Industry Estimated Projected Number Growth
Title Code Employment Employment Change Rate
Manufacturing 310000 29,560 28,590 -970 -0.3%Ag, Forest, Fishing & Hunting 110000 10,350 9,830 -520 -0.5%Management of Companies 550000 5,070 5,210 140 0.3%Information 510000 13,450 13,660 210 0.2%Utilities 220000 4,370 4,640 270 0.6%Finance & Insurance 520000 21,000 21,800 800 0.4%Real Estate, Rental & Leasing 530000 9,640 10,960 1,330 1.3%Arts, Entertainment & Recreation 710000 12,540 14,600 2,050 1.5%Transportation & Warehousing 480000 18,040 20,250 2,200 1.2%Wholesale Trade 420000 21,000 23,610 2,610 1.2%Other Services 810000 20,640 23,550 2,920 1.3%Government 900000 90,100 93,660 3,550 0.4%Professional, Scientific & Technical 540000 53,570 58,790 5,230 0.9%Construction 230000 42,200 47,550 5,350 1.2%Administrative & Support Services 560000 41,640 48,080 6,440 1.4%Mining 210000 21,250 28,250 7,000 2.9%Retail Trade 440000 90,210 104,310 14,100 1.5%Accommodation & Food Service 720000 79,940 97,120 17,180 2.0%Educational Services 610000 80,200 100,340 20,140 2.3%Health Care & Social Assistance 620000 118,040 146,190 28,160 2.2%Total All 000000 851,840 971,680 119,840 1.3%

Employment Growth, 2011 - 2021
Manufacturing
Ag, Forest, Fishing and Hunting
Management of Companies
Information
Utilities
Finance and Insurance
Real Estate, Rental and Leasing
Arts, Entertainment and Recreation
Transportation and Warehousing
Wholesale Trade
Other Services
Government
Professional, Scientific and Technical Services
Construction
Administrative and Support Services
Mining
Retail Trade
Accommodation and Food Service
Educational Services
Health Care and Social Assistance
-5,000 0 5,000 10,000 15,000 20,000 25,000 30,000
-970
-520
140
210
270
800
1,330
2,050
2,200
2,610
2,920
3,550
5,230
5,350
6,440
7,000
14,100
17,180
20,140
28,160
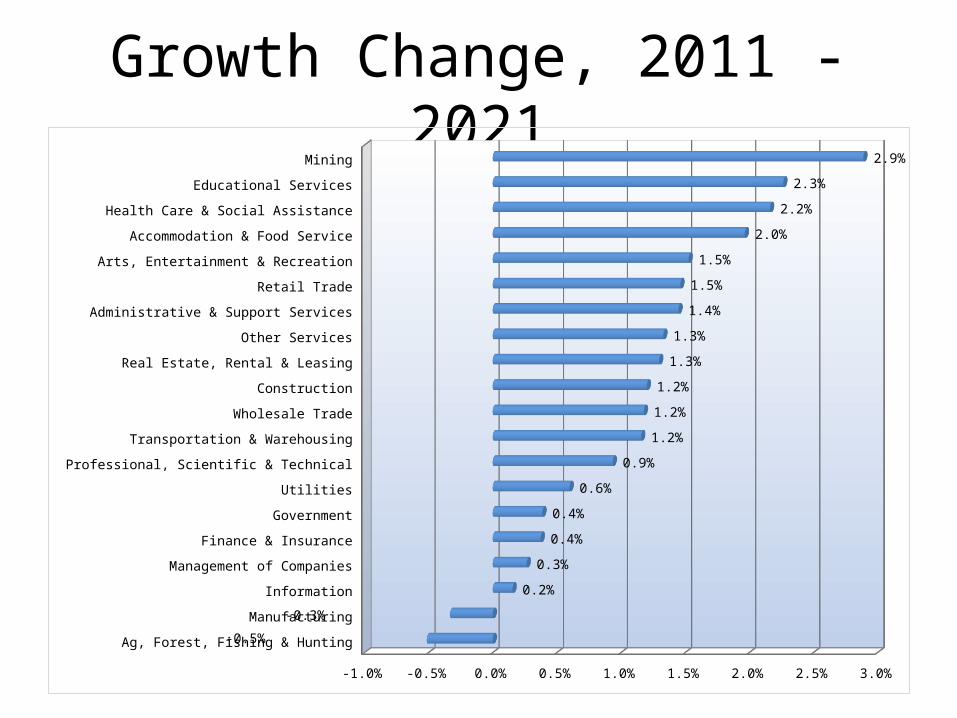
Growth Change, 2011 - 2021
Ag, Forest, Fishing & Hunting
Manufacturing
Information
Management of Companies
Finance & Insurance
Government
Utilities
Professional, Scientific & Technical
Transportation & Warehousing
Wholesale Trade
Construction
Real Estate, Rental & Leasing
Other Services
Administrative & Support Services
Retail Trade
Arts, Entertainment & Recreation
Accommodation & Food Service
Health Care & Social Assistance
Educational Services
Mining
-1.0% -0.5% 0.0% 0.5% 1.0% 1.5% 2.0% 2.5% 3.0%
-0.5%
-0.3%
0.2%
0.3%
0.4%
0.4%
0.6%
0.9%
1.2%
1.2%
1.2%
1.3%
1.3%
1.4%
1.5%
1.5%
2.0%
2.2%
2.3%
2.9%

Share % Of EachIndustry
1.0% 2.9% 0.5%4.9%
2.9%2.4%
10.7%
2.1%
1.4%
2.2%1.1%6.1%
0.5%4.9%
10.3%15.0%
1.5%
10.0%2.4% 9.6%
1.2% 2.5% 0.5%5.0%
3.5%2.5%
10.6%
2.1%
1.6%
2.5%1.1%
6.3%
0.6%4.9%
9.4%13.9%
1.5%
9.4%2.4% 10.6%
Ag, Forest, Fishing and HuntingMiningUtilitiesConstructionManufacturingWholesale TradeRetail TradeTransportation and WarehousingInformationFinance and InsuranceReal Estate, Rental and LeasingProfessional, Scientific and Technical ServicesManagement of CompaniesAdministrative and Support ServicesEducational ServicesHealth Care and Social AssistanceArts, Entertainment and RecreationAccommodation and Food ServiceOther ServicesGovernment
2011
2021

New Mexico STIP 2012 - 2014New Mexico Industry Projections 2012-2014 2012 2014 Industry Industry Estimated Projected Number PercentTitle Code Employment Employment Change Change
Agriculture, Forestry, Fishing & Hunting 110000 11,400 10,600 -800 -7.0%Management of Companies 550000 4,970 4,970 0 0.0%Utilities 220000 4,430 4,460 30 0.7%Other Services (Except Government) 810000 21,180 21,220 40 0.2%Arts, Entertainment, & Recreation 710000 12,880 13,050 170 1.3%Information 510000 13,500 13,720 220 1.6%Wholesale Trade 420000 21,750 22,040 290 1.3%Finance & Insurance 520000 21,150 21,470 320 1.5%Manufacturing 310000 29,870 30,230 360 1.2%Administrative & Support Services 560000 40,700 41,080 380 0.9%Real Estate & Rental & Leasing 530000 10,050 10,510 460 4.6%Professional, Scientific, & Technical 540000 52,420 52,930 510 1.0%Transportation & Warehousing 480000 19,230 19,770 540 2.8%Educational Services 610000 81,700 82,660 960 1.2%Government 900000 90,190 91,900 1,710 1.9%Construction 230000 42,900 44,830 1,930 4.5%Retail Trade 440000 93,520 95,450 1,930 2.1%Mining 210000 24,540 27,100 2,560 10.4%Accommodation & Food Services 720000 82,310 85,120 2,810 3.4%Health Care & Social Assistance 620000 121,040 126,180 5,140 4.2%Total All Industries 000000 798,080 819,270 21,190 2.7%

Industry Growth, 2012 - 2014
Agriculture, Forestry, Fishing & Hunting
Management of Companies
Utilities
Other Services (Except Government)
Arts, Entertainment, & Recreation
Information
Wholesale Trade
Finance & Insurance
Manufacturing
Administrative & Support Services
Real Estate & Rental & Leasing
Professional, Scientific, & Technical Services
Transportation & Warehousing
Educational Services
Government
Construction
Retail Trade
Mining
Accommodation & Food Services
Health Care & Social Assistance
-1,000 0 1,000 2,000 3,000 4,000 5,000 6,000
-800
0
30
40
170
220
290
320
360
380
460
510
540
960
1,710
1,930
1,930
2,560
2,810
5,140

Growth Change, 2011 - 2021
Agriculture, Forestry, Fishing & Hunting
Management of Companies
Other Services (Except Government)
Utilities
Administrative & Support Services
Professional, Scientific, & Technical Services
Educational Services
Manufacturing
Arts, Entertainment, & Recreation
Wholesale Trade
Finance & Insurance
Information
Government
Retail Trade
Transportation & Warehousing
Accommodation & Food Services
Health Care & Social Assistance
Construction
Real Estate & Rental & Leasing
Mining
-8.0% -6.0% -4.0% -2.0% 0.0% 2.0% 4.0% 6.0% 8.0% 10.0% 12.0%
-7.0%
0.0%
0.2%
0.7%
0.9%
1.0%
1.2%
1.2%
1.3%
1.3%
1.5%
1.6%
1.9%
2.1%
2.8%
3.4%
4.2%
4.5%
4.6%
10.4%

Job Recovery Based On 2011-2021 Industry Projections
Dec-07
Apr-08
Aug-08
Dec-08
Apr-09
Aug-09
Dec-09
Apr-10
Aug-10
Dec-10
Apr-11
Aug-11
Dec-11
Apr-12
Aug-12
Dec-12
Apr-13
Aug-13
Dec-13
Apr-14
Aug-14
Dec-14
Apr-15
Aug-15
Dec-15
Apr-16
Aug-16
Dec-16
Apr-17
Aug-17
Dec-17
740,000
760,000
780,000
800,000
820,000
840,000
860,000
880,000
Employment Recovery
Pre-Recession Employment
Peak employmentin Dec 2007 at 855,300
Trendline according to 2011-2021 IndustryProjections.
Intersect in 2017.

Now That We Have Industry Projections, What’s Next?

- Occupational Staffing Pattern
• The occupational staffing pattern for industries comes from the Occupation Employment Statistics program
• Voluntary survey of about 3,500 employers per year
• Collected over 3 years• Sampled based on their industry code• Added Bonus – Wages by Occupation

Put It All Together….
Industry projections and staffing pattern data go in here…
…And occupational projections come out here!
Project-o-matic matches the industry control total with the staffing pattern

New Mexico OP 2011 - 2021New Mexico Occupational Projections 2011 - 2021 2011 2021 Annual Annual Total
Occupational Occupational Estimated Projected Number Growth Replacement Annual Percent
Group Code Employment Employment Change Openings Openings Openings Change
Management 110000 56,580 59,020 2,440 360 1,160 1,520 4.3%
Business & Financial 130000 31,120 35,100 3,980 400 620 1,020 12.8%
Computer & Mathematical 150000 14,660 17,070 2,410 240 280 530 16.4%
Architecture & Engineering 170000 20,510 21,850 1,330 140 450 590 6.5%
Life, Physical & Social Science 190000 13,540 14,650 1,110 110 450 560 8.2%
Community & Social Service 210000 14,280 16,930 2,650 270 320 580 18.6%
Legal 230000 7,500 7,780 280 40 130 170 3.8%
Education 250000 51,710 64,480 12,770 1,280 1,150 2,430 24.7%
Arts, Design & Entertainment 270000 11,130 12,010 880 110 290 400 7.9%
Healthcare Practitioners 290000 47,990 54,700 6,710 670 960 1,630 14.0%
Healthcare Support 310000 25,940 32,310 6,370 640 380 1,020 24.6%
Protective Services 330000 21,670 24,300 2,630 260 530 790 12.1%
Food Prep & Service 350000 73,900 89,680 15,780 1,580 2,590 4,170 21.4%
Building & Grounds Cleaning 370000 33,360 37,380 4,020 400 590 990 12.0%
Personal Care & Service 390000 44,670 59,390 14,710 1,480 810 2,290 32.9%
Sales 410000 81,000 92,610 11,610 1,170 2,540 3,710 14.3%
Office Support 430000 124,920 134,910 9,990 1,140 2,690 3,830 8.0%
Farm, Fishing & Forestry 450000 7,650 7,630 -20 10 230 240 -0.2%
Construction & Extraction 470000 59,840 68,320 8,480 860 1,230 2,090 14.2%
Maintenance & Repair 490000 33,020 37,120 4,100 410 760 1,170 12.4%
Production 510000 31,370 32,950 1,590 230 680 910 5.1%
Transportation & Material Moving 530000 45,480 51,510 6,030 610 1,130 1,730 13.2%
Total All Occs 000000 851,840 971,680 119,840 12,410 19,960 32,370 14.1%

Employment Growth, 2011 - 2021
NM Occupational Projections 2011 - 2021 2011 2021 Annual Annual Total Annual
Occupational Occupational Estimated Projected Number Growth Replacement Annual Percent Growth
Titles Code Employment Employment Change Openings Openings Openings Change Rate
Person Care Aides 399021 19,700 30,670 10,970 1,100 160 1,250 55.7% 4.5%
Retail Sales 412031 28,580 33,310 4,730 470 840 1,310 16.6% 1.5%
Combination Food Prep & Servers 353021 14,360 18,670 4,310 430 400 830 30.0% 2.7%
Home Health Aides 311011 6,790 10,750 3,960 400 90 480 58.4% 4.7%
Waitstaff 353031 15,270 18,630 3,360 340 760 1,100 22.0% 2.0%
Cashiers 412011 19,700 22,810 3,110 310 890 1,210 15.8% 1.5%
Elementary School Teachers 252021 9,410 12,140 2,730 270 210 480 29.0% 2.6%
Registered Nurses 291111 16,890 19,480 2,590 260 310 570 15.3% 1.4%
Teachers Aides 259041 9,640 11,900 2,260 230 220 440 23.4% 2.1%
Customer Service Representatives 434051 12,770 14,580 1,810 180 360 540 14.2% 1.3%
Restaurant Cooks 352014 6,410 8,130 1,720 170 140 310 26.9% 2.4%
Bookkeepers 433031 14,090 15,600 1,510 150 160 310 10.7% 1.0%
Janitors 372011 12,310 13,820 1,510 150 230 380 12.3% 1.2%
Truck Drivers 533032 9,610 11,050 1,440 140 190 340 15.0% 1.4%
Retail Sales Supervisors 411011 11,870 13,310 1,440 140 280 420 12.1% 1.2%
Food Prep & Servers Supervisors 351012 6,030 7,400 1,370 140 130 270 22.6% 2.1%
General Office Clerks 439061 10,190 11,540 1,350 140 180 320 13.3% 1.3%
Stockers & Material Handlers 537062 9,100 10,390 1,300 130 290 420 14.2% 1.3%
Roustabouts 475071 2,800 4,070 1,270 130 60 190 45.2% 3.8%
Office Managers 431011 9,770 10,950 1,190 120 260 380 12.1% 1.2%
Total All Occs 000000 851,840 971,680 119,840 12,410 19,960 32,370 14.1% 1.3%

Employment Projections By Education,2011 - 2021
New Mexico Projections By Education
Education Number
Level 2011 2021 Change
Less than high school 250,110 300,730 50,620
High school diploma or equivalent 356,010 392,260 36,250
Bachelor's degree 130,770 151,010 20,240
Master's degree 15,170 18,660 3,500
Postsecondary non-degree award 34,300 37,730 3,430
Doctoral or professional degree 20,470 23,270 2,800
Associate's degree 39,350 41,690 2,340

Projections Are Based On All Things Being Equal And There Are No Shocks To The Economy…

www.jobs.state.nm.us/analyzer/default.asp
Click these links for industry or occupational projections

QUESTIONS?

CONTACT INFORMATION:Bob Richards
ECONOMIC RESEARCH & ANALYSIS BUREAUDEPARTMENT OF WORKFORCE SOLUTIONS