Embed Size (px)
Citation preview

Unlocking the value of metricsMaximizing smart grid technologies for high performance

2
Introduction 3
Finding No. 1 5Although utilities have accelerated their implementation of smart grid technologies, many have yet to realize all the targeted benefits, which is where metrics play a critical role.
Finding No. 2 11While utilities are using metrics to measure smart grid performance, many could benefit from additional data and benchmarks to maximize the value of follow-on analysis.
Metrics inventory 15
Implications for utilities 23
Conclusion 26
Contents

3
A smart grid is a communication-enabled electrical grid that collects and acts on information about the behavior of all participants (energy providers and consumers) in order to improve the economics, efficiency, reliability, importance and sustainability of electricity services. It has the promise of self-diagnosing issues and self-healing, incorporating numerous advanced technologies at all stages of the electricity supply chain.
The transition from a traditional network to a smart grid requires significant investments in infrastructure and wide deployments of technology. The ability to efficiently monitor and ultimately manage these technologies will determine smart grid performance and will be critical for the success of utilities in the future.
Over the years, different energy providers or regulating bodies have established metrics that determine how well the grid operates in terms of reliability and network availability. Such metrics have helped form leading practices that enable providers to run their systems more reliably and enhance their customers’ satisfaction.
Today, in North America and Europe, government funding for smart grid initiatives has ushered in a new wave of reporting requirements. Around the world, utilities and government agencies are working on quantifying and defining the most meaningful smart grid measures.
To understand what utilities are doing in the smart grid metrics space, Accenture surveyed utilities around the globe. The survey was designed to collect a representative sampling of metrics used to track the extent to which the grid is being modernized (made smarter) and how its performance (i.e., key benefits of being smarter) is tracked. In conducting the survey and its subsequent analysis, we found regional synergies and differences spanning the drivers/objectives of the modernization efforts to the metrics used, and the frequency of their use. This paper delves into a “metrics inventory” to explore not only what utilities measure, but also how they are measured and who specifically has responsibility for the measurement.
Introduction

4
This quantitative survey is based on telephone interviews with 32 utilities executives located in North America, Europe, Asia-Pacific and Latin America. All survey participants qualified themselves as involved in the decision-making process or being an influencer regarding the decisions of their company related to smart grid performance. As Figure 1 shows, more than three-quarters of
respondents were based either in North America or Europe, and more than half of participating executives were from utilities with more than $10 billion in revenues, with cross-segment capabilities in generation, transmission and distribution and retail. The fieldwork was conducted by MarketOne International between July and August 2011.
Methodological notes:• All answers are based on the total number of respondents to each question, which may vary in some cases and which exclude nonanswers.
• Regional breakdowns shown in the survey results should be considered high-level trends, given the limited regional sample size.
• More than two-thirds of the respondents had operations spanning from generation to retail.
Methodology
Figure 1. Profile of participating utilities.
Geographic repartition
28%
3%Other
Latin America 3%
Asia-Pacif ic 9%
Europe
North America 56%
Group total revenue 2010 (USD)
$3 billion-$5 billion
18%
$1 billion-$3 billion 16%
< $1 billion
16%
> $10 billion50%
Sector segments
T&D, Retail
16%
Generation, T&D, Retail
Note: Due to rounding, some totals do not equal 100 percent.
Retail
3%
69%
Generation, T&D
3%
T&D
6%
Generation
3%

5
Finding No. 1
Although utilities have accelerated their implementation of smart grid technologies, many have yet to realize all targeted benefits, which is where metrics play a critical role.

6
Smart grid implementation and investment are growing. As illustrated in Figure 2, more than two-thirds of utilities say they have implemented smart grid technologies within the past five years.
Regardless of where any utility stands today with its smart grid plans, the majority of utilities are accelerating the development, rollout and use of smart grid technologies, as more than 80 percent of respondents indicate that they will increase their smart grid investments over the next five years, with just over one-quarter indicating they will increase investment by 20 percent or more (see Figure 3). The trend likely reflects the shift in smart grid deployments from pilots to full rollouts under way.
The main driver behind this trend varies by region although, overall, respondents indicate grid reliability and improving customer choice are the primary reasons for increased smart grid activity (see Figure 4). In North America, the majority of utilities cite “improve system economics” as the key driver, while European utilities also added environmental drivers to the mix, though they cite the need to “maintain or enhance system reliability” as their primary driver. In both of these regions, utilities rate “increase customer choice” as a close runner-up as the key driver behind smart grid growth.
Base: All respondents.
More than f ive years ago
31%
Between three andf ive years ago
25%
Between two and three years ago
28%
Within the past year 16%
69%
Signif icant decrease(more than 20% lower) 0%
Moderate decrease(less than 20% lower)
3%
No change 16%
Moderate increase(less than 20% higher) 55%
Signif icant increase (more than 20% higher than f ive years ago)
26%
Base: All respondents.
Figure 2. When did you start implementing smart grid technologies in your company?
Figure 3. How will your company change its total investment (including internal resources) to develop and implement smart grid technologies in the next five years?
Note: Other drivers mentioned—government mandates, data analytics, reduce peak load, etc. Base: All respondents. Methodological note: Regional breakdowns shown in the survey results should be considered only high-level trends, given the limited regional sample size.*All drivers appeared among respondents’ top three.
Enhance environmental compliance
Maintain or improve power quality and reliability
Improve system economics
Increase customer choice
Maintain or enhance system reliability
20%
36%
48%
54%
61%
33%
50%
43%
57%
67%
10%
40%
63%
56%
56%
Top three drivers* Europe North America
Figure 4. What were the main drivers of your company’s decision to implement smart grid technologies?

7
Based on the top three drivers for smart grid implementation (identified in Figure 4), the utilities were surveyed about each driver’s relative importance and how priorities will change over the next five years (see Figure 5). Ninety percent of respondents state that the second driver, “increase customer choice” will gain significant importance as the driving factor behind smart grid implementations.
Additionally, economics and compliance issues will also lead the way as important drivers for smart grid implementations. Yet there was an even 50/50 split on how utilities perceive the emphasis on the need to “maintain or improve power quality and reliability,” perhaps implying that this is an important issue now, and would remain so.
Many smart grid benefits are still unrealized.
While utilities are ramping up their smart grid efforts, benefits realization is lagging behind investments. This is likely an indicator that the industry is still early in its stage of smart grid implementation. In response to a list of end results, respondents say they have yet to achieve all the benefits they expect from implementing smart grid technologies (see Figure 6).
Overall, a maximum one-third of respondents have achieved targeted results, such as “effective system protection and restoration” and “higher grid efficiency.” Beyond these two results, the rate of achievement drops off.
For example, we found that “enhanced transmission and distribution grid management” is a result all utilities seek, yet this benefit ranked as the top target that has not been achieved. According to our survey responses, only one-quarter have achieved it. Similarly, we also see “product and service innovation” scoring an achievement factor of just 14 percent and “effective demand response to reduce peak demand” representing a higher but still struggling achievement quotient of 19 percent.
...will remain stable ...will increase
Improve system economics
Maintain or improve power quality and reliability
Enhance environmental compliance
Increase customer choice
Maintain or enhance system reliability
36%
20%
48%
54%
61%
Top three drivers*
32%
50%
34%
41%
50%
10% 90%
66%
59%
68%
Base: All respondents.*All drivers appeared among respondents’ top three.
Figure 5. What were the main drivers of your company’s decision to implement smart grid technologies? Do you expect the importance of each driver to increase, decrease or remain stable in the next five years?
Optimized plug-in electric vehicle integration
Effective system protection and restoration
High system resiliency
Effective demand response to reduce peak demand
Optimum asset utilization
Higher grid efficiency
Deferral of capital expansion
High resiliency against natural disasters
Optimized bulk wind and photovoltaic integration
Reduced greenhouse gas emissions
Product and service innovation
Enhanced transmission and distribution grid management
33%
25%
30%
21%
19%
23%
14%
6%
16%
7%
23%
25%
64%
21% 65%
17% 60%
15% 66%
13% 66%
13% 57%
11%
55%
33%44%
39%
42%42%
50%43%
75%
64%3%
Base: All respondents.
Not targeted Targeted but not achieved yet Targeted and achieved
Figure 6. Which of the following results did you target and which did you achieve?

8
There are some regional differences as well.For the two regions illustrated in Figure 7, utilities are fairly consistent in their targeted (but not achieved) benefits, although a few exceptions stand out. While, in Figure 6, almost 90 percent of the surveyed utilities indicated that they targeted deferral of capital expenditures in their smart grid deployments, the regional results differ: Three-quarters of North American utilities have yet to realize their goals versus 44 percent of European utilities. Conversely, about 90 percent of the European respondents say they have yet to meet their goals around integrating renewable energies whereas, in North America, that number is only about a third. This likely demonstrates the difficulties associated with large-
scale deployment of renewable energies and integration in Europe, and possibly differing regional goals and the still early phase of adoption of smart grids.
67%50%
82%63%
67%67%
50%67%
Higher grid efficiency
67%67%Effective demand response to reduce peak demand
Optimized bulk wind and photovoltaic integration
Reduced greenhouse gas emissions
High resiliency against natural disasters 44%28%
50%22%
56%
89%33%
High system resiliency
Effective system protection and restoration
67%
Product and service innovation63%
71%
Optimized plug-in electric vehicle integration
44%
Enhanced transmission and distribution grid management
76%
56%72%
Deferral of capital expansion
Optimum asset utilization
Base: North America and Europe respondents.Methodological note: Regional breakdowns shown in the survey results should be considered only high-level trends, given the limited regional sample size.
EuropeNorth America
Figure 7. Results targeted but not yet achieved.

9
For all, there is a need for metrics that effectively track smart grid performance.While not a comprehensive global survey sample, the data may nonetheless reveal trends on the relative differences between North American and European utilities and how they have chosen and met particular goals. It also demonstrates the differences in challenges both regions face in their electrical grids. One thing that does not vary by region is the consensus among all respondents that it is important for utilities to have and use the metrics that help them accurately measure and manage the performance of their chosen smart grid technologies: All respondents say that doing so is “critical” or “important” to the success of their smart grid initiatives (see Figure 8).
As to the relative importance of metrics listed in Figure 9—utilities across all geographies indicate that objectives such as “demonstrate compliance with regulations/standards” and “monitor reliability” are the most critical ones. Among other leading objectives that respondents rate as either “critical” or “important” are the abilities to “monitor operational efficiency,” “analyze demand consumption” and “indicate potential risks.”
Not important at allNot really important
Important
Critical
0%0%
41%
59%
Base: All respondents.
100%
Figure 8. How important is it for your company to have metrics to measure and monitor the performance of smart grid technologies?
44%Monetize carbon emissions reductions 9% 3%44% 47%
63%
37%
16%
7%
3%
2%
28%
38%
41%
0%
0%
0%
2%Measure the emergence of new technologies(e.g., photovoltaics installed, EV penetration)
6% 53%Monitor reliability
13% 22%
Develop and analyze economic development indicators
63%
Demonstrate compliance with regulations/standards
13%
Monitor operational efficiency(e.g., call centers, system operations)
40% 40%
9%Indicate potential risks
66%16%
7% 53%
Analyze demand consumption 6% 56%
Important+ critical
85%
82%
47%
Base: All respondents.
94%
94%
91%
90%
Not important at all Not very important Important Critical
Figure 9. What is the importance of the following objectives for smart grid performance metrics?

10
Figure 10 compares how two regions rate the importance of various metrics. All European respondents say that to “measure the emergence of new technologies” such as photovoltaic and electric vehicle (EV) penetration is “critical” or “important,” while only two-thirds of North American respondents say the same. In addition, slightly less than half of European respondents say they strive to “monetize carbon emissions reductions” versus a third of North American respondents. It seems to imply that the “green” agenda is more prevalent in Europe than in North America (likely due to societal demand and/or government policy mandates).
Monetize carbon emissions reductions 44%33%
100%94%
Develop and analyze economic development indicators44%
47%
Measure the emergence of new technologies(e.g., photovoltaics installed, EV penetration) 100%
67%
94%100%
Indicate potential risks89%
100%
Analyze demand consumption
83%
Monitor operational efficiency(e.g., call centers, system operations)
89%100%
Monitor reliability
89%
EuropeNorth America
Base: North America and Europe respondents.Methodological note: Regional breakdowns shown in the survey results should be considered only high-level trends, given the limited regional sample size.
Demonstrate compliance with regulations/standards
Figure 10. Smart grid performance metrics objectives: “important” + “critical.”

11
Finding No. 2
While utilities are using metrics to measure smart grid performance, many could benefit from additional data and benchmarks to maximize the value of follow-on analysis.

12
Utilities can improve how they apply metrics to manage smart grid performance.Regarding the question: “To what extent do current metrics enable efficient monitoring of smart grid performance?”, the research shows significant room for improvement in how companies design and use metrics: Only 10 percent say that there is “no improvement required” and that they have all the information they need (see Figure 11). Slightly more than half of the respondents state that while they have “some information,” they require improvements to optimize smart grid performance management. About a third indicate that they either have limited information and “significant improvements are required to optimize smart grid performance management” or the metrics they have “do not enable smart grid performance management at all.” While this may be a clear indication that smart grids are now starting to emerge out of pilot phases, it also demonstrates that work on metrics is still needed to optimize the deployment of technology.
Most utilities already perform some data comparison and analysis across certain metrics. As one form of analytics, providers typically compare historical performance data in the areas of transmission, distribution, end-use customers, and societal impact (see Figure 12). As Figure 13 shows, about half of respondents always/systematically use metrics for predictive analysis, with distribution being the highest.
To a great extent–no improvement required/you have all the information you need
6%
27%
57%
10%
Base: All respondents.
To some extent–you have some information but improvements are required to optimize smart grid performance management
To a limited extent–you have limited information and significant improvements are required to optimize smart grid performance management
Not at all–the metrics you have do not enable smart grid performance management at all
Figure 11. To what extent do the current metrics designed and implemented in your company enable efficient monitoring of smart grid performance?
Base: All respondents.Methodological note: Respondent base varies depending on the sector segment(s) in which a given utility operates.
73%82%
62%67%
Distribution
11% 10%
22%7%
Often
Always/systematically
Transmission End-use customers
11%Rarely
Societal impact
17%
13%
25%
Figure 12. Metrics analysis performed: Comparison with historical performance.
DistributionTransmission End-use customers Societal impact
44%59% 51% 46%
22%
19%
Often
Rarely
Never
25%
21%28%
14%
Always/systematically
17%
7%
17%
22%8%
Base: All respondents.Methodological note: Respondent base varies depending on the sector segment(s) in which a given utility operates.
Figure 13. Metrics analysis performed: Forecast of performance using qualitative/quantitative.

13
Challenges to making better use of metrics stem from specific limitations.According to respondents, two of the most critical challenges for utilities that want to optimize smart grid performance through better metrics and analysis are (a) difficulty to access/collect information and (b) a lack of actual benchmark data. As Figure 14 illustrates, there are important challenges to realizing the potential of smart grid performance through better metrics and measurements. Respondents indicate they also lack tools and personnel to efficiently and effectively analyze information and that, when they do try to measure performance, there is a “lack of granularity in the measure.” All European
respondents cite as important or critical challenges both a “lack of sharing the information across the organization/lack of coordination” and a “lack of skills to design, implement and analyze the metrics.”
Relatively speaking, utilities seem less concerned about access to historical data, their ability to design proper metrics or the frequency with which they measure performance. Still, no less than half of respondents say they struggle with these issues as well. The message seems to be that significant upside potential exists for utilities to acquire information resources and improve focus in order to make effective use of metrics and measurements in support of better smart grid performance.
23%
31%
21%
21%
21%
17%
17%
19%
33%54%
Lack of manpower 7% 48%14%
Insufficient frequency in measuring 10% 34% 39%
Lack of skills to design, implement and analyze the metrics
7% 33%
66%
Lack of historical data 10% 28% 41%
Lack of sharing the information across the organization/lack of coordination
7% 21% 51%
Lack of granularity in the measures 7%
3%
51%
Lack of efficient tools/technologies to analyze the information
17% 57%
43%
Lack of benchmark data to analyze performance 15%
Difficulty to access/collect the information 13%
21%
Base: All respondents.
Considered as a critical or important challenge by all the respondents in Europe
Considered as a critical or important challenge by all the respondents in Europe
Not important at all Not very important Important Critical
Figure 14. What is the importance of the following challenges that your company is facing to optimize smart grid performance metrics?
“As an industry, we’re installing, we’re making progress, but we really haven’t seen a forum or enough knowledge sharing yet to be able to quantify leading practices and then start to benchmark against those leading practices.”Wade Malcolm, global senior director, Smart Grid Operational Technology

14

15
Metrics inventory

16
Utility executives were asked several questions about metrics in the areas of distribution, end-use customers, systems and societal impacts.
• What metrics they use to measure performance in a given segment or area
• When they measure performance of each segment/area—frequency
• How they apply metrics and measure performance—level of granularity
• Who is in charge of analyzing performance in a given segment/area
Distribution system metricsAs Figure 15 shows, nearly 80 percent of respondents indicate they track distribution reliability and power quality indices—perhaps due to mandates from regulators. For example, in North America, there are more than 35 state utility commissions requiring reliability reporting, with varied degrees of complexity. Many commissions have set reliability targets that utilities are
expected to achieve, and with the trend toward more distribution companies being required to meet reliability targets, the expectation is that use of these metrics in particular will see an upward trend. Solid historical information relating to system performance, operational equipment performance and cost is necessary to achieve sound reliability decisions.
Behind the reliability-driven metrics is the group of metrics tracking the breadth of distribution automation (DA). The top DA tracked metrics, not surprisingly, measure penetration of “smart grid-enabled switches/reclosers/capacitor banks,” as these have been among the first DA applications. Following those are other DA metrics such as “distributed generation on the system,” “distribution circuits that have Volt/Var control,” “distribution assets with real-time condition monitoring diagnostics” and “customers connected per automated circuit.”
The importance of DA metrics is expected to increase with smart grid investments in the distribution and transmission systems.
New DA technologies are expected to be adopted at a large scale to make distribution systems more controllable and flexible based on accurate data for decision-making applications through more intelligent sensors, processors and fast communications to remotely monitor and coordinate distribution assets. Such technologies are sought to dynamically control voltage and reactive power that can offer important power efficiency improvements—better power quality and faster outage detection and restoration. It is of interest to note that presently half of the respondents do not use metrics to track energy storage.
The measurement frequency for distribution performance metrics varies from metric to metric: slightly more than 80 percent of respondents say they measure “reliability and power indices” more often than once per year (again perhaps due to regulatory mandates). Conversely, they typically measure the “percentage of energy storage devices” on the system with the least frequency (see Figure 16).
No
Yes
Improvements in reliability and
power indices
Percentage of companies using metrics
Note: Additional detailed answers included—reduction of losses, kW and kWH reduction; various programs to move energy from off-peak to peak; reliability and maintenance matrix focused on customer outage impacts; transformers; SAIDI, SAIFI, CAIDI; feeder DC query; and operational cost savings due to smart grid technology.Base: All respondents.Methodological note: Respondent base varies depending on the sector segment(s) in which a given utility operates.
79%
11%
67%
20%
Percentage of smart grid-
enabled switches/reclosers/
capacitor banks
30%
57%
Percentage of distributed generation
on the system
57%
30%
Percentage of distribution circuits that
have Volt/VAR controls
53%
37%
Percentage of distribution assets
with real-time condition
monitoring and diagnotics
46%
39%
Percentage of customers
connected per automated circuit
50%
33%
Percentage of energy storage
devices
Reliability driven Distribution automation (DA) driven
Figure 15. Can you indicate the metrics related to distribution that you are using?

17
Improvements in reliability and
power indices
More often
Less oftenAnnually
Percentage of distribution circuits that
have Volt/VAR controls
11%
28%
61%
n=17
n=21
Percentage of distributed generation
on the system
17%
39%
44%
n=17
Percentage of distribution assets
with real-time condition
monitoring and diagnotics
18%
24%
59%
n=16
Percentage of smart
grid-enabledswitches
/reclosers/ capacitor banks
38%
10%
52%
n=20
Percentage of energy storage
devices
64%
18%
18%
n=10
Percentage of customers
connected per automated circuit
17%
8%
75%
n=12
Base: All respondents. Methodological notes: Respondent base varies depending on the sector segment(s) in which a given utility operates; n= number of respondents per metric.
81%
19%
Reliability driven Distribution automation (DA) driven
Figure 16. For the different distribution metrics you are using, please indicate whether you measure them on an annual basis or more/less frequently.
Aggregated by region 19%
Aggregated by customer class
3%
Aggregated by substation
19%
For each circuit 59%
Base: All respondents.Methodological note: Respondent base varies depending on the sector segment(s) in which a given utility operates.
Figure 17. With what granularity do you measure the majority of metrics related to distribution?
Customer service department 31%
Maintenance department 31%
Outage center department
45%
Planning department 66%
Operations department
Base: All respondents.Methodological note: Respondent base varies depending on the sector segment(s) in which a given utility operates.
66%
Figure 18. Thinking of the key metrics related to distribution, who in your organization is responsible for analyzing these metrics?
In terms of the granularity with which utilities track and report on the proposed distribution metrics, more than half of respondents say they measure and manage smart grid performance metrics for each circuit, while nearly two out of five respondents measure smart grid distribution performance aggregated by substation or region (see Figure 17). Again, the mandated reliability reporting can explain these results as reliability reporting, which granulates down to the feeder (worst performing feeder) level in most cases.
As Figure 18 shows, the typical owner for tracking and managing smart grid performance metrics around distribution varies from “operations” and “planning” departments to the “outage center” department. Respondents also mention the “maintenance” and “customer service” departments.
18
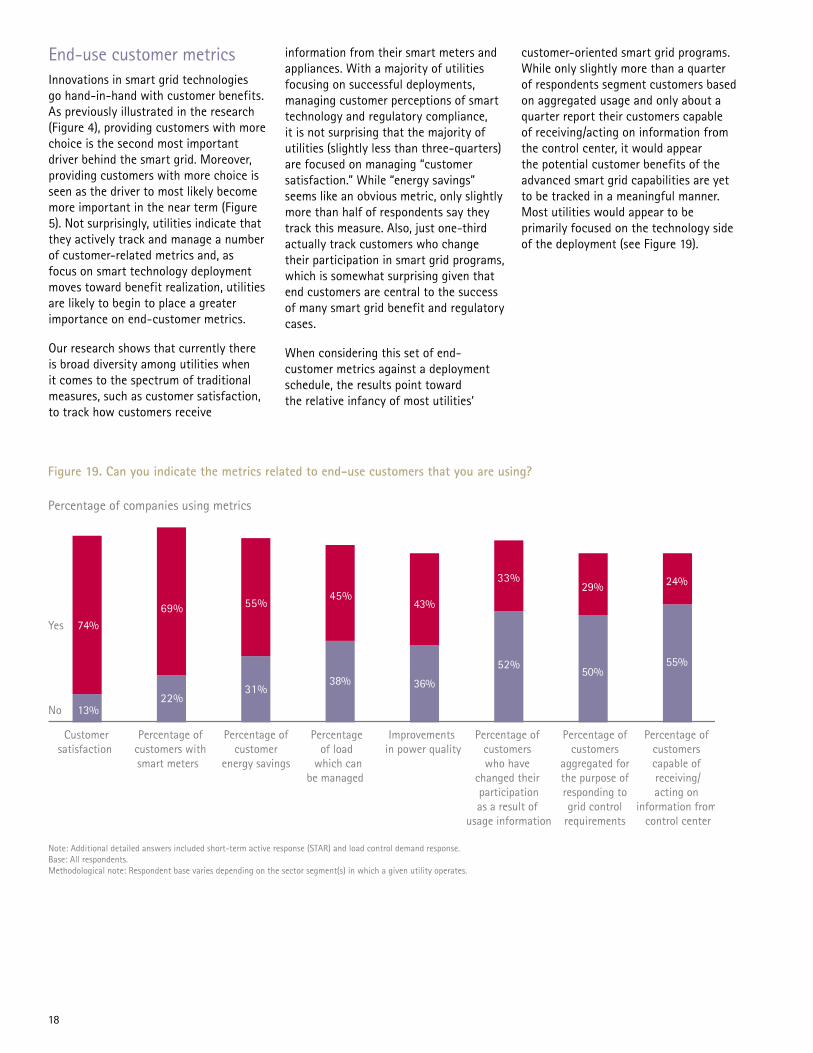
End-use customer metricsInnovations in smart grid technologies go hand-in-hand with customer benefits. As previously illustrated in the research (Figure 4), providing customers with more choice is the second most important driver behind the smart grid. Moreover, providing customers with more choice is seen as the driver to most likely become more important in the near term (Figure 5). Not surprisingly, utilities indicate that they actively track and manage a number of customer-related metrics and, as focus on smart technology deployment moves toward benefit realization, utilities are likely to begin to place a greater importance on end-customer metrics.
Our research shows that currently there is broad diversity among utilities when it comes to the spectrum of traditional measures, such as customer satisfaction, to track how customers receive
information from their smart meters and appliances. With a majority of utilities focusing on successful deployments, managing customer perceptions of smart technology and regulatory compliance, it is not surprising that the majority of utilities (slightly less than three-quarters) are focused on managing “customer satisfaction.” While “energy savings” seems like an obvious metric, only slightly more than half of respondents say they track this measure. Also, just one-third actually track customers who change their participation in smart grid programs, which is somewhat surprising given that end customers are central to the success of many smart grid benefit and regulatory cases.
When considering this set of end-customer metrics against a deployment schedule, the results point toward the relative infancy of most utilities’
customer-oriented smart grid programs. While only slightly more than a quarter of respondents segment customers based on aggregated usage and only about a quarter report their customers capable of receiving/acting on information from the control center, it would appear the potential customer benefits of the advanced smart grid capabilities are yet to be tracked in a meaningful manner. Most utilities would appear to be primarily focused on the technology side of the deployment (see Figure 19).
Yes
Percentage of customers capable of receiving/acting on
information from control center
Percentage of customers
aggregated for the purpose of responding to grid control
requirements
Percentage of load
which canbe managed
Percentage ofcustomer
energy savings
Improvements in power quality
Percentage of customers who have
changed their participationas a result of
usage information
Customersatisfaction
36%
13%
74%
No
Percentage ofcustomers withsmart meters
Percentage of companies using metrics
Note: Additional detailed answers included short-term active response (STAR) and load control demand response.Base: All respondents.Methodological note: Respondent base varies depending on the sector segment(s) in which a given utility operates.
43%
36%
13%
74%
55%
24%29%
50%
22%
69%
31%
55%45%
38%52%
33%
Figure 19. Can you indicate the metrics related to end-use customers that you are using?

19
No one metric stands out as a leading measure that providers track regularly (more than once a year), and relatively few respondents actually track any metric more than annually, as Figure 20 illustrates. Again, these results appear to affirm the infancy of most smart grid deployments and benefits realization around end customers. Moreover, customer operations have not traditionally seen as much investment in more advanced analytics capabilities as other areas of business to effectively manage data and provide insight. With the rising emphasis on the customer, we may begin to see a shift in the frequency of these metrics over time, as utilities begin to implement advanced programs and products to support micro-generation, electric vehicles and real-time pricing.
Percentage of customers capable of receiving/acting on
information from control center
Percentage of customers
aggregated for the purpose of
responding to grid control requirements
Percentage of load
which can be managed
Percentage ofcustomer
energy savings
Improvements in power quality
Percentage of customers who have
changed their participation as a
result of usage information
Customer satisfaction
Percentage ofcustomers withsmart meters
59% 67% 62% 64%55%
89%
56%
86%
27%24% 38%
22% 36%
11%
22%
Less often
Annually
14% 9% 14% 9%More often 22% 14%
Base: All respondents.Methodological notes: Respondent base varies depending on the sector segment(s) in which a given utility operates; n= number of respondents per metric.
n=22n=21 n=16
n=14
n=11
n=9 n=9 n=7
Figure 20. For the different end-use customer metrics you are using, please indicate whether you measure them on an annual basis or more/less frequently.

20
As one might expect, the majority of respondents tend to measure customer metrics by customer class over other measures, such as by circuit, substation or region (see Figure 21). It appears that a portion of the utilities surveyed do measure customer metrics at a more granular level. This may be due in part to the rollout of more advanced customer programs and products, or may be an effort to manage the grid more effectively by understanding customer metrics at the circuit and substation level (for example, advanced outage management or demand response).
Although the customer service department serves as the lead analysis owner of end-use customer metrics around smart grid performance (see Figure 22), other departments such as “operations” and “marketing” are nearly as responsible (both at slightly less than half). In about one-third of cases, respondents report that they use an “energy-efficiency” department to track smart grid performance metrics around the customer. These metrics highlight the ongoing challenge in the deployment of smart grids: Who owns performance around the end customer, and who must act upon the findings? The results illustrate a mixed approach across the respondents highlighting the absence of any true leading practice. As utility smart grid benefit cases range from grid optimization to provisioning for the new energy customer, it is apparent that depending on utility organization design, a great many areas are charged with analyzing the end customer. Whatever the business case may be for a utility, the fact remains that most utilities have many, if not all, of the departments listed in Figure 22. What is critical to success is the distribution and effective dissemination of customer metrics between departments to ensure a holistic approach to engaging customers and providing next-generation customer choice.
Transmission system metricsThe survey covered metrics associated with deployments and use of phasor measurement units, real-time monitoring, energy storage and dynamic ratings on transmission systems. If desired, such results can be obtained from Accenture.
For each circuit 19%
7%
Aggregated by region
Aggregated by substation
11%
63%Aggregated by customer class
Base: All respondents.Methodological note: Respondent base varies depending on the sector segment(s) in which a given utility operates.
Figure 21. With what granularity do you measure the majority of metrics related to end-use customers?
Customer service department
45%
52%
Energy-efficiency department
31%
Planning department
31%
Marketing department 45%
Operations department
Base: All respondents.Methodological note: Respondent base varies depending on the sector segment(s) in which a given utility operates.
Figure 22. Thinking of the key metrics related to end-use customers, who in your organization is responsible for analyzing these metrics?

21
Operational and societal impact (nonoperational) metricsOperational benefits include improved economics, such as reductions in operations and maintenance costs. Presently, such savings in operations and maintenance costs are mapped to savings in distribution systems and to advanced metering infrastructure (AMI) and associated customer systems.
Societal impact (nonoperational) benefits refer to benefits other than the operational savings of the smart grid. A number of the societal impact benefits result from actions undertaken by customers in response to communication from the utility. Smart metering is an enabler for some societal impact benefits, but it does not assure that these benefits are actually realized. Other societal benefits are independent of the user and are only related to what the utility does, such as the reduction in carbon emissions from reducing transmission and distribution losses.
Societal impact benefits may be obtained directly or indirectly due to factors such as:
• Increased customer choices on how and when to consume electricity and from what source.
• More accurate bills and account servicing and possible savings on electric bills.
• Service quality enhancements that may reduce the duration of outages.
• More equitable rates.
• Better utilization of scarce societal resources and a decrease of the carbon footprint.
• More robust electricity markets.
The demarcation between operational and societal impact benefits is not always clear. While a metric tracking the penetration of renewables fits more on the societal side, another tracking greenhouse gas (GHG) emissions may find a home on both sides: Less
GHG released is a societal impact benefit, while abatement of GHG is an operational cost. The same applies to the number of power interruptions: The issue of fewer interruptions is a societal impact benefit, but the utility cost associated with the interruptions is an operational cost. Conversely, while operations and maintenance costs are operational issues, savings in these areas can reflect in a societal benefit of lower electric bills. Hence, a true “demarcation line” between operational and societal metrics is not possible for the metrics we gathered in our research and, therefore, we illustrate this with a dashed line in Figures 23 and 24.
Figure 23 suggests the utilities polled in our research are all likely to use the metrics we inquired about, with more emphasis on the operational metrics.
Figure 24 shows the frequency of using the metrics shown. From that figure, it is interesting to note that almost two-thirds of the respondents measure operational and maintenance costs less often than annually.
Base: All respondents.Methodological note: Respondent base varies depending on the sector segment(s) in which a given utility operates.
Lower operational and maintenance
costs
No
Yes
18%
75%
Operational impact metrics Societal impact (nonoperational) metrics
18%
75%
Percentage (or tons) in greenhouse gas emissions decrease
Fewer and lower costs for interruptions
21%
68%
Percentage of renewable generation percentage or standard
32%
57%
36%
54%
Figure 23. Can you indicate the metrics related to societal impact that you are using?
Figure 24. For the different societal impact metrics you are using, please indicate whether you measure them on an annual basis or more/less frequently.
Operational impact metrics Societal impact (nonoperational) metrics
Base: All respondents.Methodological notes: Respondent base varies depending on the sector segment(s) in which a given utility operates; n= number of respondents per metric.
65% 72%
40% 36%
30% 22%
53%43%
Less often
Annually
More often 5% 6% 7%21%
n=20 n=18
Lower operational and maintenance
costs
Fewer and lower costs for
interruptionsn=15
Percentage of renewable generation percentage or standard
n=14
Percentage (or tons) in
greenhouse gas emissions decrease

22
The subject metrics and measures are the least granular, as slightly more than half of respondents track them at the regional level, and almost a third by customer class. The less granularity for societal impact metrics versus other types of metrics may be due more to the fact that, by definition, such metrics lend themselves best to people or groups (regions, customers) versus any sort of hardware, such as a circuit (see Figure 25).
Responsibility for these metrics is fairly evenly split among “operations,” “planning” and “marketing” departments. Such metrics do not fall under the finance function (compliance) or the corporate sustainability group (see Figure 26).
Base: All respondents.Methodological note: Respondent base varies depending on the sector segment(s) in which a given utility operates.
52%
Aggregated by customer class 31%
Aggregated by region
Aggregated by substation
4%
For each circuit 13%
Figure 25. With what granularity do you measure the majority of metrics related to societal impact?
Base: All respondents.Methodological note: Respondent base varies depending on the sector segment(s) in which a given utility operates.
Marketing department
35%
27%
Operations department
Planning department
38%
Figure 26. Thinking of the key metrics to measure societal impact, who is responsible in your organization for analyzing these metrics?

23
Implications for utilities

24
Smart grid pilots and deployment activities involve substantial investments in the purchasing and installation of devices and systems. Given such sizeable investments as well as the great potential of the smart grid, there is a need for a fair, consistent set of metrics to measure progress, performance and value of the same. Additionally, many smart grid projects (pilots as well as full-scale implementation) could benefit by finding additional improvements from enhanced monitoring of key performance indicators, further emphasizing the need for fair and objective metrics. Metrics suitable for the smart grid are measurements of key parameters linked to design, installation, planning, operation, maintenance or customer outreach aspects of the smart grid transition. While the research for this survey not does reflect the complete picture on smart grid metrics, it does establish some foundational information needed for developing a framework for defining them.
The metrics used for this survey were partly based on those identified by the U.S. Department of Energy (DOE) smart grid workshops1 and documents on smart grid success factors. Other metrics were introduced by Accenture to contrast regional situations, trending characteristics or other traits of the metrics.
Using DOE’s terminology, the metrics can be categorized as “build” and “impact.” A subset of the impact metrics can be identified to as “value” metrics.
Build metricsBuild metrics measure progress during the implementation of smart grid assets. A number of build metrics were identified during the DOE Smart Grid Metrics Workshop, held June 19-20, 2008.2 These metrics are aimed at monitoring progress in building out the smart grid. Build metrics are tailored to individual utilities and their expected benefits from the smart grid. Metrics could include the number of smart meters installed, substations automated and dynamic pricing programs offered.
Build metrics are best detected in a cumulative manner when possible, with baseline data identified. A number of build metrics were used in this survey.
Impact metricsImpact metrics measure the impact, change or response of the grid and all its associated assets (including systems, equipment and human resources) as well as the impact on customers as a consequence of the deployed smart grid systems. Impact metrics measure how and to what extent a smart grid is affecting grid operations and performance, or how it is enabling customer programs and behavior changes. Some examples of impact metrics include: peak demand reductions, tons of GHG reduced, maintenance cost avoided and number of outage minutes per year in a given area.
RecommendationsAs metrics in general rely on data from various sources, it will be increasingly critical to understand all data sources within the company, while also utilizing tools to build metrics from multiple data sources. For example, equipment data is typically stored in an asset management system and the performance of this equipment might be an output of the supervisory control and data acquisition (SCADA) system. Linking these data sources could possibly provide significant value for a utility, as such linkage gives an excellent source of performance comparison of various assets.
Some level of detail should be provided to describe the basis of the metric. This would require describing what smart grid assets, integration activities and smart grid functionalities have been assumed. System-level metrics should include the number of new smart grid assets as well as assets already installed on the system. For example, if a project installed 100 automated feeder switches and there were already 300 automated feeder switches installed on the distribution system prior to the smart grid program, both should be identified in the metric description.
It would be beneficial for utilities to establish teams dedicated to metrics and performance measurement—it could prevent and overcome the “silo thinking” of some utilities’ experience. Only if multiple parties and departments are part of performance metrics would utilities fully benefit and learn from metric application.
Finally, barriers related to the transition to smart grids exist. These include:
• Lack of clear frameworks and roadmaps.
• New stakeholders and their different views and needs.
• Technical barriers in development and rollout of equipment and systems.
• Different stakeholder views on monitoring and controlling the smart grid processes.
• Dependencies between information in different layers, and issues such as:
- Higher layers for business applications - Lower layers for technical infrastructure
While this survey did not collect responses related to such challenges, identifying and tracking such challenges in a structured approach is essential for adeptly managing and ultimately overcoming them to pave the road for a smooth smart grid transformation.
“Effective applications of metrics for performance monitoring of the smart grid depend on the choice of the correct parameters, the continuous monitoring of those parameters and an understanding of the associated targets or goals.”
Nicholas Abi-Samra, senior manager, Accenture Smart Grid Services
1 Smart Grid, U.S. Department of Energy, Office of Electricity Delivery and Energy Reliability, http://energy.gov.2 Metrics for Measuring Progress toward Implementation of the Smart Grid, Results of the Breakout Session Discussions at the Smart Grid Implementation Workshop, U.S. Department of Energy, Office of Electricity Delivery and Energy Reliability, June 19-20, 2008, Washington, DC, http://energy.gov.

Summary of metrics objectives:• Assess smart grid projects against vision and roadmap objectives
• Provide data to assist in monitoring and reporting on the effective use of smart grid funding
• Support the process for achieving stakeholder buy-in
• Keep smart grid projects on track and provide a means to project future progress
25
Smart grid metrics help with:• Establishment of baseline for target setting
• Identification of successes and opportunities for improvement
• Initiation of corrective action to address problems identified by trends
• Alignment among stakeholders
• Benefits valuation and realization

26
There is no single version of a smart grid. Therefore, the drivers for implementation and the success factors of deployment vary widely and are largely dependent on government policies and technical needs.
Utilities around the globe are investing significant resources in the deployment of smart grid technologies. Successful utilities will not be those that invest the most, but those that invest most effectively in smart grid technologies, while at the same time reaping the multiple benefits that arise from modern smart grids.
The fact finding and decision making regarding which technology to apply and which is most beneficial to a utility relies on the deployment of standardized, multidiscipline, multisource metrics that measure the impact of the installed technology in terms of improvement to end customers, the utility and society as a whole.
Selection of specific smart grid metrics should be performed carefully, as the monitoring and communication of metric results will influence the behavior of stakeholder groups over time and the direction and speed of the smart grid evolution.
Conclusion

27

Copyright © 2012 Accenture All rights reserved.
Accenture, its logo, and High Performance Delivered are trademarks of Accenture. 02-3617 / 11-2359
About AccentureAccenture is a global management consulting, technology services and outsourcing company, with more than 244,000 people serving clients in more than 120 countries. Combining unparalleled experience, comprehensive capabilities across all industries and business functions, and extensive research on the world’s most successful companies, Accenture collaborates with clients to help them become high-performance businesses and governments. The company generated net revenues of US$25.5 billion for the fiscal year ended Aug. 31, 2011. Its home page is www.accenture.com.
About the Accenture Utilities industry groupThe Accenture Utilities industry group has more than 30 years of experience working with electric, gas and water utilities worldwide. Our group works with more than 200 utilities in over 30 countries and has 10,000 people supporting our utilities clients. We work with 80 percent of businesses with utilities in their portfolio on the 2011 Global Fortune 500 list. The Accenture Utilities industry group brings deep industry knowledge, world-class capabilities, leading-edge technology and innovation to our clients to help them raise their performance to new heights.