Embed Size (px)
Citation preview
sustainability
Article
Unlocking the Potential of Agribusiness in Africathrough Youth Participation: An Impact Evaluation ofN-Power Agro Empowerment Program in Nigeria
Adewale M. Ogunmodede 1,2,3,* , Mary O. Ogunsanwo 4 and Victor Manyong 2
1 Department of Agricultural Economics, Faculty of Agriculture, University of Ibadan, Ibadan 900001,Oyo State, Nigeria
2 International Institute of Tropical Agriculture (IITA), Plot No 25 Mikocheni Light Industrial Area,Mwenge-Coca-Cola Road, Mikocheni B, Dar Es Salaam 34441, Tanzania; [email protected]
3 Centre for Agriculture and Bioscience International, Egham 01784, UK4 Department of Agricultural Economics, College of Agricultural Sciences, Olabisi Onabanjo University,
Ago-Iwoye 11105, Ayetoro Ogun State, Nigeria; [email protected]* Correspondence: [email protected]; Tel.: +44-744-8476-207
Received: 30 April 2020; Accepted: 11 July 2020; Published: 16 July 2020�����������������
Abstract: In a country of about 200 million people, the government has over the years constitutedvarious initiatives to address the issue of unemployment, food security, and youth involvement inagriculture. However, the impact of these initiatives has been minimal due to the inconsistency ingovernment policies, changes in government, inadequate implementation mechanism amongst others.This study, therefore, evaluated the impact of the N-power Agro Program on youth employment andincome generation through agribusiness in Nigeria. Six hundred and forty-five respondents wererandomly selected from the database of N-Power. Structured questionnaires were used in obtainingthe data. The statistical analysis of collected data applied descriptive methods, logistic regressionmodel, and regression discontinuity design. The value of ATE of the regression discontinuitydesign of the income of the participants of N-Power Agro is greater by N30,191.46 than for thenonparticipants. The result of the logistic regression model shows that age, level of education, yearsof agribusiness experience, and employment status significantly influenced the choice of creatingemployment through agribusiness and of participating in the N-Power Agro program. The impactof the N-Power Agro program for Nigeria’s young men and women on employment and incomegeneration for participants was shown to be effective and positive with the RDD recording an increasein the beneficiaries’ income and a discontinuity in the design. Upscaling this program and widerimplementation in other countries in collaborations with youth, rural communities and private sectorswill ensure that the government can bridge the skills deficit in Africa’s youth, develop their capacitiesfor entrepreneurship, and hence, increase jobs creation.
Keywords: youth unemployment; entrepreneurship; aspirations of youth; access to resources; highereducation; rural development; training and skills development; sustainability and food security
1. Introduction
Africa’s young people are faced with a major socioeconomic problem of unemployment [1] despitebeing home to the youngest and most quickly growing population in the world. There are over 330million people aged between 15 and 30 years, with about 195 million currently living in the ruralareas [2], and 60%–70% of the population is below 30 years [3]. According to the United Nations, theyouth are individuals within the age group of 15 to 24 years [4]. However, the National Policy onYouth Development in Nigeria defines the youth as individuals within the age group of 18 and 35
Sustainability 2020, 12, 5737; doi:10.3390/su12145737 www.mdpi.com/journal/sustainability

Sustainability 2020, 12, 5737 2 of 18
years [5]. Since many of these young African men and women resides in rural areas, they tend to havelimited opportunities for gainful employment [6]. Nevertheless, they have unexploited potentials totransform the agricultural sector through their youthfulness, innovation, and entrepreneurship [7].
Nigeria is a paradigm of widespread youth unemployment which has been a central issue to theeconomy, particularly as it relates to policies in agricultural transformation. The youth unemploymentposes grave economic and social problems and requires urgent attention since the youth are the engineroom that propels any society to greater heights [8]. This worrisome situation has led to severaldebates that have focused on the impacts of various patterns of structural changes in economieson the creation of jobs. Despite the various interventions by successive governments’ in reducingthe unemployment rate, the percentage remains high [9] and as at the third quarter of 2018, theunemployment rate rose to 23.13%, up from 21.1% in 2010; while the youth unemployment rate stoodat 55.4% [10]. Since about 60% of the 200 million population being youth, and of which 55.4% ofthem are unemployed/underemployed; youth unemployment remains a challenge up until today [11].Against this backdrop, agribusiness is seen as a good strategy out of this problem, since with increasedinvestment and adequate policies, agribusiness and agricultural programs hold considerable potentialto provide opportunities for gainful employment for the teeming Nigerian youth [12], and a few studies,such as Abioye and Ogunniyi; Lyocks et al.; Muhammad-Lawal et al.; Yunusa and Giroh [12–15]have investigated the role of agribusiness in employment generation for the youth. Although they allassert that the participation of the youth in agribusiness would create more employment and reducepoverty among them, none has been able to evaluate the impact of existing agricultural programs onemployment creation among young people in Nigeria. Surprisingly, there is a dearth of evidence onwhat worked and what did not work well, making it difficult to make informed evidence-based policies.
To improve rural livelihood, provide employment (including youths) and ensure food security, theNigerian government has over the years came up with different initiatives for agricultural development.Between 1985 and 2019, they introduced the small-scale industry and youth employment schemes underthe Directorate of Food, Road, and Rural Infrastructure (DFRRI), National Directorate of Employment(NDE), [16], and Youth Enterprise with Innovation in Nigeria referred to as YouWIN. DFRRI wasestablished in 1985 to reduce rural-urban migration and poverty among the youth, but inconsistency inpolicy and inadequate involvement of rural farmers and young adults hampered the program [17,18].While certain achievements were visible, others are contestable, depicting that DFRRI was a mixedbag of failure [17]. According to Ejue [17], DFRRI eventually collapsed and died a natural deathfrom the lack of a culture of continuity in government policies and programs. The NDE establishedin 1986 provided micro-credit to participants to start a project of their choice as well as to becomeself-employed [16]. Similarly, in 2001, the New Nigeria Agricultural Policy was enacted. The mainaims of this program were self-sufficiency in the basic food supply, attainment of food security byintroducing improved seeds and recognition of the potentials of youth and small-scale farmers asthe main food producers [19]. Although a major part of this policy was in favor of the youth andsmallholders, there is no literature capturing the evaluation after the expiration of the policy. Also, thesubsequent introduction of the Agricultural Transformation Agenda (ATA) policy in 2011 to addressthe problems not tackled by past policies shows that the problems are still in existence and there isstill much more to be achieved. Despite the restructuring objectives of the ATA policies, a high rate ofyouth unemployment still exists. There is a high level of importation of agricultural products, withfood insecurity still at its peak [20]. Some other programs were the National Economic Empowermentand Development Strategies (NEEDS), National Special Program for Food Security (NSPFS), andGrowth Enhancement Support Scheme (GESS) [21,22]. While Yami et al. [23] opine that governmentsand development partners have implemented various interventions to inspire the youth to engage inagribusiness, agriculture in Nigeria has not received substantial support from the government becausethe country has failed to achieve the 10% minimum budgetary allocation to agriculture followingthe Mozambique Maputo declaration in 2014 [12]. This hints at the lack of support for young peoplesince they are the drivers of the economy. To reverse this trend, the federal government of Nigeria

Sustainability 2020, 12, 5737 3 of 18
(FGN) introduced N-Power as one of the National Social Investment Programs (NSIP) in 2016 which iscurrently still running.
This study, therefore, attempts to examine the impacts of the N-Power Agro Program on creatingemployment and improving income through agribusiness for the Nigerian youth. The program focusedon improving the economy through training and creating employment opportunities for youth inNigeria [24]. In this paper, after the introductory section, the next section discusses the empiricalreview of the N-power program. It is followed by the section on materials and methods. The fourthsection is on results and their discussion. The article ends with a conclusion and recommendations.
2. Empirical Review
2.1. N-Power Program
N-Power program or N-Power, in short, is a part of the federal government of Nigeria’s (FGN)Development Plan 2015–2020. N-Power is the largest post-tertiary jobs program in Africa which iscoordinated by the Office of the Vice President [25]. As an arm of the NSIP, it is designed to createjobs and empower Nigerians between the ages of 18 and 35 years. With the average age of farmers inNigeria placed at 50-60 years, the government strategically targets young people with this initiativeto encourage their participation in agriculture and agribusiness; this is because the present state ofdecline in agriculture production is dimming the hope of attaining the vision of food security by 2050.This program, therefore, aims at equipping young men and women with the skills and experiencenecessary to improve their employability and entrepreneurial potentials. Its modus operandi isbased on learn–work–entrepreneurship (LWE) [24]. This is created to helping them in acquiring anddeveloping a life-long skill needed to become solution providers in their communities and vital playersin the National and International markets. The core policy thrust of the N-Power Program is large-scaleskill development. This program is linked to the government’s policies in the economic, employmentand social development arenas. It is aimed at addressing the challenges of youth unemploymentby providing a structure for large-scale and relevant acquisition and development of work skillswhile linking its core and outcomes to fixing inadequate public services and stimulating the largereconomy [24]. With the empowerment program, the Nigerian government desires to tackle theunemployment challenge while also integrating the youths in agricultural activities. The modularprograms under N-Power ensured that each participant learned and practiced most of what is necessaryto find or create work. The N-Power volunteer corps involved a wide-scale deployment of 500,000trained graduates who are assisting in improving the inadequacies in the public services in agriculture,education, health, and civic education. Some of these graduates have been helping in bringing toaction Nigeria’s economic and strategic aspirations of achieving food security and self-sufficiency andalso working as a platform for diversifying the economy. N-Power is preparing young Nigerians for aknowledge economy where equipped with world-class skills and certification, they become innovatorsand movers in the domestic and global markets. Nigeria will have a pool of software developers,hardware service professionals, animators, graphic artists, building services professionals, artisansand others [26]. It also focuses on providing non-graduates with relevant technical and business skillsthat enhance their outlook for work and livelihood. Following the wide acceptance of the program, itcurrently runs across Nigeria’s 36 States and the FCT. By the last quarter of 2018, the N-Power programhad successfully empowered over 500,000 young men and women nationwide and also currently rolledout applications to empower another 400,000 youth by July 2020. This success was largely attributedto efficient coordination [27]. Operationally, these N-Power volunteers are paid a monthly stipendof N30,000 and given mobile devices with relevant content for continuous learning to facilitate theirability to successfully implement their selected vocation while enabling them to take ownership oftheir lives.

Sustainability 2020, 12, 5737 4 of 18
2.2. N-Power Agro Program
N-Power Agro volunteers who form part of the 500,000 N-Power Corps participants are trainedto provide support and advisory service to farmers across the country by way of disseminating therequired knowledge in the area of extension services as well as gathering data of Nigeria’s agriculturalassets. They have been acting as intermediaries between the farmers and the Research Institutions.They operate as facilitators and communicators, helping farmers in their decision-making and ensuringthat appropriate knowledge is implemented to obtain the best results on farms [28]. N-Power Agroprogram is vital to empowering the youth since many of the youths involved in agriculture duringthe production season often tend to take non-farm jobs to ensure stable income during the off-season,hence the need for an intervention program that will ensure that youths are actively involved inagriculture all year round in order to achieve food security [18]. Therefore, it is one of the waysthat the FGN planned to diversify the economy towards attaining self-sufficiency in continuous foodproduction for the country. Furthermore, an effective and well-coordinated agricultural extensionsystem is seen as vital to the attainment of sustainable national food self-sufficiency. To establish thissystem, FGN engaged qualified young Nigerians through the N-Power Agro program in December2016. N-Power Agro relies on the use of technology as the country aspires to identify soil types,farm sizes, and irrigation data, and ensure that our farmers are operating optimally. By March 2017,N-Power Agro volunteers started to function as intermediaries between research and farmers afterthey had undergone induction training before deployment. Moreover, participants also benefited froma compulsory development program for employability and entrepreneurship skills. Although thegovernment aimed at the attainment of sustainable national food self-sufficiency through the N-PowerAgro volunteers, they also will build the participants for a long-life career around agriculture or inallied fields with destinations such as Agricultural extension services consultant, seeds, fertilizers,and other input aggregators, farm managers, public sector jobs in agriculture, various industries andmanufacturers of agricultural products, farming cooperatives management, pest control companies,self-employment or working as a farming consultant [28].
3. Materials and Methods
3.1. Study Area
The study was conducted in southwestern Nigeria. Our targeted population was the N-PowerAgro applicants from southwestern Nigeria (Oyo, Ogun, and Lagos States). These states wereselected based on their similarities in terms of regional agricultural engagements and also have a fairrepresentation of larger youth covered by the program.
3.2. Sampling Procedures and Types of Data/Analytical Techniques
The data for this study were collected using a well-structured pre-tested questionnaire and theN-Power administrative dataset (which contains contact details of applicants and the sampling frame ofparticipants and non-participants). Data were collected on socio-economic characteristics of the youth,mobilization strategies using ICT, incomes, benefits and constraints on mobilization under the N-PowerProgram. Our targeted population was N-Power Agro applicants from southwestern Nigeria (Oyo,Ogun and Lagos States). Two-stage cluster sampling techniques were employed for data collectionfor this study. The first stage involved dividing each State into three agricultural zones/clusters. Thesecond stage involved a random selection of N-Power participants and nonparticipants from the nineclusters/villages using probability proportional to size (i.e., more individuals were selected in largervillages). This sampling procedure resulted in a sample size of 645 individuals, 345 participants and300 nonparticipants. It is important to note that to ensure uniformity, we sampled both participantsand nonparticipants that share similar characteristics in terms of sex, age, educational level and income.The survey was carried out using face-to-face interviews with questionnaires by trained enumerators.The questionnaires (See Supplementary Materials for full detail) were administered to the participants
Sustainability 2020, 12, 5737 5 of 18
during their monthly group meetings at the local government area offices while for the nonparticipants,we visited them individually across the study areas which was very difficult to achieve. The difficulty inobtaining data from the nonparticipants is due to their dispersed nature, therefore, leading to unequalrepresentation from both groups. The data collected from the field were analyzed with the STATA® 14software using descriptive techniques (frequency counts, percentages, standard deviation and means)and inferential techniques (logistic regression model and sharp regression discontinuity). Informationobtained using the questionnaires include youth perception to agribusiness; factors influencing theirdecision to engage in agribusiness; the potential of N-Power Agro to generate employment; onlinetest score during registration; perception about the N-Power in reducing unemployment among theyouths; the willingness of the respondent to take up agribusiness as an occupation and the aspirationof the youth after the N-Power Agro program.
3.2.1. Descriptive Analysis
Descriptive statistics such as frequencies, tables, percentages, mean and standard deviation wereused to describe the unique characteristics possessed by young people which are vital for agribusinessdevelopment in Nigeria and the perceived benefits for youth involvement in N-Power Agro.
3.2.2. Logistic Regression Models
Logistic regression was developed by a statistician named David Cox in 1958 [29]. The logisticmodel (or logit model) is a widely used statistical model that, in its basic form, uses a logistic functionto model a binary dependent variable, many more complex extensions exist. Logistic regression (orlogit regression) involves estimating the parameters of a logistic model; which is a form of binomialregression. The advantages of using the logistic regression model are; the output is more informativethan any other classification algorithms, and it expresses the relationship between an outcome variableand each of its predictors. To analyze the factors influencing the decision to create employment throughagribusiness, following Anila and Kiani [30], the logit model was employed to predict the probabilityof willingness, since the dependent variable is binary. To choose whether to use the Logit or Probitmodel, we checked the data distribution through “xy” scatter plot and calculated the value of kurtosis.Since the kurtosis value was positive, we then settled to choose Logistic regression to analyze thefactors influencing the decision or choice of young people to be self-employed through agribusiness.Like in linear regression we assume that some sets of independent variables are useful for predictingthe dependent values. The model is specified thus;
P = β0 + β1Z1 + β2Z2 + β3Z3 + β4Z4 + β5Z5 + β6Z6 + β7Z7 + β8Z8 + εi (1)
P = Willingness/choice to create employment through agribusiness (Yes = 1, No = 0)Z1 = Age (years)Z2 = Sex (1 if male, 0 if female)Z3 = Locality (1 if urban; 0 if rural)Z4 = Level of education (years)Z5 = Household size (numbers)Z6 = Agricultural skill (Yes = 1, No = 0)Z7 = Years of agribusiness experience (years)Z8 = Employment status (employed = 1, Not employed = 0)εi = Error term
3.2.3. Sharp Regression Discontinuity Designs (RDD)
RDD is an important model in the toolkit of any applied researcher interested in unveiling thecausal effects of policies. Thistlethwaite and Campbell [31] were the ones to first introduce the concept

Sustainability 2020, 12, 5737 6 of 18
regression discontinuity design (RDD), which is an alternative method for evaluating social programs.They were interested in identifying the causal impacts of merit awards, assigned based on observed testscores, on future academic outcomes. Their approach created much criticism which later died down.This approach was later revived by some economists [32–34]; Hahn, Todd and van der Klaauw [32]formalized it; Imbens and Wooldridge [35] reinforced its estimation approaches which enables itto be applicable to answer various research questions. Over the last twenty years, the use of RDDhas increased exponentially as researchers have used it to evaluate including, anti-discriminationlaws; electoral accountability; the impact of unionization; SME policies; social assistance programs(conditional cash transfers program) and educational programs such as delayed school enrolment,school grants and financial aids [32,33,36–38].
Sharp Regression Discontinuity
To evaluate the potential of the N-Power Agro Program to generate income for the youth, theSharp RD method was employed. We used a “sharp” RD design instead of “fuzzy” RD design sincethe treatment variable is a deterministic function of the regression variable (test score). In the sharpversion of the RD design, every subject (respondent) is assigned a score and a treatment is given toall units whose score is above the cutoff and withheld from all units whose score is below it. Theprobability of treatment changes from 0 to 1 at the cutoff. If there are no crossovers and no no-shows,the design is then said to be sharp. Following Rubin; Imbens and Lemieux [39,40], the sharp regressiondiscontinuity (RD) design was employed to estimate the causal effects and treatment effects on thepotential outcomes. It is used when treatment status is a deterministic and discontinuous function of acovariate, xi. In the basic setting for the sharp RD design, there are three fundamental components inthe RD design which are (i) the score is continuously distributed and has only one dimension, (ii) thereis only one cut off, and (iii) compliance with treatment assignment is perfect, i.e., all units with scoresequal to or greater than the cutoff actually received the treatment, and all units with scores below thecutoff failed to receive the treatment and instead received the control condition. This setup is known asthe Sharp RD design. The effect of the treatment is potentially heterogeneous across units. Let Yi0and Yi1 denote the pair of potential outcomes for unit i. Yi0 is the outcome without exposure to thetreatment and Yi1 is the outcome given exposure to the treatment. Interest is in some comparison ofYi0 and Yi1. Typically, the focus of this study is on the differences Yi1-Yi0. The fundamental problem ofcausal inference is that we never observe the pair Yi0 and Yi1 together. We therefore typically focus onthe average effects of the treatment, that is, averages of Yi1-Yi0 over (sub) populations, rather than onunit-level effects. For unit i is the outcome corresponding to the treatment received and Ti0,1 denotesthe treatment received with Ti = 0 if unit i was not exposed to the treatment and Ti = 1 if otherwise,Porter [33] states that the outcome observed can then be written as
Yi = 1− Ti. Yi0 + Ti. Yi1 = Yi0 if Ti = 0Yi0 if Ti = 1 (2)
In the sharp RD design, the treatment assignment (Ti) rule implies that if we know the unit’sscore, we know with certainty whether that unit was assigned to the treatment or the controlcondition. This is a key defining feature of any RD design: the probability of treatment assignmentas a function of the score changes discontinuously at the cutoff. Sharp RD setup was employedbecause compliance with treatment is perfect against fuzzy where treatment is imperfect. Thus, in thesharp RD design, the assignment is a deterministic function of one of the covariates, the forcing (ortreatment-determining) variable
Ti = fXi ≥ c (3)
All units with a covariate value of at least (c) are assigned to the treatment group (and participationis mandatory for these individuals). All units with a covariate value less than (c) are assigned to thecontrol group (members of this group are not eligible for the treatment). In the sharp RD design,

Sustainability 2020, 12, 5737 7 of 18
the focus is on the discontinuity in the conditional expectation of the outcome given the covariate touncover an average causal effect of the treatment:
E Yi|Xi = x − EYi|Xi = x (4)
which is interpreted as the average causal effect of the treatment at the discontinuity point
sharp RD = EYi1 − Yi0|Xi = c (5)
There is a possibility of encountering a sharp turn in E[Yi|Xi] which may be mistaken for a jumpfrom one regression line to another. To reduce the likelihood of such mistakes, we looked only at datain a neighborhood around the discontinuity. Therefore, a nonparametric approach to RD requiresgood estimates of the mean of Yi in small neighborhoods to the right and left of X0 . Obtaining suchestimates is tricky. The first problem is that working in a small neighborhood of the cutoff meansthat we do not have much data. In addition, the sample average is biased for the population averagein the neighborhood of a boundary (N-Power cutoff score). A solution to this problem is the use ofa nonparametric version of regression called local linear regression [34]. The estimation procedureemployed in this study is the local linear regression. In the RD context, the straightforward way toestimate treatment effects is to take the difference between mean outcomes for the treatment andcontrol bins immediately next to the cutoff point. However, this approach of comparing means in thetwo bins adjacent to the cut-point is generally biased about the cutoff point [41]. Using the means forthe two bins with bandwidth (h) immediately to the right and left of the cut-point produces a biasedestimator. As the bandwidth decreases, the bias decreases, but it can still be substantial. To reducethis boundary bias, it is recommended that instead of using a simple difference of means, local linearregression should be used [32]. The local linear regression can simply be thought of as estimating alinear regression on the two bins adjacent to the cut-point, allowing the slope and intercept to differon either side of the cutoff point. Another advantage of the local linear regression is that it does notrequire functional forms assumption and put more weight on observation closest to the cutoff [35].This is equivalent to estimating impacts on a subset of the data within a chosen bandwidth h to the leftand right of the cut-point, using the following regression model:
Yi = α+ β0. Ti + εi (6)
α = the average value of the outcome for those in the treatment group after controlling for therating variable;Yi = the outcome measure for observation (i);Ti = 1 if observation (i) is assigned to the treatment group and 0 otherwise;β0 = the coefficient, for treatment assignment, represents the marginal impact of the programεi = Error term
4. Results and Discussion
4.1. Socioeconomic Characteristics
Table 1 shows the frequency distribution of respondents according to their socioeconomiccharacteristics. The majority (76%) of respondents were male, similar to the findings by Enimola et al.;Ayanwuyi et al., Ogunremi et al. [42–44]. This reveals that males are more inclined to farming (physicalstrength) and entrepreneurship and also have a higher tendency to utilize ICT better thereby favoringtheir selection during the application.
Most (53.57%) of the respondents that participated in N-Power Agro fall within the age bracketof 26 to 31 years with a mean age of 30 years and a standard deviation of 3.86. This agrees with thedefinition of youth by FGN, but in contrast to the findings of Enimola et al.; Ayanwuyi et al. [42,43]

Sustainability 2020, 12, 5737 8 of 18
that found out that most the participants fell within the age range 21 to 25 years; about 38.74% of thosethat did not participate in N-Power Agro fall between the ages of 26 and 31 years.
Table 1. Distribution of respondents according to their socioeconomic characteristics.
Variable Participants% (n = 345) Nonparticipants% (n = 300)
Sex
Male 76.79 75.00
Age
20–25 years 7.50 23.35
26–31 years 53.57 38.74
32–37 years 38.21 37.64
Above 37 years 0.71 0.27
Marital status
Single 60.00 59.07
Educational Background
NCE 20.36 19.23
B.Sc. 52.50 66.48
M.Sc. 27.14 12.91
PhD 1.37
Household size
1–3 persons 18.57 20.60
4–6 persons 53.57 54.95
≥ 7 persons 27.86 24.45
Agribusiness Farming experience
1–5 years 72.14 76.37
6–10 years 21.07 17.03
11–15 years 2.14 3.85
≥16 years 4.64 2.75
Own an Agribusiness
Yes 51.02 42.03
Agricultural skills
No 12.86 25.00
About 60% of both groups of respondents (participants and non-participants) were single. Thisconforms with the findings of Ogunremi et al. [44] who opine that since a high percentage of the youthare single and young; they had latent energy in them to go into entrepreneurship training withoutdistraction from family members. Similarly, the youth do not marry early due to lack of job or juststarting on a job which is in contrast with the findings of Ayanwuyi et al. [43] who argue that youthtend to get married early.
About 52.50% of the respondents that participated in N-Power Agro attained a BSc degree whichis in contrast to the findings of Enimola et al. [42] while about 66.48% of those that did not participatein N-Power Agro also attained BSc degree. The high level of literacy observed among the respondentssupports FAO [45], which argued that the youth literacy rate in Nigeria has been on the rise since 1991,it grew from 66.4% in 2008 to about 80% in 2015. It also implies that education is accorded higherimportance in Southwestern Nigeria.

Sustainability 2020, 12, 5737 9 of 18
Most (53.57%) of the respondents that participated in N-Power Agro have the household size thatranges between 4 and 6 people while about 54.95% of those that did not participate in N-Power Agrohas the same household size corroborating the result obtained by Hyeladi et al. [46].
Most (72.14%) of the respondents that participated in N-Power Agro have agribusiness experiencethat ranges between 1 and 5 years while about 76.37% of those that did not participate in N-PowerAgro also have the same length of agribusiness experience. This result is similar to the findings ofMuhammad-Lawal et al. [15].
Above 51% of the respondents that participated in N-Power Agro own an agribusiness whileabout 60% of those that did not participate in N-Power Agro do not own an agribusiness. This resultis similar to the findings of Muhammad-Lawal et al. [15]. The high percentage of not owning anagribusiness among the nonparticipants may likely be a result of not benefiting from the program.This shows that N-Power Agro has led to the creation of more employment among the beneficiaries.
The majority (87.14%) of the respondents that participated in N-Power Agro had gained variousagricultural skills from their higher education institution while about 75% of those that did notparticipate in N-Power had also gained various agricultural skills. This, therefore, implies that most ofthem will be willing to invest their savings into various agribusiness ventures.
4.2. Factors Influencing the Decision or Choice of Young Adults to Create Employment through Agribusiness
Table 2 presents the results from the logistic regression about the factors influencing the decisionor choice of young people to create employment through agribusiness. The model fitted the datawell since the LR chi2 (8) = (21.77) and the corresponding Prob > chi2 = 0.0034, indicating that allthe independent variables taking together statistically and significantly explained the variation inthe probability of willingness to create employment through agribusiness by respondents. The agesignificantly (positive) affected the willingness to create employment by respondents at a 1% level.The sign on the age coefficient implies that a 1% increase in age will increase by 29% the probability ofchoosing to create employment through agribusiness. This means that the younger the participants, thehigher their probability of creating employment. According to Jibowu [47], people in this age categorypossess some characteristics such as innovation proneness, minimal risk aversion, faster reactionrate, less fear of failure, greater physical strength, greater knowledge acquisition propensity, love foradventure and faster rate of learning among others. This indicated that most of the participants werein their active productive years, which revealed that N-Power trains youth who could be regarded asproductive assets to the society and vital sources of employment creation. Therefore, the age variablehas helped in creating employment for the participants.
The level of education significantly (negative) affected the willingness to create employment byrespondents at a 1% level. The sign on the coefficient implies that a 1% increase in the level of educationwill reduce by 53% the probability of choosing to create employment through agribusiness, meaningthe higher the youth become educated beyond a bachelor degree, the lower the likelihood of creatingself-employment. The negative significant impact of increasing level of education on influencingthe decision of young people to create jobs through agribusiness was expected as many youths seeagriculture as unattractive. With most participants having at least a bachelor’s degree, their probabilityof choosing to be self-employed through agribusiness tended to decline especially when they have theopportunity of white-collar jobs and further studies.
Years of agribusiness experience were found to be positive and significant at the 10% level. Thesign on the coefficient implies that a 1% increase in years of agribusiness experience will increase theprobability of choosing to be self-employed through agribusiness by 100.8%.
Employment status was found to be negative and significant at the 10% level. The sign on thecoefficient implies that a 1% increase in employed respondents will reduce the probability of choosingto be self-employed through agribusiness by in fact 100.7%. The factors influencing the decision orchoice of young people to create employment through agribusiness are similar to existing findingsAyinde et al.; Sudarshanie; Ayanwuyi et al. [43,48,49].

Sustainability 2020, 12, 5737 10 of 18
From the results discussed above, the level of education, employment status, years of agribusinessexperience, and age were all significant at 10%, 5%, and 1% probability level with different signs. Thisimplied that the predictors included in the model are jointly capable of predicting the choice to createemployment through agribusiness.
Table 2. Logistic regression estimates of the factors influencing the decision of young people to beself-employed through agribusiness.
Willingness/Choice Coef. Std. Err. z P > z
Cons −4.470734 3.38232 −1.32 0.186
Age 0.2991807 *** 0.1046157 2.86 0.004
Sex (1 = male, 0 = female) −0.8212896 0.6763278 −1.21 0.225
Locality −0.1069604 0.7514916 −0.14 0.887
Household size −0.0581269 0.5651311 −0.10 0.918
Level of education −0.5304102 *** 0.2173812 −2.44 0.007
Agricultural skill (yes = 1, no = 0) −0.6603783 1.085353 −0.61 0.543
Agribusiness years of experience 1.806457 * 1.079454 1.67 0.094
Employment status (yes = 1, no = 0) −1.73311 * 1.044354 −1.66 0.097
LR chi2(8) 21.27
Prob > chi2 0.0034
Pseudo R2 0.2061
*, *** significant at 10%, or 1%, respectively.
4.3. Regression Discontinuity Plots
N-Power participants were selected based on the test score; an online test taken by unemployedgraduate youth. RDD was used to determine whether the selected participants for the program canincrease their income due to their participation. Sharp RD compares the income of applicants justabove and just below the cutoff point (80 marks). It is generally expected that applicants with higherscores to be more likely to earn a higher income by been selected for the program, but this effect wasbe controlled by fitting a regression to the relationship between income and scores, at least in theneighborhood of the test cutoff. It is this jump in regression lines that gives RD its name [50]. Theapplicants who scored just below and above 80 (score ranges from 71–89) have similar characteristicssuch as age, education, and being youth, but the applicants who scored 80 and above got been selectedand those below were not., i.e., RDD was used to compare the applicants below and above the 80marks and consider the differences in outcomes to give the program effect. We now formally exploitthe discontinuity in income by estimating the RD models discussed in Section 3.2 above. After someexperiments, we decided to limit our analysis to test scores 71–89 because the data outside this rangeare of little use for helping to fit the model around the discontinuity point. In any case, we showedthrough RD plots below (Figures 1–4) that our results are very robust to the choice of the test scorerange. The plots give an idea of the overall fit while also exhibiting graphically the sharp RD estimate.To get the RD plot, we constructed figure using the local sample means over nonoverlapping binspartitioning restricted support of Xi, together with polynomial regression curve estimates for controland treatment units separately. We also included the binned means to capture the behavior of thecloud of points and to show whether there are other discontinuities in the data away from the cutoff.
Figures 1–4 illustrate the identification strategy in the sharp RD setup based on the populationvalues, the conditional probability of receiving the treatment, PrTi = 1|X = x against the covariate x.At x = 80 the probability jumps from 0 to 1. There were no crossovers or no no-show and there is a

Sustainability 2020, 12, 5737 11 of 18
jump in density of observation at the cutoff. Thus, the design is sharp. However, the idea of focusingon observations near the cutoff value– what Angrist and Lavy [33] called a “discontinuity sample” -suggests valuable robustness. In Figure 1 above, a linear regression line was fitted, and this shows thatthere is a discontinuity between the regression lines at the cutoff, which leads to the conclusion that thetreatment (N-Power program) was effective and there was no manipulation of the assignment variable.In this case, the relationship between the income, test score, and outcome is approximately linear. Thisis the best-case scenario as we used the data from the whole distribution to identify the slope of theline on either side.Sustainability 2020, 12, x FOR PEER REVIEW 11 of 18
Figure 1. Polynomial fit of order 1.
Figure 2. Polynomial fit of order 2.
To further test the validity of the underlying relationship, a higher-order polynomial fit was
imposed on the data in Figures 2–4. The higher-order polynomial regression curves were estimated
using the sample means and constructed over nonoverlapping regions of the support of the running
variable Xi, for control and treatment units separately. This sample means provided us with an
approximation of the population regression functions, but they also help to visualize the dispersion
of the data, which was used to detect other potential discontinuities away from the cutoff (80, as a
form of a validation test). The graphic illustration in Figures 2–4 reveals that there is a discontinuity
in the design and concludes that the treatment had an effect and the interaction term was correctly
modeled.
Figure 1. Polynomial fit of order 1.
Sustainability 2020, 12, x FOR PEER REVIEW 11 of 18
Figure 1. Polynomial fit of order 1.
Figure 2. Polynomial fit of order 2.
To further test the validity of the underlying relationship, a higher-order polynomial fit was
imposed on the data in Figures 2–4. The higher-order polynomial regression curves were estimated
using the sample means and constructed over nonoverlapping regions of the support of the running
variable Xi, for control and treatment units separately. This sample means provided us with an
approximation of the population regression functions, but they also help to visualize the dispersion
of the data, which was used to detect other potential discontinuities away from the cutoff (80, as a
form of a validation test). The graphic illustration in Figures 2–4 reveals that there is a discontinuity
in the design and concludes that the treatment had an effect and the interaction term was correctly
modeled.
Figure 2. Polynomial fit of order 2.
To further test the validity of the underlying relationship, a higher-order polynomial fit wasimposed on the data in Figures 2–4. The higher-order polynomial regression curves were estimatedusing the sample means and constructed over nonoverlapping regions of the support of the runningvariable Xi, for control and treatment units separately. This sample means provided us with anapproximation of the population regression functions, but they also help to visualize the dispersion ofthe data, which was used to detect other potential discontinuities away from the cutoff (80, as a form of

Sustainability 2020, 12, 5737 12 of 18
a validation test). The graphic illustration in Figures 2–4 reveals that there is a discontinuity in thedesign and concludes that the treatment had an effect and the interaction term was correctly modeled.Sustainability 2020, 12, x FOR PEER REVIEW 12 of 18
Figure 3. Polynomial fit of order 3.
Figure 4. Polynomial fit of order 4.
4.4. Sharp Regression Discontinuity Design for Average Treatment Effects (ATE) on the Treated
Table 3 below shows the estimate of the ATE on the treated. The ATE shows that participation
in the N-Power program increased the income of participants on average by N30,191.46 compared to
non-N-Power participants and this estimate is statistically significant at 1%. Thus, the N-Power
program had a positive impact on the participant’s income generation. The diagnostics revealed that
the prob > F was significant at 1% which shows that the model is a good fit. Post-estimation tests to
validate the ATE shows that the optimal bandwidths of 9.75 at the left and right of the cutoff
estimated using the uniform kernel approach and samples nearest to the cutoff were valid. This was
revealed in the conventional, bias-correction, and robustness values which were all statistically
significant at 1% in Table 3 below. This, therefore, implies that the participants are more likely to
engage in agribusiness as a result of their participation in the N-Power Agro program than would be
the case among youths not selected for the program. This further implies that participation in the
program had a positive and significant impact on their income and on the decision to engage in
agribusiness.
Table 3. Sharp regression discontinuity (RD) and treatment effects estimate outcome using local
polynomial regression.
Method Coef. Std. Err. Z P > |z| [95% Conf. Interval]
Figure 3. Polynomial fit of order 3.
Sustainability 2020, 12, x FOR PEER REVIEW 12 of 18
Figure 3. Polynomial fit of order 3.
Figure 4. Polynomial fit of order 4.
4.4. Sharp Regression Discontinuity Design for Average Treatment Effects (ATE) on the Treated
Table 3 below shows the estimate of the ATE on the treated. The ATE shows that participation
in the N-Power program increased the income of participants on average by N30,191.46 compared to
non-N-Power participants and this estimate is statistically significant at 1%. Thus, the N-Power
program had a positive impact on the participant’s income generation. The diagnostics revealed that
the prob > F was significant at 1% which shows that the model is a good fit. Post-estimation tests to
validate the ATE shows that the optimal bandwidths of 9.75 at the left and right of the cutoff
estimated using the uniform kernel approach and samples nearest to the cutoff were valid. This was
revealed in the conventional, bias-correction, and robustness values which were all statistically
significant at 1% in Table 3 below. This, therefore, implies that the participants are more likely to
engage in agribusiness as a result of their participation in the N-Power Agro program than would be
the case among youths not selected for the program. This further implies that participation in the
program had a positive and significant impact on their income and on the decision to engage in
agribusiness.
Table 3. Sharp regression discontinuity (RD) and treatment effects estimate outcome using local
polynomial regression.
Method Coef. Std. Err. Z P > |z| [95% Conf. Interval]
Figure 4. Polynomial fit of order 4.
4.4. Sharp Regression Discontinuity Design for Average Treatment Effects (ATE) on the Treated
Table 3 below shows the estimate of the ATE on the treated. The ATE shows that participation inthe N-Power program increased the income of participants on average by N30,191.46 compared tonon-participants and this estimate is statistically significant at 1%. Thus, the N-Power program hada positive impact on the participant’s income generation. The diagnostics revealed that the prob >
F was significant at 1% which shows that the model is a good fit. Post-estimation tests to validatethe ATE shows that the optimal bandwidths of 9.75 at the left and right of the cutoff estimated usingthe uniform kernel approach and samples nearest to the cutoff were valid. This was revealed in theconventional, bias-correction, and robustness values which were all statistically significant at 1% inTable 3 below. This, therefore, implies that the participants are more likely to engage in agribusiness asa result of their participation in the N-Power Agro program than would be the case among youths notselected for the program. This further implies that participation in the program had a positive andsignificant impact on their income and on the decision to engage in agribusiness.

Sustainability 2020, 12, 5737 13 of 18
Table 3. Sharp regression discontinuity (RD) and treatment effects estimate outcome using localpolynomial regression.
Method Coef. Std. Err. Z P > |z| [95% Conf.Interval]
Conventional 27,234 3885.1 7.0098 0.000 19,61934,848.3
Bias-corrected 26,630 3885.1 6.8544 0.000 19,015.334,244.6
Robust 26,630 5625.9 4.7335 0.000 15,603.437,656.5
Income Coef. Std. Err. t P > |t| [95% Conf.Interval]
Treated 30,191.46 2960.704 10.20 0.000 24,376.4136,006.51
_cons 35,373.13 1676.631 21.10 0.000 32,080.138,666.17
4.5. Perceived Benefits for the Involvement of the Youth in N-Power Agro and the Effect of EntrepreneurialTraining on the Generation of Youth Employment
Table 4 shows the results of the distribution of the perceived benefits by N-Power Agro participants.It shows that respondents selected multiple choices and it was shown that a majority, 48.10% of theparticipants opted for monthly stipends while a minority, about 5.19%, choose monthly stipends &Extension services. This shows that most of the participants depended on the program due to themonthly incentives (stipends) they are getting from it and not really because of the skills and training.This is similar to the findings of Ogunremi et al. [44].
Table 4. Distribution of participant respondents by perceived benefits in N-Power Agro.
Perceived Benefits Percentage (n = 345)
Extension services 12.11
Monthly stipends 48.10
Training and skills development 13.84
Monthly stipends & training and skills development 20.76
Monthly stipends & extension services 5.19
Total 100.00
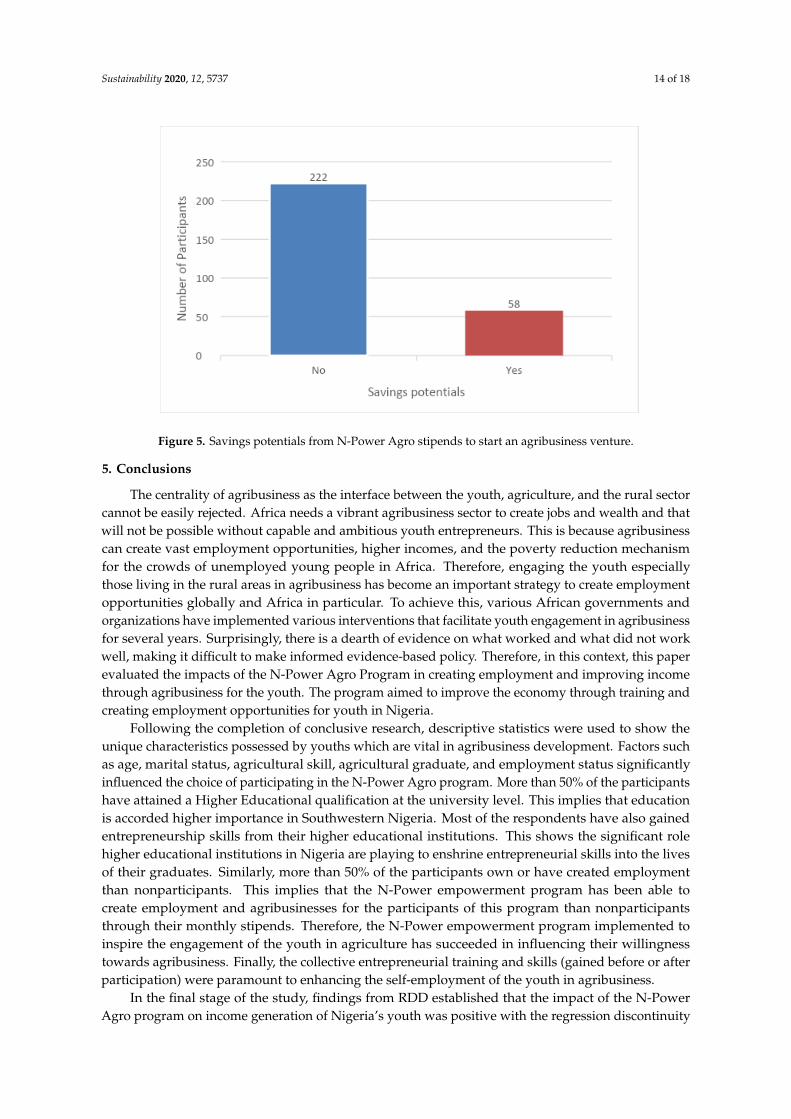
4.6. Saving Potentials of the Youth in the N-Power Agro Program
Figure 5 below shows the results of the savings potentials of participants from their stipendsto start an agribusiness venture. It shows that about 80% of the participants cannot start any newagribusiness venture as they do not make enough savings from their monthly stipends. This impliesthat the government needs to move away from incentivizing youths, but rather empower them to haveenough capital to start agribusiness.
Sustainability 2020, 12, 5737 14 of 18
Sustainability 2020, 12, x FOR PEER REVIEW 13 of 18
Conventional 27,234 3885.1 7.0098 0.000 19,619 34,848.3
Bias-
corrected 26,630 3885.1 6.8544 0.000 19,015.3 34,244.6
Robust 26,630 5625.9 4.7335 0.000 15,603.4 37,656.5
Income Coef. Std. Err. t P > |t| [95% Conf. Interval]
Treated 30,191.46 2960.704 10.20 0.000 24,376.41 36,006.51
_cons 35,373.13 1676.631 21.10 0.000 32,080.1 38,666.17
4.5. Perceived Benefits for the Involvement of the Youth in N-Power Agro and the Effect of Entrepreneurial
Training on the Generation of Youth Employment
Table 4 shows the results of the distribution of the perceived benefits by N-Power Agro
participants. It shows that respondents selected multiple choices and it was shown that a majority,
48.10% of the participants opted for monthly stipends while a minority, about 5.19%, choose monthly
stipends & Extension services. This shows that most of the participants depended on the program
due to the monthly incentives (stipends) they are getting from it and not really because of the skills
and training. This is similar to the findings of Ogunremi et al. [44].
Table 4. Distribution of participant respondents by perceived benefits in N-Power Agro.
Perceived Benefits Percentage (n = 345)
Extension services 12.11
Monthly stipends 48.10
Training and skills development 13.84
Monthly stipends & training and skills development 20.76
Monthly stipends & extension services 5.19
Total 100.00
4.6. Saving Potentials of the Youth in the N-Power Agro Program
Figure 5 below shows the results of the savings potentials of participants from their stipends to
start an agribusiness venture. It shows that about 80% of the participants cannot start any new
agribusiness venture as they do not make enough savings from their monthly stipends. This implies
that the government needs to move away from incentivizing youths, but rather empower them to
have enough capital to start agribusiness.
Figure 5. Savings potentials from N-Agro stipends to start an agribusiness venture. Figure 5. Savings potentials from N-Power Agro stipends to start an agribusiness venture.
5. Conclusions
The centrality of agribusiness as the interface between the youth, agriculture, and the rural sectorcannot be easily rejected. Africa needs a vibrant agribusiness sector to create jobs and wealth and thatwill not be possible without capable and ambitious youth entrepreneurs. This is because agribusinesscan create vast employment opportunities, higher incomes, and the poverty reduction mechanismfor the crowds of unemployed young people in Africa. Therefore, engaging the youth especiallythose living in the rural areas in agribusiness has become an important strategy to create employmentopportunities globally and Africa in particular. To achieve this, various African governments andorganizations have implemented various interventions that facilitate youth engagement in agribusinessfor several years. Surprisingly, there is a dearth of evidence on what worked and what did not workwell, making it difficult to make informed evidence-based policy. Therefore, in this context, this paperevaluated the impacts of the N-Power Agro Program in creating employment and improving incomethrough agribusiness for the youth. The program aimed to improve the economy through training andcreating employment opportunities for youth in Nigeria.
Following the completion of conclusive research, descriptive statistics were used to show theunique characteristics possessed by youths which are vital in agribusiness development. Factors suchas age, marital status, agricultural skill, agricultural graduate, and employment status significantlyinfluenced the choice of participating in the N-Power Agro program. More than 50% of the participantshave attained a Higher Educational qualification at the university level. This implies that educationis accorded higher importance in Southwestern Nigeria. Most of the respondents have also gainedentrepreneurship skills from their higher educational institutions. This shows the significant rolehigher educational institutions in Nigeria are playing to enshrine entrepreneurial skills into the livesof their graduates. Similarly, more than 50% of the participants own or have created employmentthan nonparticipants. This implies that the N-Power empowerment program has been able tocreate employment and agribusinesses for the participants of this program than nonparticipantsthrough their monthly stipends. Therefore, the N-Power empowerment program implemented toinspire the engagement of the youth in agriculture has succeeded in influencing their willingnesstowards agribusiness. Finally, the collective entrepreneurial training and skills (gained before or afterparticipation) were paramount to enhancing the self-employment of the youth in agribusiness.
In the final stage of the study, findings from RDD established that the impact of the N-PowerAgro program on income generation of Nigeria’s youth was positive with the regression discontinuity

Sustainability 2020, 12, 5737 15 of 18
design analysis recording an increase in the participants’ income than for nonparticipants. The ATEshows that participation in the N-Power program increased the income of participants on average byN30,191.46 compared to non-participants and this estimate is statistically significant at 1%. Thus, theN-Power program had a slightly positive impact above their monthly stipends on the participant’sincome generation.
Nevertheless, despite the many positive outcomes of this intervention, with most participantsbeing older in the youth bracket and having at least a bachelor’s degree, their probability of choosing tobe self-employed through agribusiness tended to decline especially when they have the opportunity ofwhite-collar jobs and further studies. Nevertheless, the majority are willing to venture into agribusinessbut are hampered by a lack of startup capital as they are unable to make considerable savings from theirN30,000 monthly stipend. Similarly, the requirement of strength demanded by agriculture hinderedthe females from benefiting much from this program as shown by the large participation by the males.
Finally, for Nigeria’s and African agriculture to regain its lost glory of ensuring food securityand relevance in the world economy through exportation, the aging farmers need to be replacedby vibrant young men and women who can meet up with global technological development thatwill lead to increased agricultural productivity. In addition, wider implementation of the N-PowerAgro program in other countries could help improve incomes, transform employment economies anddevelop agricultural markets in Africa, but that will require not just innovative thinking and willingnessto change within governments and higher education institutions, but also the support of developmentpartners and other key stakeholders. Young people can develop the African agribusiness sector tocreate youth employment, promote food security, increase consumption, and improve agriculturalexport earnings. With the multiplier effect, this will raise the standards of living and communitywelfare, and ultimately stimulate socio-economic transformation in Africa to achieve the AfricanDevelopment Bank’s vision of the Feed Africa Strategy which is to transform African Agricultureinto a competitive and inclusive agribusiness sector that creates wealth, improves lives and securesthe environment.
6. Policy Recommendations
Consequent upon the findings of the study, this study makes the following policy recommendations.
1. The government and policymakers should upscale this program by strengthening, monitoringand encouraging measures that would promote more female participation (especially in the inputand processing sector) in the N-Power Agro program to provide more employment, job creation,and at the same time increase income generation, hence improving the standard of living offemale youth;
2. Rather than scrap or lay-off current participants, the FGN should engage them to grow andsupply the necessary agricultural products needed for the Home-grown School Feeding Programinitiated by the government. This will surely boost the confidence of the youth to do more andboost food production in the country towards ensuring attainment of the sustainable developmentgoals on food security rather than incentivizing them monthly;
3. Intervention programs that particularly focus on younger people between 20 and 35 years whohave much passion for agribusiness should be established;
4. Incentivizing youth through empowerment programs should be discouraged, but rather toempower the youths into active participation by taking ownership of their business venture. Thegovernment should rather empower the youth into venturing into agribusiness by supportingthem with capital, land, training, and also ensuring proper monitoring;
5. Nigeria’s agricultural value chain is slowly evolving with limited diversification in an environmentthat yet undermines the progress, therefore, there is a need for policy interventions that willaddress the constraints inherent in the space;

Sustainability 2020, 12, 5737 16 of 18
6. The policymakers must know that the central part of policies should target youth as partners andleaders in development. It should be a collaborative intervention that will ensure youths are fullyconsulted and integrated into the decision-making process.
Limitation of the Study
To the best of our knowledge, this study is the first to investigate the impact evaluation of theN-Power program on income and employment creation through agribusiness among the youth inNigeria using regression discontinuity design. Despite the above important contributions, our studyrelies on cross-sectional data which limits the generalizability of the results beyond one year. As aresult, we could not estimate income changes over time. Moreover, since our data are not nationallyrepresentative, the results and policy implications should be interpreted with caution. We hopeour approach could be replicated in future studies based on a longitudinal survey that will fill theabove gaps.
Supplementary Materials: The following are available online at http://www.mdpi.com/2071-1050/12/14/5737/s1,File S1: IITA Questionnaire.
Author Contributions: All authors have made substantial contributions to the research design, data collection,data analyses, and write-up of the manuscript. The submitted version is checked and approved by all authors.The views expressed in this paper are the sole responsibility of the authors. All authors have read and agreed tothe published version of the manuscript.
Funding: This research is funded by the International Institute of Tropical Agriculture (IITA) that received a grant#2000001374 from the International Fund for Agricultural Development (IFAD) on a project titled “EnhancingCapacity to Apply Research Evidence (CARE) in Policy for Youth Engagement in Agribusiness and Rural EconomicActivities in Africa”.
Acknowledgments: Authors will like to acknowledge all the supports given by The Apostolic Church Student’sFellowship of Nigeria, Olabisi Onabanjo University CAS Ayetoro; the University of Ibadan, Department ofAgricultural Economics Postgraduate class 2016/2017; and Oyo, Ogun, and Lagos N-Power State Ambassadors.Furthermore, thanks are also due to Tesfamicheal Assfaw Wossen for his comments on the earlier draft of thismanuscript and his supervisory role. Finally, the authors gratefully acknowledge the efforts of the anonymousreviewers and the editors for their useful comments and suggestions.
Conflicts of Interest: The authors declare no conflict of interest.
References
1. Usman, S.A.; Ayegba, U.S. Unemployment and Poverty as Sources and Consequence of Insecurity in Nigeria:The Boko Haram Insurgency Revisited. Afr. J. Political Sci. Int. Relat. 2015, 9, 90–99. Available online:http://www.academicjournals.org/AJPSIR (accessed on 21 December 2019). [CrossRef]
2. Brooks, K.; Zorya, S.; Gautam, A.; Goyal, A. Agriculture as a Sector of Opportunity for Young People in Africa;The World Bank: Washington, DC, USA, 2013.
3. African Economic Outlook. African Development Bank Organization for Economic Co-operation and Development(OECD)/United Nations Development Program (UNDP) Entrepreneurship and Industrialization; OECD Publishing:Paris, France, 2017; 317p.
4. Awogbenle, A.C.; Chijioke Iwuamadi, K. Youth Unemployment: Entrepreneurship Development Programmeas an Intervention Mechanism. Afr. J. Bus. Manag. 2010, 4, 831–835.
5. African Union. Strategy to Revitalize Technical and Vocational Education and Training (TVET) in Africa. InProceedings of the Meeting of the Bureau of the Conference of Ministers of Education of the African Union(COMEDAF II+), Addis Ababa, Ethiopia, 29–31 May 2007.
6. Allen, A.; Howard, J.; Jamison, A.; Jayne, T.; Kondo, M.; Snyder, J.; Yeboah, F. Agri-Food Youth Employmentand Engagement Study (AGYEES); Michigan State University: East Lansing, MI, USA, 2016.
7. Betcherman, G.; Khan, T. Youth Employment in Sub-Saharan Africa Taking Stock of the Evidence and Knowledge Gaps;International Development Research Centre, MasterCard Foundation: Toronto, ON, Canada, 2015. Availableonline: https://www.africaportal.org/publications/youth-employment-in-sub-saharan-africa-taking-stock-of-the-evidence-and-knowledge-gaps/ (accessed on 24 December 2019).
Sustainability 2020, 12, 5737 17 of 18
8. Sambo, N.; Anpe, M. Youth Unemployment, Deprivation and Educational Planning Intervention in Nigeria.Cont. J. Educ. Res. 2017, 10, 104–114.
9. Adesugba, M.; Mavrotas, G. Youth Employment, Agricultural Transformation, and Rural Labor Dynamics inNigeria; International Food Policy Research Institute (IFPRI): Washington, DC, USA, 2016.
10. Open Data for Africa. Nigeria Data Portal. 2019. Available online: http://nigeria.opendataforafrica.org/
(accessed on 16 July 2020).11. Garba, A.S. Refocusing Education System towards Entrepreneurship Development in Nigeria: A Tool for
Poverty Eradication. Eur. J. Soc. Sci. 2010, 15, 140–150.12. Yunusa, P.M.; Giroh, D.Y. Determinants of Youth Participation in Food Crops Production in Song Local
Government Area of Adamawa State, Nigeria. Manag. Econ. Eng. Agric. Rural Dev. 2017, 17, 427–434.13. Abioye, O.D.; Ogunniyi, A. Coldspots and Hotspots of Agriculture in Nigeria; Any Hope for Youth and
Women? Adv. J. Soc. Sci. 2018, 2, 1–11. [CrossRef]14. Lyocks, J.; Lyocks, S.; Kagbu, J. Mobilizing Youth for Participation in Nigerian Agricultural Transformation
Agenda: A Grassroots’ Approach. J. Agric. Ext. 2014, 17, 78. [CrossRef]15. Muhammad-Lawal, A.; Omotesho, O.A.; Falola, A. Technical efficiency of youth participation in agriculture:
A case study of the youth-in-agriculture programme in Ondo State, south western Nigeria. Niger. J. Agric.Food Environ. 2009, 5, 20–26.
16. Ezeanokwasa, F.N.; Nwachukwu, O.P. Effective Entrepreneurship Skills in Reducing Unemployment throughSmall Business Innovation in Nigeria. J. Inf. Knowl. Manag. 2014, 4, 97–102.
17. Ogunmodede, A.M. The Past, Present and Future Contributions of Small-Scale and Local Food Supply Systems toNigeria’s Food Security: A Critical Appraisal; The Royal Agricultural University, 2019; pp. 1–14. Availableonline: https://www.researchgate.net/publication/342919718_The_past_present_and_future_contributions_of_smallscale_and_local_food_supply_systems_to_Nigeria\T1\textquoterights_food_security_a_critical_appraisal (accessed on 16 July 2020).
18. Ogunmodede, A.M.; Awotide, D.O. Profitability and technical efficiency of leafy vegetable production:A stochastic frontier production function analysis. Int. J. Veg. Sci. 2020, 27, 1–7. [CrossRef]
19. Ibietan, J. Public Policy Making Process: Agricultural and Rural Development policies in Nigeria (1960 todate). Int. J. Stud. Humanit. 2011, 8, 95–108.
20. Odey Ering, S.; Eteng Out, J.; Patrick Archibong, E. Rural Development Policies in Nigeria: A CriticalAppraisal. Int. J. Educ. Res. 2014, 2, 307–320.
21. Adedipe, N.; Okuneye, P.; Idowu, I. Pre-Service and In-Service Extension Education in the University of Agriculture,Abeokuta, Nigeria; Food and Agriculture Organization: Abeokuta, Nigeria, 1995.
22. Jibowo, A.A.; Ajayi, A.O. History of Agricultural Extension in Nigeria. Agricultural Extension Nigeria. 2005,pp. 1–15. Available online: https://www.agriculturenigeria.com/research/history-of-agriculture-in-nigeria/
(accessed on 16 July 2020).23. Yami, M.; Feleke, S.; Abdoulaye, T.; Alene, A.D.; Bamba, Z.; Manyong, V. African rural youth engagement in
agribusiness: Achievements, limitations, and lessons. Sustainability 2019, 11, 185. [CrossRef]24. Godwin, N. The Impact of N-Power (Training and Empowerment) Program on the Duration of Youth Unemployment
in Nigeria; MPRA Paper; University Library of Munich: Munich, Germany, 2019.25. Nyeche, S. N-Power Teachers Competence and Resource Utilization: Implication for Effective and Efficient
Teaching in Nigerian Primary and Post Primary Schools. Int. J. Educ. Eval. 2018, 4, 12–21.26. N-SIP. N-Power-N-SIP. 2019. Available online: https://n-sip.gov.ng/npower/ (accessed on 16 July 2020).27. Ahungwa, G.T.; Haruna, U.; Abdusalam, R.Y. Trend Analysis of the Contribution of Agriculture to the Gross
Domestic Product of Nigeria (1960–2012). 2014. Available online: http://iosrjournals.org/iosr-javs/papers/vol7-issue1/Version-4/J07145055.pdf (accessed on 23 March 2020).
28. N-Power—Empowering Nigerian Youths for Prosperity. 2019. Available online: http://www.npower.gov.ng/
n-agro.html (accessed on 23 March 2020).29. Dunson, D.B.; Johndrow, J.E. Response Models for Mixed Binary and Quantitative Variables. Biometrika 1992,
79, 441–461.30. Sultana, A.; Kiani, A.K. Determinants of food security at household level in Pakistan. Afr. J. Bus. Manag.
2011, 5, 12972–12979. [CrossRef]31. Thistlethwaite, D.L.; Campbell, D.T. Regression-discontinuity analysis: An alternative to the ex post facto
experiment. J. Educ. Psychol. 1960, 51, 309–317. [CrossRef]

Sustainability 2020, 12, 5737 18 of 18
32. Hahn, J.; Todd, P.; Klaauw, W. Identification and Estimation of Treatment Effects with aRegression-Discontinuity Design. Econometrica 2001, 69, 201–209. [CrossRef]
33. Jacob, R.T.; Zhu, P.; Somers, M.-A.; Bloom, H.S. A Practical Guide to Regression Discontinuity; MDRC, 2012;Available online: http://www.mdrc.org/publications/644/full.pdf (accessed on 31 July 2012).
34. Angrist, J.D.; Krueger, A.B. Instrumental Variables and the Search for Identification: From Supply andDemand to Natural Experiments. J. Econ. Perspect. 2001, 15, 69–85. Available online: http://pubs.aeaweb.org/
doi/10.1257/jep.15.4.69 (accessed on 19 February 2019). [CrossRef]35. Imbens, G.W.; Wooldridge, J.M. Recent developments in the econometrics of program evaluation. J. Econ.
Lit. 2009, 47, 5–86. [CrossRef]36. McEwan, P.J.; Shapiro, J.S. The benefits of delayed primary school enrollment: Discontinuity estimates using
exact birth dates. J. Hum. Resour. 2008, 43, 1–29. [CrossRef]37. Jacob, B. Statistics LL-R of Economics and 2004 Undefined. Remedial Education and Student Achievement:
A Regression-Discontinuity Analysis. Rev. Econ. Stat. 2004, 86, 226–244. Available online: https://www.mitpressjournals.org/doi/abs/10.1162/003465304323023778 (accessed on 12 February 2019). [CrossRef]
38. DiNardo, J.; Lee, D.S. Economic Impacts of New Unionization on Private Sector Employers: 1984–2001. Q. J.Econ. 2004, 4, 1383–1441. [CrossRef]
39. Rubin, D.B. Estimating causal effects of treatments in randomized and nonrandomized studies. J. Educ.Psychol. 1974, 66, 688–701. [CrossRef]
40. Imbens, G.W.; Lemieux, T. Regression discontinuity designs: A guide to practice. J. Econ. 2008, 142, 615–635.[CrossRef]
41. Porter, J. Estimation in the Regression Discontinuity Model. 2003. Available online: http://citeseerx.ist.psu.edu/viewdoc/download?doi=10.1.1.133.540&rep=rep1&type=pdf (accessed on 7 May 2003).
42. Joseph Enimola, D.; Johnson Orugun, J.; Tunde Nafiu, A. Entrepreneurial skills and youth employment inkogi state, nigeria: The case of N-POWER. J. Asian. Bus. Strateg. 2019, 9, 82–93. [CrossRef]
43. Ayanwuyi, E.; Akinboye, O.A.; Olaniyi, O.A. Youth Participation in Rural Development Projects in SurulereLocal Government Area of Oyo State, Nigeria. Soc. Sci. 2007, 2, 312–317.
44. Ogunremi, O.O.; Ogunremi, J.B.; Faleyimu, O.I. Relevance and Benefits of Agricultural Youth EmpowermentProgramme to Participating Youth in Osun State, Nigeria. Asian J. Soc. Sci. Humanit. 2012, 1, 7–19.
45. FAO Regional Office for Africa. Africa African Youth in Agriculture, Natural Resources and RuralDevelopment. Nat. Faune 2013, 38, 1–106. Available online: http://www.fao.org/3/as290e/as290e.pdf(accessed on 21 December 2019).
46. Hyeladi, A.; Alfred, J.; Gyang, L.D. Assessment of Family Sizes and Poverty Levels in Mangu LGA, PlateauState. Int. J. Humanit. Soc. Sci. 2014, 4, 310–315.
47. Jibowo, A.A. Rural Youth: A Vital, but Untapped Human Resources. In Proceedings of the NAERLS,National Rural Youths Workshop. An Invited Paper, Zaria, Nigeria, 6–8 June 1989.
48. Ayinde Latopa, A.-L.; Rashid, S.N.S.A.; Samah, A.A.; Abdullah, H. Examining the Extent of Youth Participationin Agricultural Training Program in Malete Youth Farm Kwara State. IOSR 2015, 20, 65–71.
49. Sudarshanie, S.D.P. Factors Affecting on Youth Participation and Satisfaction in Occupation Related to Agriculture;University of MoratuwaSri Lanka: Moratuwa, Sri Lanka, 2014.
50. Abadie, A. Semiparametric instrumental variable estimation of treatment response models. J. Econ. 2003,113, 231–263. [CrossRef]
© 2020 by the authors. Licensee MDPI, Basel, Switzerland. This article is an open accessarticle distributed under the terms and conditions of the Creative Commons Attribution(CC BY) license (http://creativecommons.org/licenses/by/4.0/).