Embed Size (px)
Citation preview

Ipsos Business ConsultingBuild · Compete · Grow
UNLOCKINGTHE OPPORTUNITIESFOR CROP SCIENCEPRODUCTS IN CLMV

CONTENTS
Introduction
Agriculture overview
Macro-level trends and farming practices
• Cambodia
• Lao PDR
• Myanmar
• Vietnam
Conclusion and recommendations
Go-To-Market
About Ipsos Business Consulting
Contact Us
The information contained herein is of a general nature and is not intended to address the circumstances of any particular individual or entity. Although we endeavour to provide accurate and timely information, there can be no guarantee that such information is accurate as of the date it is received or that it will continue to be accurate in the future. No one should act upon such information without appropriate professional advice after athorough examination of the particular situation.
© 2017 Ipsos. All rights reserved. Contains Ipsos’ Confidential and Proprietary information and may not be disclosed or reproduced without the prior written consent of Ipsos.
www.ipsosconsulting.com
Ipsos Business Consulting
3
4
9
9
12
14
17
29
31
32
33

Unlocking the Opportunities for Crop Science Products in CLMV
INTRODUCTION
Urbanisation is rapidly taking place around the world. The global urban population grew from 3.3 billion in 2008 to more than 4.0 billion in 2016, an increase of about 21%. The pace of urban growth is forecast to accelerate further.
Asia and Africa, where the urban population is set to double from 2000 to 2030, will lead the trend. Cambodia, Lao PDR, Myanmar and Vietnam, also known as the CLMV countries, accounted for 32% the Association of Southeast Asian Nations’ (ASEAN) geographical area and 26% of its population in 2015.
Despite the slowdown in ASEAN’s overall economy, CLMV still has strong potential as a leading crop-producing region. CLMV faces a number of supply-side challenges in keeping up with significant changes in global and regional consumption trends, despite the impressive growth of its agribusiness sector in recent years.
Rapid urbanisation across ASEAN and CLMV countries will be the major driver of growth in fertilisers and crop protection products due to growing demand for higher crop productivity. Progressive implementation of the ASEAN Economic Community (AEC) will increase opportunities for various agribusinesses to manufacture in any ASEAN country and easily export to other markets. Key stakeholders — policymakers, agribusinesses, retailers and farmers — will need to develop a robust, collaborative strategy to leverage such opportunities.
In this paper, Ipsos Business Consulting reveals the market potential for crop science products in CLMV countries by examining the agriculture sector and macro-level trends of each individual market.
Strategic levers for successful market entry are presented to advise crop science companies on their next go-to-market challenges.
3
Myanmar VietnamLaos PDR
Cambodia
Thailand

Unlocking the Opportunities for Crop Science Products in CLMV
MyanmarMyanmar’s agricultural sector accounts for 29% of the economy and more than 60% of workforce in 2015.
From the start of the country’s political and economic reforms in 2012, agriculture became an area of key focus especially with growing concerns over national food security and the government’s desire for the country to regain its long lost position as the world’s leading rice exporter.
The public and private sectors have cooperated to improve productivity and quality for rice farmers by increasing access to agricultural machinery rental and building rice mills across the country.
The sector remains underdeveloped despite its abundant agricultural resources mainly due to long-term underinvestment and inefficient farming practices.
Many policies, such as foreign ownership of land, land security improvement and development of infrastructure, have been adjusted to attract more foreign direct investment in the sector.
Other reforms, such as financing systems and value chain structure, are needed to enhance Myanmar’s potential as an exporter.
Combined, it is hoped these initiatives shift traditional farming practices towards market-based production with higher use of agricultural machinery and inputs to help build the agricultural sector into a sustainable mainstay of Myanmar’s economy.
VietnamVietnam has become one of the region’s most attractive markets for foreign investors, a trend which is expectedto persist in the coming years.
Strong annual economic growth, which averaged 10.8% from 2010–15, is forecast to continue until 2020 whenthe overall economy is expected to reach US$300 billion.
CambodiaCambodia is emerging as one of ASEAN’s growth in rising economic stars, achieving average annual gross domestic product of 9.9% for the five years following the 2008 global financial crisis.
The expanding industrial and service sectors were the two highest contributors to the nation’s economic growth, while the 2014–16 El Niño hindered agricultural productivity.
Despite unfavourable weather conditions, agriculture remains the main income source for most Cambodians, accounting for 59% of the nation’s workforce in 2015.Most Cambodian farmers are smallholders with less than two hectares per household.
Cambodia’s government in 2014 announced the Rectangular Strategy Phase III and National Strategic Development Plan 2014–18 for the agricultural sector, which aims to sustain annual growth of the agricultural sector at 4%.
The vision is to modernise agriculture by applying new technologies, expanding mechanisation and increasing funding for agricultural research to increase crop yields and quality.
The government also plans to promote the commercialisation of agricultural products and enhance partnerships between farmers and traders, as well as between large-scale agro-industries and smallholders.
As a result, Lao agricultural production remains overly reliant on natural resources which results in lower yields. Insufficient irrigation coverage substantially affects local farming practice.
As farmers are unable to cultivate rice during dry season they shift to crops that require less water. This limits Lao PDR’s potential to become a major rice exporter.
Lao PDRAgriculture is a key component of the Lao economy, accounting for 24% of gross domestic product and 66% of its workforce in 2015.
Farming remains a subsistence activity for most people in this landlocked country, where mountains and forests account for 70% of its territory.
The government has launched several initiatives to commercialise agricultural production in recent years. However, these medium-term plans were hampered by the government’s budget deficit.
Current policy is focused on attracting foreign investment to support developments in education, health and infrastructure, such as roads and hydropower plants, all of which will create firmer foundations for the industrial and service sectors with the agricultural sector likely to develop at a slower pace.
Agricultural infrastructure — including irrigation, reservoirs and water pumping stations, which are being gradually developed — is still insufficient to support longer-term development and agricultural productivity.
AGRICULTURE OVERVIEW
4

Unlocking the Opportunities for Crop Science Products in CLMV
Crops %Rice 48%
Rubber 17%Sugarcane 8%
Cassava 7%Maize 5%Palm 3%
Others 12%Base year: 2015
Crops %Rice 66%
Cassava 12%Rubber 8%Maize 4%Pulses 3%
Vegetables 1%Others 6%
Base year: 2015
Crops %Rice 62%
Maize 14%Vegetables and Pulses 12%Coffee 5%Cassva 4%
Sugarcane 1%Others 2%
Base year: 2013
Crops %Rice 41%
Pulses 24%Oilseedcrops 14%
Rubber 4%Fruits 3%
Vegetables 3%Others 11%
Base year: 2014
Crops %Rice 61%
Maize 9%Rubber 8%Coffee 5%
Cassava 4%Sugarcane 4%
Others 9%Base year: 2015
Vietnam over the past decade has transformed itself from an agricultural- to an industrial and service-based economy. Expansion of manufacturing and construction increased the industrial sector’s overall performance, which in 2015 posted growth of 9.6%, its strongest since 2012.
This bullish long-term outlook is underpinned by on-going government policies to privatise state-owned enterprises, an influx of foreign investment, proliferation of trade and investment agreements, forthcoming participation in the AEC, and rising private consumption.
Vietnam’s so-called golden demographic bonus, which couples its youthful population with positive business sentiments, further enhances the country’s position as
an especially lucrative business environment when compared with its ASEAN peers.
Agriculture remains an important sector for Vietnam’s economy and it currently accounts for about half of the country’s workforce.
This composition is expected to change as a result of on-going industrialisation and modernisation and the corresponding employment trend where people are increasingly shifting from agriculture to the industry and service sectors.
Other factors are also in play, such as severe drought resulting from El Niño which impeded crop output while falling global food prices further undermined the growth of the agricultural sector.
Source: Worldbank; IMF; Economic Intelligence Units; Asian Development Outlook; FAOSTAT; NESDB; Cambodia’s Ministry of Agriculture, Forestry and Fisheries; Lao PDR’s Ministry of Agriculture and Forestry; Myanmar’s Ministry of Agriculture and Irrigation; Vietnam’s General Statistics Office; consolidated by Ipsos Business Consulting Analysis
Macroeconomic and agricultural indicators for Thailand and CLMV
Thailand Cambodia Lao PDR Myanmar Vietnam
Population (2015)
GDP USD (2015) $18.1 billion$395.3 billion $12.3 billion $67.0 billion $193.6 billion
GDP contribution (%)by sector
AgricultureIndustryService
2015 2020f
15.6 million68.0 million
0.3%
6.8 million 53.90 million 91.7 million
Population CAGR (2005–15) 1.6% 1.7% 0.8% 1.1%
3.0%GDP CAGR(2010-15) 9.9% 11.4% 6.2% 10.8%
21.8 million (2015)
Cultivation area (hectares)
4.6 million (2015)
1.5 million (2013)
17.7 million (2014)
12.9 million (2015)
5
Key crops by cultivation area
9%
36%
55%
31%
61%
8%
2015 2020f
25%
33%
42%
35%
42%
23%
2015 2020f
24%
36%
40%
33%
44%
23%
2015 2020f
29%
34%
37%
34%
33%
34%
2015 2020f
18%
39%
44%
39%
44%
17%

Unlocking the Opportunities for Crop Science Products in CLMV
Thailand and CLMV’s key crop production by region
6
Cambodia
Northern
Rice, cassava, rubber
North-western
Rice, cassava
Central
Rice, maize, rubber
Thailand
Northern
Rice (major rice), maize, sugarcane,
cassava
North-eastern
Rice (major rice), sugarcane,
cassava
Central
Rice (major and secondary
rice), sugarcane, cassava
Myanmar
Northern
Rice, pulses, oilseed,
vegetables, maize
Eastern
Rice, oilseed,vegetables,
maize
Central
Rice, pulses,oilseed, fruit
Lao PDR
Northern
Maize, cassava,vegetables,
pulses,sugarcane
Rice, cassava,vegetables,
pulses,sugarcane
Central
Rice,vegetables,
pulses, coffee
Southern
Southern
Vietnam
North-western(Midland and
Mountain Area)
Rice, maize, cassava Rice
Northern(Red River
Delta)
Rice, maize,cassava,
sugarcane
North Central
South-eastern
Rubber, fruit
Western
Rice
Rubber, palm
Southern
Rice, pulses,oilseed,
vegetables
Mekong River Delta
Rice, sugarcane
Central
Cassava, maize, coffee
sugarcane
South-eastern
Rubber, cassava

Unlocking the Opportunities for Crop Science Products in CLMV 7
Northern(Red River Delta)
North Central
RiceWest
Rice
NorthernMaize, cassava, vegetable, pulses, sugarcane
SoutheasternRubber
SoutheasternRubber, fruit
NorthernRice, cassava, rubber
NortheasternRice (major rice), sugar cane, cassava
NorthernRice (major rice), maize, cassava, sugarcane
Mekong River Delta
Rice, sugarcane
CentralRice, maize, rubber
SouthernRubber, palm, garden plants
NorthwesternRice, cassava
Rice, maize, cassava, sugarcane
SouthernRice, pulses, oilseed crops, vegetables
CentralRice, pulses, oilseed crops, fruit
SouthernRice, vegetable, pulses, coffee
CentralCassava, maize, coffee, sugarcane
Northwestern (Midland and
Mountain Areas)Rice, maize, cassava
Northwestern (Midland and
Mountain Areas)Rice, maize, cassava
CentralRice, cassava, vegetables, pulses,
CentralRice (major and secondary rice), sugarcane, cassava
EasternRice, oilseed crops, vegetables, maize

Unlocking the Opportunities for Crop Science Products in CLMV
Source: FAO Rice Market Monitor; United States Department of Agriculture (USDA); International Rubber Study Group (IRSG); International Trade Center Database (ITC); UN Comtrade Database (accessed Sep 2016); consolidated by Ipsos Business Consulting Aanlysis
CLMV contribution to global markets of rice, cassava, sugarcane and natural rubber
8
Natural rubberSugarcaneCassavaRice
• Paddy rice: 738.8 mn tons• Milled basis: 490.6 mn tons
• Paddy rice: 746.5 mn tons• Milled basis: 495.7 mn tons
mn tons (milled basis) kg per caput (fresh root eq.)
• Fresh root equivalent: 20.5 per caput (estimated)
• Centrifugal sugar: 172.4 mn tons
• Natural rubber: 12.1 mn tons
Global production (2015)
Global utilisation (2015)
Utilization(2012–16f)
Major exporters (2015)
Thailand CLMV Others
• Fresh root equivalent: 288.8 mn tons (estimated)
Thailand CLMV Others
• Sugarcane: 1.6 bn tons• Centrifugal sugar: 164.9 mn tons
Thailand CLMV Others
• Natural rubber: 12.3 mn tons
Thailand CLMV Others
2016f
2015
2014
2013
2012
503
496
492
483
477
2016f
2015
2014
2013
2012
20.6
20.5
20.4
19.7
19.2
mn tons (centrifugal sugar)
2016f
2015
2014
2013
2012
174
172
171
168
167
mn tons (natural rubber)
2016f
2015
2014
2013
2012
12.3
12.1
12.2
11.4
11.0
Country
India
Thailand
Vietnam
Pakistan
United States
Myanmar
Guyana
Cambodia
Brazil
Uruguay
Export* (mn tons)
11.03
9.80
8.40
4.06
4.00
1.60
1.29
1.20
0.96
0.71
Country
Chips and Pellets
Thailand
Vietnam
Cambodia
Lao PDR
United States
Flour and Starch
Thailand
Vietnam
Cambodia
Brazil
Paraguay
Export (mn tons)
7.31
1.93
1.59
0.23
0.20
2.89
0.63
0.03
0.02
0.02Note: *Include milled and paddy rice
Country
Morocco
Spain
Portugal
Algeria
Cyprus
Myanmar
Turkey
Italy
Egypt
Lao PDR
Export*(‘000 tons)
21.15
13.49
11.66
5.82
2.29
0.80
0.54
0.51
0.48
0.24
Note: *Included fresh, chilled, frozen or dried sugarcane
Country
Thailand
Indonesia
Vietnam
Malaysia
Ivory Coast
Germany
Cambodia
Guatemala
Singapore
Philippines
Export* (mn tons)
3.65
2.63
0.73
0.71
0.46
0.15
0.13
0.10
0.09
0.08
Note: *Natural rubber in primary forms or plates

Unlocking the Opportunities for Crop Science Products in CLMV
Sources: Cambodia’s Ministry of Agriculture, Forestry and Fisheries; Ipsos Business Consulting Analysis
CambodiaRice is Cambodia’s most important crop in terms of cultivated area, accounting for 53% of the total cultivated area in 2015. Around 93% of Cambodia’s rice is cultivated in rain-fed lowland areas in the central and north-western regions . This arable land, which can sustain two-to-three crops a year, is located in the fertile Mekong River basin and around Tonle Sap lake. The central provinces of Kandal and Takeo achieve the highest crop yields (about 3.8 tons per hectare in 2015) thanks to its lowland topographical advantages.
Other provinces with high rice productivity are Prey Veng, Kampong Cham and Tboung Khmum in the central region. The national average rice yield has remained steady at 3.1 tons per hectare since 2012. Incremental expansion of cultivated areas has seen rice production steadily increase, rising from 6 million tons in 2005 to 9.3 million tons in 2015.
Cambodia has two key rice production systems — wet season rice and dry season rice. Wet season rice uses traditional Cambodian rice varieties and is widely used for subsistence and food security farmers. It accounted for about 77% of paddy output in 2015. Dry season rice is cultivated from more diverse rice varieties and is predominantly grown as a cash crop.
Meeting the demand from crop production
Breakdown of key crop production in Cambodia (2015)
Macro-level trends and farming practices
Agriculture has always been a key driver of economic growth and personal income within the CLMV. The region’s diverse geography, abundant natural resources and fertile soil have enabled the four nations to rank as a leading global producers and exporters of edible crops such as rice, cassava, pulses, vegetables and fruit, as well as industrial crops such as rubber, sugarcane and maize. The cultivated area and agricultural production of member countries has risen continuously in line with the CLMV’s position within the global agricultural market.
9
24.9 mntons
53%38%
3%3%
2%1%
CassavaRiceMaizeSugarcaneVegetablesOthers

Unlocking the Opportunities for Crop Science Products in CLMV
Source: Cambodia’s Ministry of Agriculture, Forestry and Fisheries; Ipsos Business Consulting Analysis
Source: Cambodia’s Ministry of Agriculture, Forestry and Fisheries; Ipsos Business Consulting Analysis
Cambodia’s rice cultivation area and rice production by province (2015)
In 2014, drought resulting from the El Niño weather phenomena damaged crops and caused output to fall as rains were delayed until mid-July the following year. Although rice production experienced a slight drop, export volumes remained strong. Cambodia’s major rice export markets are Europe, US, Malaysia and China.
Government policy to bolster exports saw Cambodia transition from exporting paddy to milled rice in just five years from 2011. The “Policy to Promote Paddy Production and Rice Exports” was launched to further increase rice production, improve irrigation systems, facilitate import clearance procedures and provide tax incentives, as well as micro-credits, for exporters.Nevertheless, Cambodia continues to face challenges from neighbouring rivals, namely Thailand and Vietnam, which produce higher volumes of the grain at lower prices.
Rice cultivation and yields in Cambodia(2005–15)
10
Rice cultivation area, 2015 Total 3.1 mn hectares
Rice production, 2015
Total 9.3 mn tons
Central Region
Northwest Region
North Region
1,266
Cultivation Area (’000 hectare) Production (’000 ton)
1,126
723
529493
379470
413 340 343 291
46 36 30 12
862711
539
15915
229142 75 53 54
Rice Cultivation Area (ha)
Culti
vatio
n Ar
ea (h
a)Pr
oduc
tion
(ton)
Rice Production (ton) Yield (ton/ha)
Yiel
d (to
n/ha
)
10,000,000
8,000,000
6,000,000
4,000,000
2,000,000
2005 2006 2007 2008 2009 2010 2011 2012 2013 2014 20150.0
1.0
2.0
3.0
4.0
5.0
364296
257188 157 146 119 113 91 89122
17 12 10 4 83 46 29 26 23
306 269
207
72 6

Rubber accounted for 8% of the country’s total cultivated area in 2015, with rubber manufacturing accounting for 7.6% of the economy in 2014. The government’s “Strategy for Natural Rubber Development Plan” increased rubber cultivation from 60,000 hectares in 2005 to 390,000 hectares in 2015.About half of the country’s rubber plantations operate under economic land concessions, a long-term lease to domestic and foreign private companies that enables them to clear land to develop industrial-scale plantations.
Most rubber plantations are located in three key regions: the lower plateaus of Kratie, Kampong Cham and Stung Treng provinces which have red basaltic soil; fertile areas in eastern Cambodia, such as Rattanak Kiri and Mondul Kiri; and sandstone-rich soil areas across the country, such as Kampong Thom and Banteay Meanchey.
Unlocking the Opportunities for Crop Science Products in CLMV
Cassava is Cambodia’s second most cultivated crop, accounting for 53% of total crop production in 2015. Smallholder farmers are the main cassava producers predominantly growing the crop and selling it for export as fresh roots, but it is also used to supplement their rice-base diet, for animal feed and to produce starch. It is cultivated in most provinces, though Battambang, Banteay Meanchey, Pailin and Kratie are the most productive areas. Cassava cultivation increased significantly from 30,000 hectares in 2005 to about 570,000 hectares in 2015 (figure 7) when output reached 13 million tons, driven mainly by rising international demand for cassava starch which is used in ethanol production, especially from China.
Most of Cambodia’s cassava is exported through Thailand and Vietnam, where the raw product is processed before being sold on. The lack of local processing facilities in Cambodia and inadequate funding for farmers to purchase trucks for transporting raw cassava are key barriers preventing direct trade with international markets. Cambodia’s cassava industry therefore remains heavily dependent on export demand and the bargaining power of processors.
11
Culti
vatio
n Ar
ea (h
a)
Yiel
d (to
n/ha
)
Cambodia’s cultivation area and yields for cassava and rubber (2005–15)
Source: Cambodia’s Ministry of Agriculture, Forestry and Fisheries; Ipsos Business Consulting Analysis
Rubber Cultivation Area (ha)
Rubber Yield (ton/ha) Cassava Yield (ton/ha)
Cassava Cultivation Area (ha)
2005 2006 2007 2008 2009 2010 2011 2012 2013 2014 20150.00
100,000
200,000
300,000
400,000
500,000
600,000
700,000
4.0
8.0
12.0
16.0
20.0
24.0
28.0
t a

Source: Lao PDR’s Ministry of Agriculture and Forestry; Ipsos Business Consulting Analysis
Lao PDR
Rice is Lao PDR most important crop, accounting for 62% of cultivated land in 2013. Most production is clustered in central and southern regions where 82% of national output, or 3.3 million tons of rice, were produced in 2014. Savannakhet and Champasack are the key rice-producing provinces with combined output accounting for 36% of total supply.
Breakdown of key crop production in Lao PDR, (2014)
Lao PDR’s rice cultivaion area rice porduction by provirce, (2014)
12
Rice cultivation area, 2014
Total 993 thousand hectare
Rice production, 2014
Total 4.1 mn tons
Source: Lao PDR’s Ministry of Agriculture and Forestry; Ipsos Business Consulting Analysis
8.5 mntons
RiceCassavaVegetables and PulsesMaizeSugarcaneCoffeeOthers
40%
17%
16%
14%
10%
2% 1%
Cultivation Area (’000 hectare) Production (’000 ton)
Phongsaly
Luan
gnam
tha
OudomxayBoke
o
Luan
gprab
ang
Huaphan
h
Xayab
ury
Vientiane Cap
ital
Xiengkhuan
g
Vientiane
Borikham
xay
Khammuan
e
Sava
nnakhet
Xayso
mboun
Sarav
an
Seko
ng
Champasa
ck
Attapeu
49 79 91 96 104 115208
360
103305
183
916
31365
49
539
87
379
North Region
Central Region
South Region
Unlocking the Opportunities for Crop Science Products in CLMV
14 24 28 26 35 34 51 7329
67 4486
219
7 12 2412692
Source: Lao PDR’s Ministry of Agriculture and Forestry; Ipsos Business Consulting Analysis
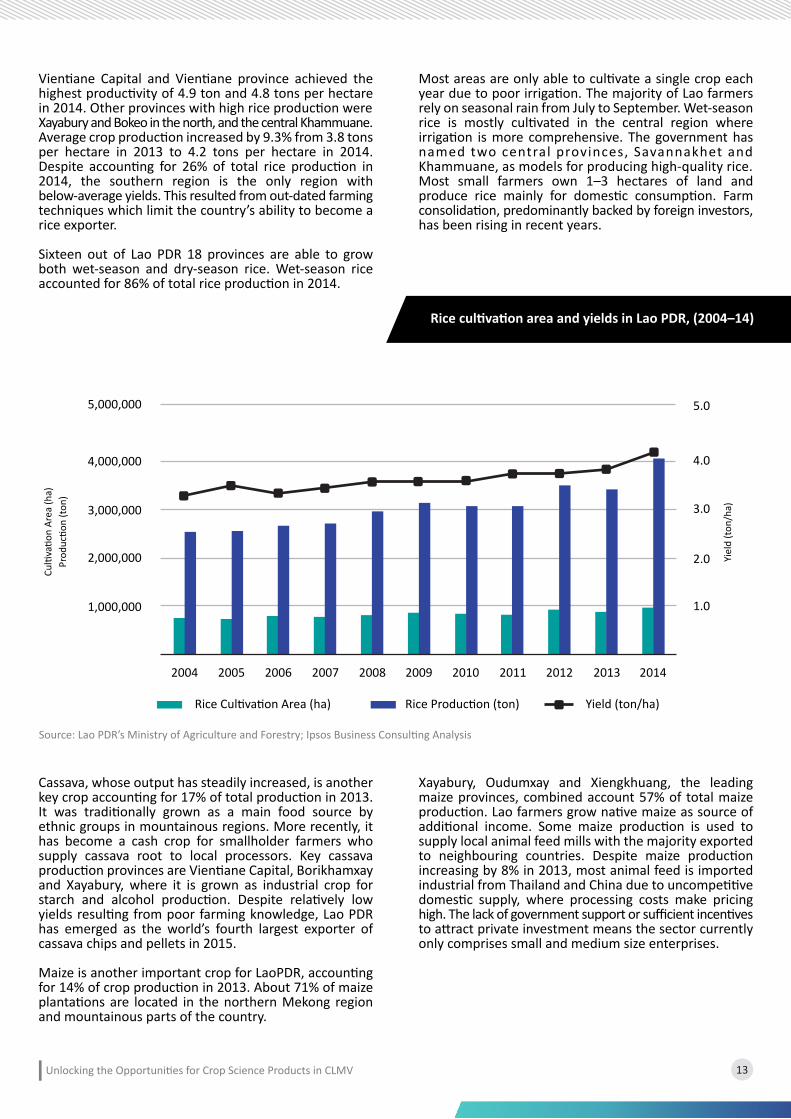
Rice cultivation area and yields in Lao PDR, (2004–14)
13
Vientiane Capital and Vientiane province achieved the highest productivity of 4.9 ton and 4.8 tons per hectare in 2014. Other provinces with high rice production wereXayabury and Bokeo in the north, and the central Khammuane. Average crop production increased by 9.3% from 3.8 tons per hectare in 2013 to 4.2 tons per hectare in 2014. Despite accounting for 26% of total rice production in 2014, the southern region is the only region with below-average yields. This resulted from out-dated farming techniques which limit the country’s ability to become a rice exporter.
Sixteen out of Lao PDR 18 provinces are able to grow both wet-season and dry-season rice. Wet-season rice accounted for 86% of total rice production in 2014.
Most areas are only able to cultivate a single crop each year due to poor irrigation. The majority of Lao farmers rely on seasonal rain from July to September. Wet-season rice is mostly cultivated in the central region where irrigation is more comprehensive. The government has named two central provinces, Savannakhet and Khammuane, as models for producing high-quality rice. Most small farmers own 1–3 hectares of land and produce rice mainly for domestic consumption. Farm consolidation, predominantly backed by foreign investors, has been rising in recent years.
Cassava, whose output has steadily increased, is another key crop accounting for 17% of total production in 2013. It was traditionally grown as a main food source by ethnic groups in mountainous regions. More recently, it has become a cash crop for smallholder farmers who supply cassava root to local processors. Key cassava production provinces are Vientiane Capital, Borikhamxay and Xayabury, where it is grown as industrial crop for starch and alcohol production. Despite relatively low yields resulting from poor farming knowledge, Lao PDR has emerged as the world’s fourth largest exporter of cassava chips and pellets in 2015.
Maize is another important crop for LaoPDR, accounting for 14% of crop production in 2013. About 71% of maize plantations are located in the northern Mekong region and mountainous parts of the country.
Xayabury, Oudumxay and Xiengkhuang, the leading maize provinces, combined account 57% of total maize production. Lao farmers grow native maize as source of additional income. Some maize production is used to supply local animal feed mills with the majority exported to neighbouring countries. Despite maize production increasing by 8% in 2013, most animal feed is imported industrial from Thailand and China due to uncompetitive domestic supply, where processing costs make pricing high. The lack of government support or sufficient incentives to attract private investment means the sector currently only comprises small and medium size enterprises.
Culti
vatio
n Ar
ea (h
a)Pr
oduc
tion
(ton)
Yiel
d (to
n/ha
)
Rice Cultivation Area (ha) Rice Production (ton) Yield (ton/ha)
20052004 2006 2007 2008 2009 2010 2011 2012 2013 2014
1.01,000,000
2,000,000
3,000,000
4,000,000
5,000,000
2.0
3.0
4.0
5.0
Unlocking the Opportunities for Crop Science Products in CLMV

Unlocking the Opportunities for Crop Science Products in CLMV
Source: Lao PDR’s Ministry of Agriculture and Forestry
Source: Myanmar’s Ministry of Agriculture and Irrigation; Ipsos Business Consulting Analysis
Lao PDR’s cultivation area and yields for cassava, maize, vegetables and pulses (2003–13)
Vegetables and pulses accounted for 12% of total cultivated area in 2013. As key ingredients in the local diet, the majority of farmers grow vegetables and pulses in their home gardens. As a result, the average cultivated land used for vegetable cultivation per farmer is relatively low. In general, vegetables and pulses are substitute crops grown in paddy fields during dry season. In recent years, the rising price of these crops has encouraged farmers to increase production.
Myanmar
Rice is Myanmar’s key crop, accounting for 41% of total cultivated area and 53% of total crop production in 2014, in this leading grain-exporting nation. Rice cultivation is the primary source of income and plays a major role in local poverty reduction. Most rice is produced in delta areas with the Irrawaddy Delta, a vast alluvial floodplain, alone contributing 30% of rice production in 2014. Bago, Shan and Sagaing are other key producing areas with a combined output of 36% of the total.
Breakdown of key crop production in Myanmar (2014)
14
Culti
vatio
n Ar
ea (h
a)
Yiel
d (to
n/ha
)
Rice
Sugarcane
Pulses
Oilseed crops
Maize
Other
20052004 2006 2007 2008 2009 2010 2011 2012 20132003
Maize Cultivation Area (ha)Vegetable and Pulse Yied (ton/ha)
Vegetable and Pulse Cultivation Area (ha)
Cassava Cultivation Area (ha)
Cassava Yield (ton/ha)Maize Yield (ton/ha)
-
60,000
0.0
6.0
12.0
18.0
24.0
120,000
180,000
240,000
50.1 mntons 53%
22%
9%
5%3%
8%

Unlocking the Opportunities for Crop Science Products in CLMV
In 2014, Shan province yielded the highest rice production of 5.7 tons per hectare, significantly higher than the national average 3.7 tons per hectare. Despite favourable growing conditions and abundant water resources, Myanmar’s rice yields are lower than other CLMV countries, apart from Cambodia. Ineffective farming practices and low labour productivity are the main causes. Output is also affected by extreme weather events, such as floods and low rainfall resulting from El Nino Southern Oscillation in 2015. Climatic variation presents a major challenge to agricultural productivity and food security in Myanmar.
Myanmar’s rice cultivation area and rice production by province (2014)
Rice cultivation and yields in Myanmar, (2004–14)
15
Source: Myanmar’s Ministry of Agriculture and Irrigation; Ipsos Business Consulting Analysis
Culti
vatio
n Ar
ea (h
a)Pr
oduc
tion
(ton)
Yiel
d (to
n/ha
)
Rice Cultivation Area (ha) Rice Production (ton) Yield (ton/ha)Yield (ton/ha)
20052004 2006 2007 2008 2009 2010 2011 2012 2013 2014
1.05,000,000
10,000,000
15,000,000
20,000,000
25,000,000
30,000,000
35,000,000
2.0
3.0
4.0
5.0
6.0
7.0
Rice cultivation area, 2014 Total 7.2 mn hectares
Rice production, 2014Total 26.4 mn tons
North Region
East Region
West Region
Central Region
South Region
Southeast Region
Source: Myanmar’s Ministry of Agriculture and Irrigation; 2013/2014 Myanmar Agricultural Survey; Ipsos Business Consulting Analysis
550
SagaingKachin
Shan
RakhineChin
Magway
Mandalay
Ayeyarwady
Bago
YangonKayin
Mon
TanintharyiKayah
2,212
550
2,6931,382
1,070115
746
6,792
3,386
1,706795 886 324 122
Cultivation Area (’000 hectare) Production (’000 ton)
181 291 107 40778
455 352 245
2,015
1,225561
26238

Unlocking the Opportunities for Crop Science Products in CLMV
Myanmar farmers also grow a wide variety of other crops, such as pulses (eg green gram, black gram, pigeon peas and chick peas) and oilseed crops (eg groundnuts, sesame and sunflowers). Pulses are typically grown in central and southern regions, which account for 68% of the total cultivated area of pulses. The crops are sown in November and harvested in March. Magway, Mandalay, Bago and Irrawaddy are the main pulse production areas.Sagaing, a dryland region between the Irrawady and Mu rivers, is another key producing area where rice can be grown during wet and dry seasons.
As the world’s second largest exporter of pulses, Myanmar exports crops to India, China, Thailand, Bangladesh and UAE.The export value of pulses exceeds that of rice some years.
Oilseed crops are also primarily grown in the central region, with production focused in Mayway, Mandalay and Sagaing. In 2014, these three locations combined accounted for 84% of the cultivated area for oilseed.
Despite only accounting for one per cent of Myanmar’s total cultivated area, sugarcane generated 22% of total crop production in 2014. The crop is widely grown in Sagaing, Shan and Bago provinces as a raw material for sugar mills. In 2014, Myanmar had a high sugarcane output of 90 tons per hectare compared with 77 tons per hectare in Thailand.
Myanmar was the sixth largest exporter of unprocessed sugarcane in the same year mainly thanks to high demand from China. Some local traders even imported sugar from Thailand to re-export to China.
Myanmar’s cultivation area and yields for oilseed and pulses (2004–14)
16
Source: Myanmar’s Ministry of Agriculture and Irrigation; Ipsos Business Consulting Analysis
Culti
vatio
n Ar
ea (h
a)
Yiel
d (to
n/ha
)
Oilseed Crops Cultivation Area (ha)
Pulses Cultivation Area (ha)
Pulses Yield (ton/ha)
20052004 2006 2007 2008 2009 2010 2011 2012 2013 2014
1.2
0.8
0.41,000,000
2,000,000
3,000,000
4,000,000
5,000,000 2.0
1.6
Oilseed Crops Yield (ton/ha)

Unlocking the Opportunities for Crop Science Products in CLMV
The Mekong River Delta is home to the country’s largest rice growing area, outperforming other regions by far with its 2015 production of 25.7 million tons. The North Central, Central Coastal and Red River Delta regions are other key rice producing areas. The Mekong Delta Region’s rice yield is 6 tons per hectare compared to the national average 5.8 tons per hectare.
Rice produced in this area is of the highest quality making it ideal for international markets and accounts for about 90% of total export volume. Conversely, most rice grown in the Red River Delta is for domestic consumption.
Vietnam’s Rice cultivation area and rice production by province (2015)
Vietnam
Vietnam, with its fast-growing population and higher consumer spending on food and food ingredients, which is forecast to rise by 8% a year until 2019, presents a key regional market for agro-products and developing agricultural production. Rice is the main crop in terms of both cultivated area and production, followed by maize and cassava.
Breakdown of key crop production in Vietnam (2015)
17
Rice cultivation area, 2015 Total 7.8 mn hectares
Rice production, 2015 Total 45.2 mn tons
Source: Vietnam’s General Statistics Office; Ipsos Business Consulting Analysis
Source: Vietnam’s General Statistics Office; Ipsos Business Consulting Analysis
Rice
Sugarcane
Cassava
Maize
Rubber
Others
85.8 mntons
53%
12%
21%
6%1%7%
Northwestern
Cultivation Area (mn hectare) Production (mn ton)
Northern (Red RiverDella)
Northern Central Central South East Mekong River Delta
0.7
3.36.7 6.9
1.2 1.4
25.7
1.1 1.2
4.3
0.2 0.3

Unlocking the Opportunities for Crop Science Products in CLMV
Rice-growing seasons vary by region. Most farmers in the North grow two crops a year. The better-irrigated areas in the South support three crops a year. The winter/spring and summer/autumn seasons are normally longer and offer higher yields than the winter season due to the higher level of rainfall they receive. Limited irrigation and less favourable topography in other regions restrict farmers to a single annual crop.
Vietnam is the world’s third largest rice exporter, shipping 8.4 million tons in 2015. Key markets are China, the world’s largest rice importer, which accounts for one-third of Vietnam’s rice exports, followed by the Philippines and Ghana. Rising regional and global rice demand will support rising production in coming years. The government’s push to expand cultivated areas and introduce more hybrid rice varieties by 50% to further increase Vietnam’s export competitiveness will help support rising demand.
However, Thailand’s major comeback in international rice markets after the expiry of its populist Rice Pledging Scheme, which dampened its exports from 2011–14, will present a considerable challenge to Vietnamese rice exports. Rice production in Vietnam is forecast to grow steadily at 1.3% a year until 2020. Key drivers are population growth and rising export demand. Dry weather resulting from El Niño poses a risk to production over the next two years. The Ministry of Agriculture and Rural Development’s plan to shift rice production to other cash crops in some areas will likely cause a slight downturn in long-term rice productivity.
Rice cultivation area and yields in Vietnam (2005-15)
18
Source: Vietnam’s General Statistics Office; Ipsos Business Consulting Analysis
Prod
uctio
n (to
n)
Yiel
d (to
n/ha
)
10,000,000
20,000,000
30,000,000
40,000,000
50,000,000
60,000,000
2005 2006 2007 2008 2009 2010 2011 2012 2013 2014 2015
1.0
Rice Cultivation Area (ha) Rice Production (ton) Yield (ton/ha)
2.0
3.0
4.0
5.0
6.0

Unlocking the Opportunities for Crop Science Products in CLMV
Source: Vietnam’s General Statistics Office; Ipsos Business Consulting Analysis
Coffee has become one of the country’s key export commodities, contributing 18.4% of total export revenue for agro-products in 2015. The cultivated area for coffee has increased from 42,000 hectares in 1995 to 645,200 hectares by 2015. Robusta accounts for about 95% of total output.
Robusta is mainly grown in DakLak, Lam Dong, DakNong and Gia Lai provinces. Da Lat is focused on producing the premium arabica variety. Despite being the world’s largest robusta producer and exporter, Vietnam’s coffee production will expand at a slow pace in the near term due to falling global coffee prices and weaker demand for robusta.
Poor rainfall in major coffee-growing regions have compounded the problem of stagnant prices for the bean for growers. Production is forecast to grow at the mediocre annual pace of 0.8% for the next four years as a result. On the upside, Vietnam’s coffee sector is supported by the government. As part of Hanoi’s plan to improve exports and move coffee up the value chain by focusing on higher-value processed products, arabica is targeted to account for 8% of the total cultivated area for coffee by 2020.
Maize is another major crop in Vietnam (the second-largest in terms of cultivated area) because it is an essential ingredient for livestock and aquaculture feed. In fact, robust expansion of the livestock and aquaculture industries has driven imports of the grain to meet domestic demand over the past three years. Reducing feed production costs by increasing domestic maize production is one of the government’s goals. They have incentivised rice farmers to switch to cultivating maize or soybean with a subsidy of USD88.9 per hectare for fixed costs (seeds, fertilisers and pesticides) and USD31.0 per hectare for land preparation costs. This helped increase maize production by 6% in 2014. The policy will help keep domestic production strong in the coming years.
Cassava is Vietnam’s third-largest crop with production output of 10.5 million tons in 2015. It is mostly grown in the North Central and Central coastal areas. Cassava production has increased steadily over the past four years with exports rising by a compound annual growth rate (CAGR) of 17.3% a year from 2010–15. The value of cassava exports decreased slightly during the first few months of 2015 due to an increase in export tax from zero to 5%. The government eventually suspended the export tax on cassava to enhance increase the country’s competitiveness. Stagnant economies in China and Korea, major importers of Vietnamese cassava, further dampened international shipments of the commodity.
Vietnam’s cultivation area and yields for maize and cassava (2005–15)
19
Culti
vatio
n Ar
ea (h
a)
Yiel
d (to
n/ha
)
Maize Cultivation Area (ha)
Cassava Cultivation Area (ha) Maize Yield (ton/ha)Maize Yield (ton/ha)
2005 2006 2007 2008 2009 2010 2011 2012 2013 2014 2015
5.0300,000
600,000
900,000
1,200,000
1,500,000
10.0
15.0
20.0
25.0
Cassava Yield (ton/ha)Cassava Yield (ton/ha)

Unlocking the Opportunities for Crop Science Products in CLMV
Yields for major industrial crops have in recent years declined slightly across the CLMV due to pests and disease, decline in soil fertility, and use of low-quality agrochemical products such as fertilisers and insecticides. As a result, there have been numerous efforts from governments and NGOs to mitigate the decline by educating farmers on how to modernise and improve farming practices while more strictly regulating their activities. In addition, international agrochemical companies have been trying to expand their businesses in these markets due to their emerging demands and potential for farmers to increase their use of such products.
CambodiaCrop diversification and the introduction of new crops resulted in more frequent pest outbreaks in Cambodia. Farmers have started using more chemical crop protection products, notably insecticides, to mitigate the issue. There is no pesticide manufacturing plant in Cambodia, despite rising demand for the product in recent decades. The majority of pesticides are imported legally and illegally from neighbouring countries, such as Thailand and Vietnam, with others sourced from China and Europe. Methamidophos and Abamectin are among the most commonly used pesticides. Some highly popular insecticides, such as Methyl Parathion and Mevinphos, are classified as extremely toxic by the WHO and are banned in Cambodia.
No pesticide products enjoy strong brand awareness or preference in Cambodia, an Ipsos Business Consulting survey found. Most farmers choose pesticides according to their quality and price.
Some 56% of surveyed farmers did not remember the brand of pesticides they use, or they purchase unbranded products. Retailers have a strong influence over Cambodian farmers and many tend to recommend unbranded products. This trend also reflects local farmers’ poor knowledge of pesticides and the lack of training in the proper use of chemicals, including managing potential health risks. Nevertheless, there is a strong outlook for the pesticides market, especially insecticides, because of farmers’ positive perception of the efficacy of crop protection products. All respondents who were currently using insecticides said they would continue to do so in the future. However, the forecast for fungicides and herbicides is less certain due to current low adoptions rates.
Note: Lao PDR and Myanmar’s figures are estimated from the data in 2014.
Average rice yield in Thailand and CLMV (2015)
Crop growing practices and distribution of agrochemicals
20
2.00
1.00
3.00 2.9 3.1
4.2
3.7
5.8
4.00
5.00
6.00
7.00
CambodiaThailand
Rice
Yie
ld (t
on/h
a)
Laos Myanmar Vietnam
Size of Rice Production Average Yield

Unlocking the Opportunities for Crop Science Products in CLMV
Continuous cultivation of crops in the same area for long periods of time without the use of fertilisers has caused an overall decline in soil fertility. This is especially common in lowland areas of Kampong Cham province, which traditionally has highly fertile red basaltic soil. Another factor is soil erosion, which is commonplace in regions with high rainfall where crops are grown on hillsides. To counter falling soil quality, the government has launched many policies to promote the use of fertilisers and the market is evolving to meet the resulting higher demand.
Cambodia’s fertiliser market, estimated at 750,000 tons a year, is currently dominated by Thai and Vietnamese imports. There is no domestic fertiliser manufacturing. Most of the 86 private companies competing in the fertiliser market are located in Phnom Penh, Kandal, Takeo and Battambang. Five Star International Fertilizers, a joint venture between Vietnam’s Five Star International Group and Cambodian’s Investment and Development Company located in Kandal, is the country’s only fertiliser blending plant. It produces 160,000 tons of NPK fertiliser a year, of which 140,000 tons are sold. Taiwan Fertiliser Company, a Taiwanese manufacturer and seller of fertilisers and chemical products, entered the market in 2015. The company built a warehouse in Preah Sihanouk and is expected to set up a production at a later stage to increase its competitiveness as shipping costs for raw materials are reportedly cheaper than those for final products.
Cambodia’s crop science market consists of a network of international producers and traders, Thai and Vietnamese producers and traders, importers, local distributors, and retailers at the provincial, district and village levels. Most products are imported overland through the Poipet border with Thailand, and Bavet and Kaam Samnor entry points from Vietnam. Some goods are imported by sea, landing at Sihanoukville, Cambodia’s only deep-water port. Agrochemical importers must register with the Ministry of Commerce to obtain official trade permits and with the Ministry of Agriculture, Forestry and Fisheries for product licenses. Importers can also act as distributors and transport products to provincial retailers, who distribute to district and village retailers. Currently, there are three major players in the fertiliser market: Binh Dien (Binh Dien brand), Five Star International Group (Five Stars brand) and Petro Vietnam (Ca Mau brand).
Ipsos Business Consulting’s survey found NPK fertilisers the most commonly used type of fertiliser. The level of fertiliser use varies by crop and season. Farmers tend to use more fertiliser for rice and vegetables during the dry season. The survey also revealed increasing fertiliser consumption and a slight shift over the past three years from natural to chemical fertilisers. About 15% of respondents still use natural fertilisers, mainly for fruit or vegetables grown on small areas of less than 5 hectares. Most farmers now believe chemical fertilisers will improve crop productivity with about 80% saying they will continue using chemical fertilisers in the future.
In addition, 90% of farmers, even those with large farms, normally purchase fertilisers from village shops or small shops in nearby markets.
Famers consider village retailers convenient one-stop shops as they sell a wide range of farming products such as seeds, fertilisers, crop protection products and animal feed. Credit is used for about half of the transactions at these shops. Purchasing directly from regional distributors is a rare practice in Cambodia. The study also shows Cambodian farmers have a strong preference for Thai fertilisers with farmers prepared to pay a premium price 20% higher than fertilisers from other countries.
A number of other factors are also driving changes in local farming practices, such as climate change, a better understanding of modern crop growing methods, shortage of rural manpower, misperception of the role of pesticides as plant medicine and growth stimulator, more advertising of farming products, and the rise of foreign companies giving away free samples of broad-spectrum pesticides.
21

Unlocking the Opportunities for Crop Science Products in CLMV
Source: Cambodia Development Research Institute (CDRI), Ipsos Business Consulting Analysis
Market structure of Cambodia’s crop science products
22
Fertiliser raw materialimporter
Fertiliser blending plant
Product importer
Repackaging plant
Distributors
Provincial retailer
District and village retailers
Crop protection product flowFertiliser flow
Farmers
International manufacturers and traders(China, India, Russia, EU, USA)
Thai and Vietnamesemanufacturers and traders

Unlocking the Opportunities for Crop Science Products in CLMV
Lao PDR
NGOs and the government in recent years have made many attempts to develop better farming practices in Lao PDR. Key initiatives have included transitioning from subsistence agriculture to commercial agriculture, shifting from natural resource depletion to agriculture development, increasing market access for local farmers and improvement of agricultural infrastructure, such as water management. These efforts aim to improve income for farmers, stabilise Lao PDR economic growth and increase its export competitiveness. The plans not only seek to sustainably improve yields and production, but also increase the quality of agricultural products.
All surveyed farmers in the central and southern regions used fertilisers — 36% used only chemical fertilisers, 4% used only organic fertilisers while 60% used both. Most farmers said they expect to follow government guidance to increase the proportion of organic fertilisers they use in coming years. Higher use of fertilisers is partly due to more farmers working as contract growers for local and international agricultural concessions which are currently focused on rubber, sugarcane and coffee. Mitr Phol, a Thai company, invested more than US$100 million in 2015 to double their sugar production in Lao PDR. About 30% was allocated to develop farm production in Savannakhet. The project encouraged local farmers to grow sugarcane on the earmarked land for sale to the existing Mitr Phol facility in exchange for technical advice and equipment and the provision of seeds and fertilisers at an agreed price.
Despite government efforts to promote organic agriculture, farmers, especially those growing temporary crops, still prefer chemical fertilisers. Chemical fertilisers, most of which are imported from China, are seen as cheap, readily available and easy to use. The shift from subsistence to more commercial farming, and the influx of foreign investment into Lao PDR agriculture will see the use of chemicals rise. The expansion of Chinese banana plantations in northern region over the past few years is one example of how the use of pesticides and chemicals are introduced to local farmers en masse. Ipsos Business Consulting found the proportion of Lao farmers using chemical fertilisers increased considerably from 2005 to 2015. The same survey also found that while only 27% of the traditional Lao rice producers use chemical fertilisers, 67% of that group have also started using high-yielding hybrid rice seeds in order to boost production.
There is also significant demand for other agrochemicals in Lao PDR, especially insecticides and herbicides. However, the market is chaotic as agrochemical sellers and most farmers lack product knowledge. Poor education means misuse of agrochemicals, and the corresponding environmental damage, is commonplace. Despite chemical pesticides being banned in some regions, farmers can still easily buy the products and typically use much more than the recommended amount.
One example is the wide use of Paraquat — a broad spectrum / non-selective herbicide banned in Lao PDR and most countries — for growing maize in the north. Our survey also found many farmers are sceptical about using alternatives to agrochemicals. Farmers expect the use of non-selective pesticides to continue rising.
Farmers generally buy fertiliser and crop protection products from nearby village shops or from retailers in Thai border provinces, such as Ubon Ratchathani. Few distributors deliver products directly to farms. Some companies have started promoting their products by offering free samples to farmers. Transactions are predominantly paid in cash, our study found. Lao farmers also have a strong preference for Thai fertilisers and they are willing to pay prices that are 20% higher than fertilisers from other countries.
Lao PDR does not produce active ingredients used in pesticides neither does it have any local manufacturing capability. All pesticides are imported as formulated products, primarily from Thailand, China and Vietnam. Registered private companies are the main channels for importing pesticides, however, large quantities are brought in through contract farming and smuggling. While local regulations for pesticides exist, enforcement is weak and most products are undocumented and imported without official records. The country’s long, porous borders make it difficult for the authorities to curb illegal imports.
There are many small-sized repackaging plants of fertilizer in Lao PDR. Meanwhile, Lao PDR is also considered as one of the largest potash exporters in Southeast Asia, with China being its main export destination. Most of potash mines are the Chinese-invested companies. The combined annual production capacity of Lao potash producers is expected to be in the range of 4.0-7.0 million tons, nevertheless the content of its current KCl production is still relatively lower than other global producers.
Recent efforts to increase the technical knowledge of Lao farmers have resulted in an increase in imports of higher-quality seed, such as MX10 and LVN10 maize seeds from Thailand and Vietnam, respectively. Lao farmers are expected to start commercially producing hybrid seeds in the near future which will enable them to reduce costs and better cope with droughts.
23

Unlocking the Opportunities for Crop Science Products in CLMV
Source: Ipsos Business Consulting Analysis
Market structure of Lao PDR’s crop science products
24
Local fertiliser manufacturer
- Organic- Potash (K)
Concession company(offers contract farming)
International manufacturersand traders
(China, Thailand, Vietnam)
Distributors
Provincial retailers
District and village retailers
Farmers
Fertiliser Flow Crop protection product flow
Product importer
Repackagingplants

Unlocking the Opportunities for Crop Science Products in CLMV
Myanmar
Despite having once been the world’s leading rice exporter, Myanmar no longer produces enough of the grain to meet its growing domestic demand. Low levels of mechanisation and poor farming practices further limit output in a country where most farmers are smallholders with limited resources to improve their productivity. Their small-scale operations mean they have limited bargaining power when purchasing agrochemicals and lack sufficient revenue to purchase farm machinery.
Fertilisers are widely used in Myanmar, however, quantities are relatively low when compared with neighbouring countries such as Thailand and Vietnam. Annual domestic demand for fertiliser peaks from July to October (rice-growing season). Myanmar farmers typically do not form co-operatives and therefore tend to buy fertilisers and crop protection products directly from agrochemical companies or their distributors. Most rice farmers only use urea because it is cheaper than other fertilisers and its effects are visible within a few days of application. Urea accounted for about 60% of fertiliser demand in 2015, followed by NPK compound at 30%. Fertiliser use increased by about 10.2% a year from 2013–15, however, price remains the major barrier to more rapid growth. High prices are mostly the result of insufficient domestic fertiliser production and difficulties in importing and distributing fertilisers across the country. Also, the hike in fertiliser prices during 2015 was partly due to the devaluation of the Myanmar kyat.
Only three of the five state-owned ammonia urea plants, all of which powered by local natural gas, are currently operating. Furthermore, their annual production has fluctuated due to the inconsistent supply of natural gas over the past four years and the plants’ old equipment, poor energy efficiency and low capacity. Domestic and Chinese fertiliser brands are popular due to their relatively low prices. Domestic urea generally costs 10% less than imported urea. China’s proximity to Myanmar helps keep the cost of its fertilisers down. Chinese manufacturers can also deliver their products more rapidly. However, many large-scale farms often rely on poor quality smuggled fertilisers because they are much cheaper.
Limited use of crop protection products is seen as a key cause of Myanmar’s low agricultural output. Local pesticide usage, while rising rapidly, only accounts for about 10% of Thailand’s, while Myanmar’s farming areas is only 20% less. Myanmar’s pesticide market relies heavily on exports from Thailand, Vietnam and China. Agriculture Ministry statistics value the local agrochemical market at about US$500 million with growth expected to continue for the next three to four years. Insecticides (used by 62% of farmers) were the most widely used pesticide in 2014, followed by herbicides (22%) and fungicides (16%). As with fertilisers, many Myanmar farmers use domestic and Chinese crop protection products because they are much cheaper than other options.
Rising demand for fertilisers and crop protection products in Myanmar has attracted international manufacturers to invest in manufacturing facilities and warehouses for product distribution. Most investment is from Thailand, Japan and China. Local partners help accelerate company registration and application processes, as well as supporting product distribution. While most Myanmar farmers have limited knowledge about good farming practices, understanding the requirements of local retailers is essential to ensure product availability and prioritise resources for sales and marketing efforts in high potential areas.
25

Unlocking the Opportunities for Crop Science Products in CLMV
Vietnam
Improving agricultural productivity is a critical food security issue for Vietnam where the population is forecast to top 103 million by 2030. Local farmers started using fertilisers and pesticides in the 1970s and adoption has grown dramatically ever since the 1980s. A recent study by Ipsos Business Consulting found chemical fertiliser consumption remained relatively strong from 2013 to 2015. Organic fertilisers, which only arrived in the market relatively recently, are becoming more popular with some farmers though many remain sceptical about the efficacy of organic products to nourish soil.
Nitrogen, phosphate and potassium fertilisers, and mixed fertilisers (NPK, DAP, MAP and SA) are commonly used in Vietnam. NPK fertilisers account for 38–40%, followed by urea and phosphate. The highest demand for fertiliser is during the long winter/spring growing season. Local fertiliser manufacturers have grown rapidly over the past few years to serve rising domestic demand. The country’s urea market reached a milestone in 2013 when domestic supply outpaced demand raising prospects for exports. Two existing plants coupled with two new facilities (in Ca Mau and Ninh Binh) produced 2.36 million tons of urea, more than double the output in 2011. However, the lack of local potassium supply means the sector relies heavily on imported raw materials for both SA and potassium fertilisers.
In 2015 the volume and value of fertiliser imports increased by 20% and 15% from the previous year, respectively, with SA accounting for 1.05 million tons or 23% of total imported volume. Despite domestic oversupply, Vietnam still imports small amounts of urea from China whose prices are US$0.02–0.04 per kilogram cheaper. Local farmers’ growing loyalty towards domestic brands, such as Ca Mau, Phu My and Binh Dien, is expected to see Chinese urea imports decline over the next few years. Not only do locally made fertilisers enjoy strong brand recognition supported by positive word-of-mouth recommendations, they are also competitively priced and widely available. Combined, these attributes will continue to win-out against the bargain price of Chinese fertilisers and counterfeit and low quality products in the market. Crop protection products have experienced an increase in demand similar to fertilisers. The need for farmers to improve crop yields and pest management were key drivers of this growth. In 1991, only 77 chemical crop protection products were allowed for agricultural use. This list of approved pesticides rose to 1,001 products (437 insecticides, 304 fungicides and 160 herbicides) by 2010, and reached 1,634 in 2013. The imported volume of pesticides rose from 6,500 to 9,000 tons a year in 1985 to more than 110,000 tons in 2015.
Pesticides are used more widely around the Mekong Delta than in any other region of Vietnam as farmers use more intensive practices and grow focused crops, such as rice. Ipsos Business Consulting’s recent survey found farmers are highly likely to use more than the recommended amount of pesticides when treating their crops.
Some farmers increase the frequency and dosage if they do not observe significant outcomes within a reasonably short time after applying the product. Other groups of farmers said they mix two or more different types of pesticides because they believe such practices increase product effectiveness while reducing costs and time.
Word of mouth remains a key factor influencing the products farmers choose and the practices they adopt. Most of the interviewed farmers choose selective over non-selective pesticides. Recommendations from distributors and retailers hold significant sway regarding the brands farmers select, along with price and quality. However, according to our recent survy less than one-fifth of farmers could recall the brand of pesticide they use, indicating a lack of product and brand knowledge.
Fungicides are the largest pesticide segment, accounting for 36% of the US$600-million market in 2014, followed by insecticides (33%) and herbicides (31%). Use of herbicides is forecast to grow by 11% yearly from 2015–18. 2,4D (short for 2,4-dichlorophenoxyacetic acid) is the most popular selective herbicide due to its effectiveness, wide availability and affordable price, as well as offering broad-spectrum protection while being relatively safe to handle with a lower environmental impact than other products. However, due to its impact on human health, the government banned 2,4D since early 2017. Fungicide use has increased moderately in recent years and the category is expected to grow by 9.0% over the same period. Fungicides with tricyclazole have been used extensively to control outbreaks of rice blast, which devastated 11,000 hectares of rice in 2013. Agrochemical multinationals led by Syngenta, Bayer and Arysta Life Science controlled about 37.2% of Vietnam’s crop protection market. Viet Thang Plant Protection, a leading local manufacturer, is well known for its non-selective herbicides Kanup 480SL and Gfaxone20SL.
26

Unlocking the Opportunities for Crop Science Products in CLMV
Governments across the CLMV have implemented numerous policies to support agriculture, which remains a major employer in these countries. The sector relies heavily on government support to improve the development of farming technology and enhance farmer’s knowledge to increase productivity. CLMV countries also have quality soil suitable for crop production and their agriculture sectors are expected to grow to support economic expansion and higher demand for food as their populations increase.
Key government policies in each CLMV country are detailed in the following table.
Green signifies positive impact; Red signifies negative impact
How government policies affect the agrochemical industry
27
Cambodia Impact on the
agrochemical industry
Policy to promote paddy production and rice exports • Simplify import procedures for fertilisers to support growing
demand for crop production • Provide tax incentives for rice farming — input VAT related for
rice farming is creditable or refundable. Input VAT for importing production inputs and equipment to produce milled rice for export is subsidized by the government
• Provision of high quality seeds and fertilisers •
Industrial development policy • Fees for unloading cargo reduced by 5% in Sihanoukville and
Phnom Penh Autonomous ports. This will lower logistics costs for distributing agrochemicals and related products to other regions
Free-market for agrochemical and farm machinery products
• End of protectionist policy to restrict imports or shelter domestic producers. Free-trade is supported by the removal of tariffs for imported agricultural inputs, including agricultural machinery and milling equipment • No
Overall impact
Lao PDR Impact on the
agrochemical industry
Infrastructure development through government-to-government support
• The Lao and Chinese governments are jointly constructing a railway between the two countries. This will increase opportunities for Chinese investment in Lao PDR and drive the development of farming technology across the country
•
Government emphasis on developing organic agriculture • Government initiatives — including setting up bio- fertiliser
factories, promoting bio-pesticides and establishing Lao Organic Agriculture Standards — seek to move the country towards organic agriculture. This may have a limited impact on the industry in the near future, however the policy could have a negative impact on the sector in the longer term
Overall impact
Impact Level: Low Medium High Very High

Unlocking the Opportunities for Crop Science Products in CLMV 28
Myanmar Impact on the
agrochemical industry
Border trade restriction • Some border trading stations were closed in an attempt to
curb unregulated trade and illegal imports from neighbouring countries
• This will decrease the prevalence of low-quality agrochemical products which will benefit the industry in the long run
Financial support from the government • To boost rice exports, rice farmers can access credit up to
US$256.25 per hectare for a maximum 4 hectares from the government-owned Myanmar Agricultural Development Bank
• LIFT (Livelihoods and Food Security Trust Fund) launched a financial inclusion programme from 2015–18 to increase Myanmar’s agricultural production by providing low-interest credit to framers
Land development policy • The policy will convert unused arable land to cultivated land to
drive the expansion of farmland and crop production
Overall impact
Vietnam Impact on the
agrochemical industry
Increase rice export to Taiwan, Hong Kong, Malaysia, Singapore, United Arab Emirates, US and Australia
• Increase the value of rice exports to an average annual US$3 billion by 2017 and US$3.5 billion by 2020
• Build the Vietnamese rice brands to increase product value
Government Decree 202/2013/ND-CP on fertiliser management • Enforce the licensing of fertiliser factories to regulate product
quality • Restrict the use and marketing of fertilisers that fail to meet
National Technical Regulations • Stricter controls to prevent imports of fake fertiliser to
increase the confidence of farmers in using authentic products
Increase FDI in agriculture • The Ministry of Agriculture and Rural Development has drafted
a strategy to increase FDI in Vietnam’s farming, forestry and fishery sectors
to US$5 billion in 2020 and US$8 billion by 2030
3 Reductions, 3 Gains policy • The policy seeks to reduce production costs by reducing the
variety of seeds, fertilisers and pesticides used. The three gains focus on increasing productivity, quality and profit. This expects to decrease the unnecessary use of agrochemical products in the country which will negatively affect the industry in the short term
Overall impact

Unlocking the Opportunities for Crop Science Products in CLMV
CLMV countries present solid growth opportunities for agribusiness companies looking to expand in ASEAN, according to our recent survey. Taking consideration of the value of the agricultural sector, crop production, and cultivation area, Vietnam and Myanmar are particularly promising compared with Cambodia and Laos PDR.
Supporting facts underlining our go-to-market recommendations in this region are:
Rising demand for crop science products to increase crop productivity for both domestic consumption and exports. Foreign direct investment into Myanmar increased after the country opened its economy, driving demand for a wider range of higher quality food products from the local middle class and expatriates. Cambodia and Vietnam have also increased rice exports. CLMV presents stronger growth in both crop production and cultivated areas than other Asia-Pacific markets. This growth will stimulate demand for crop science products such as seeds, fertilisers and insecticides.
Market development of agricultural farming technologies and crop sciences across the CLMV is still in the early stages. Apart from Vietnam, the adoption rate for mechanised farming and crop science products is low.
Most CLMV countries are also challenged by the prevalence of low-quality counterfeit products which hampers efforts to increase yields. Improving access to quality products creates growth opportunities for existing players and new brands seeking to enter these markets.
Government policies support agricultural development. Government support is critical to the agricultural sector’s success as the majority of farms across the region are small to medium-sized and farmers have limited knowledge of good agricultural practice. Access to funding is essential to improve productivity. Governments in these countries have encouraged both local and international companies to invest in setting up manufacturing facilities and / or to distribute quality crop science products to farmers. As a result, we forecast an increase in joint ventures between international brands and local companies across the CLMV.
Agricultural sector among Thailand and CLMV
Leveraging growth opportunities across the CLMV
29
Production (mn ton)
Cultivation Area (mn ha)
250.0
200.0
150.0
100.0
50.0
0.00.0
Thailand Cambodia Lao PDR Myanmar Vietnam
5.0 10.0 15.0
Size of bubble indicatesthe Agricultural Sector GDP
20.0 25.0 30.0
Conclusion and recommendations

Unlocking the Opportunities for Crop Science Products in CLMV
Ipsos Business Consulting has identified four strategic levers for crop science companies to review their market-entry strategies and seize these opportunities.
1. Customer understanding – identify customer pain points in different market segments.
There is still a large variation in farming practices and customer behaviour across the CLMV. Use of crop science brands remains fragmented and is mostly influenced by retailers. Understanding current farming practices of different farmer segments will allow brands to develop competitive product portfolios that truly respond to customer needs.
2. Value proposition — have a clear and distinctive proposition to connect with target customers.
Widespread availability of counterfeit and unbranded crop science products in these markets means it is vital for brands to clearly communicate their value proposition. However, they must first accurately identify target customers and develop a staged-approach, as it will be difficult to capture the whole market in one go.
3. Distribution channels — optimise resources to reach high-value customer segments.
Even though high growth opportunities exist in this region, CLMV countries still have poor infrastructure for product delivery outside of their capitals. As a result, in order to optimise their logistical and inventory costs, most local players have limited geographical footprints. For international players entering these markets, prioritising high-value customer segments and deploying resources to target them will be critical.
4. Entry model — identify effective partners and collaboration models.
This is essential for both international and local companies wanting to expand their business in the region. International companies will need effective local partners to leverage their understanding of the local market and distribution support, as well as to communicate with localstakeholders in their own language. Having a reliable local partner who can work with local government and logistic service providers will accelerate the implementation of go-to-market strategy and increase the likelihood of success. Meanwhile, local companies should also seek international partnerships for advanced knowledge transfer on products and farming technologies and to strengthen their marketing activities.
Four strategic levers for entering the CLMV crop science market
30

GO-TO-MARKET
Preparing for market entry has never been so complex. The rise of global connectivity, both online and in terms of real-world trade infrastructure, means that businesses need to adapt to rapid changes throughout the world of commerce. New trade partnerships allow competition to come from all sides, e-commerce requires a revolution in logistics, and the rise of internet advertising demands mastery of this new media platform.
These new market realities affect consumer preferences in terms of products and their method of purchase, advertising models, logistics in an e-commerce world, legal requirements at every step of the way, and competitors both local and overseas. Companies must remain ready to respond to real-time evaluations of sales performance, while continuing to monitor progress toward long-term goals.
Now more than ever, a detailed understanding of the market is an essential element of a winning business model. The Ipsos Business Consulting proprietary model for Go-to-Market strategy, combined with our world-class marketing research service in 88 countries around the world, puts us ahead of the pack in preparing our clients for the new realities of the global marketplace.
Ipsos begins its Go-to-Market process with a detailed assessment of the existing marketplace to identify its needs, opportunities and limitations as well as the strengths and weaknesses of competitors. We then provide a clear entry strategy based on our clients’ products and their unique selling points, identifying reliable local partners to assist in market entry.
By determining market growth potential through a realistic analysis of its drivers and barriers, Ipsos clearly maps the business landscape to show the way forward. Precise customer demographic profiles identify your target market, while a breakdown of your product value chain allows you to optimise the logistics network from end to end.
This framework allows us to identify your company’s inherent strengths, match each product to its ideal marketplace, and position your brand for maximum impact. We help you set realistic goals, whether your KPIs focus on growing your market share, increasing penetration or finding a new niche for your products. Ipsos’s own visual model to compare pilot projects in terms of cost, timescale, ease ofimplementation, and potential performance level, makes deciding on strategy a straightforward process.
With the right plan in place, we map out a realistic timeline for short, medium and long-term goals, as well as the means to measure progress towards them. Ipsos continually does due diligence on potential partnerships with other businesses, compiling easy-to-read comparative summaries that examine several key parameters in order to identify the most promising among them.
Along the way, we continually seek out strategic levers your company can use to gain a market advantage, and then we convert them into clear initiatives for fast implementation. Our Project Management Office provides you with status reports and simple dashboards so that a current evaluation of your progress is always at your fingertips.
Well-researched, comprehensive and easy to use: Our dedicated multi-level approach makes Ipsos an ideal partner for Go-to-Market in both emerging and developed markets. For more information on how you can get started on the path to market success, go to www.ipsosconsulting.com to find your nearest office.
www.ipsosconsulting.com/go-to-market
EXPERIENCE OF GO-TO-MARKET strategy in emerging and developed markets
OVER
1Market
Dynamics
2Market
Diagnostics
3Market
Assessment
4Internal
Diagnostics
5MarketEntry
6Partner
Evaluation
7Implementation
Our 7-stage
Go-to-MarketSOLUTION
20YEARS

ABOUT IPSOS BUSINESS CONSULTING
Ipsos Business Consulting is the specialist consulting division of Ipsos, which is ranked third in the global research industry. With a strong presence in 88 countries, Ipsos employs more than 16,000 people.
We have the ability to conduct consulting engagements in more than 100 countries. Our team of consultants has been serving clients worldwide through our 20 consulting "hubs" since 1994. Our suite of solutions has been developed using over 20 years experience of working on winning sales and marketing strategies for developed and emerging markets. There is no substitute for first-hand knowledge when it comes to understanding an industry. We draw on the detailed industry expertise of our consultants, which has been accumulated through practical project execution.
Founded in France in 1975, Ipsos is controlled and managed by research and consulting professionals. They have built a solid Group around a multi-specialist positioning. Ipsos is listed on Eurolist - NYSE-Euronext. The company is part of the SBF 120 and the Mid-60 index and is eligible for the Deferred Settlement Service (SRD).ISIN code FR0000073298, Reuters ISOS.PA, Bloomberg IPS:FP
Build · Compete · Grow
At Ipsos Business Consulting we focus on maintaining our position as a leading provider of high quality consulting solutions for sales and marketing professionals. We deliver information, analysis and recommendations that allow our clients to make smarter decisions and to develop and implement winning market strategies.
We believe that our work is important. Security, simplicity, speed and substance applies to everything we do.
Through specialisation, we offer our clients a unique depth of knowledge and expertise. Learning from different experiences gives us perspective and inspires us to boldly call things into question, to be creative.
By nurturing a culture of collaboration and curiosity, we attract the highest calibre of people who have the ability and desire to influence and shape the future.
Our Solutions· Go-to-Market · Market Sizing · Business Unit Strategy · Pricing· Competitive Intelligence · Forecasting · Partner Evaluation · Brand Strategy & Value· Innovation Scouting · Sales Detector· Optimal Channel Strategy · B2B Customer Segmentation
AUTHORS
Mondhita DiewvilaiSenior Consultant - ThailandE. [email protected]. +66 2 088 0108
Yan ZhuConsulting Manager - ThailandE. [email protected]. +66 2 088 0107
Natee RuengjirachupornGlobal Agribusiness Sector LeadE. [email protected]. +66 2 088 0106
Mai LeConsultant - VietnamE. [email protected]. +84 1203 955 216

CONTACT US
[email protected] www.ipsosconsulting.com Ipsos Business Consulting
GREATER CHINA BEIJING12th Floor, Union PlazaNo. 20 Chao Wai AvenueChaoyang District, 100020Beijing, ChinaE. [email protected]. 86 (10) 5219 8899 SHANGHAI31/F Westgate Mall1038 West Nanjing Road 200041Shanghai, ChinaE. [email protected]. 86 (21) 2231 9988 WUHAN10F HongKong & Macao Center118JiangHan RoadHanKou Wuhan, 430014Wuhan, ChinaE. [email protected]. 86 (27) 5988 5888
HONG KONG22/F Leighton CentreNo 77 Leighton RoadCauseway BayHong KongE. [email protected]. 852 3766 2288
INDIA MUMBAILotus Corporate Park1701, 17th Floor, F WingOff Western Express HighwayGoregoan (E), Mumbai – 400063, IndiaE. [email protected]. 91 (22) 6620 8000
GURGAON801, 8th Floor, Vipul Square B-Block, Sushant Lok, Part-1Gurgaon – 122016, Haryana,IndiaE. [email protected]. 91 (12) 4469 2400
INDONESIA
Graha Arda, 3rd FloorJl. H.R. Rasuna Said Kav B-6, 12910KuninganJakarta, IndonesiaE. [email protected]. 62 (21) 527 7701
JAPAN
Hulic Kamiyacho Building4-3-13, ToranomonMinato-ku, 105-0001Tokyo, JapanE. [email protected]. 81 (3) 6867 8001
KENYA
Acorn House97 James Gichuru Road LavingtonP.O. Box 6823000200 City SquareNairobi, KenyaE. [email protected]. 254 (20) 386 2721-33
MALAYSIA
23rd Floor, Centrepoint North,Mid Valley City,Lingkaran Syed Putra,59200 Kuala LumpurE. [email protected]. 6 (03) 2289 3000 NIGERIA
Block A, Obi Village Opposite Forte OilMM2 Airport Road, IkejaLagos, NigeriaE. [email protected]. 234 (806) 629 9805
PHILIPPINES
1401-B, One Corporate CentreJulia Vargas cor. Meralco AveOrtigas Center, Pasig City, 1605Metro Manila, PhilippinesE. [email protected]. 63 (2) 633 3997
SINGAPORE
3 Killiney Road #05-01Winsland House I, S239519SingaporeE. [email protected]. 65 6333 1511
SOUTH AFRICA
Wrigley Field The Campus 57 Sloane Street BryanstonJohannesburg, South AfricaE. [email protected]. 27 (11) 709 7800
SOUTH KOREA
12th Floor, Korea EconomicDaily Building, 463 Cheongpa-RoJung-Gu 100-791Seoul, South KoreaE. [email protected]. 82 (2) 6464 5100 THAILAND
21st and 22nd Floor, Asia Centre Building173 Sathorn Road SouthKhwaeng TungmahamekKhet Sathorn 10120Bangkok, ThailandE. [email protected]. 66 (2) 697 0100
UAE
4th Floor, Office No 403Al Thuraya Tower 1P.O. Box 500611Dubai Media City, UAEE. [email protected]. 971 (4) 4408 980
UK
3 Thomas More SquareLondon E1 1YW United KingdomE. [email protected]. 44 (20) 3059 5000 USA
Time & Life Building1271 Avenue of the Americas15th FloorNew York, NY10020United States of AmericaE. [email protected]. 1 (212) 265 3200 VIETNAM
Level 9A, Nam A Bank Tower201-203 CMT8 Street, Ward 4District 3HCMC, VietnamE. [email protected]. 84 (8) 3832 9820