Embed Size (px)
Citation preview

OPEN-TO-BUY BASICS
Presented By: Tracy Moffatt
AGM Education Team K&K Consulting

1
Calculating Average Inventory Needs
Planning Monthly Inventory Levels
Developing an Open-to-Buy plan
Managing an Open-to-Buy Plan
Average Inventory levels are determined using Cost of Sales plan and Turnover goal
“The Calculation” The CalculationCost of Sales Plan ÷ Turnover Goal =
Average Inventory Plan
This number must then be adjusted up or down for each month depending on sales curve
Calculation Cost of Sales Plan ÷ Turnover Goal = Average
Inventory PlanCost of Sales Plan $152,400
T G l 2 0÷ Turnover Goal ÷ 2.0= Average Inventory plan $ 76,200
On average, $76,200 of inventory is needed each month
Where do the numbers come from?

2
JAN FEB MAR APR MAY JUN JUL AUG SEP OCT NOV DEC DEC 31 TOTAL
RETAIL SALES LAST YEAR
2000 5000 8900 28200 31500 34500 31000 28000 19000 9000 5400 16900 219400
% TO TOTAL 0.9% 2.3% 4.1% 12.9% 14.4% 15.7% 14.1% 12.8% 8.7% 4.1% 2.5% 7.7% 100.0%
COST OF SALES LAST YEAR
2000 4000 6500 18000 22000 23000 22000 19000 13000 7000 4000 15000 155500
COS % 100.0% 80.0% 73.0% 63.8% 69.8% 66.7% 71.0% 67.9% 68.4% 77.8% 74.1% 88.8% 70.9%
ROUNDS LAST YEAR 0 0 100 2500 3500 6000 5500 4300 3200 1800 100 0 27000
RETAIL SALES / COST OF SALES / ROUNDS / INVENTORY FORECAST
$ PER ROUND $0.00 $0.00 $89.00 $11.28 $9.00 $5.75 $5.64 $6.51 $5.94 $5.00 $54.00 $0.00 $8.13
BEGINNING OF MONTH INVENTORY
56000 54000 53000 73500 94500 106500 114500 117500 116500 111500 106500 104500 90500 1199000
RETAIL SALES PLAN 1500 4500 8000 28000 33000 37000 34000 30000 19000 9000 5000 15000 224,000
% TO TOTAL 0.7% 2.0% 3.6% 12.5% 14.7% 16.5% 15.2% 13.4% 8.5% 4.0% 2.2% 6.7% 100.00%
COST OF SALES PLAN 1300 3800 6000 18000 23000 24000 22000 20000 13500 6500 3800 10500 152400
COS % 86.7% 84.4% 75.0% 64.3% 69.7% 64.9% 64.7% 66.7% 71.1% 72.2% 76.0% 70.0% 68.0%
ROUNDS PLAN 0 0 100 2500 3600 5800 5800 4300 3200 1600 100 0 27000
$ PER ROUND PLAN $0.00 $0.00 $80.00 $11.20 $9.17 $6.38 $5.86 $6.98 $5.94 $5.63 $50.00 $0.00 $8.30
COST OF SALES LAST YEAR
TURNOVER LAST YEAR
155,500
AVERAGE INVENTORY L/Y
COST OF SALES PLAN
AVERAGE INVENTORY PLAN
TURNOVER GOAL
152,400
76,200
2.0
92,231
1.7
JAN FEB MAR APR MAY JUN JUL AUG SEP OCT NOV DEC DEC 31 TOTAL
RETAIL SALES LAST YEAR
2000 5000 8900 28200 31500 34500 31000 28000 19000 9000 5400 16900 219400
% TO TOTAL 0.9% 2.3% 4.1% 12.9% 14.4% 15.7% 14.1% 12.8% 8.7% 4.1% 2.5% 7.7% 100.0%
COST OF SALES LAST YEAR
2000 4000 6500 18000 22000 23000 22000 19000 13000 7000 4000 15000 155500
COS % 100.0% 80.0% 73.0% 63.8% 69.8% 66.7% 71.0% 67.9% 68.4% 77.8% 74.1% 88.8% 70.9%
ROUNDS LAST YEAR 0 0 100 2500 3500 6000 5500 4300 3200 1800 100 0 27000
Last years Retail Sales and Cost of Sales by month From General Ledger or Budget POS System
Dollar per Round Tee Sheets – Starters Report POS system
$ PER ROUND $0.00 $0.00 $89.00 $11.28 $9.00 $5.75 $5.64 $6.51 $5.94 $5.00 $54.00 $0.00 $8.13
JAN FEB MAR APR MAY JUN JUL AUG SEP OCT NOV DEC DEC 31 TOTAL
RETAIL SALES PLAN 1500 4500 8000 28000 33000 37000 34000 30000 19000 9000 5000 15000 224,000
% TO TOTAL 0.7% 2.0% 3.6% 12.5% 14.7% 16.5% 15.2% 13.4% 8.5% 4.0% 2.2% 6.7% 100.00%
COST OF SALES PLAN 1300 3800 6000 18000 23000 24000 22000 20000 13500 6500 3800 10500 152400
COS % 86.7% 84.4% 75.0% 64.3% 69.7% 64.9% 64.7% 66.7% 71.1% 72.2% 76.0% 70.0% 68.0%
ROUNDS PLAN 0 0 100 2500 3600 5800 5800 4300 3200 1600 100 0 27000
Retail Sales Plan by month Use Dollar per Round Plan realistic improvement
Adjust to reflect current trends
Sales x COS % = Cost of Sales in Dollars Plan month by month Adjust to reflect current trends
$ PER ROUND PLAN $0.00 $0.00 $80.00 $11.20 $9.17 $6.38 $5.86 $6.98 $5.94 $5.63 $50.00 $0.00 $8.30
3
JAN FEB MAR APR MAY JUN JUL AUG SEP OCT NOV DEC DEC 31 TOTAL
BEGINNING OF MONTH INVENTORY
56000 54000 53000 73500 94500 106500 114500 117500 116500 111500 106500 104500 90500 1199000
COST OF SALES LAST YEAR
TURNOVER LAST YEAR
155,500
AVERAGE INVENTORY L/Y
COST OF SALES PLAN
AVERAGE INVENTORY PLAN
TURNOVER GOAL
152,400
76,200
2 0
92,231
1 7
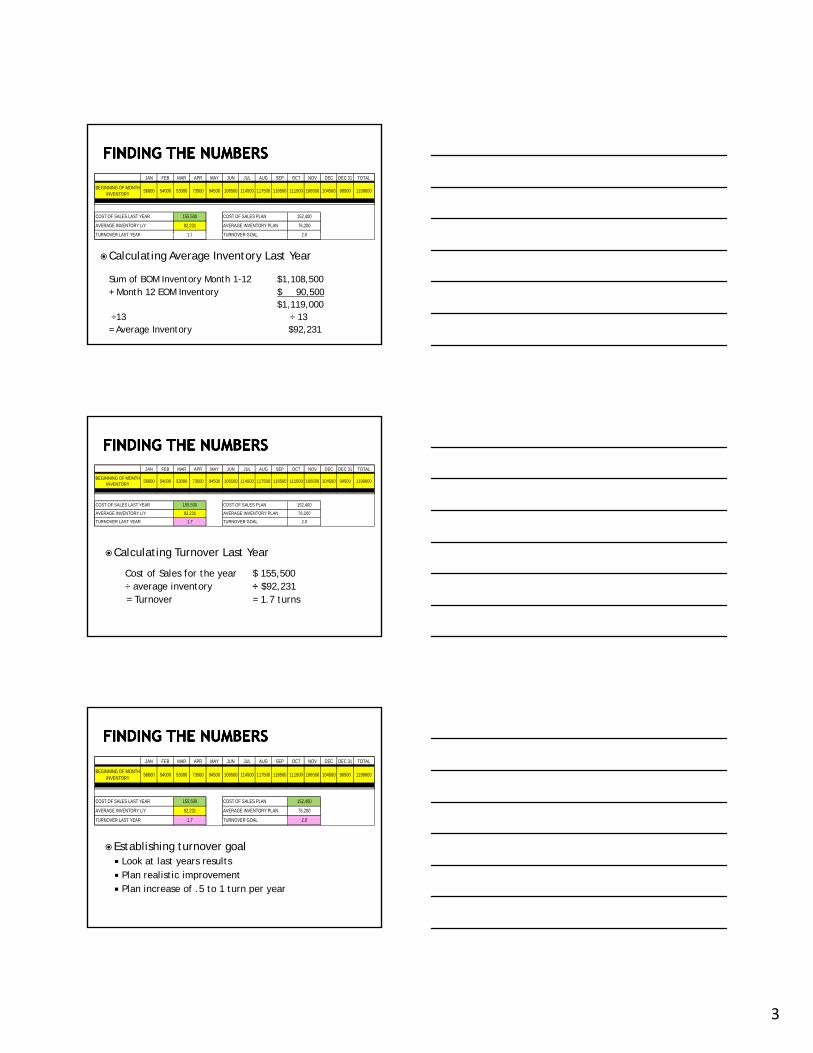
Calculating Average Inventory Last Year
Sum of BOM Inventory Month 1-12 $1,108,500+ Month 12 EOM Inventory $ 90,500
$1,119,000÷13 ÷ 13= Average Inventory $92,231
TURNOVER LAST YEAR TURNOVER GOAL 2.01.7
JAN FEB MAR APR MAY JUN JUL AUG SEP OCT NOV DEC DEC 31 TOTAL
BEGINNING OF MONTH INVENTORY
56000 54000 53000 73500 94500 106500 114500 117500 116500 111500 106500 104500 90500 1199000
COST OF SALES LAST YEAR
TURNOVER LAST YEAR
155,500
AVERAGE INVENTORY L/Y
COST OF SALES PLAN
AVERAGE INVENTORY PLAN
TURNOVER GOAL
152,400
76,200
2.0
92,231
1.7
Calculating Turnover Last Year
Cost of Sales for the year $ 155,500÷ average inventory ÷ $92,231= Turnover = 1.7 turns
JAN FEB MAR APR MAY JUN JUL AUG SEP OCT NOV DEC DEC 31 TOTAL
BEGINNING OF MONTH INVENTORY
56000 54000 53000 73500 94500 106500 114500 117500 116500 111500 106500 104500 90500 1199000
COST OF SALES LAST YEAR 155,500
AVERAGE INVENTORY L/Y
COST OF SALES PLAN
AVERAGE INVENTORY PLAN
152,400
76,20092,231
Establishing turnover goal Look at last years results Plan realistic improvement Plan increase of .5 to 1 turn per year
TURNOVER LAST YEAR TURNOVER GOAL 2.01.7
4
JAN FEB MAR APR MAY JUN JUL AUG SEP OCT NOV DEC DEC 31 TOTAL
BEGINNING OF MONTH INVENTORY
56000 54000 53000 73500 94500 106500 114500 117500 116500 111500 106500 104500 90500 1199000
COST OF SALES LAST YEAR
TURNOVER LAST YEAR
155,500
AVERAGE INVENTORY L/Y
COST OF SALES PLAN
AVERAGE INVENTORY PLAN
TURNOVER GOAL
152,400
76,200
2.0
92,231
1.7
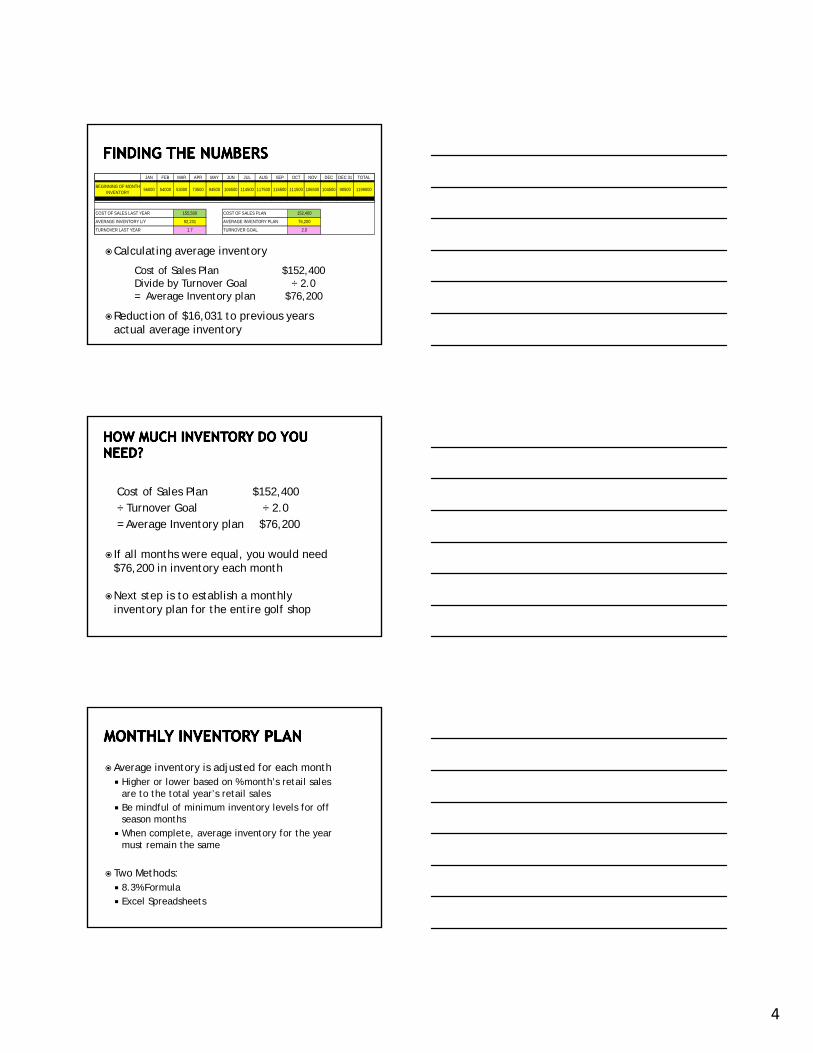
Calculating average inventory
Cost of Sales Plan $152,400Divide by Turnover Goal ÷ 2.0= Average Inventory plan $76,200
Reduction of $16,031 to previous years actual average inventory
Cost of Sales Plan $152,400÷ Turnover Goal ÷ 2.0= Average Inventory plan $76 200 Average Inventory plan $76,200
If all months were equal, you would need $76,200 in inventory each month
Next step is to establish a monthly inventory plan for the entire golf shop
Average inventory is adjusted for each month Higher or lower based on % month’s retail sales
are to the total year’s retail sales Be mindful of minimum inventory levels for off
season monthsseason months When complete, average inventory for the year
must remain the same
Two Methods: 8.3% Formula Excel Spreadsheets

5
8.3% Formula
If all months were equal they would be 8.3% of inventory needs
Adjust months up or down based on +/- to 8.3%
If month is 12.3%:12.3 – 8.3 = 4 Raise average inventory 40%
Month % to total Avg Rate +/- avg rate % adj to avg inv Avg Inventory $ adj to avg inv BOM InvJanuary 4% 8.30% -4.3% -40% 76,200.00$ (30,480.00)$ 45,720.00$ February 5% 8.30% -3.3% -30% 76,200.00$ (22,860.00)$ 53,340.00$ March 7% 8.30% -1.3% -10% 76,200.00$ (7,620.00)$ 68,580.00$ April 9% 8.30% 0.7% 10% 76,200.00$ 7,620.00$ 83,820.00$ May 11% 8.30% 2.7% 30% 76,200.00$ 22,860.00$ 99,060.00$ y , , ,June 12% 8.30% 3.7% 30% 76,200.00$ 22,860.00$ 99,060.00$ July 12% 8.30% 3.7% 30% 76,200.00$ 22,860.00$ 99,060.00$ August 12% 8.30% 3.7% 30% 76,200.00$ 22,860.00$ 99,060.00$ September 10% 8.30% 1.7% 10% 76,200.00$ 7,620.00$ 83,820.00$ October 8% 8.30% -0.3% 0% 76,200.00$ -$ 76,200.00$ November 5% 8.30% -3.3% -30% 76,200.00$ (22,860.00)$ 53,340.00$ December 5% 8.30% -3.3% -30% 76,200.00$ (22,860.00)$ 53,340.00$
total 914,400.00$ avg inv 76,200.00$
JAN FEB MAR APR MAY JUN JUL AUG SEP OCT NOV DEC TOTAL
$ PLAN 1500 4500 8000 28000 33000 37000 34000 30000 19000 9000 5000 15000 224000
% OF YEAR 4.0% 5.0% 7.0% 9.0% 11.0% 12.0% 12.0% 12.0% 10.0% 8.0% 5.0% 5.0% 100%
RETAIL SALES PLAN
COST OF SALES PLAN
JAN FEB MAR APR MAY JUN JUL AUG SEP OCT NOV DEC TOTAL
$ PLAN 1300 3800 6000 18000 23000 24000 22000 20000 13500 6500 3800 10500 152400
COS % 83.3% 86.7% 76.2% 72.2% 69.7% 69.4% 73.6% 69.4% 71.7% 87.5% 83.3% 80.0% 68.0%
AVERAGE INVENTORY
PLAN JAN FEB MAR APR MAY JUN JUL AUG SEP OCT NOV DEC
ACTUAL AVERAGE
INV
76200 50000 50000 60000 82000 107000 120000 113000 93000 75000 68000 63000 60000 76231
COST OF SALES PLAN
MONTHLY INVENTORY PLAN

6
JAN FEB MAR APR MAY JUN JUL AUG SEP OCT NOV DEC TOTAL
$ PLAN 1300 3800 6000 18000 23000 24000 22000 20000 13500 6500 3800 10500 152400
COS % 83.3% 86.7% 76.2% 72.2% 69.7% 69.4% 73.6% 69.4% 71.7% 87.5% 83.3% 80.0% 68.0%
COST OF SALES PLAN
AVERAGE INVENTORY
PLAN JAN FEB MAR APR MAY JUN JUL AUG SEP OCT NOV DEC
ACTUAL AVERAGE
INV
76200 45720 53340 68580 83820 99060 99060 99060 99060 83820 76200 53340 53340 76200
AVERAGE INVENTORY
PLAN JAN FEB MAR APR MAY JUN JUL AUG SEP OCT NOV DEC
ACTUAL AVERAGE
INV
76200 50000 50000 60000 82000 107000 120000 113000 93000 75000 68000 63000 60000 76231
SPREADSHEET METHOD
8.3% METHOD
You now have an inventory plan to follow when purchasing merchandise
Ideally, inventory plan is developed for each department and in some cases classification Adjust for differences in cost of sale percentage Adjust for differences in turnover goal Ensure total of all individual plans matches total
golf shop plan
Now you are ready to run an Open to Buy
Gives you a Cash Flow planGives the buyer a “checkbook”Allows for consistent planned flow of
merchandise – one month prior to desired selling periodselling period Guide for placing orders Plan for holding reserves
An annual planning process Developed for total shop Broken down by Department

7
A monthly review process Indicates need to react to current trends Place additional purchases Address slow selling merchandise Adjust future shipmentsAdjust future shipments
Improves profitability Improves opportunity to meet cost of sales
and turnover goals
Department Total Shop Year: 2010
JAN FEB MAR APRIL MAY JUNE JULY AUG SEPT OCT NOV DEC
1300 3800 6000 18000 23000 24000 22000 20000 13500 6500 3800 10500
50000 60000 82000 107000 120000 113000 93000 75000 68000 63000 60000 50000
50000 50000 60000 82000 107000 120000 113000 93000 75000 68000 63000 60000
1300 13800 28000 43000 36000 17000 2000 2000 6500 1500 800 500
OPEN TO BUY & ON-ORDER LOG
MONTH
Current Month's Planned Cost of Sales+ Next Month's Planned Inventory
- Current Month's Planned (or Actual) Inventory= Cost Buy Plan (planned OTB)
0 13520 17761 33411 31343 9948 1830 0 0 0 0 0
1300 2500 5000 7000 7000 3000 500 500 3000 1500 800 500 Total0 -2220 5239 2589 -2343 4052 -330 1500 3500 0 0 0 11987
VendorShip Date
Date R'cd Description JAN FEB MAR APRIL MAY JUNE JULY AUG SEPT OCT NOV DEC
Vendor A 3/20 Navy/Purple/Teal 1650
5/1 Khaki/White 3000
Vendor B 2/20 1/26 Green/Yellow 1900
3/15 Red/Black 1250
5/25 Tech Pastels 3000
Comments
- Current On Order- Reserve & Special Orders
Actual Open to Buy
shipped early (rcd. dating)
Current Month’s Planned Cost of Sales
+ Next Month’s Planned Inventory
- Current Month’s Planned (or Actual) Inventory
= Cost Buy Plan (Planned OTB)
- On-Order & Reserves & Special Orders (at cost)
= Actual Open to Buy for Month

8
Department Total Shop
JAN FEB MAR APRIL MAY JUNE
1300 3800 6000 18000 23000 24000
MONTH
C t M th' Pl d C t f S l 1300 3800 6000 18000 23000 24000
50000 60000 82000 107000 120000 113000
50000 50000 60000 82000 107000 120000
1300 13800 28000 43000 36000 17000
0 13520 17761 33411 31343 9948
1300 2500 5000 7000 7000 3000
0 -2220 5239 2589 -2343 4052
Current Month's Planned Cost of Sales+ Next Month's Planned Inventory
- Current Month's Planned (or Actual) Inventory= Cost Buy Plan (planned OTB)
- Current On Order- Reserve & Special Orders
Actual Open to Buy
JAN FEB MAR APR MAY JUN JUL AUG SEP OCT NOV DEC TOTAL
$ PLAN 1500 4500 8000 28000 33000 37000 34000 30000 19000 9000 5000 15000 224000
% OF YEAR 4.0% 5.0% 7.0% 9.0% 11.0% 12.0% 12.0% 12.0% 10.0% 8.0% 5.0% 5.0% 100%
RETAIL SALES PLAN
COST OF SALES PLAN
MONTHLY INVENTORY PLANNING
JAN FEB MAR APR MAY JUN JUL AUG SEP OCT NOV DEC TOTAL
$ PLAN 1300 3800 6000 18000 23000 24000 22000 20000 13500 6500 3800 10500 152400
COS % 83.3% 86.7% 76.2% 72.2% 69.7% 69.4% 73.6% 69.4% 71.7% 87.5% 83.3% 80.0% 68.0%
AVERAGE INVENTORY
PLAN JAN FEB MAR APR MAY JUN JUL AUG SEP OCT NOV DEC
ACTUAL AVERAGE
INV
76200 50000 50000 60000 82000 107000 120000 113000 93000 75000 68000 63000 60000 76231
COST OF SALES PLAN
MONTHLY INVENTORY PLAN
JAN FEB MAR APR MAY JUN JUL AUG SEP OCT NOV DEC DEC 31 TOTAL
COST OF SALES PLAN 1300 3800 6000 18000 23000 24000 22000 20000 13500 6500 3800 10500 152400
RETAIL SALES / COST OF SALES / ROUNDS / INVENTORY FORECAST
Month % to total Avg Rate +/- avg rate % adj to avg inv Avg Inventory $ adj to avg inv BOM InvJanuary 4% 8.30% -4.3% -40% 76,200.00$ (30,480.00)$ 45,720.00$ February 5% 8.30% -3.3% -30% 76,200.00$ (22,860.00)$ 53,340.00$ March 7% 8.30% -1.3% -10% 76,200.00$ (7,620.00)$ 68,580.00$ April 9% 8.30% 0.7% 10% 76,200.00$ 7,620.00$ 83,820.00$ May 11% 8.30% 2.7% 30% 76,200.00$ 22,860.00$ 99,060.00$
9
Department Total Shop
JAN FEB MAR APRIL MAY JUNE
1300 3800 6000 18000 23000 24000
MONTH
Current Month's Planned Cost of SalesN M h' Pl d I
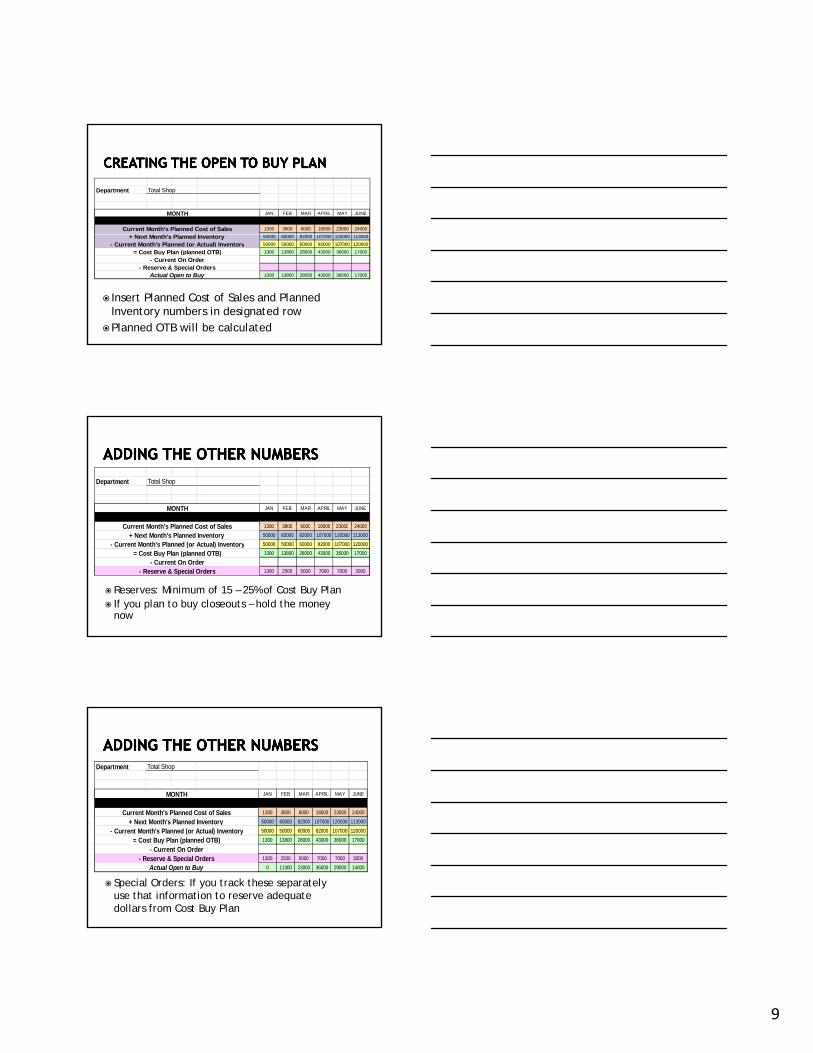
Insert Planned Cost of Sales and Planned Inventory numbers in designated row
Planned OTB will be calculated
50000 60000 82000 107000 120000 113000
50000 50000 60000 82000 107000 120000
1300 13800 28000 43000 36000 17000
1300 13800 28000 43000 36000 17000
+ Next Month's Planned Inventory - Current Month's Planned (or Actual) Inventory
= Cost Buy Plan (planned OTB)- Current On Order
- Reserve & Special OrdersActual Open to Buy
Department Total Shop
JAN FEB MAR APRIL MAY JUNE
1300 3800 6000 18000 23000 24000
MONTH
Current Month's Planned Cost of Sales
Reserves: Minimum of 15 – 25% of Cost Buy Plan If you plan to buy closeouts – hold the money
now
1300 3800 6000 18000 23000 24000
50000 60000 82000 107000 120000 113000
50000 50000 60000 82000 107000 120000
1300 13800 28000 43000 36000 17000
1300 2500 5000 7000 7000 3000
Current Month s Planned Cost of Sales+ Next Month's Planned Inventory
- Current Month's Planned (or Actual) Inventory= Cost Buy Plan (planned OTB)
- Current On Order- Reserve & Special Orders
Department Total Shop
JAN FEB MAR APRIL MAY JUNE
1300 3800 6000 18000 23000 24000
MONTH
Current Month's Planned Cost of Sales
Special Orders: If you track these separately use that information to reserve adequate dollars from Cost Buy Plan
50000 60000 82000 107000 120000 113000
50000 50000 60000 82000 107000 120000
1300 13800 28000 43000 36000 17000
1300 2500 5000 7000 7000 3000
0 11300 23000 36000 29000 14000
+ Next Month's Planned Inventory - Current Month's Planned (or Actual) Inventory
= Cost Buy Plan (planned OTB)- Current On Order
- Reserve & Special OrdersActual Open to Buy
10
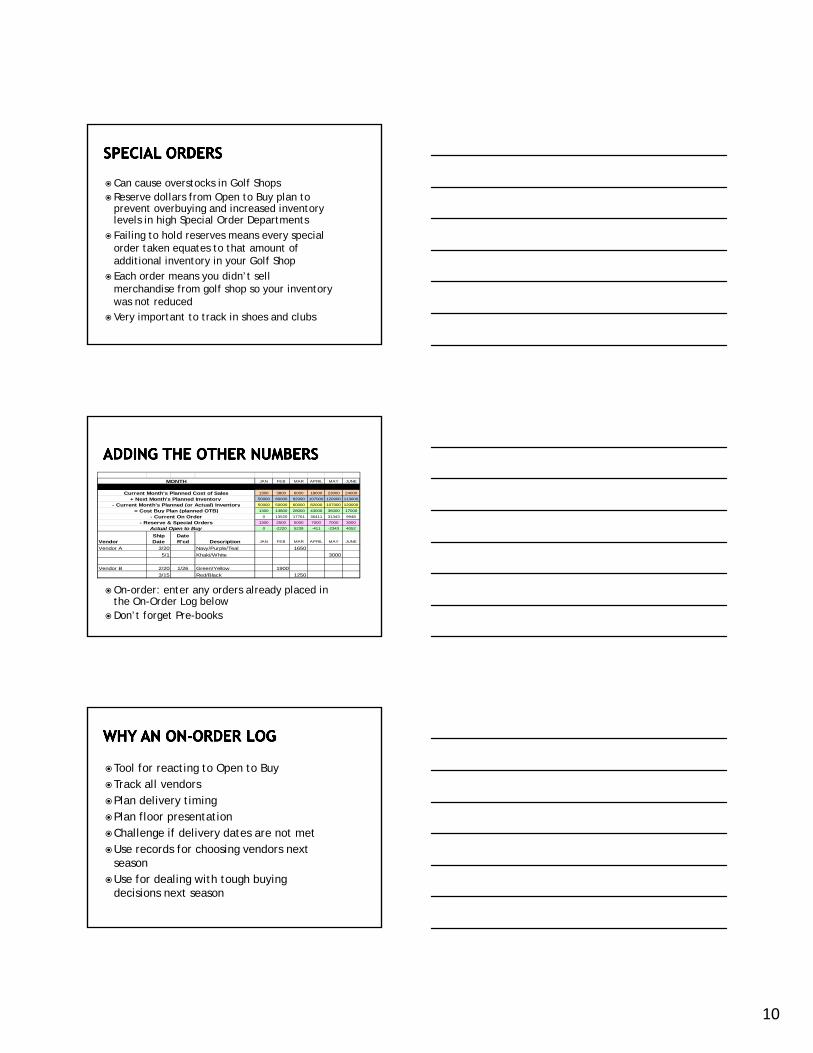
Can cause overstocks in Golf Shops Reserve dollars from Open to Buy plan to
prevent overbuying and increased inventory levels in high Special Order Departments
Failing to hold reserves means every special Failing to hold reserves means every special order taken equates to that amount of additional inventory in your Golf Shop
Each order means you didn’t sell merchandise from golf shop so your inventory was not reduced
Very important to track in shoes and clubs
JAN FEB MAR APRIL MAY JUNE
1300 3800 6000 18000 23000 24000
50000 60000 82000 107000 120000 113000
50000 50000 60000 82000 107000 120000
1300 13800 28000 43000 36000 17000
0 13520 17761 36411 31343 9948
1300 2500 5000 7000 7000 3000
MONTH
Current Month's Planned Cost of Sales+ Next Month's Planned Inventory
- Current Month's Planned (or Actual) Inventory= Cost Buy Plan (planned OTB)
- Current On Order- Reserve & Special Orders
On-order: enter any orders already placed in the On-Order Log below
Don’t forget Pre-books
0 -2220 5239 -411 -2343 4052
VendorShip Date
Date R'cd Description JAN FEB MAR APRIL MAY JUNE
Vendor A 3/20 Navy/Purple/Teal 1650
5/1 Khaki/White 3000
Vendor B 2/20 1/26 Green/Yellow 1900
3/15 Red/Black 1250
Actual Open to Buy
Tool for reacting to Open to BuyTrack all vendorsPlan delivery timing Plan floor presentationPlan floor presentationChallenge if delivery dates are not metUse records for choosing vendors next
seasonUse for dealing with tough buying
decisions next season

11
JAN FEB MAR APRIL MAY JUNE JULY AUG SEPT OCT NOV DEC
1300 3800 6000 18000 23000 24000 22000 20000 13500 6500 3800 10500
50000 60000 82000 107000 120000 113000 93000 75000 68000 63000 60000 50000
50000 50000 60000 82000 107000 120000 113000 93000 75000 68000 63000 60000
1300 13800 28000 43000 36000 17000 2000 2000 6500 1500 800 500
0 13520 17761 33411 31343 9948 1830 0 0 0 0 0
1300 2500 5000 7000 7000 3000 500 500 3000 1500 800 500
0 -2220 5239 2589 -2343 4052 -330 1500 3500 0 0 0
MONTH
Current Month's Planned Cost of Sales+ Next Month's Planned Inventory
- Current Month's Planned (or Actual) Inventory= Cost Buy Plan (planned OTB)
- Current On Order- Reserve & Special Orders
Actual Open to Buy 0 2220 5239 2589 2343 4052 330 1500 3500 0 0 0
VendorShip Date
Date R'cd Description JAN FEB MAR APRIL MAY JUNE JULY AUG SEPT OCT NOV DEC
Vendor A 3/20 Navy/Purple/Teal 1650
5/1 Khaki/White 3000
Vendor B 2/20 1/26 Green/Yellow 1900
3/15 Red/Black 1250
5/25 Tech Pastels 3000
Vendor C 3/1 Grey/Black 2280
4/15 Blue/Yellow 3100
6/15 Red/White/Blue 1800
Actual Open to Buy
Major Cause of Overstocks in Golf Shops!!! Benefits Terms, Discounts, Rebates Convenient – Buys all done at once Suggested order done by Rep Suggested order done by Rep
Risks Reps orders based on units shipped not units
sold Discounts and Terms not taken Excessive Inventory – Decreased Turnover –
Increased Markdowns Change of product line mid-season
Planning with Pre-books and Programs Use previous SALES records and adjust to trend Know Vendor Profitability Be prepared – have your own numbers Spend only dollars in Buy Plan!!! Challenge monthly and adjust orders Ensure all Terms and Discounts are received
Programs don’t sell merchandise – the right product, price, and people do!!!

12
Open to Buy for March:COS for March $ 6,000
+ Inv Plan for April $82,000
- Inv Plan for March $60,000= Planned OTB $28,000
- On Order $ 0
- Reserves & S/O $ 5,000
= Actual Open to Buy $23,000
This number is for planning purposes only –for placing appropriate buys
Your “checkbook” is now created and you are ready to buy in a logical and profitable way!
Don’t forget to analyze all your vendor’s profitability Hold dollars for new vendors
Divide Open to Buy Plan by department based on percentage each department is of your total shop If men’s is 40% of your business they receive 40%
of the Open to Buy dollars You may want to create and open to buy and
on-order log for each department
JAN FEB MAR APR MAY JUN JUL AUG SEP OCT NOV DEC OPEN TO BUY PLAN
1300 13800 28000 43000 36000 17000 2000 2000 6500 1500 800 500 152400
1300 2500 5000 7000 7000 3000 500 500 3000 1500 800 500 32600
0 11300 23000 36000 29000 14000 1500 1500 3500 0 0 0 119800
LAST YEAR THIS YEAR
PLANNED OPEN TO BUY
- RESERVES
ADJUSTED BUY PLAN
TOTAL SHOP OPEN TO BUY PLAN
Dollars can now be spent based on season you are buying for
RETAIL SALES
% TO TOTAL
TOTAL SALES 219400 100.0% 100.0%
MEN'S 83372 38.0% 40.0% 0 4520 9200 14400 11600 5600 600 600 1400 0 0 0 47920
WOMEN'S 10970 5.0% 6.0% 0 678 1380 2160 1740 840 90 90 210 0 0 0 7188
HARDGOODS 74596 34.0% 34.0% 0 3842 7820 12240 9860 4760 510 510 1190 0 0 0 40732
EQUIPMENT 50462 23.0% 20.0% 0 2260 4600 7200 5800 2800 300 300 700 0 0 0 23960
DEPARTMENT OPEN TO BUY PLAN
YEAR PLAN %

13
Men’s Buy Plan $47,920
VendorSales % LY
Sales % Plan
$ Buy Plan
# Groups / Pieces
Actual Buy
Vendor A 17% 15% 71884 Groups @ 40 pcs.
heach
Vendor B 8% 10% 4792 Basics – Fill in as needed
Vendor C 12% 15% 7188 4 Groups
Vendor D&E 22% 23% 11021 Tech Fabrics
New Lines 12% 5751 3 Groups
Outerwear 15% 15% 7188
Accessories 10% 10% 4792
TOTAL 100% 47920
Place orders with vendors Make adjustments to Vendor plan as needed Stay within Open to Buy Dollars
Record in Open to Buy & On-Order Log Actual Open to Buy will be reduced based on
orders placed Avoid negative numbers!!! Adjust shipping dates Cut quantities back
Don’t spend the reserves!!! Remember – it is just a plan
First of Month Replace “current month planned inventory” with
actual inventory dollars From Physical Inventory if you have taken one From POS System if you did not take count From POS System if you did not take count
Analyze Actual Open to Buy Positive Number indicates money you may need
to spend Negative Number indicated amount you are
currently overbought

14
Plan after all orders placed for season:
COS for March $ 6,000
+ Inv Plan for April $82,000
- Inv Plan for March $60,000
= Planned OTB $28,000- On Order $17,761
- Reserves & S/O $ 5,000
= Actual Open to Buy $ 5,239
March 1st actual inventory $69,000:
COS for March $ 6,000
+ Inv Plan for April $82,000
- Actual Inv. March 1 $69,000
= Planned OTB $19,000- On Order $17,761
- Reserves & S/O $ 5,000
= Actual Open to Buy $ -3,761
Department Total Shop
JAN FEB MAR APRIL MAY JUNE
1300 3800 6000 18000 23000 24000
50000 60000 82000 107000 120000 113000
50000 50000 69000 82000 107000 120000
1300 13800 19000 43000 36000 17000
0 13520 17761 36411 31343 9948
1300 2500 5000 7000 7000 3000 Total- Current On Order
- Reserve & Special Orders
OPEN TO BUY & ON-ORDER LOG
MONTH
Current Month's Planned Cost of Sales+ Next Month's Planned Inventory
- Current Month's Planned (or Actual) Inventory= Cost Buy Plan (planned OTB)
0 -2220 -3761 -411 -2343 4052 -13
VendorShip Date
Date R'cd Description JAN FEB MAR APRIL MAY JUNE
Vendor A 3/20 Navy/Purple/Teal 1650
5/1 Khaki/White 3000
Vendor B 2/20 1/26 Green/Yellow 1900
3/15 Red/Black 1250
5/25 Tech Pastels 3000
Vendor C 3/1 Grey/Black 2280
4/15 Blue/Yellow 3100
6/15 Red/White/Blue 1800
shipped early (rcd. dating)
Comments
Actual Open to Buy

15
Overbought – negative number Are Sales at Cost lower than planned? Determine why – are adjustments needed?
How are Retail Sales? How are Rounds? Did you receive any orders early? Did you receive any orders late? What is the weather like? Are you seeing any trends you need to
react to?
Overbought – negative number If you need to react: Address slow selling merchandise Are there markdowns you need to take?y Can you return any merchandise?
Move future shipments out Cancel future orders Slow selling styles or colors
Plan a great promotion Improve presentation
January 1st actual inventory $54,000 :
COS for March $ 6,000
+ Inv Plan for April $82,000
- Actual Inv. March 1 $54,000
= Planned OTB $34,000- On Order $17,761
- Reserves & S/O $ 5,000
= Actual Open to Buy $11,239

16
Department Total Shop
JAN FEB MAR APRIL MAY JUNE
1300 3800 6000 18000 23000 24000
50000 60000 82000 107000 120000 113000
50000 50000 54000 82000 107000 120000
1300 13800 34000 43000 36000 17000
0 13520 17761 36411 31343 9948
1300 2500 5000 7000 7000 3000 Total
OPEN TO BUY & ON-ORDER LOG
MONTH
Current Month's Planned Cost of Sales+ Next Month's Planned Inventory
- Current Month's Planned (or Actual) Inventory= Cost Buy Plan (planned OTB)
- Current On Order- Reserve & Special Orders
0 -2220 11239 -411 -2343 4052 14987
VendorShip Date
Date R'cd Description JAN FEB MAR APRIL MAY JUNE
Vendor A 3/20 Navy/Purple/Teal 1650
5/1 Khaki/White 3000
Vendor B 2/20 1/26 Green/Yellow 1900
3/15 Red/Black 1250
5/25 Tech Pastels 3000
Vendor C 3/1 Grey/Black 2280
4/15 Blue/Yellow 3100
6/15 Red/White/Blue 1800
Comments
Actual Open to Buy
shipped early (rcd. dating)
Underbought – positive number Is Cost of Sales greater than planned? Have you taken too many markdowns? Are you marking merchandise up enough?
Are Retail Sales greater than expected? Do you need to adjust plans?
Are Rounds of Golf up?? Did you have a large event? What items sold well last month? Do you see any trends?
Underbought – positive number If you need to react: Use caution Reorder if you cany Move future orders up Increase future orders Place additional purchases Try a new line Look for closeouts

17
Other Questions to ask before adjusting orders: How do the next few months look? Did I underbuy March and overbuy April?
Did any merchandise ship early or late? Do I own lots of off-price merchandise Are there any large credits you are waiting
for? Has weather been a factor? What is the economic forecast?
It is only a plan The time spent developing it will be
rewarded with better buying and inventory controls
You will create more sales with less inventory if an Open to Buy is followed
Open to Buy must be analyzed monthly and reacted to!! One hour spent the first of every month
will save you many markdowns
Tracy Moffatt
K&K ConsultingK&K ConsultingAGM Education Team
18
“The Educational Voice in Golf Merchandising”
602-604-8250www.agmgolf.org
All AGM educational materials are protected by U.S. Copyright All AGM educational materials are protected by U.S. Copyright and cannot be reprinted or used without the expressed and cannot be reprinted or used without the expressed
written consent of the Association of Golf Merchandisers.written consent of the Association of Golf Merchandisers.

JAN FEB MAR APR MAY JUN JUL AUG SEP OCT NOV DEC DEC 31 TOTAL
RETAIL SALES LAST YEAR
2000 5000 8900 28200 31500 34500 31000 28000 19000 9000 5400 16900 219400
% TO TOTAL 0.9% 2.3% 4.1% 12.9% 14.4% 15.7% 14.1% 12.8% 8.7% 4.1% 2.5% 7.7% 100.0%
COST OF SALES LAST YEAR
2000 4000 6500 18000 22000 23000 22000 19000 13000 7000 4000 15000 155500
COS % 100.0% 80.0% 73.0% 63.8% 69.8% 66.7% 71.0% 67.9% 68.4% 77.8% 74.1% 88.8% 70.9%
ROUNDS LAST YEAR 0 0 100 2500 3500 6000 5500 4300 3200 1800 100 0 27000
$ PER ROUND $0.00 $0.00 $89.00 $11.28 $9.00 $5.75 $5.64 $6.51 $5.94 $5.00 $54.00 $0.00 $8.13
BEGINNING OF MONTH INVENTORY
56000 54000 53000 73500 94500 106500 114500 117500 116500 111500 106500 104500 90500 1199000
RETAIL SALES PLAN 1500 4500 8000 28000 33000 37000 34000 30000 19000 9000 5000 15000 224,000
% TO TOTAL 0.7% 2.0% 3.6% 12.5% 14.7% 16.5% 15.2% 13.4% 8.5% 4.0% 2.2% 6.7% 100.00%
COST OF SALES PLAN 1300 3800 6000 18000 23000 24000 22000 20000 13500 6500 3800 10500 152400
COS % 86.7% 84.4% 75.0% 64.3% 69.7% 64.9% 64.7% 66.7% 71.1% 72.2% 76.0% 70.0% 68.0%
ROUNDS PLAN 0 0 100 2500 3600 5800 5800 4300 3200 1600 100 0 27000
$ PER ROUND PLAN $0.00 $0.00 $80.00 $11.20 $9.17 $6.38 $5.86 $6.98 $5.94 $5.63 $50.00 $0.00 $8.30
RETAIL SALES / COST OF SALES / ROUNDS / INVENTORY FORECAST
COST OF SALES LAST YEAR
TURNOVER LAST YEAR
155,500
AVERAGE INVENTORY L/Y
COST OF SALES PLAN
AVERAGE INVENTORY PLAN
TURNOVER GOAL
152,400
76,200
2.0
92,231
1.7

OPEN TO BUY
TOTAL SHOP OPEN TO BUY PLAN
JAN FEB MAR APR MAY JUN JUL AUG SEP OCT NOV DEC OPEN TO BUY PLAN
1300 13800 28000 43000 36000 17000 2000 2000 6500 1500 800 500 152400
1300 2500 5000 7000 7000 3000 500 500 3000 1500 800 500 32600
PLANNED OPEN TO BUY
- RESERVES
0 11300 23000 36000 29000 14000 1500 1500 3500 0 0 0 119800
LAST YEAR THIS
ADJUSTED BUY PLAN
RETAIL SALES
% TO TOTAL
TOTAL SALES 219400 100.0% 100.0% DEPARTMENT OPEN TO BUY PLAN
LAST YEAR THIS YEAR
PLAN %
MEN'S 83372 38.0% 40.0% 0 4520 9200 14400 11600 5600 600 600 1400 0 0 0 47920
WOMEN'S 10970 5.0% 6.0% 0 678 1380 2160 1740 840 90 90 210 0 0 0 7188
HARDGOODS 74596 34.0% 34.0% 0 3842 7820 12240 9860 4760 510 510 1190 0 0 0 40732
EQUIPMENT 50462 23.0% 20.0% 0 2260 4600 7200 5800 2800 300 300 700 0 0 0 23960

D t t T t l Sh Y 2010
OPEN TO BUY & ON-ORDER LOG
Department Total Shop Year: 2010
JAN FEB MAR APRIL MAY JUNE JULY AUG SEPT OCT NOV DEC
1300 3800 6000 18000 23000 24000 22000 20000 13500 6500 3800 10500
50000 60000 82000 107000 120000 113000 93000 75000 68000 63000 60000 50000
MONTH
Current Month's Planned Cost of Sales+ Next Month's Planned Inventory 50000 60000 82000 107000 120000 113000 93000 75000 68000 63000 60000 50000
50000 50000 60000 82000 107000 120000 113000 93000 75000 68000 63000 60000
1300 13800 28000 43000 36000 17000 2000 2000 6500 1500 800 500
0 13520 17761 36411 31343 9948 1830 0 0 0 0 0
1300 2500 5000 7000 7000 3000 500 500 3000 1500 800 500 Total0 -2220 5239 -411 -2343 4052 -330 1500 3500 0 0 0 8987
Ship Date
+ Next Month s Planned Inventory - Current Month's Planned (or Actual) Inventory
= Cost Buy Plan (planned OTB)- Current On Order
- Reserve & Special OrdersActual Open to Buy
Vendorp
Date R'cd Description JAN FEB MAR APRIL MAY JUNE JULY AUG SEPT OCT NOV DEC
Vendor A 3/20 Navy/Purple/Teal 1650
5/1 Khaki/White 3000
Vendor B 2/20 1/26 Green/Yellow 1900
3/15 Red/Black 1250
Comments
shipped early (rcd. dating)
3/15 Red/Black 1250
5/25 Tech Pastels 3000
Vendor C 3/1 Grey/Black 2280
4/15 Blue/Yellow 3100
6/15 Red/White/Blue 1800