Embed Size (px)
Citation preview

Policy Research Working Paper 6155
Unlocking Bangladesh-India Trade
Emerging Potential and the Way Forward
Prabir DeSelim Raihan
Sanjay Kathuria
The World BankSouth Asia RegionEconomic Policy and Poverty SectorAugust 2012
WPS6155P
ublic
Dis
clos
ure
Aut
horiz
edP
ublic
Dis
clos
ure
Aut
horiz
edP
ublic
Dis
clos
ure
Aut
horiz
edP
ublic
Dis
clos
ure
Aut
horiz
edP
ublic
Dis
clos
ure
Aut
horiz
edP
ublic
Dis
clos
ure
Aut
horiz
edP
ublic
Dis
clos
ure
Aut
horiz
edP
ublic
Dis
clos
ure
Aut
horiz
ed

Produced by the Research Support Team
Abstract
The Policy Research Working Paper Series disseminates the findings of work in progress to encourage the exchange of ideas about development issues. An objective of the series is to get the findings out quickly, even if the presentations are less than fully polished. The papers carry the names of the authors and should be cited accordingly. The findings, interpretations, and conclusions expressed in this paper are entirely those of the authors. They do not necessarily represent the views of the International Bank for Reconstruction and Development/World Bank and its affiliated organizations, or those of the Executive Directors of the World Bank or the governments they represent.
Policy Research Working Paper 6155
The primary objective of this study is to analyze the impact on Bangladesh of increased market access in India, both within a static production structure and also identifying dynamic gains. The study shows that Bangladesh and India would both gain by opening up their markets to each other. Indian investments in Bangladesh will be very important for the latter to ramp up its exports, including products that would broaden trade complementarity and enhance intra-industry trade, and improve its trade standards and trade-handling capacity. A bilateral Free Trade Agreement would lift Bangladesh’s exports to India by 182 percent, and nearly 300 percent if transaction costs were also reduced through improved connectivity. These numbers, based on existing trade patterns, represent a lower bound of the potential increase in Bangladesh’s exports arising from a
This paper is a product of theEconomic Policy and Poverty Sector, South Asia Region. It is part of a larger effort by the World Bank to provide open access to its research and make a contribution to development policy discussions around the world. Policy Research Working Papers are also posted on the Web at http://econ.worldbank.org. The authors may be contacted at [email protected], [email protected], [email protected].
Free Trade Agreement. A Free Trade Agreement would also raise India’s exports to Bangladesh. India’s provision of duty-free access for all Bangladeshi products (already done) could increase the latter’s exports to India by 134 percent. In helping Bangladesh’s economy to grow, India would stimulate economic activity in its own eastern and north-eastern states. Challenges exist, however, including non-tariff measures/barriers in both countries, excessive bureaucracy, weak trade facilitation, and customs inefficiencies. Trade in education and health care services offers valuable prospects, but also suffers from market access issues. To enable larger gains, Bangladesh-India cooperation should go beyond goods trade and include investment, finance, services trade, trade facilitation, and technology transfer, and be placed within the context of regional cooperation.

Unlocking Bangladesh-India Trade:
Emerging Potential and the Way Forward
Prabir De1, Selim Raihan
2, and Sanjay Kathuria
3
1. Fellow, Research and Information System for Developing Countries (RIS), New Delhi, e-mail:
[email protected]. 2. Associate Professor, Department of Economics, University of Dhaka, Dhaka
and Executive Director, South Asian Network on Economic Modeling (SANEM), Dhaka, e-mail:
[email protected] 3. Lead Country Economist, SASEP, the World Bank, Bangladesh, e-mail:
The authors wish to thank Mia Mikic, Thomas Farole, Olivier Cadot, Md. Abul Basher and Zahid
Hussain for their useful comments on earlier versions of this paper, and Poulomi Dasgupta for her
research assistance. They also acknowledge the support provided by the World Bank for this study. The
views expressed are the authors‘ alone, and not necessarily those of the World Bank, RIS, University of
Dhaka and SANEM. The usual disclaimers apply.
[Sanjay Kathuria is affiliated to the EPOL Sector Board, and is a Lead Economist in SASEP]
Key words: Bangladesh, India, FTA, Trade facilitation, Trade liberalization, CGE model
JEL codes: F10, F13, F15, F17

ii
Table of Contents
Abstract ........................................................................................................................................... i
1. Introduction ............................................................................................................................... 1
Data and Methodology ...................................................................................................................... 2
2. Quantifying the Benefits of Trade Liberalization and Facilitation between India and
Bangladesh: Brief Review of the Literature ............................................................................... 2
3. Market Access for Trade in Goods and Selected Services .................................................... 5
3.1. Bangladesh‘s Trade with Neighboring Countries ...................................................................... 5
3.2. Trade Complementarity and Intra-Industry Trade ..................................................................... 8
3.3. Trade in Services in Education and Health Sectors between Bangladesh and India .......... 12
3.4. Scenario Analysis with the Global Computable General Equilibrium (CGE) Model ............. 13
3.4.1. Removal of India‘s Negative List and Its Impact on Bangladesh‘s Export to India ............. 15
3.5. Market Access Issues ............................................................................................................... 19
3.6. Beyond Trade in Goods ........................................................................................................... 21
4. Connectivity, Trade Facilitation, and Transit ...................................................................... 21
4.1. Implications .............................................................................................................................. 27
5. Conclusions and Policy Implications ..................................................................................... 27
References .................................................................................................................................... 31
1. Introduction
Despite bonds of culture and a shared history, as well as neighborly proximity, economic ties between
Bangladesh and India are far below potential. There is a feeling that rapid growth in both countries and
increasing levels of economic sophistication in India now present opportunities for enhanced economic
cooperation. Bangladesh could export far more, for example, to India‘s vast market, and Indian firms
could invest in Bangladesh, benefiting from abundant and relatively inexpensive labor, and re-export to
India as well as other countries. And there are plentiful opportunities for trade in services.
Current reality is different. Trade in South Asia in general––and between India and Bangladesh, in
particular––faces innumerable barriers, some of which are purely economic in nature. Because of these
barriers, the loss to industry and consumers in general is considerable. For example, if markets were to
open up effectively, Bangladesh could increase its exports of leather and ceramic products to India, and
India could increase its sugar exports to Bangladesh, where currently it is being smuggled in. Pakistan
could increase its trade in fresh and dry fruits. India could buy molasses and cement from Pakistan and
export machinery back, or increase its export of yarn to Sri Lanka. Since this is not the case at present,
South Asian traders have to contend with a multitude of trade barriers, while the absence of proper
facilitating mechanisms multiplies trade costs. For example, a surgical equipment manufacturer in
Pakistan sells equipment to Indian hospitals via a third country simply because India and Pakistan do not
trade in these products directly. The landed cost of jamdani sarees or hilsa fish from Bangladesh in the
West Bengal state of India is high because the trade standards adopted by the two countries are very
different. There are many other examples. Pakistan imports tea from Kenya, when neighboring India and
Sri Lanka offer much better options. India exports a significant amount of cotton yarn to Bangladesh, but
not to Sri Lanka or Nepal, which are deficient in cotton yarn. As a result, informal trade in South Asia has
grown considerably and in many cases exceeds the formal trade volume.
Better market access, improved physical connectivity and transit, and energy trade between India and
Bangladesh are important instruments for unlocking bilateral trade potential. Greater engagement in these
areas would also stimulate employment and other economic and social activities, which in turn would
help to reduce poverty (particularly in the border areas), enhance foreign direct investment (FDI) flows,
and generate new business opportunities for the private sector. Bilateral trade and investment offer
immense opportunities for accelerating growth and reducing poverty. India could become a hub for
stimulating the growth of intra-industry trade and boosting FDI inflow to Bangladesh. At the same time,
Bangladesh can become an additional source of trade and investment for India‘s eastern and north-eastern
states. Furthermore, in view of several regional and sub-regional cooperation initiatives involving India
and Bangladesh, greater bilateral economic cooperation and integration between these two economies is a
critical step for an integrated South Asia. This integration will eventually provide a basic foundation for a
more effective SAARC (South Asian Association for Regional Cooperation) in moving towards more
free-market and trade-oriented policies. Deeper India-Bangladesh cooperation would be a part of the
process towards a stronger SAARC.
The prospects of cooperation between Bangladesh and India seem brighter than ever, particularly since
the governments of both countries have recently shown political interest in this regard. The Prime
Ministers of the two countries met in 2010 and 20111 and agreed to cooperate in (i) broadening access to
each other‘s markets, (ii) improving physical connectivity, including sub-regional transit, and (iii)
electricity trade. Would deeper cooperation in these fields lead to significant economic and social
benefits? A full-length study on bilateral economic cooperation between India and Bangladesh would be
needed to answer that question.
1 Refer to the joint communiqué issued on the occasion of the visit of the Prime Minister of Bangladesh to India
on January 12 2010, and the joint statement issued on the occasion of the visit of the Prime Minister of India to
Bangladesh on 7 September 2011.

2
This study‘s primary objective is to explore the benefits for trade and economic growth that could be
derived from enhanced market access for Bangladesh in India, and improved physical connectivity
between the two countries. It studies the impact of market access on trade in goods, an area of particular
interest to Bangladesh. It also analyzes trade facilitation and transit issues between the two countries, and
examines a set of emerging challenges for the region, setting out a road map for deepening bilateral
economic relations.
Data and Methodology
The study is based on secondary data.2 A computable general equilibrium (CGE) model was used to
address market access issues and to assess the impact of, say, a free trade agreement (FTA) on potential
exports. The indirect effects of even a single tariff reduction may be quite complex, and this complexity
increases with the number of trade policies and markets involved. As FTAs cover multiple sectors and
various trade reforms, they are often simulated using CGE modeling. The CGE model relies on standard
microeconomic theory for rigor and consistency and on computer algorithms for model-solving.
An augmented gravity model was also used to assess the effect of trade facilitation and trade cost
elements on bilateral trade. Estimated results from this partial equilibrium model would help to estimate
the potential for trade, whereas those from the CGE model would provide directions to the way forward.
2. Quantifying the Benefits of Trade Liberalization and Facilitation between India and
Bangladesh: Brief Literature Review
In trade theory, welfare effects of any regional trade agreement (RTA) are analyzed using two concepts:
trade creation and trade diversion.3 The fundamental arguments for regionalism rest on evidence that
suggests RTAs are predominantly trade-creating.4 The reasoning is that most RTAs are likely to entail
relatively low welfare losses resulting from trade diversion, since the countries involved are often
neighbors and hence already engaged in substantial trade;5 countries can ―lock in‖ reform through RTAs,
which is often politically less feasible under multilateral arrangements,6 and if multilateral trade talks fail
or stall, trade liberalization is restricted to RTAs. It is further argued that countries can build on the
progress of regionalism and ultimately move towards a freer trade regime on the whole. There are,
however, some critical arguments against formation of any RTA. It is alleged that an RTA undermines the
spirit of multilateralism, and that the world might be divided into protectionist blocs, and that
protectionists might accept RTAs in order to oppose further multilateral liberalization. In that case RTAs
might be stumbling blocks to multilateralism. Simultaneous, complicated RTA negotiations could also
bring about a ―spaghetti bowl‖ effect.7
2 Data came mostly from national government sources of Bangladesh and India, and multilateral development
organizations such as the World Bank, IMF, WTO, UNCTAD, UNESCAP, and UNCOMTRADE. 3 Integration is both a policy of protection and a move towards free trade. The effect of the protectionist element
of integration is called trade diversion, and the effect of the trade liberalization element is called trade
creation. The RTA‘s overall effect on the welfare for a member country is determined by comparing the trade-
creation and trade-diversion effects. If trade creation dominates, the formation of a RTA will enhance welfare;
if trade diversion is greater, the RTA will lead to a welfare loss for the country concerned. Note that if member
countries are the low-cost producers of the traded good, there will be no trade-diversion effect and integration
will unambiguously increase welfare. 4 See Rodríguez-Delgado (2007).
5 See Krugman (1991).
6 Whalley, (1996), for example, asserted that a desire for increased credibility of domestic reforms was a central
preoccupation behind the Mexican negotiating position on the North American Free Trade Agreement
(NAFTA). 7 See Bhagwati and Panagariya (1996).
3
Baysan et al. (2006) have argued that the economic case for any regional integration in South Asia has
been relatively weak. They point to three important features of the South Asian economies that they
believe make a regional FTA economically unattractive. Firstly, the economies are relatively small:
despite its population (one-fifth of the world), the region‘s per-capita income is low, so its economic size
remains small: less than 5 percent of the world‘s GDP, and just 0.4 percent if India is discounted. Since,
as Baysan et al. contend, it is improbable that the most efficient suppliers to the member countries are
located within the region, the probability that the FTA would be largely trade diverting is quite high.
Secondly, they argue that the levels of protection among all South Asian countries, with the possible
exception of Sri Lanka, are too high to make a regional arrangement practical. Third, they contend that
when countries in an FTA are allowed to choose sectors to exclude from tariff preferences, domestic
lobbies press to protect those sectors of their country that may not withstand foreign competition. The
rules of origin, too, may be misused by bureaucrats to block imports if an inefficient domestic competitor
is affected.
Baysan et al.‘s first argument, however, may not apply to bilateral trade between India and Bangladesh,
since India has been a major source of imports for Bangladesh, suggesting that India might be the most
efficient import source for many products. Secondly, study has shown that tariffs in India are often
redundant because competition between Indian producers is so intense that it forces down prices
domestically, even to levels below world prices.8 The third argument may stand, however, because the
sensitive lists of SAFTA members are long.
Empirical quantitative studies on regional integration in South Asia differ significantly in terms of the
methodologies employed. Broadly, three types of models have been used: (i) gravity models; (ii) partial
equilibrium models; and (iii) CGE models.
Gravity models have been widely used to predict the impact of RTAs on bilateral trade flows,9 and their
findings have been mixed.10
Srinivasan and Canonero predicted that the impact of SAFTA on trade flows
would be small for India but much larger for the smaller countries. Coulibaly found net export creation,
whereas Tumbarello and Hirantha found net trade creation from the South Asian Preferential Trading
Arrangement (SAPTA). On the other hand, Hassan observed net trade diversion effects from SAPTA, and
Rahman (2003) found that regional integration is unlikely to generate significant trade expansion in this
region. Using an augmented gravity model, Rodríguez-Delgado found that trade liberalization under
SAFTA might influence regional trade flows mainly by increasing India‘s exports and both Bangladesh‘s
and Nepal‘s imports.
The advantage in partial equilibrium models11
is that they are generally based on disaggregated data and
are also flexible, which facilitates sector-specific study. However, they ignore general equilibrium
interactions and thus cannot capture inter-sectoral effects on the economy.
8 See Pursell (2004) and World Bank (2004).
9 The gravity models basically try to explain bilateral trade flows with a set of explanatory variables, which in
turn try to predict the impact of the arrangement on bilateral trade flows. Typically, the exercise involves
estimating a bilateral trade-flow equation with bilateral trade (imports, exports, or total trade at the aggregate
or sector level) as the dependent variable and country characteristics, such as the gross domestic products,
population, distance, commonality of language or cultural ties and the existence of preferential trade
arrangements, as independent variables. Once estimated, the equation can then be used to predict the impact of
a union between country pairs that did not have such a union during the sample period. 10
See Srinivasan and Canonero (1995), Hassan (2001), Coulibaly (2004), Hirantha (2004), Tumbarello (2006),
Rahman (2003), and Rodríguez-Delgado (2007). 11
The major partial equilibrium studies on RTA in South Asia have been Govindan (1994), DeRosa and
Govindan (1995), Pursell (2004), and the World Bank (2006).

4
To explore the potential of an India–Bangladesh bilateral FTA, the World Bank (2006) provided a
comparative assessment between Bangladesh and India with respect to cement, light bulbs, sugar, and
readymade garments (RMGs). The partial equilibrium simulation suggested that for cement, lights bulbs,
and sugar the likely effects of an FTA between Bangladesh and India were an expansion of Indian exports
to Bangladesh, but no exports from Bangladesh to India. This is mainly because Indian export prices for
these products are substantially lower than ex-factory, before-tax prices of the same or similar products in
Bangladesh. The simulations for RMGs predicted increased Bangladeshi exports to India and also
increased RMG exports from India to Bangladesh. The study found that an FTA would bring large
welfare gains for consumers in Bangladesh provided there is adequate expansion of infrastructure and
administrative capacity at custom borders. It, however, cautioned that the benefits of such an FTA for
Bangladesh could be wiped out if it had the effect of keeping out cheaper, third-country imports (mainly
from East Asia), and such trade diversion costs could be large. The study suggested that the only way to
minimize trade diversion costs would be through further unilateral liberalization.
Studies based on CGE models12
predict the effects of the trading arrangement on all variables including
production, consumption, and trade flows in all sectors of the economy as well as on welfare. These
studies employed the Global Trade Analysis Project (GTAP) database and model, though they differ in
technicalities and assumptions because of the evolution of the GTAP itself. Pigato et al. found that
regional integration in South Asia would produce benefits for member nations, though unilateral trade
liberalization would yield larger gains. Bandara and Yu argued that, in terms of real income, such
integration would lead to gains for India and Sri Lanka, while Bangladesh would stand to lose. Raihan
and Razzaque found that Bangladesh would incur a net welfare loss from SAFTA because, despite a
positive trade creation effect, the negative trade diversion effect would be large enough to offset the
positive gain. However, all other South Asian countries would gain from SAFTA, and as far as any
individual country is concerned, India would gain the maximum.
From a trade perspective, and to forge greater regional integration in South Asia, there is a need to reduce
trade costs. Despite falling tariffs, trade in South Asia has suffered because of higher trade costs. Banik
and Gilbert (2008) found that for a 100 percent increase in trade costs, exports from India to neighboring
Asia are expected to fall between 42 percent and 73 percent. De (2009) found that trade transport costs
across South Asia are very high and vary across goods and countries. The cost of trade transport increases
for landlocked countries like Nepal. Land borders in South Asia are overcrowded and need special
attention to reduce time delays and transaction costs. Higher trade costs not only restrict trade but can also
reduce the political will for greater regional cooperation.
Other studies show that trade facilitation reforms significantly contribute to greater regional integration in
South Asia‘s intra-regional trade.13
Hertel and Mirza (2009) observed that trade facilitation plays an
important role in determining patterns of global trade flows, where the relative effect on bilateral trade of
improving exporters‘ border logistics is larger than improving importers‘ trade facilitation. The study also
revealed that proportionate increases in intra-regional trade are larger in all countries for textile and
clothing, automobiles and parts, and other manufactured goods.
South Asia is notoriously weak in facilitating trade at borders.14
The region suffers from excessive direct
costs and time taken at border crossings, and inefficiencies in cross-border transactions. Trade in this
region is also constrained by poor infrastructure, congestion, high costs, and lengthy delays. These
problems are particularly severe at border crossings, many of which pose significant barriers to trade. De
and Ghosh (2008) argued that transaction costs of India‘s exports to Bangladesh have increased despite
12
Major studies that applied the CGE model to regional integration in South Asia are Pigato et al. (1997),
Bandara and Yu (2003), and Raihan and Razzaque (2007). 13
Refer, for example, Asian Development Bank (ADB)-UNCTAD (2008) 14
See, for example, De (2008a, 2008b), and De (2011).

5
simplification of documentation at borders. The paper concluded that the rent-seeking informal economy
is deep-rooted and makes trade transaction expensive at borders. Sharma (2007) observed that removing
such inefficiencies in trade transactions would increase welfare in the region by about US $116 million
per annum as compared to a gain in income of US$ 418 million from a preferential removal of regional
trade tariffs. However, it is worth noting that some smaller countries in the region gained much more
from removal of transaction inefficiencies than from trade liberalization. This underscores the importance
of implementing reforms in border infrastructure and logistics in tandem with other policy reforms to
enhance regional integration.
Nahar and Siriwardana (2009) examined, in a CGE framework, the contribution of trade liberalization
policies to household welfare and poverty in Bangladesh. They found that complete removal of tariffs
favors export-oriented, labor-intensive sectors, such as RMGs and the knitting industry in Bangladesh in
both the short and long term. They argued that in rural areas trade liberalization has a positive impact on
poverty in the short run, and in urban areas it has helped raise poor people to the non-poor category in the
long run, despite a negative impact in the short run.
3. Market Access for Trade in Goods and Selected Services
South Asia‘s ability to integrate successfully with the global economy is drawing increasing international
interest. However, bilateral trade barriers present an impediment not only to access for trade in goods
between countries but integration of the region as a whole. This section discusses market access issues in
bilateral trade in goods, particularly for Bangladesh. It presents the pattern of Bangladesh‘s trade with
other South Asian countries and applies a global general equilibrium model to explore the effects of an
FTA between Bangladesh and India.
Table 1: Share of Bangladesh’s Exports with Neighbouring Countries*
Country Year
1995 2000 2005 2007 2008 2009
Bhutan 0.00 0.00 0.02 0.00 0.00 0.00
India 0.79 0.35 1.90 2.31 2.20 1.53
Nepal 0.03 0.00 0.01 0.01 0.01 0.01
Pakistan 1.03 0.91 0.87 0.41 0.40 0.48
Sri Lanka 0.41 0.10 0.13 0.13 0.14 0.12
South Asia total 2.26 1.36 2.93 2.86 2.75 2.14
Rest of the world 97.74 98.64 97.07 97.14 97.25 97.86 *As percentage of total export.
Source: Calculated based on UN COMTRADE.
3.1. Bangladesh’s Trade with Neighboring Countries
Intra-regional trade between South Asian countries has been low for decades. Prior to 1951, its share of
the region‘s total trade was in double digits. By 1967, however, as South Asia became progressively more
closed to the world market and political rivalry between India and Pakistan intensified, intra-regional
trade fell to just 2 percent of the total. It rose through the 1990s and by 2002 had increased to 4.4 percent
(Baysan et al.). It peaked at 6.21 percent in 2004 and then fell back to 4.46 percent in 2010 (Figure 1a),
though this decline in intensity is attributable more to South Asia‘s increased trade with the rest of the
world than to intra-regional declines.15
The region‘s outward trade may look healthy, but its internal
activity, compared to other regions such as NAFTA, ASEAN, and EU, is very low (Figure 1b). South
15
During 2004 and 2008, South Asia‘s trade with the world more than doubled (from US$245 billion in 2004 to
US$600 billion in 2008) and increased faster than intra-regional trade (based on IMF DOTS).

6
Asia has been an insignificant export destination for Bangladesh for many years. In 1995, its exports to
South Asia were only 2.26 percent of its total. By 2009 this had declined to 2.14 percent (Table 1).
Bangladesh‘s dependence on South Asia for imports also declined, from 15.5 percent in 1995 to 12.02
percent in 2009 (Table 2).
Table 2: Share of Bangladesh’s Imports with Neighbouring Countries*
Country Year
1995 2000 2005 2007 2008 2009
Bhutan 0.13 0.03 0.00 0.00 0.00 0.00
India 11.31 6.66 10.86 11.83 13.78 10.36
Nepal 0.01 0.01 0.00 0.00 0.00 0.02
Pakistan 3.95 1.40 1.24 1.41 1.52 1.55
Sri Lanka 0.11 0.13 0.09 0.10 0.09 0.10
South Asia total 15.52 8.22 12.20 13.34 15.39 12.02
Rest of the world 84.48 91.78 87.80 86.66 84.61 87.98 *As percentage of total import.
Source: Calculated based on UN COMTRADE.
Figure 1a: Intra-Regional Trade in SAARC
Note: Intra-regional trade intensity index is the ratio of intra-regional trade share to that
of world trade with the region, based on export data. An index of more than 1 indicates
intra-regional trade flows larger than expected given the importance of the region in the
world.16
Intra-regional trade is the percentage of intra-regional trade to total trade of the
region, based on export data. A higher share indicates a higher degree of dependency
on regional trade.
Source: ARIC, ADB
16
Intra-regional trade intensity index was calculated based on following:
wy wy
wd wd
sw sw
sd sd
X
X
X
X , where s is the set of
countries in a region, d is the destination in the region, w and y represent countries in the world, and X is the
bilateral flow of total exports.

7
Figure 1b: SAARC Trade vs. Other Regions
Source: Calculations based on Direction of Trade Statistics Online Database (DOTS), IMF.
Figure 2: Bangladesh Trade with India (1980–2010)
0
500
1000
1500
2000
2500
3000
3500
4000
4500
1980
1982
1984
1986
1988
1990
1992
1994
1996
1998
2000
2002
2004
2006
2008
2010
US
$ m
illio
n
Exports to India
Imports from India
Source: IMF DOTS.
Bangladesh‘s trade with neighboring countries is unequally distributed, having little to do with Bhutan,
Nepal, or Sri Lanka. India is Bangladesh‘s primary trading partner, followed by Pakistan. Bangladesh has
a high deficit in its trade with India––having risen from US$ 44 million to US$ 2.5 billion from 1981-
2009 (Figure 2).17
The ten years from 2000-2009 have seen the fastest rise in Bangladesh‘s exports to
India (42.65 percent per annum growth), while Bangladesh‘s import growth from India declined to 16.24
percent per annum (Figure 3). Nevertheless, Bangladesh exports are only 1 percent of India‘s total
imports and the range of products is small, mostly fertilizers and jute products. RMGs are Bangladesh‘s
major exports, but the share going to India is very small, at least so far.
17
From a macroeconomic point of view, the issue is whether the current account deficit is sustainable, and this
has not been a concern because Bangladesh has had consistent trade surpluses with trading partners like the US
and EU, and has also enjoyed surpluses on its invisibles account.
0
10
20
30
40
50
60
70
80
19
90
19
91
19
92
19
93
19
94
19
95
19
96
19
97
19
98
19
99
20
00
20
01
20
02
20
03
20
04
20
05
20
06
20
07
20
08
20
09
20
10
Intr
areg
ion
al t
rdae
(%)
ASEAN SAARC NAFTA EU
8
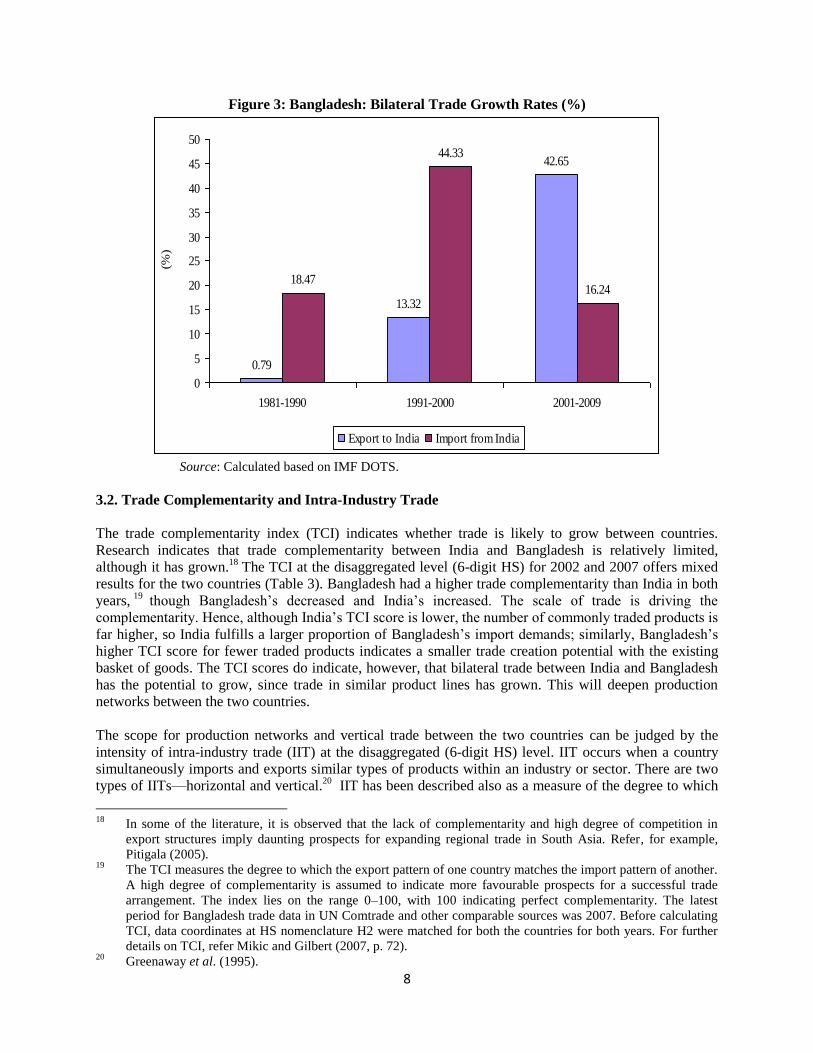
Figure 3: Bangladesh: Bilateral Trade Growth Rates (%)
0.79
13.32
42.65
18.47
44.33
16.24
0
5
10
15
20
25
30
35
40
45
50
1981-1990 1991-2000 2001-2009
(%)
Export to India Import from India
Source: Calculated based on IMF DOTS.
3.2. Trade Complementarity and Intra-Industry Trade
The trade complementarity index (TCI) indicates whether trade is likely to grow between countries.
Research indicates that trade complementarity between India and Bangladesh is relatively limited,
although it has grown.18
The TCI at the disaggregated level (6-digit HS) for 2002 and 2007 offers mixed
results for the two countries (Table 3). Bangladesh had a higher trade complementarity than India in both
years,19
though Bangladesh‘s decreased and India‘s increased. The scale of trade is driving the
complementarity. Hence, although India‘s TCI score is lower, the number of commonly traded products is
far higher, so India fulfills a larger proportion of Bangladesh‘s import demands; similarly, Bangladesh‘s
higher TCI score for fewer traded products indicates a smaller trade creation potential with the existing
basket of goods. The TCI scores do indicate, however, that bilateral trade between India and Bangladesh
has the potential to grow, since trade in similar product lines has grown. This will deepen production
networks between the two countries.
The scope for production networks and vertical trade between the two countries can be judged by the
intensity of intra-industry trade (IIT) at the disaggregated (6-digit HS) level. IIT occurs when a country
simultaneously imports and exports similar types of products within an industry or sector. There are two
types of IITs––horizontal and vertical.20
IIT has been described also as a measure of the degree to which
18
In some of the literature, it is observed that the lack of complementarity and high degree of competition in
export structures imply daunting prospects for expanding regional trade in South Asia. Refer, for example,
Pitigala (2005). 19
The TCI measures the degree to which the export pattern of one country matches the import pattern of another.
A high degree of complementarity is assumed to indicate more favourable prospects for a successful trade
arrangement. The index lies on the range 0–100, with 100 indicating perfect complementarity. The latest
period for Bangladesh trade data in UN Comtrade and other comparable sources was 2007. Before calculating
TCI, data coordinates at HS nomenclature H2 were matched for both the countries for both years. For further
details on TCI, refer Mikic and Gilbert (2007, p. 72). 20
Greenaway et al. (1995).

9
trade in a particular sector is based on scale economies and/or market structure.21
By engaging in IIT, a
country can reduce the number of similar goods it produces and benefit from scale economies. Higher IIT
ratios suggest that these sources of gains are being exploited. The IIT index measures the degree of
overlap between imports and exports in the same commodity category, with a value of 1 indicating pure
intra-industry trade and a value of 0 indicating pure inter-industry trade.22
Table 3: Trade Complementarity Index (TCI) at 6-digit HS
Reporter
(Exporter)
Partner
(Importer)
TCI (%) Number of Commonly Traded
Products
(2002) (2007) (2002) (2007)
Bangladesh India 42.0 39.3 1,057 1,752
India Bangladesh 27.1 32.2 4,256 4,270 Source: Calculated based on UN COMTRADE.
Table 4: Intra-Industry Trade (IIT) Index* in 2007: Common Set of Products at 6-digit HS
HS Code Product IIT India IIT Bangladesh
230220 Rice bran oil 0.935 0.836
721550 Bars and rods other than free-cutting steel not further worked
than cold formed/cold finished
0.923 0.421
850720 Other lead-acid accumulators 0.922 0.557
600622 Other knitted or crocheted fabrics of cotton, dyed 0.771 0.929
960719 Other slide fasteners 0.770 0.719
610510 Men‘s/boys‘ shirts of cotton 0.758 0.819
621790 Parts of garments/clothing accessories 0.729 0.463
848390 Parts of transmission shafts, cranks, bearing housings, gears or
clutch
0.703 0.778
854419 Winding wires of other metals/substances 0.505 0.633
620319 Suits of other textile materials 0.486 0.704
521211 Other unbleached woven fabrics of cotton weighing not more
than 200 g/m2
0.417 0.770
*IIT index was calculated for bilateral trade between India and Bangladesh.
Source: Calculations based on UN COMTRADE.
To identify the vertical IIT, the indices at a high disaggregated level (HS 6) are compared with those at a
low disaggregated level (HS 2). IIT indices that are low at HS 6 and high at HS 2 are a necessary,
although not sufficient, condition for the existence of vertical trade because they suggest that the countries
trade different products in the same sector.23
Examination of the common set of traded goods between
21
Horizontal IIT refers to the simultaneous exports and imports of goods classified in the same sector and at the
same stage of processing, usually based on product differentiation. Vertical IIT refers to the simultaneous
exports and imports of goods classified in the same sector but at different stages of processing, usually based
on the ―fragmentation‖ of the production process into different stages, each performed at different locations
and taking advantage of the local conditions. See, for example, Sodersten and Reed (1994). 22
Before calculating IIT, data coordinates at HS nomenclature H2 were matched for both countries. The
traditional way to measure the degree of intra-industry trade is the Grubel-Lloyd Index (G-L Index). For
further details, refer to Mikic and Gilbert (2007, p. 76). 23
The authors are grateful to the referee for asking to carry this particular comparison. However, the usual caveat
is that there might be aggregation bias. When the IIT index is observed to be low at HS6 but high at HS2, one
10
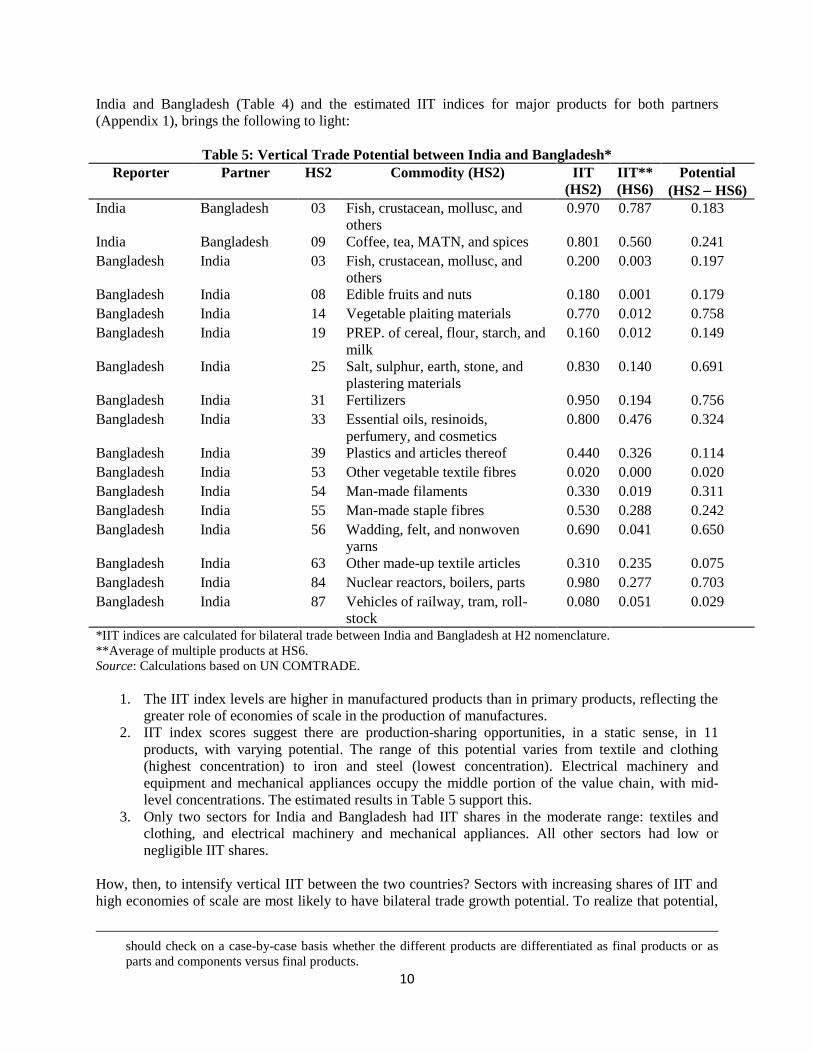
India and Bangladesh (Table 4) and the estimated IIT indices for major products for both partners
(Appendix 1), brings the following to light:
Table 5: Vertical Trade Potential between India and Bangladesh*
Reporter Partner HS2 Commodity (HS2) IIT
(HS2)
IIT**
(HS6)
Potential
(HS2 HS6)
India Bangladesh 03 Fish, crustacean, mollusc, and
others
0.970 0.787 0.183
India Bangladesh 09 Coffee, tea, MATN, and spices 0.801 0.560 0.241
Bangladesh India 03 Fish, crustacean, mollusc, and
others
0.200 0.003 0.197
Bangladesh India 08 Edible fruits and nuts 0.180 0.001 0.179
Bangladesh India 14 Vegetable plaiting materials 0.770 0.012 0.758
Bangladesh India 19 PREP. of cereal, flour, starch, and
milk
0.160 0.012 0.149
Bangladesh India 25 Salt, sulphur, earth, stone, and
plastering materials
0.830 0.140 0.691
Bangladesh India 31 Fertilizers 0.950 0.194 0.756
Bangladesh India 33 Essential oils, resinoids,
perfumery, and cosmetics
0.800 0.476 0.324
Bangladesh India 39 Plastics and articles thereof 0.440 0.326 0.114
Bangladesh India 53 Other vegetable textile fibres 0.020 0.000 0.020
Bangladesh India 54 Man-made filaments 0.330 0.019 0.311
Bangladesh India 55 Man-made staple fibres 0.530 0.288 0.242
Bangladesh India 56 Wadding, felt, and nonwoven
yarns
0.690 0.041 0.650
Bangladesh India 63 Other made-up textile articles 0.310 0.235 0.075
Bangladesh India 84 Nuclear reactors, boilers, parts 0.980 0.277 0.703
Bangladesh India 87 Vehicles of railway, tram, roll-
stock
0.080 0.051 0.029
*IIT indices are calculated for bilateral trade between India and Bangladesh at H2 nomenclature.
**Average of multiple products at HS6. Source: Calculations based on UN COMTRADE.
1. The IIT index levels are higher in manufactured products than in primary products, reflecting the
greater role of economies of scale in the production of manufactures.
2. IIT index scores suggest there are production-sharing opportunities, in a static sense, in 11
products, with varying potential. The range of this potential varies from textile and clothing
(highest concentration) to iron and steel (lowest concentration). Electrical machinery and
equipment and mechanical appliances occupy the middle portion of the value chain, with mid-
level concentrations. The estimated results in Table 5 support this.
3. Only two sectors for India and Bangladesh had IIT shares in the moderate range: textiles and
clothing, and electrical machinery and mechanical appliances. All other sectors had low or
negligible IIT shares.
How, then, to intensify vertical IIT between the two countries? Sectors with increasing shares of IIT and
high economies of scale are most likely to have bilateral trade growth potential. To realize that potential,
should check on a case-by-case basis whether the different products are differentiated as final products or as
parts and components versus final products.

11
both countries need to further liberalize trade: reduce tariffs (largely in the case of imports into
Bangladesh), remove non-tariff barriers, reduce trade costs by improving trade facilitation at borders and
then inland. It has been argued that by driving down real trade costs and trade and transport logistics
barriers, India and Bangladesh may realize the potential of higher production-sharing arrangements.24
The
World Bank has stated that the drivers of such trade go beyond relative factor endowments to factors such
as complementary use of information and communication technologies and natural geographies
(clustering, agglomeration, and scale effects).25
Kimura and Kobayashi argue that according to
fragmentation theory, the key to attracting fragmented production blocks is to improve the advantages of
location by, for example, developing special economic zones (SEZs) with at least an improved local-level
investment climate, and to reduce the cost of service links that connect remotely located production
blocks by improving trade and transport facilitation (see Figure 4 that illustrates the link between
improved service links and strengthening of production networks).
Figure 4: Production Blocks and Service Links
Source: Kimura and Kobayashi (2009).
Table 6: Number of South Asian Students in Indian Universities
Country Year
1991–92 1995–96 2001–02 2005–06 2007–08
Afghanistan 125 118 33 70 976
Bangladesh 565 1244 545 345 368
Bhutan 112 155 254 365 487
Maldives 18 23 14 42 264
Nepal 725 695 873 1252 1821
Pakistan 12 4 3 4 8
Sri Lanka 487 363 504 431 997
South Asia 2044 2602 2226 2909 4965 Source: Association of Indian Universities (AIU), New Delhi.
24
See World Bank (2010, 2012). 25
Manufacturing production sharing (or vertical specialization) is a key characteristic in East Asia‘s regional
integration and export dynamism. See, for example, Yeats (2008), Kimura (2006), Ando (2007), and Kimura
and Kobayashi (2009).

12
3.3. Trade in Services in Education and Health Sectors between Bangladesh and India
A large part of services trade between India and Bangladesh is informal. There has been a small, formal
flow of trade in education and health-related services between the two countries but, generally, barriers
inhibit this bilateral trade. Barriers to trade in services are not like tariffs; they are typically regulatory,
rather than explicit taxes. The barriers between the two countries are complex and have been taxing such
trade for years. For example, trade in higher education services––in which Bangladeshi students pursue
higher education in India––has fallen at a time when the number of foreign students studying in India has
increased strongly overall (Table 6).26
Capacity and quality constraints in Bangladeshi institutions encourage students to pursue higher
education in India and elsewhere. Generally, consumption abroad (mode 2, students moving abroad to
study), is assumed to be the most frequently-used mode by which education services are traded between
India and Bangladesh. However, a host of problems prevent the two countries opening up their facilities,
raising standards, recognizing each other‘s standards (mutual recognition), and removing barriers to
education services trade. The Bangladesh government has unilaterally allowed foreign direct investment
(FDI) through joint ventures in educational services. But Indian educational institutions (except those in
information technology) are yet to open branches under mode 3 (commercial presence) in Bangladesh.
With the setting up of the South Asian University (SAU) in India, the flow of Bangladeshi students in
higher education might rise. The flow presently is unidirectional, to India, and at least some observers
believe that there is substantial informal trade in the sector.27
Both countries need to remove the barriers
prohibiting formal movement of students, by issuing hassle-free and long-term multiple-entry visas. The
Bangladesh government could facilitate Indian universities and institutions to set up branches in major
cities in Bangladesh, with free interaction between faculties of Bangladeshi and Indian universities (say,
under mode 4), thereby encouraging inter-personal contact between the two countries. The prime
ministerial meeting in Bangladesh in September 2011 brought about some progress in this regard. The
two leaders agreed to promote trade in services under the SAARC agreement and directed early
completion of work to harmonize the education curricula and mutually recognize degrees in the two
countries.28
Health services trade consists mainly of patients crossing borders. However, South Asian countries face a
host of obstacles to opening up health services, recognizing each other‘s standards, and removing barriers
to health-care trade. Bangladeshi patients visit India for treatment every year, largely because of a paucity
of quality domestic health infrastructure.29
At the same time, the informal trade in health services is huge
and unaccounted for. Consumption abroad (mode 2) is known to be the most popular mode of trade in
health services between the two countries, but the number of Bangladeshi patients travelling to India in
this mode is unknown.30
26
Due to the absence of mode-wise trade in higher education between the two countries, in value terms, it is
difficult to pinpoint the actual flow of higher education services in either direction. 27
According to Rahman (2002), a considerable number of Bangladeshi students studying in India use Indian
identities. 28
See the joint statement issued after the visit of the Indian Prime Minister to Bangladesh on September 7, 2011. 29
Refer, Raychaudhuri and De (2012). Rahman (2002) states that about 57 percent of Bangladeshi patients
seeking treatment abroad in 1999 went to India, and most chose India because of the unavailability of medical
facilities in Bangladesh and because the Indian medical services are better. 30
Rahman (2002) estimated that about 50,000 Bangladeshi patients were treated in India in 1999, through which
India earned about US$30 million.
13
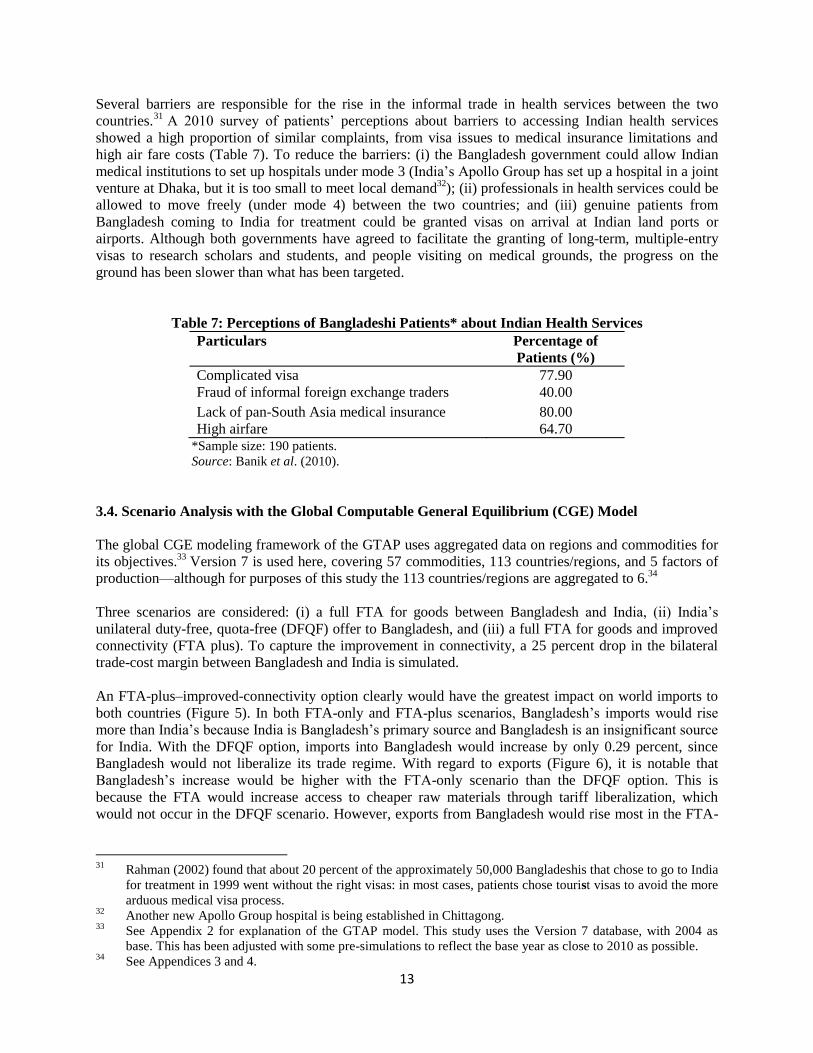
Several barriers are responsible for the rise in the informal trade in health services between the two
countries.31
A 2010 survey of patients‘ perceptions about barriers to accessing Indian health services
showed a high proportion of similar complaints, from visa issues to medical insurance limitations and
high air fare costs (Table 7). To reduce the barriers: (i) the Bangladesh government could allow Indian
medical institutions to set up hospitals under mode 3 (India‘s Apollo Group has set up a hospital in a joint
venture at Dhaka, but it is too small to meet local demand32
); (ii) professionals in health services could be
allowed to move freely (under mode 4) between the two countries; and (iii) genuine patients from
Bangladesh coming to India for treatment could be granted visas on arrival at Indian land ports or
airports. Although both governments have agreed to facilitate the granting of long-term, multiple-entry
visas to research scholars and students, and people visiting on medical grounds, the progress on the
ground has been slower than what has been targeted.
Table 7: Perceptions of Bangladeshi Patients* about Indian Health Services
Particulars Percentage of
Patients (%)
Complicated visa 77.90
Fraud of informal foreign exchange traders 40.00
Lack of pan-South Asia medical insurance 80.00
High airfare 64.70 *Sample size: 190 patients.
Source: Banik et al. (2010).
3.4. Scenario Analysis with the Global Computable General Equilibrium (CGE) Model
The global CGE modeling framework of the GTAP uses aggregated data on regions and commodities for
its objectives.33
Version 7 is used here, covering 57 commodities, 113 countries/regions, and 5 factors of
production––although for purposes of this study the 113 countries/regions are aggregated to 6.34
Three scenarios are considered: (i) a full FTA for goods between Bangladesh and India, (ii) India‘s
unilateral duty-free, quota-free (DFQF) offer to Bangladesh, and (iii) a full FTA for goods and improved
connectivity (FTA plus). To capture the improvement in connectivity, a 25 percent drop in the bilateral
trade-cost margin between Bangladesh and India is simulated.
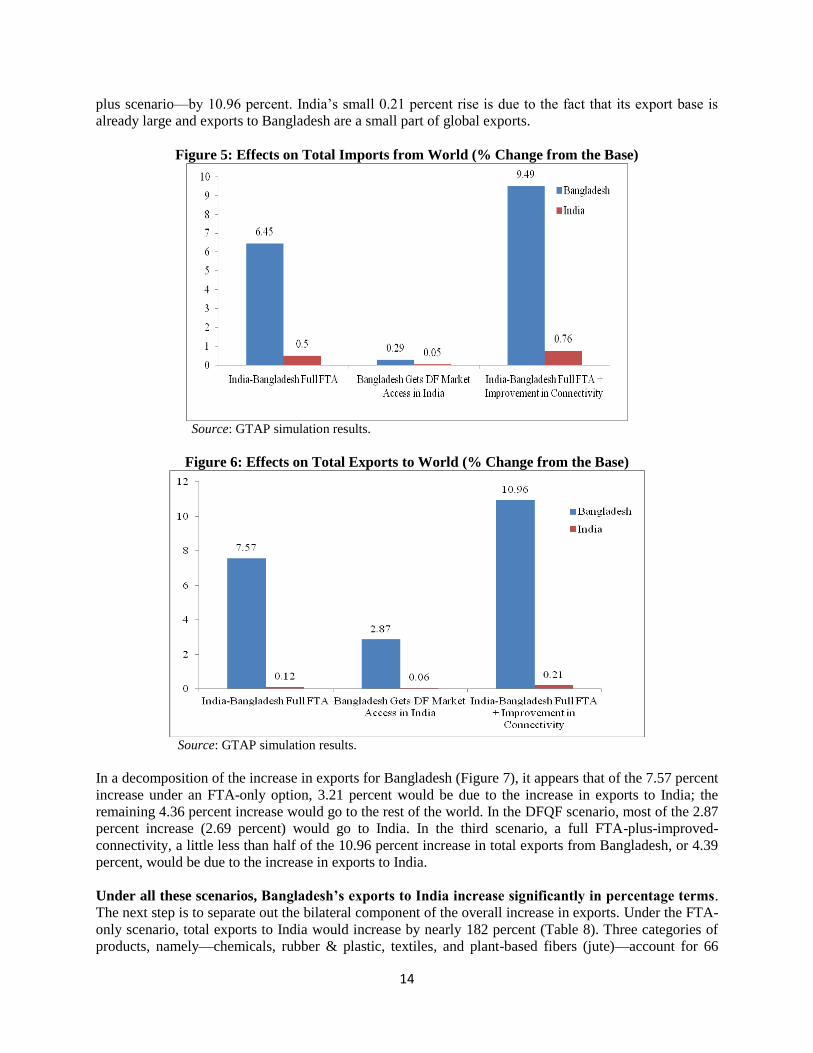
An FTA-plus–improved-connectivity option clearly would have the greatest impact on world imports to
both countries (Figure 5). In both FTA-only and FTA-plus scenarios, Bangladesh‘s imports would rise
more than India‘s because India is Bangladesh‘s primary source and Bangladesh is an insignificant source
for India. With the DFQF option, imports into Bangladesh would increase by only 0.29 percent, since
Bangladesh would not liberalize its trade regime. With regard to exports (Figure 6), it is notable that
Bangladesh‘s increase would be higher with the FTA-only scenario than the DFQF option. This is
because the FTA would increase access to cheaper raw materials through tariff liberalization, which
would not occur in the DFQF scenario. However, exports from Bangladesh would rise most in the FTA-
31
Rahman (2002) found that about 20 percent of the approximately 50,000 Bangladeshis that chose to go to India
for treatment in 1999 went without the right visas: in most cases, patients chose tourist visas to avoid the more
arduous medical visa process. 32
Another new Apollo Group hospital is being established in Chittagong. 33
See Appendix 2 for explanation of the GTAP model. This study uses the Version 7 database, with 2004 as
base. This has been adjusted with some pre-simulations to reflect the base year as close to 2010 as possible. 34
See Appendices 3 and 4.
14
plus scenario––by 10.96 percent. India‘s small 0.21 percent rise is due to the fact that its export base is
already large and exports to Bangladesh are a small part of global exports.
Figure 5: Effects on Total Imports from World (% Change from the Base)
Source: GTAP simulation results.
Figure 6: Effects on Total Exports to World (% Change from the Base)
Source: GTAP simulation results.
In a decomposition of the increase in exports for Bangladesh (Figure 7), it appears that of the 7.57 percent
increase under an FTA-only option, 3.21 percent would be due to the increase in exports to India; the
remaining 4.36 percent increase would go to the rest of the world. In the DFQF scenario, most of the 2.87
percent increase (2.69 percent) would go to India. In the third scenario, a full FTA-plus-improved-
connectivity, a little less than half of the 10.96 percent increase in total exports from Bangladesh, or 4.39
percent, would be due to the increase in exports to India.
Under all these scenarios, Bangladesh’s exports to India increase significantly in percentage terms.
The next step is to separate out the bilateral component of the overall increase in exports. Under the FTA-
only scenario, total exports to India would increase by nearly 182 percent (Table 8). Three categories of
products, namely––chemicals, rubber & plastic, textiles, and plant-based fibers (jute)––account for 66

15
percent of Bangladesh‘s total exports to India. Under a full bilateral FTA, exports to India of these three
products would rise by 130 percent, 240 percent, and 165 percent. Export of other products, too, would
rise significantly. In the DFQF scenario, exports to India increase by 134 percent, but the FTA-plus
scenario offers a 297 percent rise in exports to India. So, reducing transaction costs in trade seems to have
a significant stimulatory effect on exports.
Figure 7: Decomposition of Increase in Total Exports from Bangladesh
Source: GTAP simulation results.
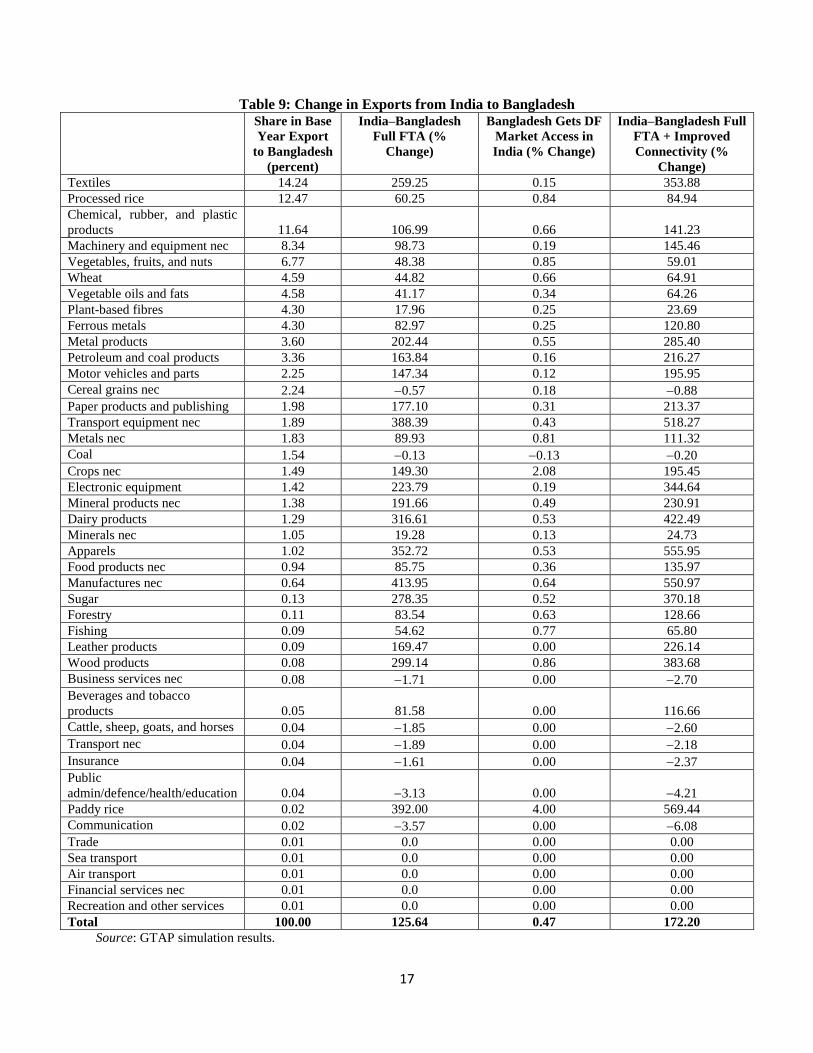
India‘s exports to Bangladesh also increase significantly (Table 9). An FTA-only option would raise
India‘s exports to Bangladesh by about 126 percent. The leading export item (i.e., textiles) would jump by
259 percent, and exports of processed rice, and chemicals, rubber & plastics would also rise strongly. A
DFQF offers negligible benefits (since the offer is from India), but a full FTA-plus-improved connectivity
would boost Indian exports to Bangladesh the most, by 172 percent.
3.4.1. Removal of India’s Negative List and Its Impact on Bangladesh’s Export to India
The above analysis has become relevant since there have been developments in market access offers from
India. Ahead of the state visit of Indian Prime Minister Manmohan Singh to Bangladesh in September
2011, India removed all 46 textile lines affecting Bangladesh from its negative list in SAFTA‘s provisions
for least-developed countries (LDCs), thereby zero-rating the duty on those items.35
With further tariff
concessions and removal of items from India‘s negative list just before the 2011 SAARC Summit,
Bangladesh to India exports are now close to free-trade, except for about 25 items (mostly tobacco and
liquor).
To analyze the impact of this action on the Bangladesh-India trade scenario, the change in weighted tariff
has been calculated for each of the GTAP sectors,36
and three scenarios simulated, in all of which India
gives Bangladesh zero-duty market access: (i) with no sensitive list (i.e., the DFQF scenario above), (ii)
keeping India‘s old sensitive list of 480 products for LDCs, and (iii) keeping India‘s sensitive list of 46
products for LDCs.37
Change in exports has been calculated in each of these scenarios with reference to
the base.
35
Refer to the joint statement for the visit of the Prime Minister of India to Bangladesh on September 7, 2011. 36
In the GTAP model there are 57 sectors. However, the sensitive lists are provided at the 6-digit HS code. 37
The list of 46 negative-list items appears in Appendix 5.

16
Table 8: Change in Exports from Bangladesh to India Share in Base
Year Export to
India (percent)
India–Bangladesh
Full FTA (%
Change)
Bangladesh Gets
DFQF Market
Access in India (%
Change)
India–Bangladesh
Full FTA +
Improved
Connectivity (%
Change)
Chemical, rubber, and plastic
products 36.46 130.49 90.16 228.17
Textiles 17.27 240.01 188.84 392.37
Plant-based fibres 12.38 165.23 102.54 226.99
Fishing 8.59 32.89 21.66 56.52
Metal products 3.17 244.63 202.71 368.19
Leather products 2.72 195.07 158.95 365.44
Business services nec 2.65 31.48 1.08 61.19
Wearing apparel 2.45 278.51 199.61 359.31
Public
admin/defence/health/education 2.11 30.78 0.9 50.71
Food products nec 2.05 202.69 152.56 402.46
Ferrous metals 1.62 261.34 201.76 370.40
Metals nec 1.10 335.8 245.22 513.15
Machinery and equipment nec 0.99 307.58 213.46 494.88
Petroleum and coal products 0.93 123.92 82.47 177.26
Crops nec 0.74 2002.23 1746.15 3461.86
Sea transport 0.72 33.43 1.33 48.26
Wood products 0.61 248.35 165.63 375.78
Communication 0.6 25.99 0 45.97
Vegetables, fruits, and nuts 0.54 1659.19 1280.7 2678.03
Mineral products nec 0.31 127.95 75 169.23
Minerals nec 0.27 56.93 25 116.25
Beverages and tobacco products 0.27 137.86 85.71 222.93
Financial services nec 0.22 29.65 4.35 51.64
Transport nec 0.19 28.78 0 42.96
Manufactures nec 0.16 295.5 205.88 510.92
Animal products nec 0.14 78.38 40 126.75
Vegetable oils and fats 0.10 1765.26 1580 3174.33
Sugar 0.10 185.08 136.36 276.26
Electronic equipment 0.10 309.98 220 495.62
Transport equipment nec 0.07 301.17 242.86 502.39
Recreation and other services 0.07 30.53 0 49.36
Paper products and publishing 0.06 179.57 133.33 312.72
Motor vehicles and parts 0.06 3505.94 2916.67 5233.18
Insurance 0.06 32.27 0 52.28
Forestry 0.04 381.17 250 567.42
Construction 0.04 27.62 25 46.58
Air transport 0.04 30.23 0 45.13
Processed rice 0.01 29.65 0 51.27
Trade 0.01 28.49 0 42.88
Total 100.00 182.17 133.53 297.04
Source: GTAP simulation results.
17
Table 9: Change in Exports from India to Bangladesh Share in Base
Year Export
to Bangladesh
(percent)
India–Bangladesh
Full FTA (%
Change)
Bangladesh Gets DF
Market Access in
India (% Change)
India–Bangladesh Full
FTA + Improved
Connectivity (%
Change)
Textiles 14.24 259.25 0.15 353.88
Processed rice 12.47 60.25 0.84 84.94
Chemical, rubber, and plastic
products 11.64 106.99 0.66 141.23
Machinery and equipment nec 8.34 98.73 0.19 145.46
Vegetables, fruits, and nuts 6.77 48.38 0.85 59.01
Wheat 4.59 44.82 0.66 64.91
Vegetable oils and fats 4.58 41.17 0.34 64.26
Plant-based fibres 4.30 17.96 0.25 23.69
Ferrous metals 4.30 82.97 0.25 120.80
Metal products 3.60 202.44 0.55 285.40
Petroleum and coal products 3.36 163.84 0.16 216.27
Motor vehicles and parts 2.25 147.34 0.12 195.95
Cereal grains nec 2.24 0.57 0.18 0.88
Paper products and publishing 1.98 177.10 0.31 213.37
Transport equipment nec 1.89 388.39 0.43 518.27
Metals nec 1.83 89.93 0.81 111.32
Coal 1.54 0.13 0.13 0.20
Crops nec 1.49 149.30 2.08 195.45
Electronic equipment 1.42 223.79 0.19 344.64
Mineral products nec 1.38 191.66 0.49 230.91
Dairy products 1.29 316.61 0.53 422.49
Minerals nec 1.05 19.28 0.13 24.73
Apparels 1.02 352.72 0.53 555.95
Food products nec 0.94 85.75 0.36 135.97
Manufactures nec 0.64 413.95 0.64 550.97
Sugar 0.13 278.35 0.52 370.18
Forestry 0.11 83.54 0.63 128.66
Fishing 0.09 54.62 0.77 65.80
Leather products 0.09 169.47 0.00 226.14
Wood products 0.08 299.14 0.86 383.68
Business services nec 0.08 1.71 0.00 2.70
Beverages and tobacco
products 0.05 81.58 0.00 116.66
Cattle, sheep, goats, and horses 0.04 1.85 0.00 2.60
Transport nec 0.04 1.89 0.00 2.18
Insurance 0.04 1.61 0.00 2.37
Public
admin/defence/health/education 0.04 3.13 0.00 4.21
Paddy rice 0.02 392.00 4.00 569.44
Communication 0.02 3.57 0.00 6.08
Trade 0.01 0.0 0.00 0.00
Sea transport 0.01 0.0 0.00 0.00
Air transport 0.01 0.0 0.00 0.00
Financial services nec 0.01 0.0 0.00 0.00
Recreation and other services 0.01 0.0 0.00 0.00
Total 100.00 125.64 0.47 172.20
Source: GTAP simulation results.

18
Table 10: Bangladesh’s Increased Exports to India – Three Scenarios
Scenarios
Bangladesh has duty-
free market access in
India with no sensitive
list
Bangladesh has duty-
free market access in
India keeping India’s
sensitive list of 480
products for LDCs
Bangladesh has duty-
free market access in
India keeping India’s
sensitive list of 46
products for LDCs
Rise in Bangladesh
exports to India, from
base (%)
133.53 19.12 85.09
Source: GTAP simulation results. The increase in exports is calculated with reference to the baseline.
The static export potential could be considered as an increase in exports of 134 percent (the first scenario
above), i.e., with no sensitive list (Table 10). Other simulation results show that India‘s maintaining of the
sensitive list of 480 products would only see an export increase of about 19 percent, much less than the
first scenario. It should be noted, however, that Bangladesh‘s major export items––readymade garments
(RMGs, HS codes 61 and 62)––have a very limited export base in India, so the GTAP model would
always show a small rise in these product exports, even under a ―no sensitive list‖ scenario. Initially, India
was wary of allowing Bangladesh‘s garments into its market. But after the September 2011 prime
ministerial agreement, India has allowed Bangladesh‘s RMGs into its market under a duty-free, quota-
free scenario. However, although the GTAP simulations show the removal of the 46 textile products from
the negative list raises Bangladesh‘s exports to India by about 48 percentage points (difference between
first and third simulations), the volume is very small in comparison to Bangladesh‘s global sales.
Nonetheless, given India‘s massive market, it also suggests that Bangladesh has enormous potential to
increase garment exports to India.
The projected trade outcomes imply that an FTA would stimulate Bangladesh‘s trade with India
significantly; both countries would likely see a substantial increase in manufactured goods‘ exchanged
under duty-free market access. Bangladesh, especially, would benefit from improved performance in its
highly labor-intensive manufacturing sectors, thereby helping to reduce poverty.
For India, closer economic cooperation with Bangladesh would be an important stepping-stone to
reducing the economic isolation of its eastern and north-eastern states. A bilateral FTA between the two
countries could help address this isolation, and provide an impetus to resolve problems relating to non-
tariff barriers.
A very important caveat for policy makers is that the above analysis based on the GTAP model
simulation is static in nature and is therefore not capable of capturing the dynamic impacts of bilateral
trading arrangements. Also, when trade is restricted (for whatever reason), the model cannot capture ―new
trade‖; if the initial base of trade in any product is very low (or even zero), there would not be any
substantial increase (or no increase, in the case of zero base) in trade for that particular commodity.
However, as evidence suggests, mutual tariff concessions can generate trade in new items. For instance,
in the bilateral FTA between India and Sri Lanka, the latter benefited by initiating exports of vanaspati oil
to India, which had been almost nil before the FTA.
Thus, these simulation results represent only a part of the additional trade that will be generated—in
particular, Bangladesh could gain by creating a production base in new products. Indian FDI into
Bangladesh could play a key role in that process. Seen in this light, the above simulation results could be
seen as a lower bound of the potential increase in Bangladesh‘s exports to India.

19
3.5. Market Access Issues
While tariff concessions have been offered under SAPTA and SAFTA, there would be greater benefit in
addressing non-tariff and para-tariff barriers in both countries. In this paper, while the primary concern is
Bangladeshi exports to India, a few examples of non-tariff and para-tariff barriers in both countries are
discussed below.38
One, India requires permitted risk analysis of agricultural imports in biosecurity and sanitary &
phytosanitary categories, and this has turned out to be a complex process lacking transparency. It covers
about 600 items with the aim of protecting ―human, animal or plant life or health‖. Nearly all livestock,
agricultural, and food imports require sanitary or phytosanitary (SPS) certificates and import permits from
India‘s Ministry of Agriculture.
Two, the Indian Food Adulteration (Prevention) Act 1954 requires the shelf life of processed foods to be
not less than 60 percent of the original shelf life at the time of import. While this objective is fine, the
process of determining shelf life is often arbitrary and non-transparent. India‘s Prevention of Food
Adulteration Rules, 1955, are complicated. Just one rule, number 32, has 30 provisions with further sub-
provisions. It also cross-references other rules prescribing content, size and design of labels, display-panel
specifications, details of colors and flavors, trade names, and so on. No certificate from the country of
origin is accepted. The results of laboratory tests cannot be challenged. Separate regulations exist for
various food types.
Three, to export textile and textile products to India, exporters must obtain a pre-shipment inspection
certificate from a textile testing laboratory accredited to the National Accreditation Agency of the country
of origin. Non-availability of the certificate requires testing from the notified agencies in India for each
and every consignment. In some cases, even certificates issued by EU-accredited labs have been rejected
by Indian customs authorities and such consignments are subject to repeat tests in India. In addition, the
Textile (consumer protection) Regulation of 1988 imposes strict marking requirements for yarns, fibers,
and fabrics imported into India.
Four, exporters of jute products to India must have certificates from the exporting country providing it
does not contain more than 3 percent, by weight, of non-homogenate hydrocarbon (jute batching oil). Jute
bags/sacks require special labeling, and each bag/sack must carry machine-stitched marking of the
country of origin.
Bangladesh also imposes several NTBs and supplementary duties on Indian exports. Some of them are as
follows39
:
One, Bangladesh has imposed over 60 percent supplementary duty on import of plastics from India.
Two, Bangladesh still maintains 225 items in its sensitive list in terms of trade with India, covering
machinery, pharmaceuticals, textiles, etc.
Other issues brought up by the Commerce Secretary level discussion held on 28-29 March 2012 include
the cases of port restrictions in both countries. Not all Indian ports can accept cargoes from Bangladesh.
There are also port restrictions imposed by Bangladesh on Indian exports. For example, port restrictions
38
Sourced from Raihan (2011). 39
Summary record of India-Bangladesh Commerce Secretary level discussions held at New Delhi on 28-29
March, 2012. Available at http://commerce.nic.in/WhatsNew/IndiaBangladeshTalk.pdf

20
exist in Bangladesh on export of vulcanized rubber thread via Akhaura LCS. Similarly, exports of yarn,
milk powder, fish, sugar, and potatoes from India (particularly from the northeastern states and West
Bengal) face port restrictions in Bangladesh.
Finally, the same Commerce Secretary level discussions also note that heavy restrictions limit
professional exchanges and cooperation. Moreover, Indian companies and professionals face difficulties
in sending remittances back to India. Indian exporters can remit dollars converted from taka only as
royalty, consultancy and "other charges", and there is a ceiling on the repatriable amount (for example,
under 'royalty', only 6 percent of the sale proceeds in Bangladesh can be repatriated). This creates
problems for knowledge-intensive sectors like software, IT and telecom, architecture, and so on.
Thus, non-tariff measures/barriers such as standards, certification, regulations, labeling, documentation
and public procurement, licensing, countervailing measures, tariff quotas, and anti-dumping measures are
all matters of contention between India and Bangladesh. Non-tariff barriers are the most difficult, and
undermine the trade potential of both countries. Sanitary & Phytosanitary and Technical Barriers to Trade
and related measures have been found to account for 86.3 percent of all barriers across South Asia.40
Besides, other hurdles such as stringent visa regimes, inadequate physical connectivity, restrictions in
opening bank branches, lack of testing facilities at the border, non-honoring of irrevocable letters of
credit, etc., have been faced by exporters and importers in both countries.
There is recent empirical evidence that standards harmonization tends to increase the export variety of a
partner country,41
and this may well apply to Bangladesh‘s exports to India (Rahman et al., 2011). An
arrangement for recognition in India of certificates issued by Bangladeshi testing laboratories for export
products will help exports.42
There have been misunderstandings regarding acceptance of test certificates
issued by BSTI labs for products accredited by NABL (lndia). Testing laboratories could be part of
customs stations, at least to cater to testing requirements of more commonly traded products. Mutual
recognition of testing laboratories and test reports from accredited laboratories by customs authorities will
be very useful. In this respect, the upcoming South Asian Regional Standards Organization (SARSO) in
Dhaka is a very welcome step.
Greater use of information technology in customs, to expedite processes such as electronic transfer of test
reports and certificates of origin would help bilateral trade as well as the global trade of the two countries.
This could be addressed if Bangladesh and India implement a single window system for customs. In
parallel, harmonization of HS codes at 8-digit level will reduce disputes on classification and also provide
the basis for establishing a system of seamless exchange of data between the customs authorities of
Bangladesh and India.
Such non-tariff measures/barriers can easily reduce the potential gains from tariff liberalization.
Therefore, the next generation of trade talks between the two countries should give the highest priority for
reduction of non-tariff measures/barriers.
40
See, for example, ADB-UNCTAD (2008) and Rahman et al. (2011). 41
See, for example, Shepherd (2007). 42
Bangladesh and India agreed that the respective standards‘ bodies, BIS and BSTI, will finalise the Agreement
on bilateral cooperation to enable mutual recognition for each other's standards for specified products. Refer to
the Summary record of India-Bangladesh Commerce Secretary level discussions held at New Delhi on 28 -29
March, 2012.

21
3.6. Beyond Trade in Goods
Bangladesh may gain significantly more, in the long run, from diversifying exports to India, and thereby
also exploit increasing possibilities for intra-industry trade. As the CGE analysis has shown, there could
be fewer opportunities for Bangladesh (although not small by any means) at the ―intensive margin‖
(exporting more of the same to Indian markets) compared to exports at the ―extensive margin‖
(diversifying the export basket to India‘s large and growing market).43
This is where FDI becomes very
important.
A bilateral FTA between Bangladesh and India should go beyond ―trade in goods‖ to deepen cooperation
and improve Bangladesh‘s export capability. Without significant structural changes in its production
pattern, Bangladesh will be unlikely to derive the desired benefits from a bilateral FTA. Top priority,
therefore, should be given to augmenting Bangladesh‘s export supply capability. This can be encouraged
through a broader, bilateral cooperation mechanism in the areas of investment, finance, services trade,
trade facilitation, and technology transfer. In the context of investment flows, horizontal and vertical
integration of Indian and Bangladeshi industries could help to improve scale economies, especially for
Bangladesh, and help Indian firms gain from the use of inexpensive labor. Closer economic cooperation
between the two countries would also promote Bangladesh's prospects for attracting larger investment
from India. Such investments, whether 100 percent Indian or joint ventures, would help to improve the
country's export supply capability and boost exports to both the region and the outside world.
Bilateral economic cooperation should emphasize trade in services, to enhance connectivity, trade in
health and higher education, tourism, and facilitate trade and transit, and so on. Empirical studies have
found that trade in services can generate substantial gains over and above those from trade in goods.44
Both countries would gain from continued trade liberalization, in both goods and services, and
streamlining of trade transactions through trade facilitation.
Some sectors in both countries, however, are bound to lose out due to increased import competition. In
Bangladesh these could include coal, dairy products, metal products, transport equipment, petroleum and
coal products, paper products, publishing, electronics equipment, and mineral products. In India, the
sectors could include leather products, apparel, meat products, and vegetable oils & fats. For this reason, a
possible bilateral FTA will benefit from addressing (or at least trying to address) the costs of adjustment.
4. Connectivity, Trade Facilitation, and Transit
Many empirical studies have examined the effect of transport costs on trade flows. Limão and Venables
(2001) found a link between the quality of infrastructure and transport costs and concluded that
infrastructure investments are important for export-led economic growth. Other studies argued that
differences in logistics performance are driven only in part by poor quality of physical infrastructure
services such as road, rail, waterways, port services, and interfaces.45
The inadequacies are often caused
by (non-tariff) policy and institutional constraints, such as red tape, inadequate enforcement of contracts,
poor definition and enforcement of rules of engagement, asymmetry in standards, delays in customs, ports
and border crossings, pilferage in transit, corruption, and highly restrictive protocols on movement of
cargo.
One of the key challenges facing South Asia is high cost of trading. For example, transaction costs at the
India-Bangladesh border are estimated to be very high due mainly to infrastructure bottlenecks both at the
43
Based on Hummels-Klenow (products) extensive and intensive margins. Refer to De (2012). 44
See, for example, Ahmed and Ghani (2009), Ahmed et al. (2010). 45
Subramanian and Arnold (2001).

22
borders as well as within the countries.46
The World Bank has argued that an FTA would bring large
welfare gains for consumers in Bangladesh, provided infrastructure and administrative capacity at
customs borders is adequately expanded.47
The conditions of land ports in Bangladesh are not
satisfactory. It has also been found that ports in Bangladesh are plagued by labor problems, poor
management, and lack of equipment; costs rise further with inadequate customs services, including delays
in clearances and rent-seeking.
Poor trade logistics in Bangladesh affects the cost of export and import very significantly and is reflected
in the Logistic Performance Index (LPI). The World Bank (2012) finds that the domestic logistics chain –
including collection of products from producers, road haulage to the warehouse, containerization, haulage
to the port, and customs at port- is still very underdeveloped. Bangladesh ranks 87 in the LPI, while its
South Asian comparators like India and Pakistan rank 39 and 68 respectively.
The quality and performance of logistics services differ markedly between India and Bangladesh and also
across their trade partners. These variations in time and cost stem from differences in the quality and cost
of infrastructure services as well as differences in policies, procedures, and institutions. The quality of
such services, policies, and procedures has a significant effect on trade competitiveness and market access.
While there is strong anecdotal evidence that the lack of adequate trade infrastructure might have altered
the bilateral trade potential due to trade costs, this study tries to assess the effect of trade facilitation/trade
cost elements (e.g., transit and time) and logistics services on bilateral trade. It does so with the help of an
augmented gravity model (AvW type), and then determines important trade remedies. The regressions are
based on a cross-section pooled dataset for the years 2007 and 2008. A three-stage regression process is
used here to understand the impact of trade facilitation, comprising several of the logistics and trade
facilitation indicators and shows that this captures essentially all the explanatory power of the indicators
used separately.48
Definition of variables and corresponding data sources appear in Appendix 6, and the
list of Bangladesh‘s trade partners in Appendix 7. The initial augmented gravity results are worth noting
(Table 11):
Specification 1 contains the initial set of models fitted before any of the trade facilitation or
logistics indicators or additional variables are included. It contains regressions of bilateral trade
on GDP in the exporting and importing countries. The results are qualitatively consistent with
those of earlier studies, particularly de Groot et al. (2004). What is most interesting is that the
tariff and the dummy variables for regional transit in specification 1 are statistically significant at
a 1 percent level. Furthermore, trade liberalization and regional transit would lead to increased
exports of Bangladesh, other things remaining equal.
46
De and Ghosh (2008); De and Bhattacharyay (2007a, 2007b). 47
Countries that have removed common barriers to trade have raised per-capita income by increasing trade. The
removal of common borders between Germany and the Czech Republic and between the United States and
Mexico are seen as key factors in the incomes per capita rising in the smaller countries-–-by 26 percent in the
Czech Republic and 27 percent in Mexico (Redding and Venables, 2004). 48
The following diagnostics are carried out: (i) linearity assumption between response variable and predictors is
checked; (ii) statutory hypothesis tests are carried out on the parameter estimates; (iii) Ramsey test is done to
check model specification; (iv) normality of residuals is tracked through Kernel density plot; (v) all estimates
are checked for heteroscedasticity through Cameron and Trivedi‘s decomposition of IM-test; (vi)
multicollinearity problems are checked by looking at the variance inflation factor (VIF); (vii) models do not
suffer from endogeneity as highly correlated exogenous variables are not used in the gravity equations; and
(viii) it being cross-section data, the presence of serial correlation does not appear.
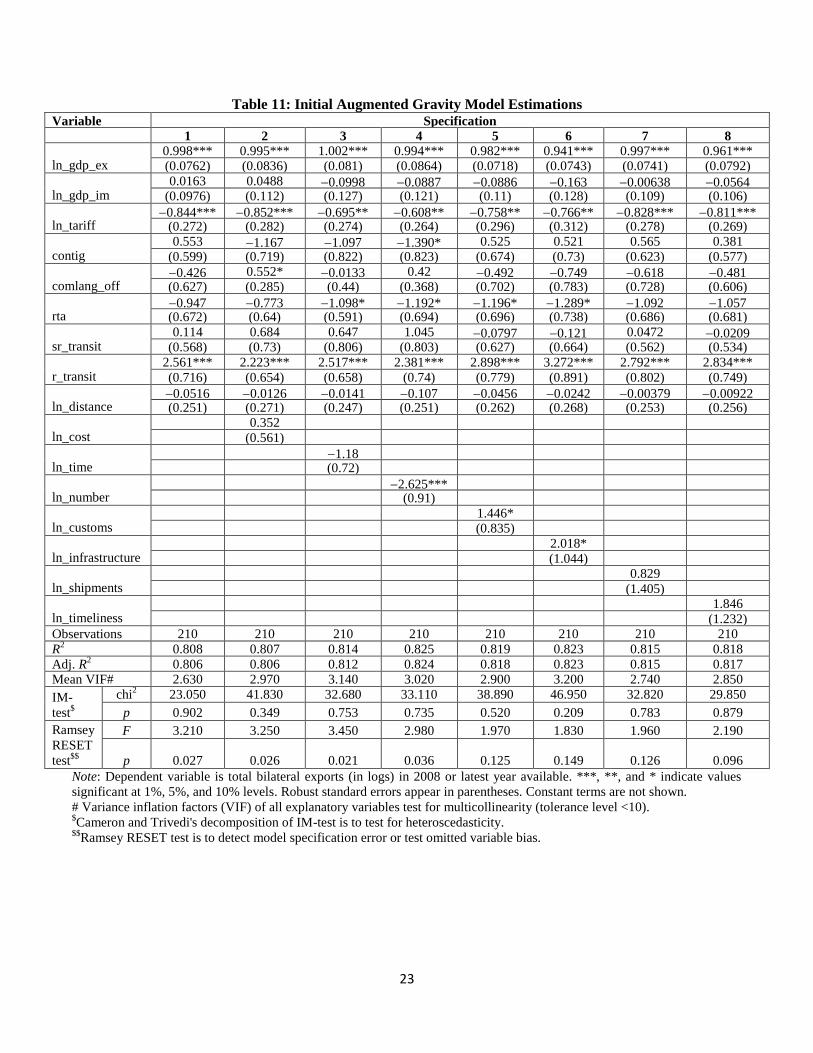
23
Table 11: Initial Augmented Gravity Model Estimations Variable Specification
1 2 3 4 5 6 7 8
ln_gdp_ex 0.998*** 0.995*** 1.002*** 0.994*** 0.982*** 0.941*** 0.997*** 0.961*** (0.0762) (0.0836) (0.081) (0.0864) (0.0718) (0.0743) (0.0741) (0.0792)
ln_gdp_im 0.0163 0.0488 0.0998 0.0887 0.0886 0.163 0.00638 0.0564
(0.0976) (0.112) (0.127) (0.121) (0.11) (0.128) (0.109) (0.106)
ln_tariff 0.844*** 0.852*** 0.695** 0.608** 0.758** 0.766** 0.828*** 0.811***
(0.272) (0.282) (0.274) (0.264) (0.296) (0.312) (0.278) (0.269)
contig 0.553 1.167 1.097 1.390* 0.525 0.521 0.565 0.381
(0.599) (0.719) (0.822) (0.823) (0.674) (0.73) (0.623) (0.577)
comlang_off 0.426 0.552* 0.0133 0.42 0.492 0.749 0.618 0.481 (0.627) (0.285) (0.44) (0.368) (0.702) (0.783) (0.728) (0.606)
rta 0.947 0.773 1.098* 1.192* 1.196* 1.289* 1.092 1.057 (0.672) (0.64) (0.591) (0.694) (0.696) (0.738) (0.686) (0.681)
sr_transit 0.114 0.684 0.647 1.045 0.0797 0.121 0.0472 0.0209
(0.568) (0.73) (0.806) (0.803) (0.627) (0.664) (0.562) (0.534)
r_transit 2.561*** 2.223*** 2.517*** 2.381*** 2.898*** 3.272*** 2.792*** 2.834***
(0.716) (0.654) (0.658) (0.74) (0.779) (0.891) (0.802) (0.749)
ln_distance 0.0516 0.0126 0.0141 0.107 0.0456 0.0242 0.00379 0.00922 (0.251) (0.271) (0.247) (0.251) (0.262) (0.268) (0.253) (0.256)
ln_cost 0.352
(0.561)
ln_time 1.18
(0.72)
ln_number 2.625*** (0.91)
ln_customs 1.446* (0.835)
ln_infrastructure 2.018*
(1.044)
ln_shipments 0.829
(1.405)
ln_timeliness 1.846
(1.232) Observations 210 210 210 210 210 210 210 210
R2
0.808 0.807 0.814 0.825 0.819 0.823 0.815 0.818
Adj. R2
0.806 0.806 0.812 0.824 0.818 0.823 0.815 0.817 Mean VIF# 2.630 2.970 3.140 3.020 2.900 3.200 2.740 2.850
IM-
test$
chi2 23.050 41.830 32.680 33.110 38.890 46.950 32.820 29.850
p 0.902 0.349 0.753 0.735 0.520 0.209 0.783 0.879
Ramsey
RESET
test$$
F 3.210 3.250 3.450 2.980 1.970 1.830 1.960 2.190
p 0.027 0.026 0.021 0.036 0.125 0.149 0.126 0.096
Note: Dependent variable is total bilateral exports (in logs) in 2008 or latest year available. ***, **, and * indicate values
significant at 1%, 5%, and 10% levels. Robust standard errors appear in parentheses. Constant terms are not shown.
# Variance inflation factors (VIF) of all explanatory variables test for multicollinearity (tolerance level <10). $Cameron and Trivedi's decomposition of IM-test is to test for heteroscedasticity.
$$Ramsey RESET test is to detect model specification error or test omitted variable bias.

24
Table 12: Augmented Gravity Model Estimations
Specification
Variable 9 10 11
ln_gdp_ex
0.932*** 0.889*** 0.866***
(0.0807) (0.0804) (0.0726)
ln_gdp_im
0.243* 0.126
(0.126) (0.132)
ln_tariff
0.611** 0.577** 0.532*
(0.300) (0.281) (0.277)
rta
1.547** 1.527** 1.382**
(0.771) (0.747) (0.641)
contig
0.998* 0.751 0.472
(0.563) (0.61) (0.581)
r_transit
3.409*** 3.466*** 3.309***
(0.889) (0.881) (0.810)
ln_distance
0.251 0.266 0.282
(0.251) (0.246) (0.242)
ln_number
3.023*** 3.397*** 3.343***
(0.965) (0.959) (0.945)
ln_customs
1.572 1.796 1.815
(1.254) (1.196) (1.217)
ln_infrastructure
2.950* 3.655*** 3.295***
(1.531) (1.288) (1.247)
ln_cc_ex
0.431* 0.489**
(0.225) (0.210)
ln_cc_im
0.129 0.134
(1.040) (1.073)
Observations 210 210 210
R2
0.844 0.853 0.852
Adj. R2 0.843 0.853 0.851
Mean VIF# 4.63 4.56 4.28
IM-test$
chi2 57.74 75.29 61.46
p 0.3388 0.1581 0.2264
Ramsey RESET
test$$
F 0.73 0.69 0.91
p 0.5365 0.5586 0.4407
Note: Dependent variable is total bilateral exports (in logs) in 2008 or latest year available.
***, **, and * indicate values significant at 1%, 5%, and 10% levels. Robust standard errors
are given in parentheses. Constant terms are not shown.
#VIF of all explanatory variables are to test for multicollinearity (tolerance level <10). $Cameron and Trivedi‘s decomposition of IM-test is to test for heteroscedasticity.
$$Ramsey RESET test is to detect model specification error or test omitted variable bias.
Specifications 2-8 include, one at a time, the set of trade facilitation and global logistics
indicators described in Appendix 6. Tariff, regional transit dummy, and exporting country GDP
are statistically significant in all the specifications. The dummy variable representing RTA,
including bilateral FTA, is significant in specifications 4-6 but appears with a negative sign.
Among the trade facilitation or logistics indicators, it is seen that the (i) number of trade
documents in the bilateral pair (ln_number), (ii) efficiency of the clearance process (speed,
simplicity, and predictability of formalities) by border control agencies, including customs

25
(ln_customs), and (iii) quality of trade and transport-related infrastructure, for example, ports,
railroads, roads, and information technology (ln_infrastructure) are statistically significant.
Therefore, it can be concluded that most of the trade facilitation and logistics indicators have a
significant effect on bilateral trade between Bangladesh and its partner countries, including India,
in the expected direction.
All the specifications in Table 11 explain over 80 percent of the variability in bilateral trade,
thereby showing considerably good fit. The robust estimation is also supported by Cameron and
Trivedi's decomposition of IM-test in all the cases, which suggests no presence of
heteroscedasticity in residuals (always reject null hypothesis). Next, low VIF scores suggest our
models do not suffer from multicollinearity (mean VIF always less than 10). However, some of
the specifications (1-4) in Table 11 suffer slightly from omitted variable bias.
The above analysis indicates that bilateral trade between India and Bangladesh is very much contingent
upon tariff, regional transit, and trade facilitation. We then select the set of those trade facilitation and
logistics indicators shown to be significantly related to bilateral trade in Table 11 in the remaining gravity
analysis. Specifications 9-11, in Table 12, include these critical trade facilitation and logistics indicators
along with the standard variables described earlier. Most of the variables in these specifications have
significant coefficients, with the expected sign, except for the importing country‘s GDP per capita.
On the basis of the finding by de Groot et al. (2004) and as argued by Rodrik et al. (2004) that
institutional quality is important in explaining bilateral trade flows, a control of corruption (cc) variable is
added to the model to represent institutional quality for both the exporting and importing country (Table
12, specifications 10-11). The exporting country‘s corruption coefficient has a negative sign and is also
statistically significant. Moreover, when institutional quality is included, the coefficient of the GDP
becomes insignificant and still has the wrong sign. Specification 11, of Table 12, gives the results:
omitting GDP of the importing country reduces the adjusted R-squared value only slightly, but improves
the coefficients of many of the statistically significant variables. As usual, none of the specifications (9–
11) suffer from multicollinearity, heteroscedasticity, or model specification error. It follows, then, that the
importing country‘s tariff, regional transit, and institutional quality of the exporting country, coupled with
trade facilitation and logistics indicators, are important for enhancing Bangladesh‘s export. For the sake
of simplicity, we need to derive a trade facilitation index (TFI), which can better represent the functional
relation between bilateral export and aforesaid explanatory variables. Three-stage augmented gravity
estimation is then selected for the remaining analysis.
The TFI for exports of Bangladesh is estimated in three stages. The first stage involves fitting a simple
gravity model that includes most of the standard variables listed in Table 12. The second stage attempts to
explain the residuals of the first-stage regression by using trade facilitation and logistics indicators, which
represent the components of trade cost such as trade infrastructure, customs and trade documentations,
and distance (a surrogate for shipping cost). The second-stage regression derives the optimal coefficients
(weights) for these variables to best explain the residuals from the first stage. If the components of these
variables are important determinants of bilateral trade, this second-stage regression would be expected to
have statistically significant explanatory power. The third stage uses the coefficients derived in the second
stage to create a single TFI in an augmented gravity model. If this single index performs reasonably well
in explaining bilateral trade flows, it can then be argued that the index systematically captures the various
components of the total trade cost.
Table 13 shows the results of these three stages. The second-stage adjusted R2 is 0.229, which is
significant since it is a cross-section period where first stage‘s residual was taken as dependent variable.
The third-stage augmented gravity model using the single TFI together with the first-stage variables
explains 83 percent of the variability in bilateral trade. This result is almost identical to the corresponding

26
one in Table 12. Therefore, the single TFI successfully replaces several separate trade facilitation and
logistics indicators.
Table 13: Three-Stage Augmented Gravity Estimations
Variable
First
Stage
Second
Stage
Third
Stage
ln_gdp_ex
0.990*** 0.893***
(0.0724) (0.0725)
ln_gdp_im
0.0894 0.0494
(0.11) (0.128)
ln_tariff
0.829*** 0.737***
(0.244) (0.245)
rta
0.936 1.198*
(0.614) (0.609)
contig
0.182 0.222
(0.432) (0.548)
r_transit
2.478*** 3.094***
(0.669) (0.742)
ln_cc_ex
0.161 0.357
(0.189) (0.227)
ln_cc_im
0.023 0.043
(0.102) (0.154)
ln_distance
0.217
(0.167)
ln_number
2.666***
(0.937)
ln_customs
1.424*
(1.294)
ln_infrastructure
0.849*
(1.185)
ln_tfi
3.645***
(1.263)
Observations 210 210 210
R2
0.809 0.231 0.831
Adj. R2
0.809 0.229 0.830
Mean VIF# 2.58 4.84 3.19
IM-test$
chi2 28.1 18.45 51.95
p 0.6159 0.4928 0.0653
Ramsey
RESET test$$
F 3.49 1.39 1.95
p 0.0191 0.2515 0.1277
Notes: Dependent variable for first and third stages is total bilateral exports (in logs)
in 2008 or latest year available. Dependent variable for the second stage is first-stage
residuals. ***, **, and * indicate values significant at 1%, 5%, and 10% levels.
Robust standard errors are in parentheses. Constant terms are not shown.
#Variance inflation factors (VIF) of all explanatory variables test for
multicollinearity (tolerance level <10). $Cameron and Trivedi‘s decomposition of IM-test is to test for heteroscedasticity.
$$
Ramsey RESET test is to detect model specification error or test omitted variable
bias.

27
4.1. Implications
The implications of the gravity analysis in the context of India–Bangladesh bilateral trade are shown in
Appendix 8, and suggest that bilateral trade is highly responsive to improvements in transaction
efficiencies. The gravity estimates suggest that a 10 percent reduction in the trade-related documentation
could result in a 7.31 percent increase in bilateral trade. Similarly, a 10 percent improvement in the
efficiency of clearance processes by border control agencies, including customs, might lead to a 3.91
percent increase in bilateral trade. In the case of trade infrastructure, a 10 percent improvement in the
quality of trade and transport-related infrastructure could lead to a 2.33 percent increase in bilateral trade.
Besides, Table 13 (third stage) shows that further trade liberalization (10 percent cut in tariff) would lead
to rise in bilateral trade (7.37 percent). The table also shows that regional transit in South Asia is
extremely important, and would help increase Bangladesh‘s exports to South Asia substantially.49
Improved trade facilitation (as defined by the TFI) will have the strongest effect on Bangladesh‘s bilateral
trade; a 1 percent improvement in trade facilitation would result in an almost 4 percent increase in
Bangladesh‘s exports. These results also show that the gravity model with the TFI could also be used to
evaluate the effectiveness of initiatives to improve logistics.
It would be very important to place the objectives of reducing transaction costs of trading between India
and Bangladesh within the larger context of regional transit in South Asia. And to gain the full benefits of
regional transit, integration of transportation networks should be a priority objective of South Asian
cooperation.50
Two other elements that would help bilateral trade between India and Bangladesh are foreign direct
investment and trade in energy––elements that might require further study. Foreign investment would
help increase Bangladesh exports in the medium to long run. Inflow of foreign capital would stimulate
exports and imports, transfer of technology, and generate employment. The energy sector, too, offers
enormous investment and trade opportunities for both countries, particularly in a sub-regional context that
includes Bhutan and Nepal.
5. Conclusions and Policy Implications
Contiguous countries like Bangladesh and India can benefit greatly from opportunities for trade and
economic cooperation. The scope for trade expansion between the two countries depends partly on their
trade complementarity, which is relatively limited but growing, partly on account of their economic
imbalance. The other driver of bilateral trade is intra-industry trade between India and Bangladesh. This
has the potential to grow significantly, since trade in similar product lines has been growing, and that
could deepen production networks between the two countries.
What are the prospects for production networks and vertical trade between the two countries? This study
shows that the intra-industry trade (IIT) index levels are higher in manufactured than in primary products,
reflecting the greater role of economies of scale in the production of those products. Moreover, the IIT
index scores suggest that there are production-sharing possibilities in a static sense in 11 products. These
range from textiles and clothing (the highest concentration) to iron and steel (lowest concentration), with
electrical machinery & equipment and mechanical appliances occupying the middle (medium
concentration) of the value chain.
49
Estimated coefficient of regional transit dummy is found to be statistically significant. 50
Owing to the importance of transportation integration, connectivity has been the central focus of SAARC.
―South Asia has flourished most when connected to itself and the rest of the world‖ (from Indian Prime
Minister Manmohan Singh‘s speech at the 14th SAARC Summit in 2007, available at
http://pib.nic.in/newsite/erelease.aspx?relid=26591.)
28
How can vertical IIT between the two countries be intensified? This analysis indicates that a number of
product categories and sectors exhibit an increasing share of IIT, and these are the sectors with the
potential for increasing bilateral trade through IIT, at least to begin with, based on the static analysis. In
order to realize this potential, both countries would have to further liberalize trade, for instance by
reducing tariffs (in the case of Bangladesh) and reducing non-tariff barriers (both countries), and reducing
trade costs by improving trade facilitation both at borders and within the borders.
Judging complementarity is only a start in analyzing the potential for a bilateral trade relationship. The
analysis on IIT summarized in the previous section is based on actual trade patterns. The next question
would be to understand the impact of liberalizing market access by one or both countries to each other‘s
exports.
Market access offers have considerable potential to enhance trade. This study considered three scenarios
with regard to market access for trade in goods (first, full FTA in goods; second, a one way offer by India
to Bangladesh for duty and quota free access in goods (which has already happened); and third, a full
FTA for goods along with improved connectivity between Bangladesh and India). A global CGE model
shows that in all three scenarios, Bangladesh‘s exports to India increase very significantly. It was
observed that under the first scenario, exports to India would increase by over 182 percent, in the second
by 134 percent, and in the third by 297 percent. India also gains significantly in the FTA and FTA plus
scenarios. In the first scenario, India‘s exports to Bangladesh would increase by about 126 percent, in the
second scenario, hardly at all, and in the third scenario, by 172 percent. Reducing transaction costs in
trade lead to significantly higher exports, as seen through a comparison of the first and third scenario
results. The GTAP simulations also suggest that India‘s removal of 46 products from its negative list
(which has already been done) could increase Bangladesh‘s exports to India by about 48 percentage
points from the base level.
The projected trade outcomes imply that an FTA would provide a significant stimulus for Bangladesh to
increase its presence in the Indian market. It is also likely that both countries would see a substantial
increase in manufactured exports to each other as duty-free market access opened up with the FTA.
However, for Bangladesh to benefit fully from such market access and expand its exports to India, it
would need an adequate expansion of its inland and international infrastructure and administrative
capacity for handling bilateral trade.
The above analysis is still limited by existing patterns of trade, and so does not consider the dynamic
potential for trade to grow and expand into new areas that the models are not able to capture. It could be
said that the CGE projections represent a lower bound for trade expansion as a result of a possible FTA
agreement. For Bangladesh, whose export basked is still very concentrated, foreign investment from India
as well as other countries would be critical to improve technology and skills and enhance production
capabilities in goods as well as trade-related infrastructure.
Thus, a bilateral FTA between Bangladesh and India should go beyond any treaty based on ―trade in
goods‖, and should include cooperation in the areas of investment, finance, services trade, trade
facilitation, and technology transfer. Despite the fact that there are some risks of welfare loss for
Bangladesh through trade diversion in a bilateral FTA (such risks are low since India is already a
dominant competitive supplier), the gains from extended economic cooperation in investment and
services trade could be much larger. And both countries would gain from continued trade liberalization
and streamlining of border transactions through trade facilitation and improved physical connectivity.
The study briefly considered services trade between the two countries, a large part of which is informal.
There has been a formal flow of services trade to a small extent, for example in education and health-
related services. Barriers to trade in services (e.g., mutual recognition) are not like tariffs; typically these

29
are regulatory barriers, rather than explicit taxes; they are complex in nature and impose high costs, at
least on the formal component of bilateral trade in services. Mutual recognition of degrees, easier access
to visas, and Bangladesh‘s encouragement of Indian FDI in health and education services would help
improve trade in such services.
Going beyond an analysis of market access, the study considered the issue of trading costs in some depth.
Cumbersome and complex cross-border trading procedures raise the already-high transaction costs of the
trading systems of India and Bangladesh. A comprehensive measure of trade costs is derived from a
gravity model of international trade. The analysis reveals that improved trade facilitation coupled with
regional transit would help increase trade between the two countries. At the same time, there is strong
evidence that improving the efficiency of customs and administrative procedures and simplifying trade-
related documentation would also facilitate their trade. For example, as this study shows, a 10 percent
reduction in trade-related documentation could result in a 7.31 percent increase in bilateral trade; a 10
percent improvement in the efficiency of clearance processes by border control agencies, including
customs, might lead to a 3.91 percent increase in bilateral trade; a 10 percent improvement in the quality
of trade and transport-related infrastructure could lead to a 2.33 percent increase in bilateral trade.
Not only will there be large payoffs to addressing the major bilateral barriers to reducing trading costs,
there will be additional major gains in keeping the regional picture in mind. For India and Bangladesh, the
system should aim to greatly reduce current physical and soft barriers to transportation and transit by
means of physical infrastructure (such as multimodal corridors and terminals) and soft infrastructure
(reformed policies and procedures, regulations, and incentives for efficient transportation and transit).
Simplification of processes and procedures in trade transactions would certainly increase the bilateral
trade between the two countries even in very short run. Reduction of NTBs should get utmost priority in
this context. To derive larger gains, India and Bangladesh, along with other South Asian partners, should
develop a regional (or sub-regional) transportation and transit system that offers efficient transportation
options and low transaction costs that are competitive with those found elsewhere.
India can help deepen bilateral economic relations with Bangladesh through infrastructure investment.
One option would be to invest in inland and border infrastructure to reduce the bottlenecks resulting from
the expansion of the domestic private sector. This would mean a strategy of infrastructure development
following private investment. Another option would entail both governments using infrastructure
development as an engine for bilateral and regional growth. This would require a strategy where
infrastructure development leads and crowds in private investment––for example, if both governments
were to jointly build adjacent special economic zones (SEZs) at the India-Bangladesh border. India‘s
latest US$ 1 billion credit to Bangladesh for the development of country‘s infrastructure is an example of
the latter approach.
Increased trade between Bangladesh and India will require measures going beyond tariffs. This would
mean India following up the significant changes on the tariff front (India now offers a free trade regime to
Bangladesh for all except 25 products) with reduction in non-tariff measures/barriers. In addition, FDI by
Indian and other foreign firms would help enhance product complementarities and production networks.
Finally, Bangladesh would also gain from reducing its tariffs and para-tariffs as well as non-tariff
measures/barriers in its trade with India, since this will help expand its overall production capability and
help it to exploit dynamic gains from trade.
India-Bangladesh cooperation offers a ―win-win‖ prospect for both countries and the South Asia region as
a whole. For India, closer economic cooperation would help to reduce the economic isolation of its north-
eastern states. A bilateral FTA between the two countries could create scope for resolving some of these
critical issues while reducing non-tariff barriers.

30
Finally, the next generation of economic cooperation talks between the two countries should address non-
tariff measures/barriers, services trade, technology transfer, logistics and infrastructure, finance and
investments.

31
References
Ahmed, S. and E. Ghani (2007). South Asia: Growth and Regional Integration. Macmillan, New Delhi.
Ahmed, S. and E. Ghani (2009). Accelerating Growth and Job Creation in South Asia. Oxford University
Press, New Delhi.
Ahmed, S., S. Kelegama, and E. Ghani (2010). Promoting Economic Cooperation in South Asia: Beyond
SAFTA. Sage Publications, New Delhi.
Asian Development Bank (ADB)–United Nations Conference on Trade and Development (UNCTAD)
(2008). Quantification of Benefits from Economic Cooperation in South Asia. Macmillan, New Delhi.
Bandara, J.S. and W. Yu (2003). ‗How Desirable Is the South Asian Free Trade Area? A Quantitative
Economic Assessment‘, in D.S. Greenaway (ed.), World Economy: Global Trade Policy 2003.
Blackwell Publishing, Oxford, U.K.
Banik, A., P. De, P.K. Bhaumik, S.M.M. Huq, and B.B. Bajracharya (2010). ‗Trade in Health Services in
South Asia: An Examination of the Need for Regional Cooperation‘. Final Report No. 10–10, South
Asia Network of Economic Research Institutes (SANEI), Dhaka.
Banik, N. and J. Gilbert (2008) ‗Regional Integration and Trade Cost in South Asia‘, ADBI Working
Paper 127, Asian Development Bank Institute (ADBI), Tokyo
Baysan, T., A. Panagariya, and N. Pitigala (2006). ‗Preferential Trading in South Asia‘. World Bank
Policy Research Working Paper No. 3813, World Bank, Washington, D.C.
Bhagwati, J. and A. Panagariya (1996). ―The Theory of Preferential Trade Agreements: Historical
Evolution and Current Trends‖, American Economic Review, 86(2), pp. 82–87.
Coulibaly, S. (2004). ‗On the Assessment of Trade Creation and Trade Diversion Effects of Developing
RTAs‘. Paper presented at the Annual Meeting 2005 of the Swiss Society of Economics and Statistics
on Resource Economics, Technology, and Sustainable Development. Available at
http://www.wif.ethz.ch/resec/sgvs/078.pdf.
De Groot, H. L. F., et al. (2004) ―The Institutional Determinants of Bilateral Trade Flows‖, Kyklos, 57(1),
pp. 103–123.
De, P. (2008a). ‗Empirical Estimates of Trade Costs for Asia‘, in D. Brooks and J. Menon (eds.),
Infrastructure and Trade in Asia. Edward Elgar, Cheltenham.
De, P. (2008b). ‗Transport Infrastructure for Deeper Regional Integration: Emerging Challenges and
Policy Options‘. South Asia Development and Cooperation Report 2008, Chapter 7. Oxford
University Press, New Delhi.
De, P. (2009). ‗Trade Transportation Costs in South Asia: An Empirical Investigation‘, in D. Brooks and
D. Hummels (eds.), Infrastructure’s Role in Lowering Asia’s Trade Costs: Building for Trade.
Edward Elgar, Cheltenham.
De, P. (2010). ―Transit and Trade Barriers in South Asia: Multilateral Obligations and Development
Perspective‖, Law and Development Review, 3(2), pp. 270-305.
De, P. (2011). ―Why Is Trade at Border a Costly Affair in South Asia? An Empirical Investigation‖,
Contemporary South Asia, 19(4), pp 441-464.
De, P. (2012). ‗Unlocking India – Bangladesh Trade Potential‘, Presentation Made at the CUTS-FBS
Stakeholder‘s Consultation on India-Bangladesh Bilateral Trade and Non-Tariff Barriers, Held at
Kolkata, 31 May 2012.
De, P. and B. Bhattacharyay (2007a). ‗Prospects of India–Bangladesh Economic Cooperation:
Implications for South Asian Regional Cooperation‘. Asian Development Bank Institute (ADBI)
Discussion Paper No. 78, ADBI, Tokyo.
De, P. and B. Bhattacharyay (2007b). ‗Deepening India–Bangladesh Bilateral Economic Cooperation:
Challenges and Opportunities‘. Discussion Paper No. 130, Research and Information System for
Developing Countries (RIS), New Delhi.
De, P. and B. Ghosh (2008). ―Reassessing Transaction Costs of Trade at the India–Bangladesh Border‖,
Economic and Political Weekly, 43(29), pp. 69-79.
32
DeRosa, D.A. and K. Govindan (1995). ‗Agriculture, Trade, and Regionalism in South Asia‘. Food,
Agriculture, and the Environment Discussion Paper No. 7, International Food Policy Research
Institute, Washington, D.C.
Govindan, K. (1994). ‗A South Asian Preferential Trading Arrangement: Implications for Agricultural
Trade and Economic Welfare‘. Mimeo, World Bank, Washington, D.C.
Greenaway, D., R. Hine, and C. Milner (1995). ―Vertical and Horizontal Intra-industry Trade: A Cross-
industry Analysis for the United Kingdom‖, The Economic Journal, 105(November), pp. 1505–1518.
Hassan, M.K. (2001). ―Is SAARC a Viable Economic Block? Evidence from Gravity Model‖, Journal of
Asian Economics, 12(2), pp. 263–290.
Hertel, T.W. (1997). Global Trade Analysis: Modeling and Applications. Cambridge University Press,
Cambridge.
Hertel, T.W. and T. Mirza (2009). ‗The Role of Trade Facilitation in South Asian Economic Integration‘,
in ADB (ed.), Study on Intraregional Trade and Investment in South Asia. Asian Development Bank
(ADB), Manila.
Hirantha, S.W. (2004). ‗From SAPTA to SAFTA: Gravity Analysis of South Asian Free Trade‘. Paper
presented at the European Trade Study Group (ETSG) 2004 Programme, Nottingham.
Kimura, F. and I. Kobayashi (2009). ‗Why Is the East Asia Industrial Corridor Needed?‘ ERIA Policy
Brief No. 2009-01, ERIA, Jakarta.
Krugman, P. (1991) ―Increasing Returns and Economic Geography‖, The Journal of Political Economy,
99(3), pp. 483 - 499
Limão, N. and A. J. Venables (2001) ―Infrastructure, Geographical Disadvantage, Transport Cost, and
Trade‖, World Bank Economic Review, 15(3), pp. 451-479
Mikic, M. and J. Gilbert (2007). Trade Statistics in Policy Making: A Handbook of Commonly Used
Trade Indices and Indicators. UNESCAP, Bangkok.
Nahar, B. And M. Siriwardana (2009) ―Impact of Trade Liberalization on Poverty in Bangladesh: A
Quantitative Assessment‖, South Asia Economic Journal, 10(2), pp. 325-369
Pigato, M., C. Farah, K. Itakura, K. Jun, W. Martin, K. Murrell, and T.G. Srinivasan (1997). ‗South
Asia‘s Integration into the World Economy.‘ World Bank, Washington, D.C.
Pitigala, N. (2005). ‗What Does Regional Trade in South Asia Reveal about Future Trade Integration?
Some Empirical Evidence‘. World Bank Policy Research Working Paper No. 3497, World Bank,
Washington, D.C.
Pursell, G. (2004). ‗An India–Bangladesh Free Trade Agreement? – Some Potential Economic Costs and
Benefits‘. Mimeo, World Bank, Washington, D.C.
Rahman, M. (2002). ‗Bangladesh–India Bilateral Trade: An Investigation into Trade in Services‘, in T.N.
Srinivasan (ed.), Trade, Finance and Investment in South Asia. South Asia Network of Economic
Research Institutes (SANEI) and Social Science Press, New Delhi.
Rahman, Md. M. (2003). ‗A Panel Data of Bangladesh‘s Trade: The Gravity Model Approach‘. Paper
presented at the European Trade Study Group (ETSG) 2003 Programme, Madrid. Available at
http://www.etsg.org/ETSG2003/papers/rahman.pdf
Rahman, M., T. I. Khan, A. Nabi, and T.K. Paul (2011). ―Bangladesh‘s Export Opportunities in the
Indian Market: Addressing Barriers and Strategies for Future‖, South Asia Economic Journal, 12(1),
pp. 117–141.
Raychaudhuri, A. and P. De (2012). International Trade in Services in India: Implications for Growth
and Inequality in a Globalising World. Oxford University Press, New Delhi.
Raihan, S. (2011). ‗Economic Corridors in South Asia: Exploring the Benefits of Market Access and
Trade Facilitation‘. Mimeo, Research and Information System for Developing Countries (RIS), New
Delhi.
Raihan, S. and A. Razzaque (2007). ‗Regional Trading Arrangements (RTAs) in South Asia: Implications
for the Bangladesh Economy‘, in S. Raihan and A. Razzaque (eds.), WTO and Regional Trading
Arrangement: Quantitative Assessment of Potential Implications for Bangladesh. Pathak Samabesh,
Dhaka.

33
Redding S., and A. J. Venables (2004). ―Economic Geography and International Inequality‖, Journal of
International Economics, 62(1), pp. 53-82
Rodrik, D., A. Subramanian, and F. Trebbi (2004) ―Institutions Rule: The Primacy of Institutions Over
Geography and Integration in Economic Development‖ Journal of Economic Growth, 9(2), pp. 131–
165.
Rodríguez-Delgado, J.D. (2007). ‗SAFTA: Living in a World of Regional Trade Agreements.‘ IMF
Working Paper 07/23, International Monetary Fund (IMF), Washington, D.C.
SACEPS (2002). SACEPS Task Force Report on South Asian Investment Cooperation. SACEPS, Dhaka.
Shepherd, B. (2007). ‗Product Standards, Harmonization, and Trade: Evidence from the Extensive
Margin‘. World Bank Policy Research Working Paper No. 4390, World Bank, Washington, D.C.
Sodersten, B. and G. Reed (1994) International Economics, Third Edition, Macmillan, London
Srinivasan, T.N. and G. Canonero (1995). ‗Preferential Trading Arrangements in South Asia: Theory,
Empirics and Policy.‘ Yale University, New Haven. Unpublished manuscript.
Subramanian, U. and J. Arnold (2001). Forging Subregional Links in Transportation and Logistics in
South Asia, World Bank, Washington, D.C.
Tumbarello, P. (2006). ‗Are Regional Trade Agreements in Asia Stumbling or Building Blocks? Some
Implications for the Mekong Countries‘. Paper Prepared for the Seminar on Accelerating
Development in the Mekong Region – The Role of Economic Integration. Siem Reap, Cambodia, June
26–27, 2006.
Whalley, J. (1996). ‗Why Do Countries Seek Regional Trade Agreements?‘ NBER Working Paper No.
5552, NBER, Cambridge
World Bank (2004). Trade Policies in South Asia: An Overview. World Bank, Washington, D.C.
World Bank (2006). ‗India–Bangladesh Bilateral Trade and Potential Free Trade Agreement‘ Bangladesh
Development Series Paper No. 13, World Bank, Dhaka.
World Bank (2010). South Asia Economic Update 2010: Moving Up Looking East, World Bank,
Washington, D.C.
World Bank (2012). 'Consolidating and Accelerating Exports in Bangladesh', Bangladesh Development
Series Paper No. 29, World Bank, Dhaka.

34
Appendix 1
Sectoral IIT Index for Major Products (IIT≥0.40) of India’s Bilateral Trade with Bangladesh, 2007
HS Commodity
IIT
India
410411
FULL GRAINS-UNSPLIT/GRAIN-SPLITS OF BOVINEIN WET STATE
INCLDNG WET-BLUE 0.997
540810 WOVEN FABRICS,OBTAINED FROM HIGH TENACITY YARN OF VISCOSE
RAYON 0.991
721590 OTHR BARS & RODS OF IRON/NON-ALLOY STL 0.978
702000 OTHER ARTICLES OF GLSS 0.943
230220 RICE BRAN OIL 0.935
721550
BARS & RODS OTHRTHN FREE-CUTNG STL NT FRTHR WRKD THN COLD
FRMD/COLD FINSHD 0.923
850720 OTHER LEAD-ACID ACCUMULATORS 0.922
611120 BABIES'GARMENTS ETC OF COTTON 0.908
210690 OTHER FOOD PREPARATIONS 0.902
600290 OTHR KNITDOR CROCHETED FBRCS OF WIDTH 0.901
960720 PARTS OF SLIDE FASTENERS 0.891
843290 PRTS OF AGRCLTRL & HORTCULTRL MACHINERY 0.876
610342 TROUSERS,SHORTS ETC OF COTTON 0.862
721491
BARS & RODS OF RECTANGULAR (OTHER THAN SQUARE) CROSS-
SECTION OF IRON/NON ALOY STL 0.857
730690 OTHER TUBES,PIPES ETC.OF IRON OR STEEL 0.851
600320 FBRCS OF COTTON 0.844
30379 OTHER FRZN FISH EXCL LIVRS & ROES 0.828
600390 FBRCS OF OTHR FIBRES 0.828
841330
FUEL,LUBRICATING/COOLING MEDIUM PUMPS FOR INTERNAL
COMBUSTION PISTON ENGINES 0.818
700100
CULLET AND OTHER WASTE AND SCRAP OF GLASS;GLASS IN THE
MASS 0.815
30559 OTHER DRIED FISH W/N SALTED NT SMOKED 0.782
600622 OTHR KNITED OR CROCHETD FBRCS OF COTTON , DYED 0.771
960719 OTHER SLIDE FASTENERS 0.770
610510 MEN'S/BOYS' SHIRTS OF COTTON 0.758
30199 OTHER LIVE FISH 0.752

35
620463
TROUSERS,BIB AND BRACE OVERALLS, BREECHES AND SHORTS OF
SYNTHETIC FIBRES 0.747
843143 PRTS OF BORNG/SNKNG MCHNRY OF SUB HDG.NO.843041/843049 0.730
621790 PARTS OF GARMENTS/OF CLOTHNG ACCESSORIES 0.729
610349 TROUSERS,SHORTS ETC OF OTHR TXTL MATRLS 0.719
200819 OTHR NUTS & SEEDS INCL MIXTRS PRPD/PRSVD 0.717
843229 OTHR(HARROWS,SCRFRS,CLTVTRS,WEEDRS & HOES) 0.713
170490 OTHER SUGR CNFCTNRY NT CONTAINING COCOA 0.707
480269
PAPER & PAPERBOARD OTHER THAN ROLL/SHEET OFWHCH >10% BY
WT OF TOTL FBR CNTNT. 0.703
848390 PARTS OF THE ITEMS OF HDG 8483 0.703
847720 EXTRUDERS 0.693
850690 PARS OF PRIMARY CELLS & PRIMARY BATTERIES 0.690
520929 OTHR BLEACHD COTTON FABRICS MORE THAN 200 GM PER SQM 0.674
720429 WASTE & SCRAP OF OTHER ALLOY STEEL 0.673
848310 TRNSMSN SHFT(INCL CAM & CRNK SHFT) & CRNK 0.671
790310 ZINC DUST 0.668
850780 OTHER ACCUMULATORS 0.658
844530 TXTL DOUBLNG/TWISTNG MCHNS 0.614
790390 ZINC POWDERS AND FLAKES 0.596
520912
UNBLCHD 3/4 THRED TWILL INCL CROSS TWILL COTTON FABRICS
WEIGING MORE THAN 200 GM PER SQM 0.594
521051
MIXED COTTON FABRICS WEIGHING NOT MORE THAN 200 GSM
PRINTED, PLAIN WEAVE 0.570
490599 OTHERS MAPS ETC 0.568
847420 CRUSHING/GRINDING MACHINES 0.565
940360 OTHER WOODEN FURNITURE 0.564
560890
KNOTTED NETTING OF TWINE CORDAGE/ROPE ETC OF OTHER
TEXTILE MATERIALS 0.563
90920 SEEDS OF CORIANDER 0.557
520811
COTN FABRCS CONTNG>=85% BY WT OF COTN, UNBLEACHED PLAIN
WEAVE WEIGING <=100 G/M2 0.555
251710
PEBBLES GRVL BRKN/CRSHD STONE COMMONLY USDFR CONCRTE
AGRGTS FR RO MTLNG/RLY/OTHR BALAST SHINGLE & FLINT W/N
HEAT-TREATED 0.553

36
410799 OTHER/HIDES/SKINS INCLUDING SIDES 0.541
843280 OTHER AGRICULTURAL & HORTICULTURAL MCHNRY 0.535
392690 OTHER ARTICLES OF PLASTICS 0.530
520841
COTN FABRICS CONTNG >=85% BY WT OF COTN PLAIN WEAVE,
WEIGHING NOT MORE THAN 100 GMPER SQM OF YARN OF DIFFERENT
COLOURS 0.515
410719 OTHER WHOLE HIDS/SKINS 0.512
854419 WINDING WIRES OF OTHR METLS,/SUBSTANCES 0.505
640610 UPPERS & PRTS THEREOF OTHR THN STIFFENERS 0.502
940330 WOODEN FRNTR OF A KND USED IN OFFICES 0.491
620319 SUITS OF OTHER TEXTILE MATERIALS 0.486
590110
TEXTILE FABRICS COATED WTH GUM/AMYLACEOUS SUBSTANCES
USED FOR OUTER BOOK COVERS 0.481
790111 ZINC,NOT ALLOYD,CONTNG BY WT>=99.99% ZINC 0.454
843420 DAIRY MACHINERY 0.440
520829
OTHER COTTON FABRICS,BLEACHED CONTNG 85% OR MORE BY WT
OF COTTON WEING NOT MORE THAN 200 GM PER SQM 0.438
620312 SUITS OF SYNTHETIC FIBRES 0.435
620930 BABIES GRMNTS & CLOTHNG ACCESS OF SYN FIBR 0.426
521211
OTHR UNBLCHED WOVEN FABRICS OF COTTON WEIGHING NOT MORE
THAN 200 G/M2 0.417
520851
COTN FABRICS CONTNG >=85% BY WT OF COTN PRINTED PLAIN
WEAVE WEIGNG <=100 G PER SQM 0.402
520299 OTHER COTTON WASTE 0.400

37
Sectoral IIT Index for Major Products (IIT≥0.40) of Bangladesh’s Bilateral Trade with India, 2007
HS Commodity
IIT
Bangladesh
391690 MONOFIL,RODS,STICKS ETC. OF OTHR PLSTCS 1.000
521041
PLAIN WEAVE,OF YARNS OF DIFFERENT COLOURS MIXED COTTON
FABRICS WEIGHING<=200 GSM 1.000
611030 JERSEYS ETC OF MAN-MADE FIBRES 1.000
640320
FTWEAR WTH OUTR SOLES OF LTHR & UPPRS WHICH CONSIST OF
LTHR STRPS ACRS THE INSTEP & AROUND THE BIG TOE 1.000
740319 OTHER REFINED COPPER,UNWROUGHT 1.000
842820 PNEUMATIC ELEVATORS & CONVEYORS 1.000
850162
AC GENERATORS (ALTERNATORS) OF AN OUTPUT EXCEEDING
75KVA BUT NOT EXCEEDING 375KVA 1.000
851650 MICROWAVE OVENS 1.000
854389
OTHER ELECTRICAL MACHINES AND APPARATUS HAVING
INDIVIDUAL FUNCTIONS 1.000
850432
OTHR TRNSFRMRS HVNG A PWR HNDLNG CAPACITY EXCDNG 1
KVA BUT NT EXCDNG 16KVA 0.999
521214
OTHR WOVN FBRCS OF COTTON OF YRNS OF DIFF COLOURS
WEIGHING NOT MORE THAN 200 G/M2 0.993
630699 OTHR CAMPING GOODS OF OTHER TEXTL MATRLS 0.991
610590 SHIRTS OF OTHR TEXTILE MATERIAL 0.990
845140 WASHING,BLEACHING OR DYEING MACHINES 0.977
846693 PRTS & ACCSSRS FR HDG NOS.8456 TO 8461 0.956
521149 OTHR MXD COTN FABRICS OF YARNS OF DIFFERNTCOLOURS
WEGHNG MORE THAN 200 GSM 0.954
850433
OTHR TRNSFRMRS HVNG A PWR HNDLNG CAPACTY EXCDNG 16
KVA BT NT EXCDNG 500 KVA 0.953
847439 OTHR MXNG/KNEADNG MACHINES 0.950
630229 PRINTED BED LINEN OF OTHR TXTL MATRLS 0.947
230240 BRAN SHARPS&OTHR RESIDUES OF OTHR CEREALS 0.944
490110 PRINTD BOOKS ETC IN SINGL SHEET W/N FOLDED 0.942
220290 OTHER SWEETND FLAVRD WATERS 0.939
392620 ARTCLS OF APRL & CLTHNG ACSORS(INCL GLVS) 0.938
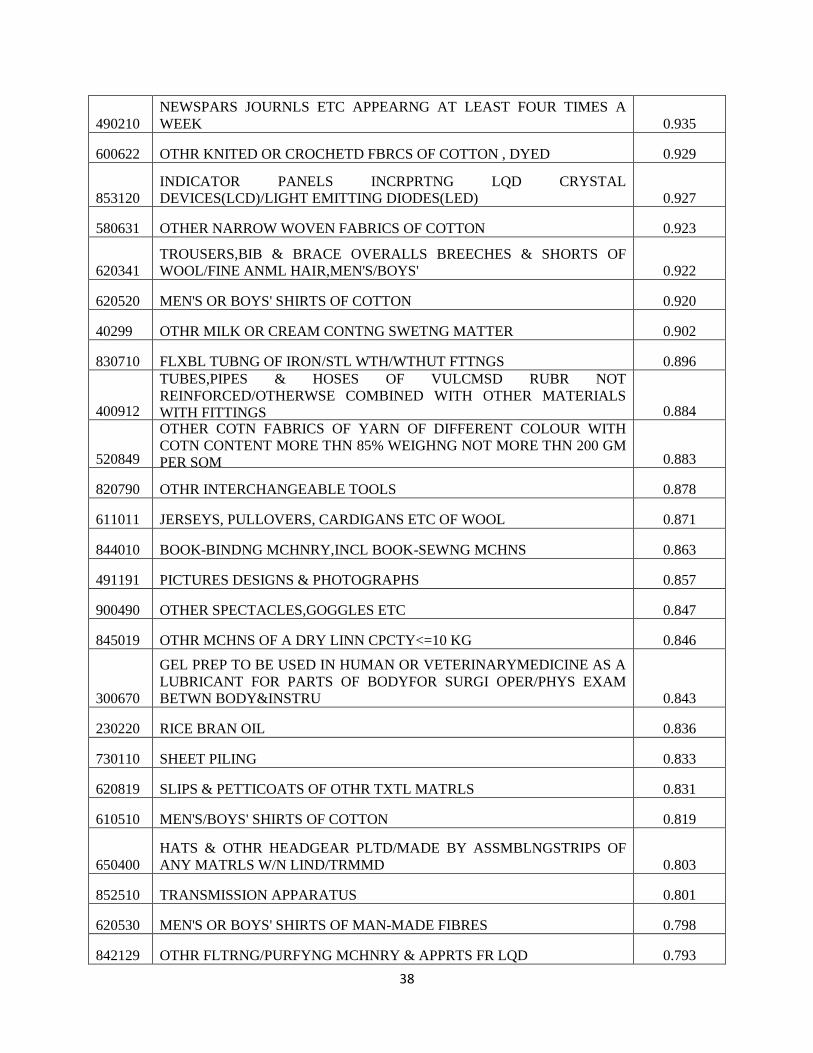
38
490210
NEWSPARS JOURNLS ETC APPEARNG AT LEAST FOUR TIMES A
WEEK 0.935
600622 OTHR KNITED OR CROCHETD FBRCS OF COTTON , DYED 0.929
853120
INDICATOR PANELS INCRPRTNG LQD CRYSTAL
DEVICES(LCD)/LIGHT EMITTING DIODES(LED) 0.927
580631 OTHER NARROW WOVEN FABRICS OF COTTON 0.923
620341
TROUSERS,BIB & BRACE OVERALLS BREECHES & SHORTS OF
WOOL/FINE ANML HAIR,MEN'S/BOYS' 0.922
620520 MEN'S OR BOYS' SHIRTS OF COTTON 0.920
40299 OTHR MILK OR CREAM CONTNG SWETNG MATTER 0.902
830710 FLXBL TUBNG OF IRON/STL WTH/WTHUT FTTNGS 0.896
400912
TUBES,PIPES & HOSES OF VULCMSD RUBR NOT
REINFORCED/OTHERWSE COMBINED WITH OTHER MATERIALS
WITH FITTINGS 0.884
520849
OTHER COTN FABRICS OF YARN OF DIFFERENT COLOUR WITH
COTN CONTENT MORE THN 85% WEIGHNG NOT MORE THN 200 GM
PER SQM 0.883
820790 OTHR INTERCHANGEABLE TOOLS 0.878
611011 JERSEYS, PULLOVERS, CARDIGANS ETC OF WOOL 0.871
844010 BOOK-BINDNG MCHNRY,INCL BOOK-SEWNG MCHNS 0.863
491191 PICTURES DESIGNS & PHOTOGRAPHS 0.857
900490 OTHER SPECTACLES,GOGGLES ETC 0.847
845019 OTHR MCHNS OF A DRY LINN CPCTY<=10 KG 0.846
300670
GEL PREP TO BE USED IN HUMAN OR VETERINARYMEDICINE AS A
LUBRICANT FOR PARTS OF BODYFOR SURGI OPER/PHYS EXAM
BETWN BODY&INSTRU 0.843
230220 RICE BRAN OIL 0.836
730110 SHEET PILING 0.833
620819 SLIPS & PETTICOATS OF OTHR TXTL MATRLS 0.831
610510 MEN'S/BOYS' SHIRTS OF COTTON 0.819
650400
HATS & OTHR HEADGEAR PLTD/MADE BY ASSMBLNGSTRIPS OF
ANY MATRLS W/N LIND/TRMMD 0.803
852510 TRANSMISSION APPARATUS 0.801
620530 MEN'S OR BOYS' SHIRTS OF MAN-MADE FIBRES 0.798
842129 OTHR FLTRNG/PURFYNG MCHNRY & APPRTS FR LQD 0.793
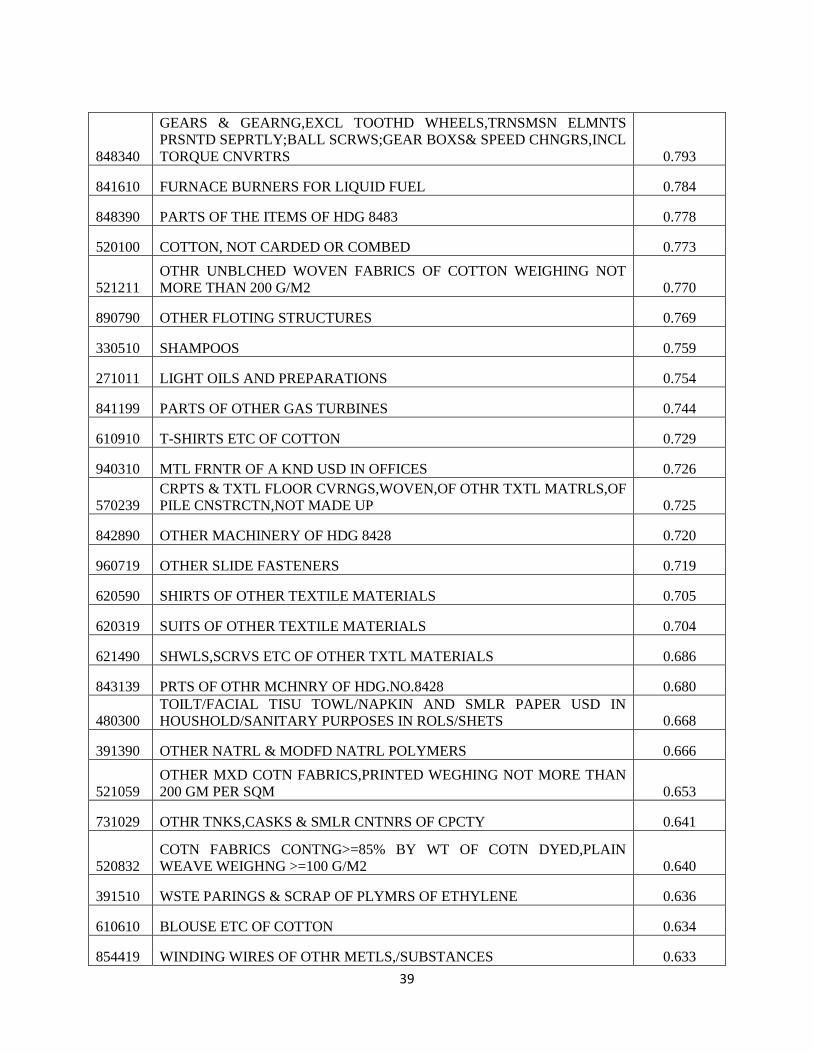
39
848340
GEARS & GEARNG,EXCL TOOTHD WHEELS,TRNSMSN ELMNTS
PRSNTD SEPRTLY;BALL SCRWS;GEAR BOXS& SPEED CHNGRS,INCL
TORQUE CNVRTRS 0.793
841610 FURNACE BURNERS FOR LIQUID FUEL 0.784
848390 PARTS OF THE ITEMS OF HDG 8483 0.778
520100 COTTON, NOT CARDED OR COMBED 0.773
521211
OTHR UNBLCHED WOVEN FABRICS OF COTTON WEIGHING NOT
MORE THAN 200 G/M2 0.770
890790 OTHER FLOTING STRUCTURES 0.769
330510 SHAMPOOS 0.759
271011 LIGHT OILS AND PREPARATIONS 0.754
841199 PARTS OF OTHER GAS TURBINES 0.744
610910 T-SHIRTS ETC OF COTTON 0.729
940310 MTL FRNTR OF A KND USD IN OFFICES 0.726
570239
CRPTS & TXTL FLOOR CVRNGS,WOVEN,OF OTHR TXTL MATRLS,OF
PILE CNSTRCTN,NOT MADE UP 0.725
842890 OTHER MACHINERY OF HDG 8428 0.720
960719 OTHER SLIDE FASTENERS 0.719
620590 SHIRTS OF OTHER TEXTILE MATERIALS 0.705
620319 SUITS OF OTHER TEXTILE MATERIALS 0.704
621490 SHWLS,SCRVS ETC OF OTHER TXTL MATERIALS 0.686
843139 PRTS OF OTHR MCHNRY OF HDG.NO.8428 0.680
480300 TOILT/FACIAL TISU TOWL/NAPKIN AND SMLR PAPER USD IN
HOUSHOLD/SANITARY PURPOSES IN ROLS/SHETS 0.668
391390 OTHER NATRL & MODFD NATRL POLYMERS 0.666
521059
OTHER MXD COTN FABRICS,PRINTED WEGHING NOT MORE THAN
200 GM PER SQM 0.653
731029 OTHR TNKS,CASKS & SMLR CNTNRS OF CPCTY 0.641
520832
COTN FABRICS CONTNG>=85% BY WT OF COTN DYED,PLAIN
WEAVE WEIGHNG >=100 G/M2 0.640
391510 WSTE PARINGS & SCRAP OF PLYMRS OF ETHYLENE 0.636
610610 BLOUSE ETC OF COTTON 0.634
854419 WINDING WIRES OF OTHR METLS,/SUBSTANCES 0.633

40
902780 OTHR INSTRUMENTS & APPARATUS OF HDG 9027 0.628
845530 ROLLS FOR ROLLING MILLS 0.620
280300 CARBON (CARBON BLACKS & OTHR FORMS NES) 0.611
730820 TOWERS & LATTICE MASTS 0.611
550969 OTHR YRN OF ACRYLC/MODACRYLC STAPLE FIBRES 0.608
650590
OTHER HEADGEAR, HATS, KNITTED/CROCHETED MADE UP FROM
LACES ETC W/N LIND/TRMMD 0.607
390610 POLYMETHYL METHACRYLATE 0.598
732690 OTHER ARTICLES OF HEADING 7326 0.595
570190 CRPTS & FLR CVRNGS KNOTTD OF OTR TXTL MTRL 0.594
600624 OTHR KNITED OR CROCHETD FBRCS OF COTTON , PRINTD 0.588
831000
SIGN PLTS, NAME PLTS,ADDRS PLTS & SMLR PLTSNUMBERS,LTTRS
& SYMBOLS,OF BS MTL EXCLD OF HDG NO. 9405 0.586
902720 CHROMATOGRAPHS & ELECTROPHORESIS INSTRMNT 0.586
701329 DRINKING GLASSES NESOI 0.582
293339
OTHR CMPNDS CNTNG AN UNFUSED PYRDN RING(W/N
HYDRGNTD) IN THE STRUCTURE 0.574
271019
OTHER PETROLEUM OILS AND OILS OBTAIND FROMBITUMINOUS
MINERALS ETC 0.573
620990
BABIES GARMENTS AND CLOTHING ACCESSORIES OF OTHER
TEXTILE MATERIALS 0.571
330710 SHAVING PRE OR AFTER SHAVE PRPNS 0.565
850720 OTHER LEAD-ACID ACCUMULATORS 0.557
330499 OTHR BEAUTY/MAKE UP PRPNS NES 0.554
580219 OTHR TERRY TOWELNG & SMLR TERRY FBRCS,COTN 0.539
940490 OTHR MATRESS SUPORT & ARTCLS OF BEDNG ETC 0.530
780110 REFINED LEAD 0.521
720430 WASTE AND SCRAP OF TINNED IRON OR STEEL 0.516
851711 LINE TELPHON SET WTH CORDLESS HAND SETS. 0.509
847410 SRTNG,SCRENING,SEPARATING&WASHING MCHNS 0.508
691200
CERMC TABLEWARE,KITCHENWARE,OTHR HOUSEHOLDARTCLS
ETC OTHR THAN OF PORCELIAN OR CHINA 0.498
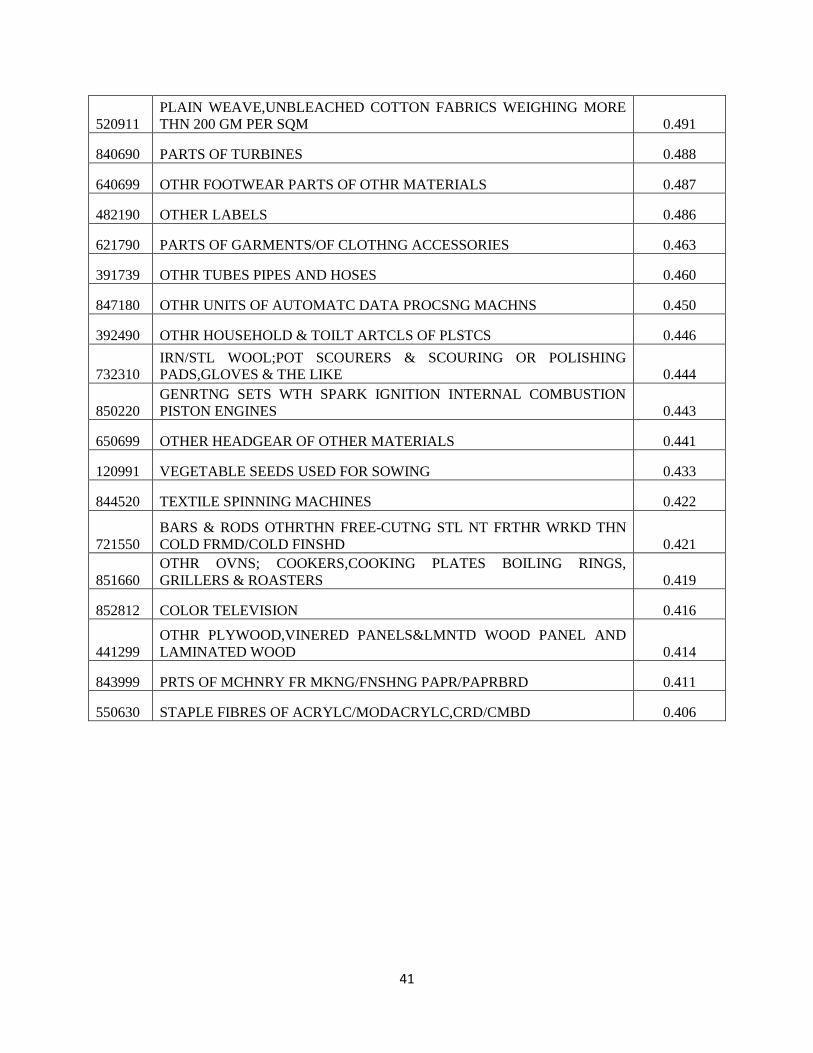
41
520911
PLAIN WEAVE,UNBLEACHED COTTON FABRICS WEIGHING MORE
THN 200 GM PER SQM 0.491
840690 PARTS OF TURBINES 0.488
640699 OTHR FOOTWEAR PARTS OF OTHR MATERIALS 0.487
482190 OTHER LABELS 0.486
621790 PARTS OF GARMENTS/OF CLOTHNG ACCESSORIES 0.463
391739 OTHR TUBES PIPES AND HOSES 0.460
847180 OTHR UNITS OF AUTOMATC DATA PROCSNG MACHNS 0.450
392490 OTHR HOUSEHOLD & TOILT ARTCLS OF PLSTCS 0.446
732310
IRN/STL WOOL;POT SCOURERS & SCOURING OR POLISHING
PADS,GLOVES & THE LIKE 0.444
850220
GENRTNG SETS WTH SPARK IGNITION INTERNAL COMBUSTION
PISTON ENGINES 0.443
650699 OTHER HEADGEAR OF OTHER MATERIALS 0.441
120991 VEGETABLE SEEDS USED FOR SOWING 0.433
844520 TEXTILE SPINNING MACHINES 0.422
721550
BARS & RODS OTHRTHN FREE-CUTNG STL NT FRTHR WRKD THN
COLD FRMD/COLD FINSHD 0.421
851660
OTHR OVNS; COOKERS,COOKING PLATES BOILING RINGS,
GRILLERS & ROASTERS 0.419
852812 COLOR TELEVISION 0.416
441299
OTHR PLYWOOD,VINERED PANELS&LMNTD WOOD PANEL AND
LAMINATED WOOD 0.414
843999 PRTS OF MCHNRY FR MKNG/FNSHNG PAPR/PAPRBRD 0.411
550630 STAPLE FIBRES OF ACRYLC/MODACRYLC,CRD/CMBD 0.406

42
Appendix 2
The Global Trade Analysis Project Model
The global computable general equilibrium (CGE) modeling framework of the Global Trade Analysis
Project (GTAP) is the best model available for ex ante analysis of the economic and trade consequences
of comprehensive multilateral or bilateral trade agreements. The GTAP model is a comparative static,
global computable general equilibrium model, and is based on neoclassical theories.51
The GTAP model
is a linear model using a common global database for CGE analysis. The model assumes perfect
competition in all markets, constant returns to scale in all production and trade activities, and profit- and
utility-maximizing behavior of firms and households. The model is solved using the software GEMPACK
(Harrison and Pearson, 1996).
Household income and expenditure
In the GTAP model each region has a single representative household, termed the regional household.
The income of the regional household is generated through factor payments and tax revenues (including
export and import taxes) net of subsidies. The regional household allocates expenditure over private
household expenditure, government expenditure and savings according to a Cobb Douglas per-capita
utility function. Thus each component of final demand maintains a constant share of total regional
income.52 The private household buys commodity bundles to maximize utility, subject to its expenditure
constraint. The constrained optimizing behavior of the private household is represented in the GTAP
model by a constant difference of elasticity (CDE)-implicit expenditure function. The private household
spends its income on consumption of both domestic and imported commodities and pays taxes. The
consumption bundles are constant elasticity of substitution (CES) aggregates of domestic and imported
goods, where the imported goods are also CES aggregates of imports from different regions. Taxes paid
by the private household cover commodity taxes for domestically produced and imported goods and the
income tax net of subsidies.
Government consumption
The government spends its income also on domestic and imported commodities and pays taxes. These
taxes consist of commodity taxes for domestically produced and imported commodities. Like the private
household, government consumption is a CES composition of domestically produced goods and imports.
Savings and Investment
In the GTAP model the demand for investment in a particular region is savings driven. In the multi-
country setting the model is closed by assuming that regional savings are homogeneous and contribute to
a global pool of savings (global savings). This is then allocated among regions for investment in response
to the changes in the expected rates of return in different regions. If all other markets in the multi regional
model are in equilibrium, if all firms earn zero profits, and if all households constrain their budgets, the
savings and investment will bring about a situation in which global investment equal global savings, and
Walras' Law will be satisfied.
51
Full documentation of the GTAP model and the database can be found in Hertel (1997) and also in Dimaranan
and McDougall (2002). 52
Savings enter the static utility function as a proxy for future consumption.

43
Producers’ income
In the GTAP model, producers receive payments for selling consumer goods and intermediate inputs in
both the domestic market and the rest of the world. Under the zero-profit assumption of the model, these
revenues must be precisely exhausted by spending on domestic intermediate inputs, imported
intermediate inputs, factor income and taxes to regional household (taxes on both domestic and imported
intermediate inputs and production taxes net of subsidies).
Production technology
In the GTAP model a nested production technology is considered with the assumption that every industry
produces a single output, and constant returns to scale prevail in all markets. Industries have a Leontief
production technology to produce their output. Industries maximize profits by choosing two broad
categories of inputs: a composite of factors (value added) and a composite of intermediate inputs. The
factor composite is a CES function of labor, capital, land and natural resources. The intermediate
composite is a Leontief function of material inputs, which are in turn a CES composition of domestically
produced goods, and imports from all regions.
International trade
The GTAP model employs the Armington assumption which allows the ability to distinguish origin of
imports and intra-industry trade of similar products. In the Armington approach, import shares of various
regions depend on relative prices and the substitution elasticity between domestic and imported
commodities.

44
Appendix 3
Commodity classification in the GTAP model
No. Sector Description No. Sector Description
1 Paddy rice 30 Wood products
2 Wheat 31 Paper products, publishing
3 Cereal grains nec 32 Petroleum, coal products
4 Vegetables, fruit, nuts 33 Chemical, rubber, plastic prods
5 Oil seeds 34 Mineral products nec
6 Sugar cane, sugar beet 35 Ferrous metals
7 Plant-based fibers 36 Metals nec
8 Crops nec 37 Metal products
9 Cattle, sheep, goats, horses 38 Motor vehicles and parts
10 Animal products nec 39 Transport equipment nec
11 Raw milk 40 Electronic equipment
12 Wool, silk-worm cocoons 41 Machinery and equipment nec
13 Forestry 42 Manufactures nec
14 Fishing 43 Electricity
15 Coal 44 Gas manufacture, distribution
16 Oil 45 Water
17 Gas 46 Construction
18 Minerals nec 47 Trade
19 Meat: cattle, sheep, goats, horse 48 Transport nec
20 Meat products nec 49 Sea transport
21 Vegetable oils and fats 50 Air transport
22 Dairy products 51 Communication
23 Processed rice 52 Financial services nec
24 Sugar 53 Insurance
25 Food products nec 54 Business services nec
26 Beverages and tobacco products 55 Recreation and other services
27 Textiles 56 Public admin/Defense/Health/Education
28 Wearing apparel 57 Dwellings
29 Leather products

45
Appendix 4
Regional Aggregation in the GTAP model
No. New Region Comprising Old Regions
1 Bangladesh Bangladesh.
2 India India.
3 Rest of South Asia Pakistan; Sri Lanka; rest of South Asia.
4 North America Canada; United States of America; Mexico; rest of North America.
5 EU_25 Austria; Belgium; Cyprus; Czech Republic; Denmark; Estonia; Finland;
France; Germany; Greece; Hungary; Ireland; Italy; Latvia; Lithuania;
Luxembourg; Malta; Netherlands; Poland; Portugal; Slovakia; Slovenia;
Spain; Sweden; United Kingdom.
6 Rest of the World Australia; New Zealand; rest of Oceania; China; Hong Kong SAR, China;
Japan; Korea; Taiwan, China; rest of East Asia; Cambodia; Indonesia; Lao
People's Democratic Republic; Myanmar; Malaysia; Philippines; Singapore;
Thailand; Viet Nam; rest of Southeast Asia; Argentina; Bolivia; Brazil;
Chile; Colombia; Ecuador; Paraguay; Peru; Uruguay; Venezuela; rest of
South America; Costa Rica; Guatemala; Nicaragua; Panama; Rest of Central
America; Caribbean; Switzerland; Norway; rest of EFTA; Albania; Bulgaria;
Belarus;
Croatia; Romania; Russian Federation; Ukraine; rest of Eastern Europe; rest
of Europe; Kazakhstan; Kyrgyzstan; rest of Former Soviet Union; Armenia;
Azerbaijan; Georgia; Iran Islamic Republic of; Turkey;
rest of Western Asia; Egypt; Morocco; Tunisia; rest of North Africa; Nigeria;
Senegal; rest of Western Africa; Central Africa; South Central Africa;
Ethiopia; Madagascar; Malawi; Mauritius; Mozambique; Tanzania;
Uganda; Zambia; Zimbabwe; rest of Eastern Africa; Botswana; South Africa;
rest of Southern Africa customs .

46
Appendix 5
India’s Sensitive List on Bangladesh Export*
Sl. No. Chapter, heading, sub-
heading or tariff item
of the First Schedule
Description of goods
1 500720 Other Woven Fabrics of Silk, containing 85 % or more
by weight of silk or of silk waste other than non Silk.
2 610342 Men's or Boy's Trousers
3 610343 Men's /Boy's Trousers, Overalls and Shorts - Knitted -
Synthetic Fibers
4 610462 Women's or Girls Trousers, Overalls and Shorts-
Knitted- of Cotton
5 610463 All goods
6 610510 All goods
7 610520 All goods
8 610610 All Goods-knitted
9 610711 All goods
10 610721 All goods
11 610791 All goods
12 610821 All goods
13 610822 Women‘s/Girls Briefs and Panties: Knitted or crocheted:
of Man-made Fibres.
14 610831 Women's or Girls Nightdresses and Pyjamas knitted or
Crocheted- of Cotton
15 610910 All goods
16 610990 All goods
17 611020 All goods
18 611030 All goods
19 611090 All goods
20 611120 Babies Garments and Clothing Accessories: Knitted or
crocheted of cotton.
21 611130 All goods
22 611241 Of synthetic fibers
23 611300 Garments , made-up of knitted or crocheted fabrics of
heading No. 59.03,59.06
24 611420 All goods
25 611699 All goods
26 620332 All goods
27 620333 All goods
28 620342 Men‘s/Boy‘s Trousers, Overalls and Shorts -Woven-
Cotton
29 620413 All goods
30 620452 All goods
31 620462 Women‘s/Girl‘s Trousers, Overalls and Shorts-Woven-
Cotton
32 620520 Mens/Boys Shirts-Woven-Cotton
33 620530 Mens/Boys Shirts-Woven-Man-Made-Fibres
34 620590 All goods

47
35 620630 Womens/Girls Blouses, Shirts and Shirt-Blouses-
Woven-Cotton
36 620721 All goods
37 620821 All goods
38 620920 All goods except hats
39 620930 All goods except hats
40 621040 All goods
42 621050 Sweaters, Sweat Shirts and Waist-Coats-Knitted-Cotton
42 621111 All goods
43 621132 All goods
44 621133 All goods
45 621210 All goods
46 621710 Made-Up Clothing Accessories; Woven
*Already removed by India in September 2011.

48
Appendix 6
Sources and definitions of data
Variable Definition Source
gdp_ex GDP of exporter, US$ at current price WDI Online
2009, World Bank
gdp_im GDP of importer, US$ at current price WDI Online
2009, World Bank
tariff Simple average tariff (%) WITS, World
Bank
distance Distance between bilateral pair of countries (weighted) CEPII
contig Contiguity, dummy variable (=1 if countries in bilateral pair are
geographically contiguous, 0 otherwise)
CEPII
comlang_off Common language (official), dummy variable (=1 if countries in
bilateral pair have same official language, 0 otherwise)
CEPII
rta Regional trade agreement (including bilateral free trade agreement),
dummy variable (=1 if countries in bilateral pair have free trade
agreement, 0 otherwise)
CEPII
sr_transit Sub-regional transit, dummy variable (=1 if countries in bilateral pair
have sub-regional transit, 0 otherwise)
Authors
r_transit Regional transit, dummy variable (=1 if countries in bilateral pair have
regional transit, 0 otherwise)
Authors
cost Cost to export (US$ per container) in bilateral pair of countries Doing Business
Database, World
Bank time Time to export (days) in bilateral pair of countries Doing Business
Database, World
Bank number Documents to export (number) in bilateral pair of countries Doing Business
Database, World
Bank customs Efficiency of clearance process (speed, simplicity, and predictability of
formalities) by border control agencies, including Customs
Logistic
Performance
Index Database,
World Bank infrastructure Quality of trade and transport related infrastructure (ports, railroads,
roads, and information technology
Logistic
Performance
Index Database,
World Bank shipments Ease of arranging competitively priced shipments Logistic
Performance
Index Database,
World Bank timeliness Timeless of shipments in reaching destination within the scheduled or
expected delivery time
Logistic
Performance
Index Database,
World Bank cc_ex Control of corruption in exporting country World
Governance
Indicators
Database, World
Bank
cc_im Control of corruption in importing country World
Governance
Indicators
Database, World
Bank
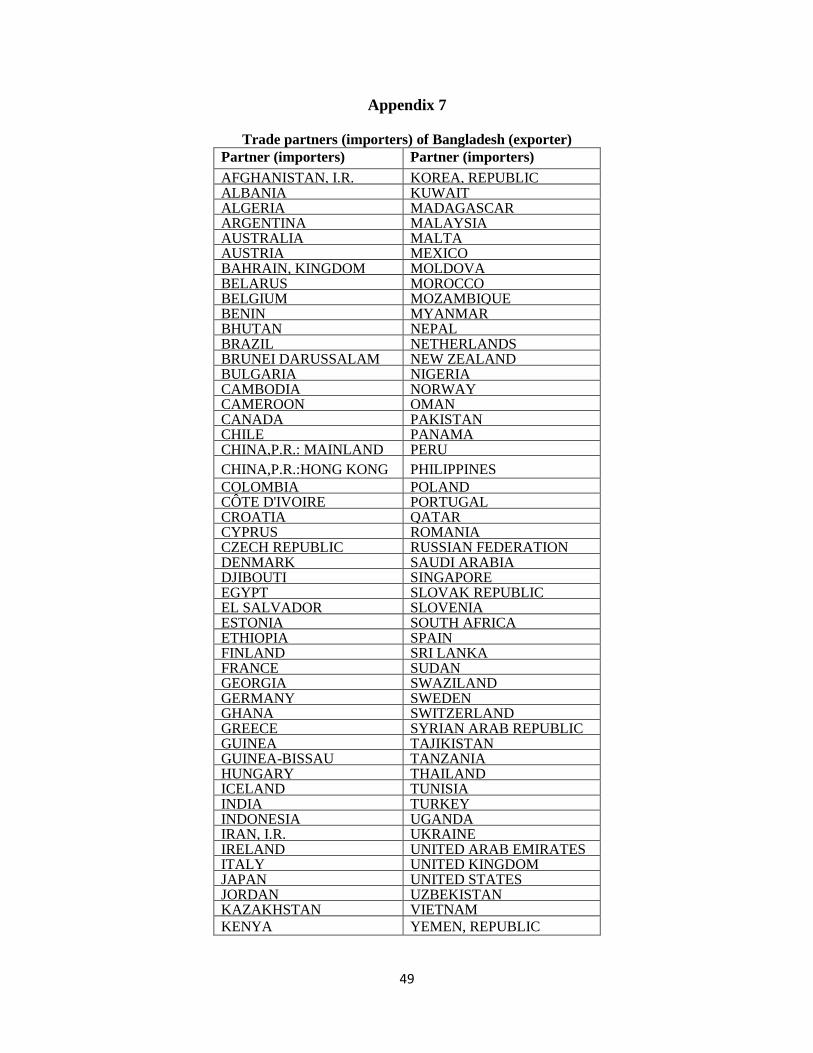
49
Appendix 7
Trade partners (importers) of Bangladesh (exporter)
Partner (importers) Partner (importers)
AFGHANISTAN, I.R. KOREA, REPUBLIC ALBANIA KUWAIT ALGERIA MADAGASCAR ARGENTINA MALAYSIA AUSTRALIA MALTA AUSTRIA MEXICO BAHRAIN, KINGDOM MOLDOVA BELARUS MOROCCO BELGIUM MOZAMBIQUE BENIN MYANMAR BHUTAN NEPAL BRAZIL NETHERLANDS BRUNEI DARUSSALAM NEW ZEALAND BULGARIA NIGERIA CAMBODIA NORWAY CAMEROON OMAN CANADA PAKISTAN CHILE PANAMA CHINA,P.R.: MAINLAND PERU
CHINA,P.R.:HONG KONG PHILIPPINES
COLOMBIA POLAND CÔTE D'IVOIRE PORTUGAL CROATIA QATAR CYPRUS ROMANIA CZECH REPUBLIC RUSSIAN FEDERATION DENMARK SAUDI ARABIA DJIBOUTI SINGAPORE EGYPT SLOVAK REPUBLIC EL SALVADOR SLOVENIA ESTONIA SOUTH AFRICA ETHIOPIA SPAIN FINLAND SRI LANKA FRANCE SUDAN GEORGIA SWAZILAND GERMANY SWEDEN GHANA SWITZERLAND GREECE SYRIAN ARAB REPUBLIC GUINEA TAJIKISTAN GUINEA-BISSAU TANZANIA HUNGARY THAILAND ICELAND TUNISIA INDIA TURKEY INDONESIA UGANDA IRAN, I.R. UKRAINE IRELAND UNITED ARAB EMIRATES ITALY UNITED KINGDOM JAPAN UNITED STATES JORDAN UZBEKISTAN KAZAKHSTAN VIETNAM
KENYA YEMEN, REPUBLIC

50
Appendix 8
Derivation of gravity estimates
X(i,j) = Value of bilateral trade from country i (Bangladesh) to country j (India);
T(i,j) = Trade facilitation index from country i to country j;
D(i,j) = Distance from country i to country j;
N(i,j) = Number of trade documents (trade-related) from country i to country j;
C(i,j) = Efficiency of clearance process by border control agencies, including Customs from country i
to country j;
I(i,j) = Quality of trade and transport related infrastructure
In the rest of the section, the (i,j) term in the variables is suppressed without loss of generality. From stage
2 of the gravity model (see Table 13), the TFI index can be represented as:
T = −0.217(ln D) − 2.666(ln N) – 1.424(ln C) + 0.849(ln I)
From stage 3, it can be seen that:
ln X = K‘ + 3.645T
= K‘ − 0.0593(ln D) − 0.7314(ln N) – 0.3907(ln C) + 0.2329 (ln I)
where K‘ is a constant representing all the terms of independent variables in stage 1. Thus, it is possible to
write:
X = KD-0.0593
N-0.7314
C-0.3907
I0.2329
where K = exp (K‘). Now, it is easy to derive the following:
,D
D.
X
X
05930
,N
N.
X
X
73140
,C
C.
X
X
39070
,I
I.
X
X
23290
,T
T.
X
X
6453