Embed Size (px)
Citation preview

AD-AIO9 606 LEHIGH UNIV BETHLEHEM PA CENTER FOR SURFACE AND COA-ETC F/G 11/3CORROSION CONTROL THROUGH A BETTER UNDERSTANDING OF THE METALLI--ETC(U)NOV G1 H LEIOHEISER, E M ALLEN, M S EL-AASSER NOOOIA-79-C-0731,UNLASSIFED Muu hfu h
I .f.ff•lffffffEIIIIIIIEEIIIIE
Illlllllllflfllllllllllll
IIIIIIIIIIIhI

1.8
MICROCOPY RESOLUTION TEST CHART
NATIONAL RURE AL II IAN[)ARAU 1 'T6 A

LEVEi'CORROSION CONTROL THROUGH A BETTER UNDERSTANDING
OF THE METALLIC SUBSTRATE/ORGANIC COATING/INTERFACE
Agreement No. N00014-79-C-0731
ij
Second Annual Report V 1
Covering the Period, - 98
September 1, 1980-August 31, 1981
Sponsor: Office of Naval Research
Washington, D.C.
Principal Investigator: Henry Leidhelser. Jr.
Co-Investlgatore: Eugene M. Allen
Mohamed S. EI-Aesser
Frederick M. FowkesMichael C. Hugnes
>t John A. Manson
0.. Fortunato J. MicaleDavid A. Thomas
Gary W. Simmons
John W. Vanderhoff "
Center for Surface and Coatings ResearchLehigh University
Bethlehem, Pa. 18015
November 1, 1981
L4 81) 1L s 2 23 052

TABLE OF CONTENTS
Page
Foreword ............ ....................... 1
Section 1 - A List of Public Disclosures of the Re-search during the Period September 1,1980-August 31, 1981 ..... ........... 2
0 Published Papers ...... ............ 2
*Papers Accepted for Publication ....... 2
Section 2 - The Titles of the Component Programs andthe Participants ... .............. 4
e Programs Concerned with Corrosion atthe Interface ....... .............. 4
* Programs Concerned with the Chemistryof the Metal/Coating Interface .. ..... 5
0 Programs Concerned with the Propertiesof the Coating ... .............. 5
0'rograms Related to the Surface Proper-ties of Iron Oxides from the Standpointof Their Presence at the Steel/OrganicCoating Interface and Their Use asPigments ..... ................. 6
Section 3 - A Summary of the Experimental Results Ob-tained during the Period, September 1,1980-August 31, 1981 .. ............ 8
Program #1. The Mechanism for the Cathodic Delaminationof Organic Coatings from a Metal Surface . 15
Program #2. Corrosion Control by Inhibition of theCathodic, Oxygen-Reduction Reaction. . . . 49
Program #3. Optical Studies of Corrosion under OrganicCoatings ...... ................. . 55
Program #4. Electrical Properties of Organic Coatingsand Relationship to Corrosion ......... .. 63
Program #5. Determination of the Acidity of Iron OxideSurfaces ...... ................. . 79

CONTENTS Contd.
Page
Program #6. Ion Exchange Properties of Iron Surfaces. 91
Program #8. Cathodic Electrodeposition of Epoxy-Curing Agent Latex Mixtures ......... ... 105
Program #9. Drying and Curing of Epoxy Films. ..... 121
Program #10. Detection of Aggregated Water in PolymerCoatings ...... ................. ... 127
Program #11. Pigment-Binder Interactions in CorrosionProtecting Films .... ............. ... 133
Program #12. Electron Optical Studies of OrganicCoatings ...... ................. ... 147
Program #13. Preparation of Colloidal Iron Sols by(a) Aqueous Precipitation and (b) byDispersion ...... ................ ... 161
Program #14. M~ssbauer Studies of Iron Oxides ........ 183
Program #15. Characterization of the Surface Proper-ties of Iron Oxides ... ........... ... 201
ii

POREWORD
This report represents the second annual summary of re-
search carried out under Office of Naval Research Contract No.
N00014-79-0731. The objective of the research is to obtaina better understanding of the metallic substrate/organic coat-
ing/interface system so that improvements may be made in
corrosion control of metals by painting. The research during
the past year has consisted of 15 different components directed
by 10 Lehigh faculty members. These activities may be divided
for convenience into those primarily concerned with (a) corro-sion at the interface, (b) the chemistry of the metal/coating
interface, (c) the properties of the coating, and (d) the sur-
face properties of iron oxides from the standpoint of theirpresence at the steel/organic coating interface and their useas pigments.
It is Ircognized that readers of this report will be
interested in the contents for different purposes. In an
effort to accommodate to these diverse interests, the report
is presented in the following format.
(1) A list of public disclosures of the research re-
ported herein. The references may be useful to
those who wish to explore the research in greaterdetail.
(2) A list of titles of the 15 component programs keyedto the experimental summaries in (4) and the names
of the participants.
(3) A condensation of the total program. This summary
should be useful to those who wish to obtain anoverview of the program.
(4) A more detailed outline of each of the component
programs.
-1-
SECTION 1
A List of Public Disclosures of the Research during the PeriodSeptember 1, 1980-August 31, 1981
Published Papers
"Provocative Questions in Metal/Solution Reactions to WhichMbssbauer Spectroscopy Should Be Applied", H. Leidheiser, Jr.,Colloque No. 1, Suppl6ment au Journal de Physique 41, C1-351-52 (1980).
"Some Substrate and Environmental Influences on the CathodicDelamination of Organic Coatings", Henry Leidheiser, Jr. andWendy Wang, J. Coatings Tech. 53, 77-84 (1981).
"Solid State Chemistry as Applied to Cathodically-Driven orCorrosion-Induced Delamination of Organic Coatings", HenryLeidheiser, Jr., Paper No. 81, Corrosion 81, National Associ-ation of Corrosion Engineers, April 6, 1981, Toronto, Canada,10 pp.
"Solid State Chemistry as Applied to Cathodically Driven orCorrosion-Induced Delamination of Organic Coatings", HenryLeidheiser, Jr., Ind. Eng. Chem. Prod. Res. Dev. 20, 547-51(1981).
"Mbssbauer Spectroscopic Study of the Chemical State of Cobaltin an Electrodeposited Zinc-Cobalt Alloy", H. Leidheiser, Jr.,A. Vdrtes, and M. L. Varsdnyi, J. Electrochem. Soc. 128, 1456-59 (1981).
"Mechanism of Corrosion Inhibition with Special Attention toInhibitors in Organic Coatings", Henry Leidheiser, Jr., J.
* Coatings Tech. 53, No. 678, 29-39 (1981).
"De-adhesion at the Organic Coating/Metal Interface in AqueousMedia" Henry Leidheiser, Jr., Croatica Chemica Acta 53, 197-209 (1980).
Papers Accepted for Publication
"Enhancing Polymer Adhesion by Acid-Base Interactions", F. M.Fowkes, Proc. Internatl. Conf. on Corrosion Control by OrganicCoatings, Natl. Assocn. Corrosion Engrs., Houston, Texas, inpress.
-2-

Papers Accepted for Publication Contd.
"Some Aspects of Cathodic Electrodeposition of Epoxy Latexesas Corrosion-Resistant Coatings", C. C. Ho, A. Humayun, M. S.El-Aasser, and J. W. Vanderhoff, Proc. Internatl, Conf. onCorrosion Control by Organic Coatings, Natl. Assocn. CorrosionEngrs., Houston, Texas, in press.
"New Studies of the De-Adhesion of Coatings from Metal Sub-strates in Aqueous Media - Interpretation of Cathodic Delami-nation in Terms of Cathodic Polarization Curves", HenryLeidheiser, Jr., Lars Igetoft, Wendy Wang, and Keith Weber,Proc. 7th Intl. Conf. in Org. Coatings Sci., in press.
"57Fe Mssbauer Spectroscopic Study of the Thermal Decomposi-
tion of Fe(103)3", S. Music, G. W. Simmons, H. Leidheiser, Jr.,Radiochem. & Radioanal. Letters, in press.
"Mssbauer Spectroscopic Study of the Formation of Fe(III) Oxy-hydroxides and Oxides by Hydrolysis of Aqueous Fe(III) SaltSolutions", S. Musi6, A. Vertes, G. W. Simmons, I. Czak6-
* Nagy, and H. Leidheiser, Jr., J. Colloid Interface Sci., inpress.
"Rate-Controlling Steps in the Cathodic Delamination of 10-40Micron Thick Polybutadiene and Epoxy-Polyamide Coatings fromMetallic Substrates", H. Leidheiser, Jr. and W. Wang, Proc.Internatl, Conf. on Corrosion Control by Organic Coatings,Natl. Assocn. Corrosion Engrs., Houston, Texas, in press.
"An AC Impedance Probe as an Indicator of Corrosion and Defectsin Polymer/Metal Substrate Systems", M. C. Hughes and J. M.Parks, Proc. Internatl. Conf. on Corrosion Control by OrganicCoatings, Natl. Assocn. Corrosion Engrs., Houston, Texas, inpress.
-3-

SECTION 2
The Titles of the Component Programs and the Participants*
Programs Concerned with Corrosion at the Interface
(1) The Mechanism for the Cathodic Delamination of Coatingsfrom a Metal Surface
Principal Investigator: Henry Leidheiser, Jr.,Professor of Chemistry
Associates: Lars Igetoft, Visiting ScientistWendy Wang, Graduate Student
(2) Corrosion Control by Inhibition of the Cathodic,Oxygen-Reduction Reaction
Principal Investigator: Henry Leidheiser, Jr.,Professor of Chemistry
Associates: Y. Momose, Visiting ScientistR. D. Granata, Research Scientist
(3) Optical Studies of Corrosion under Organic Coatings
Principal Investigator: David A. Thomas, Professorof Metallurgy and MaterialsEngineering
Associate: Dale E. Zurawski, Graduate Student
(4) Electrical Properties of Organic Coatings and Relation-ship to Corrosion
Principal Investigator: Henry Leidheiser, Jr.,Professor of Chemistry
Associates: Michael C. Hughes, formerly AssistantProfessor of Chemistry; Adjunct Pro-fessor of Chemistry since January 1, 1981.
Jeffrey Parks, Graduate Student
*Note: Many of the programs involve close cooperation between 2or more principal investigators. The name listed in thesummary is the faculty member with prime responsibilityfor the program.
-4-

Proarams Concerned with the Chemistry of the Metal/CoatingInterface
(5) Determination of the Acidity of Iron Oxide Surfaces
j Principal Investigator: Frederick M. Fowkes,Professor of Chemistry
Associate: Sara Joslin, Graduate Student
(6) Ion Exchange Properties of Iron Surfaces
Principal Investigator: Gary W. Simmons,Professor of Chemistry
Associate: Bruce Beard, Graduate Student
(7) The Use of the Laser Raman Microprobe in Studies ofthe Metal/Coating Interface
Principal Investigator: Eugene M. Allen,Professor of Chemistry
Associate: Andrd Sommer, Graduate Student
Note: The instrument has been assembled and test spectrahave been generated. No substantive results havebeen obtained by the end of the present reportperiod.
Programs Concerned with the Properties of the Coating
(8) Cathodic Electrodeposition of Epoxy-Curing Agent LatexMixtures
Principal Investigator: M. S. El-Aasser, AssociateProfessor of Chemical Engineering
Associates: C. C. Ho, Visiting Scientist0. Shaffer, Technical AssociateK. Earhart, Research AssociateJ. A. Hadley, Graduate StudentA. Humayun, Graduate Student
-5-

Programs Concerned with the Properties of the CoatingContd.
(9) Drying and Curing of Epoxy Films
Principal Investigator: M. S. El-Aasser, AssociateProfessor of Chemical Engineering
Associates: J. W. Vanderhoff, Professor of ChemistryC. Silebi, Assistant Professor of ChemicalEngineering
Babatunde E. Aremu, Graduate StudentAta-Ur Rahman, Graduate Student
(10) Detection of Aggregated Water in Polymer Coatings
Principal Investigator: Henry Leidheiser, Jr.,Professor of Chemistry
Associate: Douglas Eadline, Graduate Student
(11) Pigment-Binder Interactions in Corrosion Protecting Films
Principal Investigator: John A. Manson,* Professor of Chemistry
Associates: Michael Heffelfinger, Graduate StudentA. Tiburcio, Graduate Student
(12) Electron Optical Studies of Organic Coatings
Principal Investigator: David A. Thomas, Professor ofMetallurgy and Materials Engineering
Associate: Yale West, Graduate Student
Programs Related to the Surface Properties of Iron Oxides fromthe Standpoint of Their Presence at the Steel/Organic CoatingInterface and Their Use as Pigments
(13) Preparation of Iron Oxide Sols by Aqueous Precipitationand by Dispersion
Principal Investigator: J. W. Vanderhoff,Professor of Chemistry
Associates: M. J. Cantow, Visiting ScientistL. M. Bennetch, Consultant0. L. Shaffer, Technical AssociateT. C. Huang, Graduate StudentM. H. Kang, Graduate StudentD. W. Timmons, Graduate Student
-6-
Programs Related to the Surface Properties of Iron Oxides fromthe Standpoint of Their Presence at the Steel/Organic CoatingInterface and Their Use as PigmentsContd.
(14) Mssbauer Studies of Iron Oxides
Principal Investigator: Gary W. Simmons,Professor of Chemistry
Associate: S. Musid, Visiting Scientist
(15) Characterization of the Surface Properties of Iron Oxides
Principal Investigator: F. J. Micale, AssociateProfessor of Chemistry
I Associates: C. C. Yu, Graduate StudentJ. Lavelle, Technician
.................................... 0

SECTION 3
A Summary of the Experimental Results Obtained during thePeriod, September 1, 1980-August 31, 1981
A detailed summary of 14 of the 15 component programs thatcompose the overall program is presented in SECTION 4. Thissection represents a consolidation of all the research carriedout during the past year in an executive-summary style. It isan attempt to give an overview of the program and to weld theindividual tasks into a coherent whole.
I Corrosion beneath an organic coating is electrochemical innature with some areas of the metallic substrate serving ascathode and other areas serving as anode. The anodic regionstend to be smaller than the cathodic regions in the early stagesof corrosion but the cathodic areas are specially damaging tothe protective nature of the coating because they lead to de-lamination. Thus, the phenomenon of cathodic delamination isimportant in (a) understanding the corrosion process and (b)understanding the factors that control delamination when cath-odic protection is superimposed on the protective coating as anadditional safeguard against corrosion in damaged areas.
Cathodic delamination of a coating, damaged with a pinprick, is a function of the nature of the electrolyte, theconcentration of the electrolyte, the amount of dissolved oxy-gen in the electrolyte, the cathode potential, the temperature,the metal, the surface treatment given to the metal before theapplication of the coating, the type of coating, and the thick-ness of the coating. The critical factor in the delaminationprocess is the rate at which the species, water, oxygen, cation,and electrons arrive at the periphery of the delaminating front.The catalytic activity of the surface for the cathodic reaction,
H20 + 1/202 + 2e = 20H, is another important factor. Any ofthese species, as well as the catalytic activity of the surface,may be involved in the rate controlling step. The organiccoating also plays an important role since the reactant speciesreach the delaminating front largely by diffusion through thecoating. Five practical means exist for minimizing cathodicdelamination: (1) No bare metal, or superficially oxidizedmetal, should be present at the coating/substrate interface.(2) There should exist at the coating/substrate interface alayer which is a very poor conductor of electrons. (3) Theinterfacial layer at the coating/substrate interface should bea poor catalyst for the cathodic reaction. (4) The boundarybetween the substrate and the coating should be rough in orderto provide a tortuous path for lateral diffusion. (5) Theinterfacial region should be resistant to alkaline attack.
--
' , " .

The importance of the cathodic reaction that occurs underthe coating in the rate of deterioration of polymer-coatedmetals indicates that control of the cathodic reaction is apractical means to extend the lifetime of the coating. Previouswork has shown that pretreatment of zinc (galvanized steel) insolutions containing cobalt or nickel ions leads to an alteredoxide on the surface of zinc such that the surface was a poorsubstrate for the cathodic oxygen reduction reaction. Workduring the present report period has identified another systemin which there is striking inhibition of the oxygen reductionreaction on zinc. Samples of chromated zinc were subjected tocathodic treatment in 0.5M NaCl for short periods of time.These cathodically-treated samples were catalytically inactivefor the oxygen reduction reaction. The activity was restoredby continued immersion in the NaCI solution for an hour ormore.
Microscopic studies have been initiated of the early stagesof corrosion using a transparent coating (polybutadiene) on asteel substrate immersed in flowing water or salt solution.Corrosion was hastened by contaminating the surface with KHSO 4before application of the coating. The corrosion reactionfirst became visible in one hr. Areas delineated by opticalreference rings appeared in an annulus around the contaminationspot. These areas grew in diameter with time. The cathodicand anodic areas were separate and could be distinguished be-cause of the blue color that was associated with the anodicareas. Information about liquid volume in the corrosion zone,changes in location of anodes and cathodes with time, earlieststages of coating delamination, and secondary processes thatoccur was obtained by time lapse photography.
Electrical methods are beginning to be accepted as a usefultool for studying organic coatings. Such methods, when properlyused, provide information about the amount of water in the coat-ing, the glass transition temperature of the coating, thepresence of conductive paths in the coating and corrosion ofthe metal substrate. The electrical studies during the pastyear have focused on the use of impedance techniques to provideinformation about the coating integrity as a function of timeof exposure to an aggressive electrolyte. Different coatingshave different impedances and the impedance is a function ofthe coating thickness. In order to normalize the results sothat different types and thicknesses of coatings could be com-pared, the data were treated in the following way. The ratioof the imaginary and real components (Tangent 8) of the compleximpedance was plotted as a function of time. Coatings in whichthere is little or no deterioration exhibit Tangent 0 values ofthe order of 1. When the coating deteriorates and corrosionbegins, the value of Tangent 0 drops by several orders ofmagnitude. The method appears to be a candidate for predictingthe lifetime of coating systems on bare metal. It remains tobe determined if the method is applicable to systems in whichthe metal surface has been phosphated or chromated.
-9-
The adherence of a coating to a metal substrate or to pig-ments or fillers in the coating is presumed to be determined bythe interaction of acidic and basic sites at the interface.Efforts to quantify the acidity of iron oxide surfaces are be-ing made by measuring the adsorption from organic solvents ofcompounds such as pyridine. Such adsorption measurements havebeen made on Fe304 and c-Fe203 using flow calorimetry. It wasfound that traces of water in the pyridine competed with thepyridine for surface sites. The surface energies of Fe304 andFe203, whose surfaces were largely devoid of adsorbed water,were very similar, i.e., 80 and 83 erg/cm 2 , respectively.
Auger spectroscopy and X-ray photoelectron spectroscopyare being utilized to characterize the sites on metal surfacesthat may be available for adhesive bonding. The technique issimple in concept but difficult in execution. Steel, surfacedin a standard way, is immersed in a medium, the pH of which isclosely controlled, and the amount of a constituent in themedium present on the surface is determined. One of thesystems that has been studied extensively is the exchange ofpotassium ions with surface hydroxyls on an oxidized steelsurface. The amount of potassium up-take by the steel surfaceincreases dramatically in the pH range of 10-11. The Ka forthe hydrated iron oxide on steel is calculated to be 10.8.This number may be important in selecting polymers that havethe maximum adhesion to steel surfaces. The major difficultyin generating information about additional systems is theperturbing influence of carbon contamination.
Most of the critical questions regarding the performanceof organic coatings in protecting a metal from corrosion relateto the chemistry of the interfacial region and the homogeneityof the coating. Techniques are being sought for carrying outchemical studies in a non-destructive manner. Two candidatetechniques, infrared spectroscopy and Raman spectroscopy, wereconsidered and the latter technique was selected because ofthe availability of a new instrument which utilizes a lasersource and generates information from an area of 1 Um2. Alaser microprobe has been purchased and will be applied tostudies of the coating and the coating/substrate interface.Preliminary experiments indicate that the instrument has therequired capabilities.
One of the coating methods which is exhibiting good corro-sion protection performance is cathodic electrocoating in whichthe polymeric material is deposited on the cathode when a voltageis applied across an aqueous dispersion in the electrolysischamber. A coherent coating is obtained after baking. Theprocedure has proven so effective that 85% of the automobilesmanufactured have some portion of the vehicle electrocoated.The kinetics of the cathodic electrocoating of epoxy-polyaminemixtures have been studied with the purposes of (a) understand-ing better the electrodeposition process and (b) developing
-10-

electrocoats of the same epoxy-polyamine that can be preparedfrom an organic solvent. Data have been generated on the massof polymer deposited per unit time, the coulombic efficiency,the effect of the magnitude of the current and applied voltage,the temperature of the cathode, and the epoxy/amine ratio.
The character and properties of organic coatings are de-pendent in no small measure on the manner in which the coatingdries. This statement is particularly pertinent to coatingsthat are formed from dispersions (latexes). The mechanism ofdrying of coatings is thus important in understanding the pro-tective nature of a coating. A gravimetric technique was usedto measure the evaporation rate of water or organic solventfrom thin films cast from epoxy-amine systems on flat glassplates. Drying conditions were 10-52% relative humidity, 0-76cm/sec air velocity, and 25-400C. The drying rates were calcu-lated from the weight loss and determination of the wet por-tions of the film. The drying rates of the solvent-basedsystems ranged from 4.5 xl0 - 5 at the beginning of the dryingoperation to 0.5 x10- 5 g/cm-sec peZ g. moisture content at theend of the experiment. The aqueous-based systems were charac-terized by an initially relatively low and constant rate(1 x10⁻⁵ g/cm 2-sec per g. moisture content) followed by an in-creased flux of the order of 10-4 g/cm2-sec per g. moisturecontent. The drying behavior of an aqueous-based solubilizedsystem was intermediate between those of the solvent-basedand aqueous-based systems. An explanation of the reasons forthe differences observed in the drying characteristics of thedifferent systems was given based on the phenomenon of skin-formation.
Corrosion beneath an organic coating is dependent on thepresence of an aqueous phase at the interface. Without anaqueous phase the electrochemical corrosion process does notoccur. Capacitance measurements have proven to be a usefulmethod to detect the amount of water taken up by a coatingexposed either to a humid environment or to an electrolyte.However, these measurements do not distinguish between waterthat is dispersed throughout the coating in a gas-like formfrom water that has aggregated to form a condensed phase.Techniques are thus being sought that will differentiate be-tween dispersed (or mobile) water and aggregated water. Sinceliquid phase water exhibits a relaxation at high frequencieswhich is not exhibited by gaseous water, it has been decidedto explore high frequency (109 c/sec) dielectric measurementsin the hope that the two different forms of water can be dif-ferentiated when they are present in an organic coating.Equipment to make such measurements based on time domainspectroscopy has been assembled and computer programs for datahandling have been developed.
Coatings based on zinc pigments are recognized as beingamong the most effective in protecting steel against corrosion.Zinc concentrations in a polymer in the range of 85-96% are( -11-

typically used. The corrosion mechanism, which is based on acombination of galvanic protection of the steel and the corro-sion inhibitor properties of zinc compounds formed on exposureto an aggressive environment, is generally accepted. Importantgaps in our knowledge exist in quantitative characterization ofthe zinc/polymer interaction since a strong interaction is im-portant in restricting liquid water ingress that might occur atbreaks in the bond. Studies of mechanical behavior, curing anddrying properties, and electronmicroscopic appearance indicatethat the adhesion between zinc and an epoxy matrix is usually,but not always, low. Corrosion protection will probably bemaximized by minimizing acid/base interaction between the zincand the polymer.
Electron microscopic examinations were made of epoxy coat-ings subjected to different corrosive environments. The weakestpoint of the epoxy matrix appeared to be in those areas whichwere in contact with the metal surface or in contact with afiller particle. This observation was independent of the formu-lation or the cure conditions. This conclusion was based onexposure of epoxy coatings to OsO 4 or to strong hydrochloricacid.
Studies of iron oxides were performed with the hope that abetter knowledge of the surface character of iron oxides mightbe helpful in improving the adherence of organic coatings toa steel surface and might be helpful in designing systems foruse in painting slightly oxidized or rusted steel. Commercialmaterials and colloidal sols prepared in the laboratory wereused.
Iron corrosion products are amphoteric, i.e., their sur-faces comprise both acidic and basic groups as determined byadsorption of basic polymethyl methacrylate and acid chlorinatedpolyvinyl chloride. The proportion of acidic and basic groupsvaried significantly from one compound to another. All ironoxides studied to date adsorb substantial proportions of Epon1001F and Emerez 1511.
A long range program has been initiated to study the natureof the corrosion products formed on steel exposed to the atmos-phere. As background information for this study and other studiesinvolving iron oxides, it was decided to accumulate informationon oxides prepared by simple hydrolysis. Aqueous solutions offerric sulfate, ferric chloride, and ferric nitrate were heatedat 900C and the products that formed were studied as a functionof time using M~ssbauer spectroscopy. Mechanisms of formationof the oxides were proposed and the Mbssbauer parameters of theoxides and hydroxyoxides were determined.
Commercial and synthetic iron oxides were characterized bygas adsorption, thermal treatment, and electrophoretic measure-ments. Both c-Fe203 and Fe304 have surfaces that are hydrophilicin nature. No evidence for dehydroxylation of the -Fe203
-12-
I II |l I Illll I I IIIIIIIIII ...... - "

surface was noted at activation temperatures up to 4000C. Theconcentration of water molecules adsorbed on a-Fe 203 decreasedfrom 8.46 molecules/100 A2 for the sample activated at 250Cto 5.38 molecules/100 A2 for the sample activated at 400 0C.Electrophoretic measurements were made on iron oxides preparedby hydrolysis at 90°C and the isoelectric point was determined.The isoelectric points of the pure compounds agreed with thosedetermined previously on commercial materials and mixtures oftwo components yielded values that were calculable from thepercentage composition and knowledge of the isoelectric pointsof the pure components.
.1
~.1
* I
•-13
Program #1. The Mechanism for the Cathodic Delaminationof Organic Coatings from a Metal Surface
ABSTRACT
A detailed mechanism of cathodic delamination ispresented which takes into account the reactants andhow they get to the delaminating front. Oxygen andwater pass through the organic coating whereas cations,at least in part, reach the front by lateral diffusion.Five means for minimizing cathodic delamination aresuggested: (1) No bare metal, or superficially oxi-dized metal, should be present at the coating/sub-strate interface. (2) There should exist at thecoating/substrate interface a layer which is a verypoor conductor of electrons. (3) The interfaciallayer at the coating/substrate interface should bea poor catalyst for the cathodic reaction. (4) Theboundary between the substrate and the coating shouldbe rough in order to provide a tortuous path forlateral diffusion. (5) The interfacial region shouldbe resistant to alkaline attack.
INTRODUCTION
Areas of a metal surface covered with an organic coatingmay become sufficiently cathodic to catalyze the cathodic re-action beneath the coating. This cathodic nature may be pur-posely induced or it may be corrosion induced because ofseparation of the anodic and cathodic areas. The cathodicreaction, or the products of the cathodic reaction, adverselyaffect the bond between the coating and the substrate and thecoating separates from the metal (1-3]. Such separation istermed "cathodic delamination" and is the subject of thispaper.
Cathodic delamination has special pertinence to systemssuch as ships, pipelines, and underground structures which arecathodically protected and there is an ASTM test [4] which ap-praises the resistance of coating/substrate systems to cathodicdelamination. The blistering of paint on vehicles or metallicstructures exposed to the atmosphere often is caused by an in-jury to the coating such that the substrate is exposed. Theexposed area becomes the anode and the adjoining area becomesthe cathode. The spread of the corrosion and the blisteringof the paint is a consequence of the cat - A-l1minRtion that
-15-No PA" BL99-.4OT 021AM
occurs and is followed by incursion of water and salts on al-ternate wetting and drying during service. A standard test [5]is also used to appraise the sensitivity of coating/substratesystems to this type of deterioration. The coating is scratchedthrough to the substrate and the scribed panel is then exposedin a salt spray cabinet. The distance of creepback from thescribe during a fixed time period is used as a comparative meas-ure when ranking different systems.
We have been interested in cathodic delamination since thepaper with Kendig in 1976 [6]. The present paper has as itspurpose to outline a detailed mechanism for cathodic delaminationbased largely on work done in our laboratory [6-14] and, to alesser extent, on work done elsewhere. Some early views havebeen modified on the basis of new information.
EXPERIMENTAL METHOD
Three different types of coatings were used. Unpigmentedpolybutadiene coatings were prepared from Budium RK-662 fromDuPont applied with a centrifugal applicator and cured at 200 °
for 20 min. In the case of coatings thicker than 20 pm, thecoating was applied in 15 um increments and was cured after eachapplication. The infrared spectra of the uncured and the curedcoatings have been published [14].
The alkyd system was applied in the form of two layers ofprimer and up to 4 layers of topcoat. Each layer was 25-30 Umin thickness. A drying time of 24 hrs was used between eachcoat and the multicoat system was dried at room temperature fornot less than 2 weeks before immersion in electrolyte. The com-positions of the primer (Rust-Oleum 7773) and the topcoat (Rust-Oleum satin white 7791) were as follows:
Primer
Pigment 44.6%Silicates 15.6%Yellow iron oxide 7.6%TiO2 2.7%Calcium borosilicate 18.2%Bentonite clay 0.5%
Vehicle 55.4%Linseed Phenolic alkyd resin 20.1%Aliphatic hydrocarbons 32.6%Driers and Additives 2.7%
-16-

Topcoat
Pigment 53.5%Silicates 34.7%TiO2 16.7%Bentonite clay 0.1%Tinting colors 2.0%
Vehicle 46.5%Soya/menhaden alkyd resin 17.2%Aliphatic hydrocarbons 28.8%Driers and additives 0.5%
The epoxy system was generally applied in two layers toobtain the desired thickness. Drying time between each layerand before use was 7 days. The formulation was standardizedin military specification MIL-P-24441/1 (ships) on September 27,1971. The formulation consists of two components that weremixed 1:1 by volume (1.17:1 by weight) of components A and B.The compositions were as follows:
Component A
% by weight
Thixotrope (Thixatrol ST) 0.4Polyamide (Genamid 2000) 1.7Polyamide adduct (Versamid 280B75) 23.5Magnesium silicate 42.0Titanium dioxide 8.4Butyl alcohol 22.2Copper phthalocyanine blue 0.084Yellow iron oxide 1.7
Component B
Thixotrope (Thixatrol ST) 0.5Epoxy resin 49.4Magnesium silicate 9.9Naphtha 25.5Diatomaceous silica 14.8
The methods of applying the cathode potential and determin-ing the range of the delamination have been described previously[10]. Polarization curves were determined using a PAR 350 Cor-rosion Measurement Console and a Model K47 Corrosion Cell systemand the procedure was that outlined in ASTM G5-72.
Some experiments were carried out in which the environmentat a purposely-applied defect in the coating was different fromthat to which the majority of the coating was exposed. A sche-matic diagram of the arrangement is shown in Figure 1. A
-17-

Cylinder
Electrolyte
Defect in Coating Substrte Meta
Figure 1. Experimental arrangement utilized in orderto expose the coated substrate to two dif-ferent environments, one inside the cylinderand the other outside the cylinder. Cap wasonly used when atmosphere in cylinder wascontrolled.
-18-

cylinder, 12 mm in diameter, was fabricated from polyethylenetubing and the end was polished flat. It was cemented to thecoating with an additional layer of coating applied after thecoated metal had dried. Electrolyte was placed in the cylinderafter a defect had been scribed in the coating within the cylin-der. The environment external to the cylinder varied dependingon the experiment being performed.
Two different lots of steel were utilized during the re-search, both of which were kindly furnished by Bethlehem Steel.The first, called Lot #1, was 0.73 mm thick and the second,called Lot #, was 0.41 mu thick. No effort is made to dis-tinguish between these two lots in the text since all compara-tive experiments were carried out on steel of the same lot.The analysis of the surface of the steel, on the basis of Augerspectx.scop utilizing peak-to-peak intensities and the sensi-tivity factor for each element, is given in Table I.
Table I
Surface Analysis of Steels Utilizing Auger Spectroscopy
Lot #1 Lot #2
Abrasively AbrasivelyAs-Received Polished As-Received Polished
Iron 23.1% 34.7% 17.6% 24.9%
Oxygen 44.4 46.5 35.9 46.2
Sodium -- 3.2 ....
Chlorine 0.3 0.4 ....
Nitrogen 2.0 2.5 1.4 --
Carbon 29.1 11.9 44.0 28.0
Potassium 0.8 0.4 0.8 0.9
Sulfur 0.3 0.4 0.4 --
It should be emphasized that this analysis should be consideredqualitative.
Unless otherwise stated, all panels were abrasively polish-ed with silicon carbide paper, #240 grit, while wetted with dis-tilled water. The grit and metal particles were removed with apaper tissue and the panel was rinsed with hot water, with ace-tone, and again with hot water. Final rinsing was done withacetone. The panels were dried in air and immediately coated.
-19-

CATHODIC DELAMINATION PROCESS
Relation to Electrochemical Properties of Metal Surface.It is generally believed [6,15] that the major driving force forcathodic delamination in corrosion processes in the presence ofair is the cathodic reaction, H20 + 1/202 + 2e = 20H-. Whenan applied potential is used, the important reaction may be2H+ + 2e- - H2 , if the driving force is sufficient. Figure 2shows a typical cathodic polarization curve for steel in 0.5MNaCl saturated with air. The regions of dominance of the twocathodic reactions are noted on the figure and the cathodicpolarization curve for hydrogen evolution in the absence ofoxygen is shown by the dotted line. It is apparent from thisfigure that at a potential of -0.8 v the dominant reaction isoxygen reduction and at potentials more negative than -1.0 vthe dominant reaction is hydrogen evolution. Polarization at-0.8 v of polymer-coated steel containing a defect in the ab-sence of oxygen leads to no significant delamination from thedefect, whereas in the presence of air there is significantdelamination.
Studies indicate that the pH beneath the organic coatingwhere the cathodic reaction occurs is highly alkaline, as thecathodic equations indicate. Ritter [161 has recently reportedthat the pH at the delaminating edge is greater than 14 asmeasured by pH-sensitive electrodes inserted through the metalsubstrate from the back side. Other studies which integratethe pH over a larger volume of liquid beneath the coating yieldvalues of 10-12. Cathodic polarization curves on steel in 0.5MNaCI at pH values of 6.5, 10, and 12.5 are approximately thesame [17] suggesting that the cathodic behavior beneath thecoating may be rationalized in terms of the cathodic polariza-tion curve that is applicable at the exposed defect.
The pE at the Delaminating Front. The cathodic reactionwhich occurs at the delaminating front generates hydroxyl ionswhich appear to be a major destructive influence on the organiccoating/substrate bond. The value of the pH at the delaminatingfront is determined by the following factors which are discussedhere.
(1) The rate at which the cathodic reaction occurs. Therate, as discussed elsewhere in this report, is dependent uponthe availability of reactants and the catalytic activity of thesurface. The rate determines how many hydroxyl ions are gener-ated per unit time, but the pH is determined by volume effects.
(2) The shape of the delaminatin2 front. The hydroxyl ionsare generated at the metal surface and are furnished to the aque-ous phase. If the angle between the substrate and the coating
-20-
I . ... .II- - I1 r. - .. .... .- -.- _- :i : , _._ -. '

nECPI
$0c
I:0 -4 -
.~r *I 14
$*40
00
41X
0La 0"
N 0 a 4
L .14 ( 0P4 & 14
.41 .41 -14U4J 4J
/~ 00 0
>1 4J0 4)
':11 0 t~
004,
~j ru LD
L 0 0 --I I I I
-1 ru-21-

is small, the effective volume is small and the pH will be high.If the angle is large, the effective volume of the aqueous phasewill be greater and the pH will be substantially lower.
(3) The rate of diffusion of hydroxyl ions away from thedelaminating front. The rate of dissipation of the hydroxylions away from the region in which they are formed is also acritical factor in determining the pH. This dissipation ratewill be determined to some extent by the thickness of the liquidlayer immediately behind the delaminating front since diffusionis slower when the dimensions of the layer are small multiplesof the ionic diameter.
(4) Bufferin reactions. In the cases of aluminum, iron,and tin, hydrolysis reactions at high pH generate hydrogen ionswhich may neutralize the hydroxyls generated. Typical reactionsinclude:
A1203 + H20 = 2A1027 + 2H+
Fe304 + 2H20 + 2e = 3HFeO2 + H+
SnO2 + H20 = SnO3= + 2H+
Other possible buffering reactions include reaction with thepolymer with net loss of hydroxyl ions or buffering by environ-mental constituents.
Mechanism of Delamination. All the evidence presentlyavailable indicates that the cathodic delamination process oc-curs because of the high pH generated by the cathodic reaction.The real question is what is the consequence of a high pH onthe interface. The evidence suggests that the strong alkalineenvironment may attack the oxide at the interface or may attackthe polymer. Attack of the oxide has been seen by Ritter [18]using ellipsometric techniques in the case of polybutadienecoatings on steel.
Slight oxidation of the steel surface occurs during oxida-tive curing of the polybutadiene coatings and the surface de-velops a faint straw color easily seen through the transparentcoating. As delamination proceeds, the straw color disappearsand the metallic appearance of iron becomes visible. This ob-servation suggests that the oxide film is destroyed by thealkaline environment but it does not answer the question ofwhether the destruction is the cause of the delamination or isa result of exposure to the highly alkaline medium after de-lamination has occurred.
-22-

Surface analysis techniques in the hands of Dickie andcolleagues [19] give clear evidence that carboxylated speciesare present at the interface as a result of hydroxyl ion at-tack of the polymer. Dickie [20] has also recently shown thatcoatings more resistant to alkaline attack exhibited betterperformance when scribed and submitted to salt spray.
The Pourbaix diagrams for metals in aqueous solution [21]are a useful source of information on the stability ranges ofvarious species. The metals of interest in the present studyall have soluble species at high pH within the potential rangeof interest. These soluble species are: iron HFeO 2-; tin,HSnO 2- and SnO 3=; zinc, HZnO 2- and ZnO 2-- cobalt, HCoO2;aluminum, A102-; copper, HCuO2- and CuO2-.
It is proposed that the major mechanism for the delamina-tion process is the solubilization of the thin oxide coating atthe interface between the organic coating and the metal. Thedissolution of the oxide breaks the bond between the coatingand the substrate metal and the high pH leads to localized at-tack on the polymer at the interface. The presence of oxidizedorganic species on the metal surface after delamination has oc-curred may be the result of a posteriori adsorption of oxidizedspecies or may be the result of islands of organic left on thesurface. The XPS technique used in Reference [19] illuminatesa large area and spatial resolution is lacking to determine ifthe organic material is present over the entire surface or isisland-like in nature.
Reactants and How They Get to the Reaction Zone.
Water. The coatings used in this study are permeable towater as shown by conventional measurements. The water perme-ability of the three coatings was determined by the use ofaluminum Payne cups. Two methods were utilized: (A) the cupswere filled with distilled water, the free film was used as acover, and the environment exterior to the cup was maintainedat approximately 50% relative humidity through the use of asaturated solution of Ca(NO3) ; (B) the interior of the cup wasfilled with silica gel so as 'o maintain 0% relative humidity,the free film was used as a cover, and the environment exteriorto the film was maintained at 50% relative humidity with thesaturated solution of Ca(NO3). The results of these experimentsare summarized in Table II. It has been hypothesized previously[101 that the water reactant for the oxygen reduction reactionreaches the reaction zone by diffusion through the coating.Evidence has now been obtained to support this hypothesis.
The experimental design shown in Figure 1 was applied tothe question of the importance of water transmission throughthe coating in the delamination process. Three different typesof experiments were carried out. Steel panels were coated with
-23-

Table II
Water Permeability at Room Temperature of Polybutadiene,Epoxy, and Alkyd Coatings to Water as Determined
through the Use of Aluminum Payne Cups
Coating Water Permeability
Method A Method B
Polybutadiene 0.004 mg-cm/cm2-day 0.003 mg-cm/cm2/day
Epoxy 0.005 0.001
Alkyd 0.007 0.004
the polybutadiene coating, 33-36 Um thick, or the epoxy coating,40-47 um thick. The cylinder surrounded a defect approximately7 mm in diameter. The cylinder was filled with 0.5M KC1 and thecoating external to the cylinder was exposed either to distilledwater, 100% relative humidity, or 50% relative humidity. Delam-ination proceeded from the defect and the amount of delaminationwas determined after 100-200 hrs of exposure. Information onthe two coatings is smmarized in Table III. In the cases of
Table III
The Effect of Water Concentration External toCoating on the Rate of Delamination from a
Defect Exposed to 0.5M KCI
Environment Externalto Cylinder Delamination Rate
Type of Coating Containing KCl in cm /hr
Polybutadiene Distilled Water 0.093
100% RH 0.080
50% RH 0.047
Epoxy Distilled Water 0.065
100% RH 0.048
50% RH < 0.009
-24-.1 .. .......

both the polybutadiene and the epoxy coatings the rate wasgreatest when the coating external to the cylinder was exposedto liquid water, was an intermediate value when exposed to 100%relative humidity, and was the lowest when exposed to 50% rela-tive humidity. Since all systems had water available from theKCI solution at the defect and since the rate decreased withthe water concentration above the coating, it is apparent thatthe delamination process is sensitive to water transmittedthrough the coating. The lower rate of delamination of theepoxy coating than the polybutadiene coating is probably aconsequence of the thicker epoxy coating.
It is not known if water transmission through the coatingis exclusively as an uncharged species or if certain fractionof the water migrates as a cation such as H 0 The cathodicnature of the delaminating front may favor ?he transmission ofwater associated with an ion with a positive charge. Ruggieriand Beck [22] have speculated that the proton is the major chargecarrier in the conduction of charge through a polyurethanecoating.
Sxygen. At cathodic potentials where the reaction, H20 +1/202 + 2e- = 20H-, is the dominant one, no significant delami-nation occurs when oxygen is excluded from the system [10].Additional experiments that confirm this conclusion have beencarried out in deaerated 0.5M KCI using an epoxy paint on asteel substrate. No delamination occurred in the absence ofoxygen. The question then arises, how doee the ox.van reachthe delaminating region? Is it through ti'o uoating, or lateral-ly from the liquid in contact with the defect? The followingexperiments were designed to answer this question.
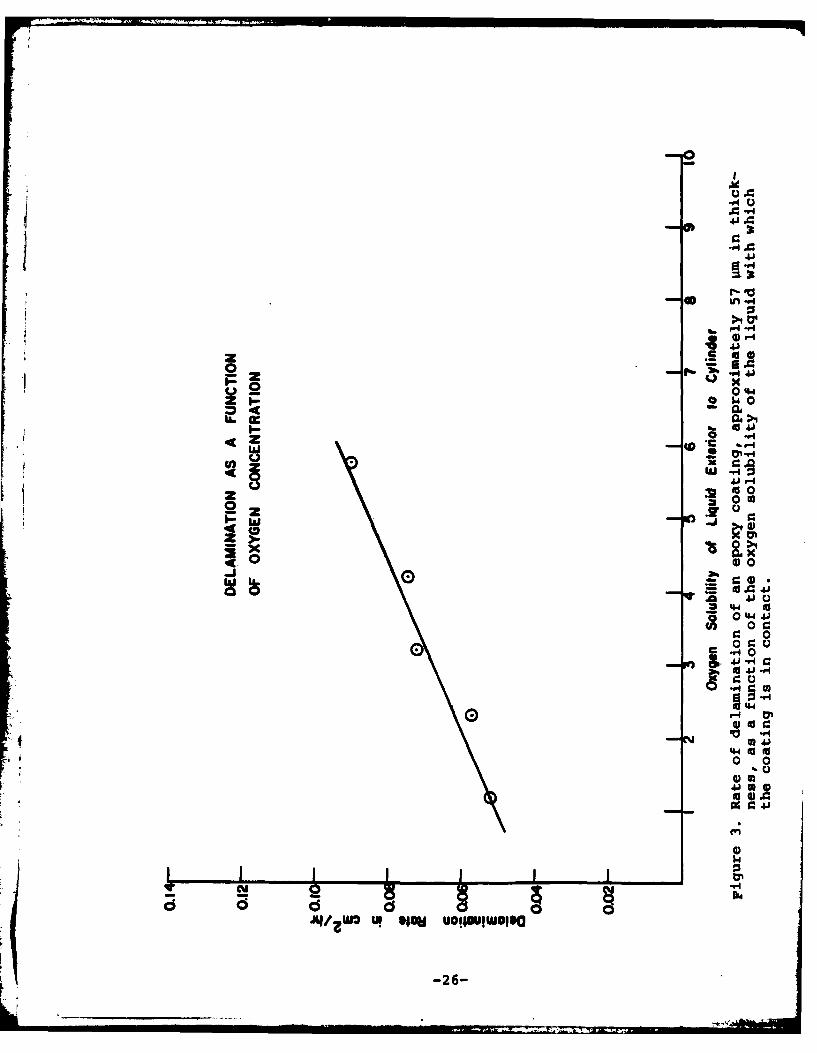
In the first set of experiments, steel panels were coatedwith the epoxy paint to yield a dry film thickness of 55-59 pmand the experimental arrangement shown in Figure 1 was used.A 7 mm defect was formed in the coating within the cylinder.Air-saturated 0.5M KCI was placed in the cylinder and a secondliquid with different oxygen solubility was placed exterior tothe cylinder. The liquids used and the oxygen solubilities aresmmarized in Table IV and the delamination rate as a functionof the oxygen solubility of the liquid exterior to the cylinderis given in Figure 3. All experiments were run for 79.4 hr andthe total delamination was measured after this time.
The data in Figure 3 clearly show that the rate of delami-nation decreases as the oxygen concentration in the liquid ex-terior to the cylinder decreases. Thus some of the oxygenfurnished to the delaminating zone must come through the coat-ing. However, extrapolation of the line to zero oxygen solu-bility still yields a finite delamination rate suggesting thatsome of the oxygen is furnished laterally from the defect inthe case of the epoxy coatings. Confirmation of this conclu-sion is obtained from an experiment in which the 0.5M KC1 in
-25-
.41
-.
0 W
41,-z Id0
0 044J
w 00 1 0u
0 4
41
00 0
0I w
a 441
K4 -26-

Table IV
Oxygen Solubility of Liquids in ExperimentsSummarized in Figures 3 and 4
Liquid Exterior to Oxygen SolubilityCylinder at 250
Distilled Water 5.78 cm3/L
0.125M LiCl 5.63
0.125M sucrose 5.40
0.125M CaCl2 5.08
0.5M sucrose 4.39
0.5M KCl 4.18
0.5M CaCI 2 3.71
2M KCI 3.21
IM sucrose 3.20
0.125M NH4Cl 2.31
2M sucrose 1.84
0.25M NH4Cl 1.16
1M NH4Cl 0.07
16% NaHSO 3 0
the cylinder was deaerated with argon and sealed and the dis-tilled water exterior to the cylinder was open to the air. Nodelamination beyond the cylinder occurred under these conditionsin a 98 hr period.
In the second set of experiments, steel panels were coatedwith polybutadiene in two steps to yield coatings approximately45 Um thick. The cylinder was filled with aerated 0.5K KCl andthe liquid exterior to the cylinder was a solution listed inTable IV. The delamination was corrosion induced by the defectwithin the cylinder and no external potential was applied. Thedata obtained from this set of experiments are summarized inFigure 4. It will be noted that the delamination rate was verylow when the oxygen content in the external cylinder was lowand was appreciable when the oxygen content was high. The lack
-27-

9
8
7
6 0
E~E
"3 3
2-
0
2 3 4 5 6Oxygen soki biy of sdution in cfr/L at 25
Figure 4. The rate of delamination at the corrosion potential ofpolybutadiene coatings, 45 um thick, on steel substratesas a function of the oxygen solubility in the solutionin which the panel was immersed. See Table IV for liquidsused in this study.
-28-
of perfect agreement is probably to be expected because factorsother than oxygen solubility may be involved. For example, theconcentrated solutions may change the activity of water and theconcentrated solution of sucrose may have enough impurities thatact as oxygen scavengers to reduce the oxygen concentration to alow value.
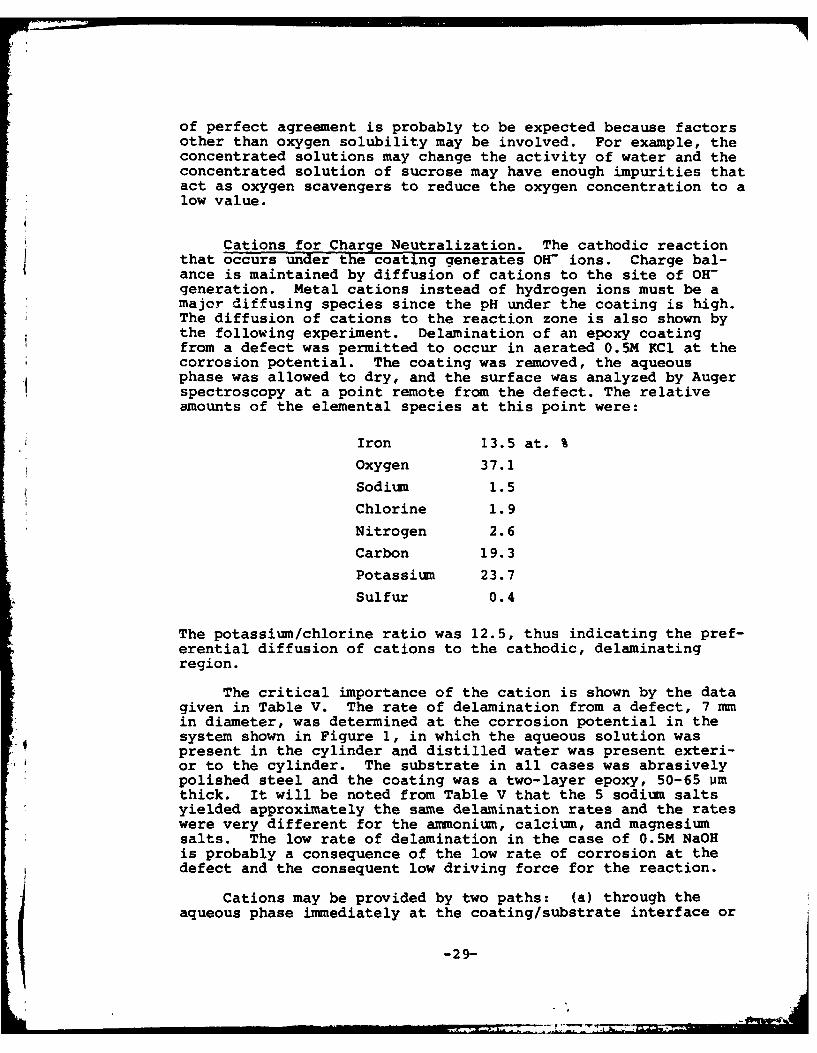
Cations for Charge Neutralization. The cathodic reactionthat occurs under the coating generates OH- ions. Charge bal-ance is maintained by diffusion of cations to the site of OH-generation. Metal cations instead of hydrogen ions must be amajor diffusing species since the pH under the coating is high.The diffusion of cations to the reaction zone is also shown bythe following experiment. Delamination of an epoxy coatingfrom a defect was permitted to occur in aerated 0.5M KCI at thecorrosion potential. The coating was removed, the aqueousphase was allowed to dry, and the surface was analyzed by Augerspectroscopy at a point remote from the defect. The relativeamounts of the elemental species at this point were:
Iron 13.5 at. %
Oxygen 37.1
Sodium 1.5Chlorine 1.9
Nitrogen 2.6
Carbon 19.3
Potassium 23.7
Sulfur 0.4
The potassium/chlorine ratio was 12.5, thus indicating the pref-erential diffusion of cations to the cathodic, delaminatingregion.
The critical importance of the cation is shown by the datagiven in Table V. The rate of delamination from a defect, 7 mmin diameter, was determined at the corrosion potential in thesystem shown in Figure 1, in which the aqueous solution waspresent in the cylinder and distilled water was present exteri-or to the cylinder. The substrate in all cases was abrasivelypolished steel and the coating was a two-layer epoxy, 50-65 umthick. It will be noted from Table V that the 5 sodium saltsyielded approximately the same delamination rates and the rateswere very different for the ammonium, calcium, and magnesiumsalts. The low rate of delamination in the case of 0.5M NaOHis probably a consequence of the low rate of corrosion at thedefect and the consequent low driving force for the reaction.
Cations may be provided by two paths: (a) through theaqueous phase immediately at the coating/substrate interface or
-29-
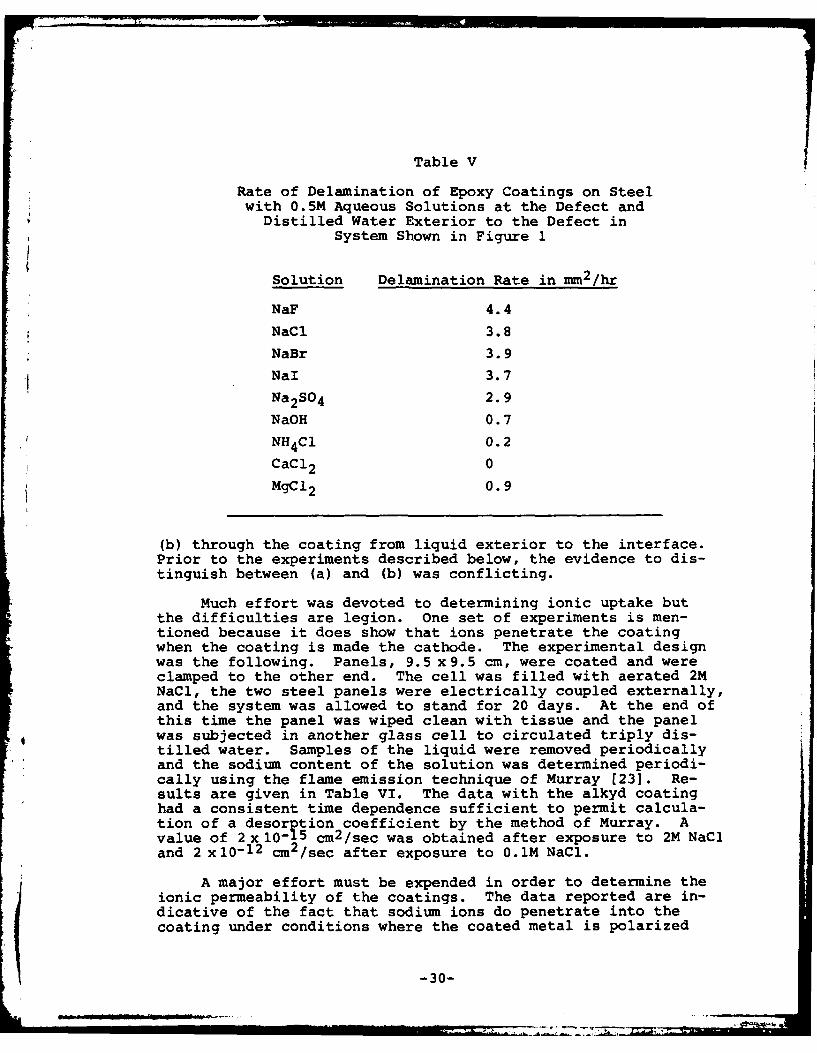
Table V
Rate of Delamination of Epoxy Coatings on Steelwith 0.5M Aqueous Solutions at the Defect andDistilled Water Exterior to the Defect in
System Shown in Figure 1
Solution Delamination Rate in mm 2 /hr
NaF 4.4
NaCI 3.8
NaBr 3.9
NaI 3.7
Na 2SO4 2.9
NaOH 0.7
NH 4Cl 0.2
CaCl2 0
MgCl 2 0.9
(b) through the coating from liquid exterior to the interface.Prior to the experiments described below, the evidence to dis-tinguish between (a) and (b) was conflicting.
Much effort was devoted to determining ionic uptake butthe difficulties are legion. One set of experiments is men-tioned because it does show that ions penetrate the coatingwhen the coating is made the cathode. The experimental designwas the following. Panels, 9.5 x9.5 cm, were coated and wereclamped to the other end. The cell was filled with aerated 2MNaCI, the two steel panels were electrically coupled externally,and the system was allowed to stand for 20 days. At the end ofthis time the panel was wiped clean with tissue and the panelwas subjected in another glass cell to circulated triply dis-tilled water. Samples of the liquid were removed periodicallyand the sodium content of the solution was determined periodi-cally using the flame emission technique of Murray [231. Re-sults are given in Table VI. The data with the alkyd coatinghad a consistent time dependence sufficient to permit calcula-tion of a desorption coefficient by the method of Murray. Avalue of 2 x 10-15 cm2 /sec was obtained after exposure to 2M NaCland 2 x10 - 12 cm2 /sec after exposure to 0.1M NaCl.
A major effort must be expended in order to determine theionic permeability of the coatings. The data reported are in-dicative of the fact that sodium ions do penetrate into thecoating under conditions where the coated metal is polarized
-30-

Table VI
Sodim Desorption from Coatings on Steel after Exposureto 2M NaCI for 20 Days While Coupled to a Bare Steel
Panel of Equal Surface Area
Concn. of Na in Circulating
Coating Thickness Distilled Water during Desorption
After 1 hr After 312 hr
Polybutadiene 32 Um 2.3 ppm 5.6 ppm
Polybutadiene 36 1.0 5.1
Epoxy 71 13.8 18.0
Epoxy 51 16.2 14.5
Alkyd 93 4.2 29.0
Alkyd 94 4.9 27.0
very slightly in the cathodic direction.
The delamination rate of polybutadiene coatings on steel islinearly related to the diffusion coefficient of LiCl, NaCl, KCI,CsCl, and CaCl2 (see Fig. 5) in aqueous solution [101. Thisobservation suggested that the supply of cations was providedthrough the aqueous phase at the interface, although the pres-ence of aqueous pathways through the coating could not be ruledout. The strong dependence of the rate of cathodic delaminationon coating thickness [17] suggested that the rate of diffusionof reactants through the coating was the important variable. Theinability to interpret these experiments adequately was themotivating force for the following experiments.
Panels were exposed for 174 hr in the arrangement outlinedin Figure 1 and the delamination exterior to the central vesselwas determined. Data for various combinations of liquids aresumarized in Table VII. It will be noted that no delaminationoccurred, except a minor amount with panel I, when the defectwas in contact with distilled water. On the other hand, whenthe defect was in contact with a salt solution the delaminationrate was significant and the delamination extended out beyondthe region which was in contact with the salt solution. Theseexperiments prove conclusively that the cations are supplied tothe delaminating front through the aqueuous phase at the inter-face under the conditions used.
-31-

W 44C4.
-r4u
r4W5 ..
r- t0
U4 0
0 4J
-lU
.04J
41 0
(J44J ~ ~ ~ ~ 4 44O UO4Jaoe-32- 9

041'
r-. CU) -"I .034 - . r404 0 r. . .
0 rq-4)-r40t04. 000 0 0000
40 0 w w to1:44' 0 0 0 0 0 0 w 0 0 w
$104 :3 44 44
0 10
4HQ 1414
0 0 000 00
F-4
'-4$ $4 0 00) 4J 4.' .4. 4-) 4
0 0 0 0 (a 00 o to a.' 04. 4 U) u 29 r4 U
g o 04> ) 0a u V v v9: 414~ 0 U ) 4)~HE 4
r4~ 0- 14I z2 rI~-LAx L -4 -40 4 *-- .1. *- .1 4 *n *14 -
0 j 0X) i-4 0 4)- 4 ) U).,q) U
4) UW 0 x . rI ( rU U r-4 .,. *1. w1 IA m
U 14 u o -4 0 '
P4 0) 4J'0-4 Xz x r
0 r.4 IA-AU F $.
0.4.10) 0 *'J 44' C;1+) m ~ :j -4 0r- rU-4v-
4J ) 4 4 0 3: X U 0 - - A
r-4 10 l f-
14 r-1.4 .14n - L trq 1 i .
N -33-

A similar set of experiments was carried out with appliedpotentials such that the cathode potential was either -0.8 or-1.2 v. These data are summarized in Table VIII. With the ex-ception of the anomalous results shown in the last entry of thetable, delamination occurred rapidly when 0.5K KCI was at thedefect and distilled water was exterior to the cylinder. De-lamination did not occur when distilled water was at the defectand 0.5M KCl was exterior to the cylinder.
In all cases studied to date the delaminated area is linear-ly related to time at a constant potential. This relationshipcan be derived under the following assumptions:
(1) The rate of delamination is determined by the rate atwhich the cathodic reaction occurs. When the coating is thinand the surface is active catalytically, the rate is determinedby the rate of lateral diffusion of cations from the defect areato the delaminating front.
(2) The concentration of the cation at the defect (Cb) isthe same as that in the bulk solution.
(3) The concentration of the cation at the delaminatingfront is zero.
*(4) The alkali metal ion concentration under the coatingchanges linearly from the defect to the delaminating front.
(5) The cations reach the delaminating front by diffusiongoverned by Fick's Law:
FM' = -D(dCM+/dr) (1)
where FM+ is the cation flux, D is the diffusion coefficient,C is the concentration of the alkali metal cation, and r ist e linear distance from the defect.
(6) There exists a liquid layer beneath the coating fromthe defect to the delaminating front.
The thickness of the liquid layer near the delaminatingfront is d and the radius of the delaminated region is R. Thecation diffusion rate at time T, M, is thus given by:
MM+ = FM+A = 21RdFM . (2)
The cation concentration, CM+ at a distance r from the defectbased on assumption 4 is
CM+ (r) = -(Cb/R)r + Cb (3)
-34-
AM

'.4
9-400
~W ~. -4 *q O~ C1 Cj
o-4~ - - '
44 9 -4 qw M- N -4
0
41 -1 4
41.4 4 Cror 0 V-
W, to A A Ar-4 r. 14w
A r-404 01W
> 00>0
4) '.4 -PA4W 0 C4 N- 0o u4 N
to 3: 04 41 I I I I
M24J 04
410)
-r-I p 4 $402j 0 a,) a,) an i 41) 4J 41
0 $4W 0v (a (a41> 4-)U
u-I ,-4 u-) W
>1 r-4-4 f-4 *..4
'- l 41 4J 41 0; 0 04) O I4J to) 01) to
$.4 $.4 '.4
41 41 44J f-4 r-4 r-4
4) . .4 rl ."I
.,,a0 0;0 4 J4
-35-
"'WI

and
dCM+/dr = -Cb/R (4)
Substituting (4) in (1)
FM+ = -D(-Cb/R) D(Cb/R) (5)
Substituting (5) in (2) gives
MM = 2r Rd[D(Cb/R)] = 2DCbd (6)
The total amount of cation diffusion from time t =0 to t = T
can be expressed as:
T= 21DCbd dt - 2 DCbdT. (7)
0
The total amount of cation existing in the electrolyte betweenthe coating and the substrate is
MT 2nr dCM+dr (8)
.R
MT = f 2 ir d[(-Cb/k)r + Cb]dr , (9)
which on integration yields,
MT = n/3 dCbR2 (10)
equating with (7)
7r/3 dCbR2 = 2iDCbdT (11)
Area delaminated = 6irDT (12)
Thus under the above assumptions, the delaminated area is alinear function of time T. The equation also allows the calcu-lation of the rate of delamination and such data are given inthe last column of Table IX. The calculated values are toohigh by factors of 17-200 indicating that the diffusion of thecations to the reaction zone is not rate limiting under theconditions of these experiments.
-36-

41$.
0~ C;0
>
4-0
( o N coW-4 . 4J
W0 ( 0
4) 04
4G1
H- 044J *O
tU 4J 2)N
0- a'I >4 a-% D H (D-r4H H4J 0 0 0 0D0 J II 0000
L) E
IN LA Ln Ln LA0.C O(N 1 1 1
. l4j 02 0 0DC 0 041 ~ U H- H4 H -4
4--4 -1
~ 4-4 N N LA %D(a0 rj * N -W 00 G
9 04-4~ :
4J U) 111-37
r-q u r*i0 .,4 (a u t
Effect of Film Thickness. It has previously been shownin the case of polybutadiene coatings that the rate of delami-nation decreases with an increase in film thickness in therange of 10-20 um. The thickness range covered with polybuta-diene is limited because of the difficulty in getting uniformoxidative curing with thick polybutadiene coatings. It wasthus decided to determine the effect of film thickness withthe commercial alkyd coating. All studies were carried out in0.5M NaCl at a cathodic potential of -0.8 v. The delaminationrates were determined at times up to 136 hrs. Representativedata for a film thickness of 142 pm are given in Figure 6. Asdescribed previously [17], the intersection of the linear por-tion of the curve with the X axis is termed the "delay time".The delamination rates as a function of film thickness are sum-marized in Figure 7, where it will be noted that the delamina-tion rate dropped to a low value when the thickness of the top-coat only exceeded 90 pm. The delamination rate of the primerplus topcoat did not change greatly with film thickness whenthe thickness exceeded 50 pm. The primer alone exhibited muchbetter resistance to delamination than the topcoat alone.
The square root of the delay time is plotted vs. the filmthickness in Figure 8. A linear relationship with an inter-section of approximately 25 jm is obtained.
Electrons. An essential reaction in the cathodic reactionis the electron. The concentration (or rate of supply) of elec-trons at the delaminating front is an important variable. Cover-ing the metal surface with a non-conducting layer, such asphosphate, reduces the availability of electrons for the cathodicreaction [11]. The representation of the electron availabilityat various locations within the delaminated region is the polar-ization curve. As stated previously, the cathodic polarizationcurve for steel in air-saturated 0.5MNaCl is essentially thesame over a pH range of 6.5 to 12.5 and the discussion belowassumes that the polarization behavior is independent of pH overthe range of concern.
Immediately at the defect the potential is that character-istic of the applied potential and the potential at the delam-inating front has an unknown value somewhat negative to thecorrosion potential. The value of the potential becomes lessnegative continuously from the applied potential to the valueat the delaminating front. Under the assumption that there issufficient oxygen in the liquid adjacent to the delaminatedregion, the rate of the cathodic reaction at each point will bedetermined by the polarization curve for air-saturated conditions.However, the exact potential at all points within the delaminatedregion is unknown.
Figure 9 represents the extremes of three types of polari-zation curves that are observed on metals whose behavior during
-38-

I'00
4.4o 0
O@ iZ41 xo in
S 00NO. 410* Id241-z 0P
co 0
-P4 (0
00
0 41
or -
eu* l DOM PSIDUI!W010
-39-

4J
91
44~
o~~ 0.
a (a
00z
0 4181 $4:
"4.
04
-40-4

*44 4
to14
441
wI
C0
Id 0
0
w w0
za V
~z. 41 tis, to
0 to4
Jw0 cc1
n44J
0 IYJH ul (owil Aosa)
ZI

Aj
4
04
00 r-
01
U0.
*0.-
21 >W4
0-4 4
0otx c
0) 0.1
14
-42-
cathodic treatment has been studied. Point A on each curverepresents the potential at the defect and Point B representsthe assumed potential at the delaminating front. Curve (1)has the shape of the polarization curve of aluminum in 0.5MNaCI. The surface is not active for the oxygen reduction re-
* action and the rate of delamination is low as indicated by thelocation of Point B. Curve (2) is a hypothetical curve some-what comparable to the polarization curve for tin in 0.5MNaCl. The curve has a steep slope such that the current densi-ty falls off greatly with increase in potential. Thus thecurrent density at the delaminating front is low. Curve (3)is typical of iron and copper in 0.5M NaCl. The oxygen re-duction reaction is catalyzed over a wide potential region andthe current density remains the same over a considerable po-tential range. Cathodic delamination occurs at a relativelyrapid rate because the current density at Point B is highrelative to comparable points on curves (1) and (2).I
The effect of the nature of the polarization curve on thedelamination rate is shown clearly in the case of thin poly-butadiene coatings on copper, steel, and tin substrates. Cop-per and steel show very similar polarization curves in 0.5MNa~l open to the air [17], and the delamination rate is 0.016cm /hr in the case of copper and 0.02 cm2/hr in the case ofsteel when the cathode potential is -0.8 v. The rate of de-lamination of the polybutadiene coating on tin, on the otherhand, is very low at the same potential. This fact is under-standable in terms of the idealized polarization curve for tinshown in Figure 9. The current density at this potential isapproximately an order of magnitude less and the current densi-ty falls off exponentially as the potential decreases radiallyfrom the defect. The current at the delaminating front is thusmuch less in the case of tin than in the cases of copper andsteel and the delamination rate is much less.
Catalytic Activity of Surface for Cathodic Reaction. Theshapes of the cathodic polarization curves for copper and steelin air-3aturated 0.5M NaCl indicate that the cathodic reactionat -0.8 v. is limited by a diffusion process-the rate at whichoxygen can reach the electrode surface. At a potential of-0.8 v. it is thus not possible to increase the rate of thereaction by increasing the catalytic activity of the substratesince the maximum rate is limited by oxygen diffusion to theinterface. We have been forced, therefore, to concentrate at-tention on catalytic deactivation of the surface.
Several pieces of evidence are already available that showthat the rate of delamination from a surface that has low cata-lytic activity is indeed low:
(1) As discussed earlier, delamination at potentialsseveral hundred my. cathodic to the corrosion potentials fromboth aluminum and tin surfaces is a result of the low activity
-43-

of these surfaces at this potential.
(2) Zinc surfaces inactivated by pretreatment in a cobalt-containing solution show lower delamination rates than untreatedsurfaces [12]. This behavior is explicable in terms of thelower cathodic activity [24].
(3) Surfaces that have been phosphated show low rates ofdelamination [101. This result is in accord with the lowered
* activity of phosphated surfaces for oxygen reduction [25].
Thus the rate of delamination can be decreased by inactivatingthe surface so that it is ineffective in catalyzing the oxygenreduction reaction.
Effect of Temperature. Data have previously been present-ed [13] on the effect of temperature on the cathodic delamina-tion of polybutadiene coatings on a galvanized steel substrateimmersed in 0.5M NaCl. These data yielded an activation energyfor the delamination process of 9,500 cals/mole. Unfortunately,the available data are not sufficient for use in determiningthe rate-controlling step. The value is in the high range forthe diffusion of counterions in ion exchange polymers [26], itis considerably higher than the value for the diffusion of NaClin aqueous solution, 4100 cal/mole [27] and is lower than thevalue of 17,000 cal/mole [28] obtained for ionic conductivityin cellulose acetate which had been soaked in 0.1M NaCl. Theonly conclusion possible at the present time is that the valueof 9,500 cal/mole is consistent with a rate controlling stepthat involves diffusion.
How to Minimize Cathodic Delamination. Many commercialpainted metals are specially processed to minimize cathodicdelamination. The metal surface is modified chemically by aprocess known colloquially as "pretreatment". These pretreat-ments are characteristically based on phosphates, silicatesand chromates, and major companies have developed around pro-prietary processes that have received wide utilization. Mostof the processes have been discovered empirically and changesin the process with time have been largely incremental ratherthan revolutionary. Environmental pressures, cost pressures,and raw materials availability are necessitating changes inpretreatment formulas and entirely new systems are needed. Thepurpose of the following comments is to outline the character-istics of the interfacial region at the organic coating/sub-strate boundary that will withstand cathodic delamination. Fivecharacteristics are selected for discussion.
(1) No bare metal, or superficially oxidized metal, shouldbe present at the coating/substrate interface. Slightly oxi-dized metals such as copper, zinc and steel are good catalysts
-44-

for the oxygen reduction reaction. Since the destructive com-ponent in the delamination process is the hydroxyl ion, therate of formation of hydroxyls should be minimized. Any layerat the metal surface should completely cover the metal.
(2) There should exist at the coating/substrate interfacea layer which is a very poor conductor of electrons. Electronsfor the cathodic reaction are furnished either by an externalpower supply or by the anodic half of the corrosion reaction.If the electron supply to the interface can be minimized, thereaction rate will be reduced. A non-metallic interfaciallayer with poor electron conductive properties is desirable.
(3) The interfacial layer at the coating/substrate inter-face should be a goor catalyst for the cathodic reaction. Thetwo common cathodic reactions, H20 + 1/202 + 2e- = 20H-and2H+ + 2e- = H2 , are both catalyzed reactions that do not occurreadily in the absence of a solid. The first reaction occursmost easily on oxidized metals and the latter reaction mosteasily on bare metal surfaces. Both reactions result in alocal increase in pH and both play a role in cathodic delamin-ation. The relative importance of each reaction is dependentupon the potential as well as the nature of the surface.
The interfacial layer should have a chemical nature suchthat it is inactive catalytically for both the above reactions.Hydroxyl ion generation will not occur if the surface isinactive.
(4) The boundary between the substrate and the coatingshould be rough. It is standard practice to improve substrate/organic coating adherence by roughening the surface, either byabrasive or chemical attack or by the formation of a reactionproduct which has a high surface area. A rough surface, how-ever, has another good characteristic to reduce cathodicdelamination. It provides a tortuous path for the diffusion ofcations to the site of the hydroxyl ion generation. The es-sential ingredients for the oxygen reduction reaction are(a) water, (b) oxygen, (c) electrons, (d) a catalyticallyactive surface, and (e) cations to provide local charge balancefor the hydroxyl ions. It has been shown herein that cathodicdelamination in NaCl solution occurs as a consequence of lateraldiffusion of sodium cations beneath the coating. Any surfacestructure that lengthens the path for cation diffusion or makesmore difficult the migration of cations to sites of possiblehydroxyl ion generation will reduce the rate of the oxygenreduction reaction.
(5) The interfacial region should be resistant to alkalineattack. The delamination process occurs as a consequence ofthe attack on the surface of the metal and/or the organic coat-ing at the interface. Both components of the interfacialregion are probably attacked and which occurs at the faster
-45-

rate is a function of the particular system. The ideal inter-facial region will include an alkali-resistant coating on themetal and an organic material that is very resistant tohydrolysis or other type of attack by aqueous alkali.
REFERENCES
[1] U. R. Evans, Trans. Electrochem. Soc. 55, 243 (1929).
(2] W. A. Anderson, Off. Dig. 36, 1210 (1964).
[3] R. R. Wiggle, A. G. Smith, and J. V. Petrocelli, J. PaintTech. 40, 174 (1968).
[4] ASTM Standard G8-72, Annual Book of ASTM Standards 27, 869 (1979).
[5] ASTM Standard Bll7-73, Annual Book of ASTM Standards 27, 1, (1979).
[6] H. Leidheiser, Jr. and M. W. Kendig, Corrosion 32, 69(1976).
[7] M. W. Kendig and H. Leidheiser, Jr., J. Electrochem. Soc.123, 982 (1976).
[8] H. Leidheiser, Jr. and M. W. Kendig, Ind. Eng. Chem. Prod.Res. Dev. 17, 54 (1978).
(9] H. Leidheiser, Jr., Croat. Chem. Acta 53, 197 (1980).
[10] H. Leidheiser, Jr. and W. Wang, J. Coatings Technol. 53,No. 672, 77 (1981).
(11] R. A. Iezzi and H. Leidheiser, Jr., Corrosion 37, 28(1981).
[12] H. Leidheiser, Jr., Ind. Eng. Chem. Prod. Res. Dev. 20, 547(1981).
[131 W. Wang and H. Leidheiser, Jr., Proc. Intern. Conf. onCorrosion Control by Organic Coatings, H. Leidheiser, Jr.,Editor, Natl. Assocn. Corrosion Engrs., Houston, Texas(1981).
[14] R. A. Dickie, J. S. Hammond and J. W. Holubka, Ind. Eng.Chem. Prod. Res. Dev. 20, 339 (1981).
[15] R. A. Dickie and A. G. Smith, Chem. Tech., January 1980,p.31.
-46-
[161 J. Ritter, Proc. Intern. Conf. on Corrosion Control by
Organic Coatings, H. Leidheiser, Jr., Editor, Natl.Assocn. Corrosion Engrs., Houston, Texas (1981).
[17] H. Leidheiser, Jr., L. Igetoft, W. Wang, and K. Weber,
Proc. 7th Intern. Conf. on Organic Coatings, Athens,Greece (1981).
(18] J. Ritter, personal communication, June 1981.
[19] J. S. Hammond, J. W. Holubka and R. A. Dickie, J. CoatingsTechnol. 51, No. 655, 45 (1979).
[20] R. A. Dickie, paper presented at Natl. Assocn. CorrosionEngrs. Meeting, Minneapolis, May 1981.
[21] M. Pourbaix, "Atlas of Electrochemical Equilibria inAqueous Solutions", Pergamon Press, London, 1966, 644pp.
[22] R. T. Ruggeri and T. R. Beck, "A Model for Mass Transportin Paint Films" in Corrosion Control by Coatings, H. Leid-heiser, Jr., Editor, Science Press, Princeton, N.J., 1979,pp. 455-61.
[231 J. D. Murray, J. Oil Col. Chem. Assoc. 56, 507 (1973).
[24] H. Leidheiser, Jr. and I. Suzuki, J. Electrochem. Soc.128, 242 (1981).
[25] R. W. Zurilla, "Important Correlations Arising from theScribe Test for Appraising Paint/Pretreatment/SubstrateSystems" in Corrosion Control by Coatings, H. Leidheiser,Jr., Editor, Science Press, Princeton, N.J., 1979, pp.243-58.
[26] H. J. V. Tyrrell, "Diffusion and Heat Flow in Liquids",
Butterworths, London, 329 pp., (1961).
[27] D. G. Gillam, Australian J. Sci. Research 4A, 84 (1951).
[281 J. Crank and G. S. Park, "Diffusion in Polymers", AcademicPress, New.York, 452 pp., (1968).
-47-

Program #2. Corrosion Control by Inhibition of theCathodic, Oxygen-Reduction Reaction
It has been proposed previously that the corrosion rate ofzinc may be reduced by decreasing the activity of the surfacefor the cathodic reaction 11]. This proposal was followed byobservations that indicated that predipping zinc in dilute solu-tions of Co(II} or Ni (II} salts decreased the catalytic activityof the zinc surface for the cathodic reaction in aerated NaClsolution [2]. A lower rate of corrosion resulted. We reportherein another example of substantial inhibition of the cathodicreaction on zinc using a chromate pretreatment followed by cath-odic treatment in NaCl solution at -1.6 v vs SCE.
Commercial samples of galvanized steel were used. Nosignificant differences in behavior were observed among differ-ent lots of galvanized steel that were used for comparativepurposes in some experiments. All measurements reported hereinwere made in 3% sodium chloride solution adjusted to pH 5.4 andexposed to air. The counterelectrode was graphite and it wasmaintained in a vessel separated from the measurement cell by afritted glass disc. The pH of the liquid in the measurementcell increased to the order of 7-10 during the experiments butindependent experiments carried out in this pH range indicatedthat pH was not a major variable in the interpretation of results.Polarization measurements were carried out using a PAR 350 Corro-sion Console and a standard cell assembly. The electrodes werein the form of rectangular pieces, the edges, backside, and con-tacting wire of which were coated with an epoxy cement. The ex-posed surface area of zinc was 2.25 cm2 .
Samples were abrasively polished with aluminum oxide, edgecoated with the epoxy, and then exposed in a 10% solution of aproprietary chrmating solution known as Granodine® 90 at pH1.5 for 60 seconds. The pretreated samples were washed withdistilled water and immediately immersed in 3% NaCI solutionand allowed to stand for 10 min before the polarization wasinitiated.
A typical set of experiments is summarized in Figure 1. Thefirst cathodic scan yielded a higher cathodic current densitythan obtained on zinc not pretreated in Granodine® [1], sugges-tive of the fact that some species on the surface was consumingelectrons. The peaks between -1.2 and -1.3 v on the negative-direction scans are probably due to the reduction of zinc oxide,as per prior observation [1]. The scan direction was reversedat -1.6 v and the lower catalytic activity of the reduced sur-face was noted up to a potential of -1.28 v. At potentials lessnegative than -1.28 v, the zinc surface behaved anodically and
* - Registered Trademark, Amchem Products, Inc.
-49- pWJD1L ?AM MANK-No?1

0
0 ~41 tX 0
900
r 49 4J
4 -W0A'U -4 0
4) 0 04 44d
f~v~' / .01010 41 0)
~- 41 -H 0D
*) F. -4 41l45004
0i. 450tH go 00 0 1 -
to 04
0 0)-0 4 r.f r
0 40
0 41
44 4)
S1O0A NI 33S snsHA 1VIIN3L0d
-50-

an oxide presumably formed on the surface. The potential con-trol was terminated at -1.1 v and the specimen was allowed toremain in the NaCI solution for 10 min, during which time thecorrosion potential drifted from -1.1 v to -1.0 v. A secondpotential scan in the cathodic direction was initiated and itwill be noted that the activity of the surface was decreasedone order of magnitude in the vicinity of the corrosion po-tential. The prior cathodic treatment greatly decreased thecathodic activity of the zinc surface.i Repeated experiments of the same type yielded curves es-sentially the same as that for the second scan so long as thesample remained in the NaCi solution for no more than 20 minafter the applied potential was removed. Longer exposuretimes caused the cathodic curve to move to higher currentvalues until after several hr of exposure, the curve was es-sentially identical to the first scan.
Experiments of the similar type carried out in 3% NaCI with-out pretreatment in the Granodinel solution yielded curves suchas those shown in Figure 2. The cathodic activity of the zincsurface was approximately the same before and after cathodicpolarization at -1.6 v, and up to 1 order of magnitude higherthan that observed for the second and third runs in Figure 1.
Unsuccessful attempts were made to understand the chemistryof the zinc surface before and after cathodic treatment at -1.6vusing surface analysis techniques. The elemental composition,largely chromium, zinc and oxygen, was readily determined butno correlation between composition or valence state and cata-lytic activity was extractable from the data. It is our impres-sion that exposure of the sample to air and to washing prior toinsertion into the spectrometer yielded a steady-state condition,reflective of the observation that the cathodic polarizationcurves obtained after long exposure to the NaCl solution weresimilar.
Attempts were made without complete success to duplicatethe behavior of the proprietary solution using standard chromatesolutions. Since our objective was to pursue the concept ofcathodic inhibition of zinc, rather than the develorment of animproved pretreatment solution, we felt it unnecessary to developa formula which could be published.
In summary, a zinc surface pretreated in a commercial chro-mating solution exhibits low catalytic activity for the cathodicreaction in 3% NaCl solution after electrolytic reduction at-1.6 v. A higher catalytic activity is regenerated after expo-sure of the surface to aerated NaCl solution for times in excessof 10 min. These experiments provide additional support for theview that corrosion control of zinc is possible by appropriatecontrol of the composition of the zinc surface with consequentcontrol of the kinetics of the cathodic reaction. It is inter-esting to point out that commercial electrogalvanized steels
-51-
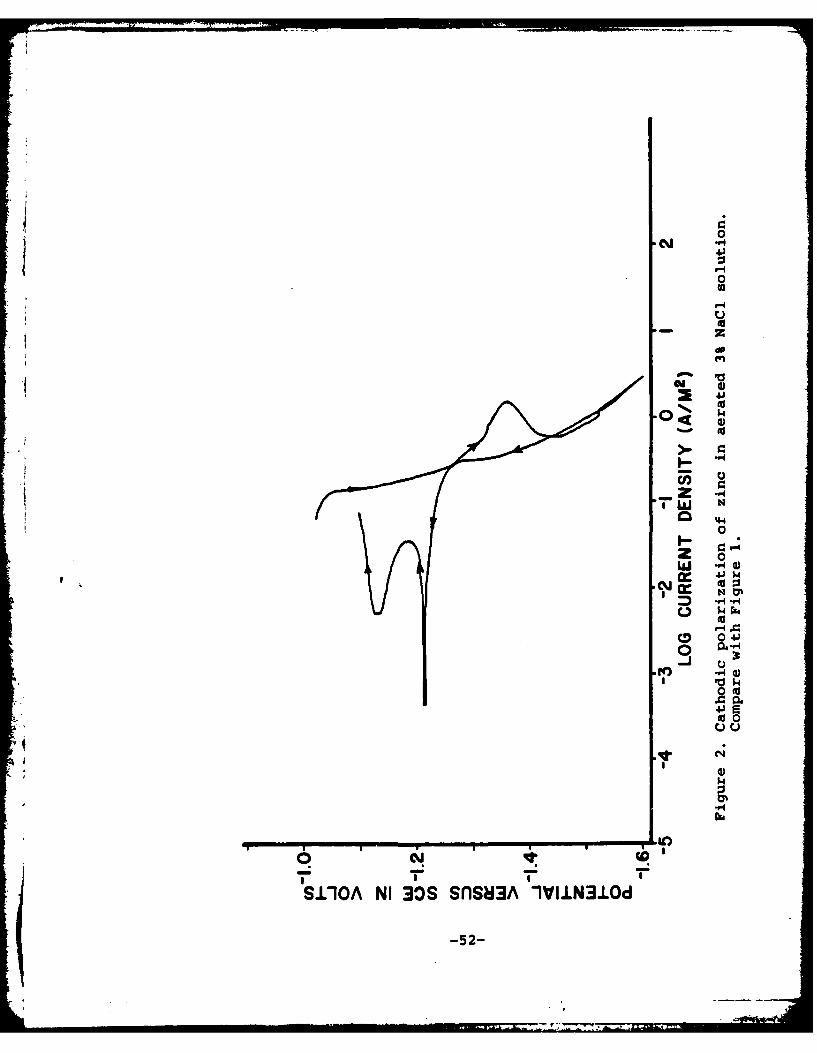
0
9-4
z
~4J0 o$
Ic )
S0
WLI N440
z 0 .iAJ -H4)J
to~0 4
41~
SI.O N00SsnSAIVI3
-52-)
with claimed higher corrosion resistance include chrcmium as analloying agent [3].
REFERENCES
[11 H. Leidheiser, Jr. and I. Suzuki, Corrosion 36, 601 (1980).
[2] H. Leidheiser, Jr. and I. Suzuki, J. Electrochem. Soc. 128,242 (1981).
[3] T. Adaniya, Sheet Metal. Ind. 55, 73 (1978).
-53-

Program #3. Optical Studies of Corrosionunder Organic Coatings
This section is based primarily on workperformed by the senior investigator whileon leave from Lehigh at the Building Materi-als Group of the National Bureau of Standards,August 1980 to July 1981.
Experimental Method and Initial Results
Light microscopy has received limited use in the study ofblistering and corrosion under organic coatings (1-31, but thenew method described here permits direct and continuous obser-vation of these processes.
A simple corrosion apparatus has been constructed thatoperates on the stage of a light microscope. The corrosion testcell is shown schematically in Figure 1. It consists of a 10 mmdiameter cell formed from a 3 m thick layer of silicone rubberplaced on a coated steel specimen. Aerated water or salt solu-tion flows through the cell at a rate of 0.1 to 0.2 ml/min,through an inlet and outlet of hypodermic tubing molded intothe cell. The cell volume is about 0.2 ml, so this flow rateis slow enough to give smooth flow but it is sufficient to sup-ply a large excess of the dissolved oxygen required for corro-sion. The cell is enclosed by a microscope cover glass.
The specimens are observed continuously in a metallurgical(reflected light) microscope by a 1oX objective lens with aworking distance of 7.6 mm, which provides ample space for thetest cell. Glare from the several reflecting surfaces presentis overcome by using polarized illumination and an analyzer set15 to 200 from the crossed position. Observation with complete-ly crossed polars is also helpful in revealing some of the cor-
4rosion phenomena. Photography was eventually automated to ob-tain pairs of 35 nun color slides, bright and dark (crossedpolars), at time intervals of one to several hours. Teststypically were carried out for two to four days, often followedby continued exposure to near-100% relative humidity.
Specimens were prepared from cold-rolled, low-carbon steel.The surface was wet ground through 600-grit abrasive paper,washed thoroughly in acetone, distilled water, and ethanol, andthen warm-air dried. Polybutadiene was selected as a coatingbecause it is moderately permeable to both water and oxygen (4].The material used, DuPont's Budium RK 662, was applied by a drawbar or wire-wound rod and then cured at 200 0 C for 25 min in aI 55- pj~ m &ANKGE MAa
.M12

14
00
0)
so cr 44
cfa)
moU
Lii-.
.000,
'01'
-56-

circulating air oven, to dry thicknesses of about 15 to 30 Um.The cured system is golden yellow in color, but otherwise trans-parent. Two types of "defects" were introduced in the coatedspecimens. First, a salt contamination spot was placed on thesteel before coating, by drying of a 0.01 ut drop of dilute
-KHSO 4 solution to give a spot about 0.6 mm (600 pm) in diameter,with a calculated average thickness of 0.1 um. Second, con-taminated coating areas were punctured with a needle to make ahole about 60 pm in diameter.
The experimental observations are in general accord withthe events included by Masters and Pommersheim in their initialmathematical modeling of corrosion under coatings [5]: perme-ation of water and oxygen through the coating to the steel,blister formation and growth, and the initiation of corrosion.Most of the observations are qualitative, although some measure-ments have been made and others will be possible in the future.An example of a simple measurement in the microscope is coatingthickness. At high magnification, typically with a 40X objectivelens, the depth of focus is small and one can focus successivelyon the steel surface and on the top surface of the coating(actually on microscopic dirt specks that unavoidably settle onthe surface). The coating thickness is the difference in focalpositions, Ah, multiplied by the refractive index, n, or t= nAh.The refractive index was measured to be 1.549, significantlyhigher than the literature values of 1.515 to 1.526 (6], so thetrue thickness is 55% larger than the apparent thickness.
Observations will be described mainly for KHSO 4 contamina-tion spots under the polybutadiene coating, but similaritieswill be pointed out when the coating is punctured in an uncon-taminated area. The "data" are mainly color micrographs, whichcannot be readily reproduced here, so the schematic drawing ofFigure 2 will aid in visualizing the results summarized in thefollowing steps:
(1) In an environment of aerated distilled water, the con-tamination spot becomes visible within one hour. This is at-tributed to enhanced image contrast from refractive index gradi-ents during transient water permeation. The equilibrium solu-bility of water in the coating is probably less than 2% [7,8].
(2) Within 2 to 3 hours, areas delineated by optical interfer-ence rings appear in an annulus around the contamination spot.Typical diameters of these areas are 80 to 200 pm, and theyslowly increase in size, often merging to form larger areas.Subsequent observations suggest that these areas result fromthe beginning of the cathodic reaction as part of a localizedelectrochemical corrosion cell.
(3) Within several hours, crossed polars show slight butdefinite changes in the contamination spot, usually in one ortwo rounded areas that are 100 to 300 Pm in diameter. Thesedevelop gradually into prominent blue spots that are the anodes
-57-

0 kid
U) 0
"4
12 0
00UJU
U)Uz M 0
0 C-0
-58.'

in the electrochemical cell, similar to the appearance of themoving anode in filiform corrosion (9-12].
(4) The anodes develop perceptible depth, which becomesreadily recognizable as a blister by about 50 hours. The anodesand blisters are in fact coincident and result from solution ofthe contaminant in water that has permeated. This creates anosmotic gradient that drives water into the blister and makesit grow. At present, blister height can be measured accuratelyonly after removal of the specimen from the test cell, after 50to 100 hours. A typical height is 10 Um (about half the coatingthickness). The liquid volume in a blister is then calculatedto be about 0.0002 U1, which is approximately the quantity re-quired to dissolve all the KHSO4 under the blister. Thus, inits early development the blister contains a saturated solutionof KHSO4 , which is acidic and readily dissolves the anodicproduct Fe++ .
(5) There is often a "breakthrough" of the anode outsidethe original contamination spot, enlarging the anode and thearea of the blister. The breakthrough may be caused by twofactors: osmotic pressure in the blister, and the tendency ofthe adjacent cathodic reactions to break the bond at thecoating-steel interface (cathodic delamination) [4]. Withprolonged exposure to high humidity after the conclusion of thetest in the microscope, repeated breakthroughs occur, thusspreading the corrosion.
(6) Iron oxides gradually form, at the periphery of theoriginal contamination spot or immediately around an anode.Oxide formation results from the proximity of the anodic andcathodic reaction products, and the precipitation of hydratedoxides when they meet. The "rust" that is formed is often astriking yellow or red color but is readily observed only whenglare is eliminated completely by crossed polars.
(7) The corrosion processes described above proceed veryslowly after about 25 hours. The slow rate is probably a con-sequence of the fact that the cathodic reaction is rate con-trolling because of the limited amount of oxygen permeatingthe coating and because the OH concentration rapidly buildsup except where iron oxides can form. The importance of oxygen
*was demonstrated qualitatively by a test in which the water wassaturated with oxygen; anodic action and rust formation wereabout twice as fast as with air. In another test the water wassaturated with nitrogen, largely excluding oxygen; blistersformed as usual, but anodic action was greatly diminished.
(8) When a specimen is tested in aerated NaCl solution(0.1 molar), the phenomena are similar to those described al-ready, but faster. This increased rate is attributed to theavailability of sodium cations that permeate the coating andact as counter ions for the OH" ions produced at the cathodes.
-59-

The explanation remains to be verified by microanalysis on coat-
ings stripped after the test, but the mechanism has been foundin other cathodic delamination experiments [13].
(9) When a coating is punctured and then tested in NaClsolution, the bare steel exposed at the puncture is immediatelyanodic. Cathodic areas develop quickly around the puncture andrust forms (Fig. 3). Within 20 hours, however, anodic actionspreads adjacent to the puncture, apparently where some cathodicareas shift to become anodic. A growing annulus of cathodicdelamination is apparent, but cathodic blisters with heightsof a few um continue to exist within the annulus. After thetest, the coating can be easily stripped from the anodic andsurrounding cathodic areas.
(10) All of the processes described above are localizedand take place entirely under the coating, which remains intact.Elsewhere the coating and steel appear unaffected, although thecoating must become saturated with water and oxygen. Eventuallycorrosion is noticed at some additional sites, for reasons thatare not yet known.
Further Research
Preparations are underway for detailed study of cathodicdelamination by light microscopy supplemented by SEM, EDX, andother techniques. The corrosion test cell will be modified toprotect the steel cathodically, either by contact with an activezinc anode or by an applied potential. The anodic oxidation ofthe steel will thereby be suppressed, and the light microscopywill be concentrated on observation and measurement of thecathodic process.
Exploratory EDX analysis on coatings taken from othercathodic delamination tests on this project show that ionsfrom the electrolyte can be detected in the coating at or nearthe coating-steel interface. In the new experiments, detailedcorrelation should be possible with the position of the delami-nation front, by stripping the coating at various positions asobserved by light microscopy. Various electrolytes will beused as in previous experiments (4], such as LiCl, NaCl, KC1and CsCl.
A problem in the interpretation of the mechanism of cathod-ic delamination is that ions may reach the delaminating fronteither by diffusion through the coating or by migration alongthe delaminated interface from the original coating defect. Itmay be possible to distinguish the operative mechanism withsubstrate salt contamination as reported in the previoussection. For example, if KHSO 4 contamination is used and theelectrolyte is a CsCl solution, EDX analysis should readilydistinguish which cation is present at the delamination front.
-60-

z M o
z z 0 w
ir 0
m4 0
"44
0
*.00 . e-V40
.1
Thus it appears that the microscopy method being developedhere can contribute to clarifying the mechanism of the veryimportant phenomenon of cathodic delamination.
REFERENCES
(1] L. A. van der Meer-Lerk and P. M. Heertjes, J. Oil Col.Chem. Assoc. 58, 79 (1975).
[2] L. A. van der Meer-Lerk and P. M. Heertjes, J. Oil Col.Chem. Assoc. 62,. 256 (1979).
*1 [3] W. Funke, Progress in Organic Coatings 9, 29 (1981).
[4] H. Leidheiser, Jr. and W. Wang, J. Coatings Tech. 53,77 (1981).
[5] L. Masters and J. Pommersheim, "Mathematical Models forFormation and Growth of Blisters on Protective Coatings",Preprint Volume, Second International Conference on theDurability of Building Materials and Components, Septem-ber 1981.
[6] Polymer Handbook, 2nd Edition, J. Brandrup and E. H.Immergut, Eds., p.V-3, John Wiley & Sons (1975).
[7] H. Leidheiser, Jr. and M. W. Kendig, Corrosion 342, 69(1976).
[8] Solubility estimated to be 1.9% from the refractive indexmeasured after equilibration with 100% relative humidity,1.545, compared with dry polybutadiene, 1.549, and water,1.333.
[91 C. F. Sharman, Nature 153, 621 (May 20, 1944).
[10] M. Van Loo, D. D. Laiderman, and R. R. Bruhn, Corrosion9, 277 (1953).
[11] W. H. Slabaugh and M. Grotheer, Ind. Eng. Chem. 46, 1014(1954).
[12] J. D. Sudbury, 0. L. Riggs, and F. J. Radd, MaterialsProtection 1, 8 (1962).
[131 J. E. Castle and J. F. Watts, "Cathodic Disbondment ofWell Characterized Steel/Coating Interfaces", PreprintVolume, N.A.C.E. Conference on Corrosion Control byOrganic Coatings, Lehigh University, August 1980.
-62-
Program #4. Electrical Properties of Organic Coatingsand Relationship to Corrosion
INTRODUCTION
For years organic coatings have been used to protect metalsfrom corrosive environments. The degree of protection providedby such coatings can be attributed to several factors: thepermeability to environmental elements (oxygen, water, and ions),adhesion to the substrate, and the electrical resistance of thecoating. Classical delamination tests give only a partial pic-ture of the events leading up to localized coating failure andcorrosion of the substrate. Recently several authors [1-4] haveapplied impedance techniques used on bare metals to coatedsystems in an attempt to achieve a more complete picture of thecorrosion process.
We have recently reported on the development of an AC im-pedance probe [5] used to locate and investigate localized de-fects in polymer coatings on steel substrates. In the presentwork the goal is to use this probe to investigate the breakdownof these coatings and to develop predictive criteria for esti-mating the lifetime of an organic coating.
EXPERIMENTAL
The instrumentation for this study has been described in aprevious paper [5]. The AC probe described at that time hasbeen revised to include glass wool rather than a platinumjunction between the reference electrode and solution. Thischange gives better electrical contact and thus a more repro-ducible response.
Metal samples were conventional 1010 cold-rolled steelsupplied by Bethlehem Steel. Auger analysis showed that com-position of these panels varied significantly with 1st (23.1:17.6% Fe, 29.1:44.0% C for first to second shipments). Thisdifference affects coating adhesion properties and is thusnoted. The surface was prepared by abrading with medium thenfine silicon carbide after degreasing in trichloroethane.Panels were subsequently rinsed several times with distilledwater followed by methanol.
-63-

Coating systems for this study included commercially avail-able polybutadiene (Budium RK-662), a white alkyd paint (RUST-O-LEUM #7791), a green epoxy-polyamide primer system (Pro-LinePaint QPL No. 24441/114), and Shell Epon 1001-F Emerez 1511epoxy-polyamide system. In addition, a yellow primer (RUST-O-LEUM #7773) was used with the alkyd paint to study the contri-bution to coating adhesion and electrical resistance. Thealkyd and green epoxy systems were cured at room temperaturefor about one week per coating layer. Polybutadiene and Eponcoating were first subjected to oven curing (200*C, 20 min;100*C, 1 hr-shorter times for multiple layers) then one weekat room temperature. To study the effect of cure-history onelectrochemical resistance, the oven-exposure times for thelater systems were varied. Coating thickness was varied by ap-plying multiple layers of polymer while allowing for curing forsubsequent layers.
Figure 1 shows a typical cell configuration. An AC po-tential of 2.5 mV was applied to the system, and the appliedsignal was monitored at the counter electrode (at the scanningamplifier output of the potentiostat). The DC was maintainedat 0.00 v (potentiostated) unless otherwise noted in order tokeep the DC current below 10 VA. The electrolyte was 0.5M NaClopen to the air.
RESULTS AND DISCUSSION
Figures 2 and 3 show typical impedance plots obtained foruncoated and coated metal samples. Two major differences canbe seen. First, the addition of a coating causes an increasein the value of the imaginary component (Z") of the compleximpedance. This increase is a result of addition of a capaci-tance by the coating. The second is the absence of negativeZ" values in the coated system which has been attributed to thepresence of a pseudo-inductance when the probe is in closeproximity to the metal surface. When a coating breaks down,the impedance response of the system shifts towards that ofbare metal. Thus by monitoring the impedance response ofcoated systems over periods of exposure to electrolyte solutionwe can characterize the processes leading to corrosion and per-haps predict failure.
Table I lists the coating systems studied and the corre-sponding delamination rates presently available. Figures 4-12give the ratio of the imaginary and real components of thecomplex impedance (tan 9) as a function of exposure time forsome of the systems that were studied. Several distinct regionscan be seen in the plots. It is generally accepted that diffu-sion from the coating is a major rate controlling step in thebreakdown mechanism. To determine what processes these steps
-64-

CE (Pt)S --RE 1A ,,C,)
Probe
Polyethylene Tube"i 0.SM NaCI.
I m A rkd Coatingl J
Figure 1. Sketch of measuring system and design of probe.
i-.4,
-65-

S1.06*- cold-rolled steel
•- 304 stainless steel 8.33
0 - 316 stainless steel
500 - Mone 400 #3.28
010
N £
&.200101300
102 32.31 1-100 32. 31
Z I
z',g
Figure 2. A.C. impedance of uncoated metal samplestaken with the probe. Frequencies givenin kHz.
-66-
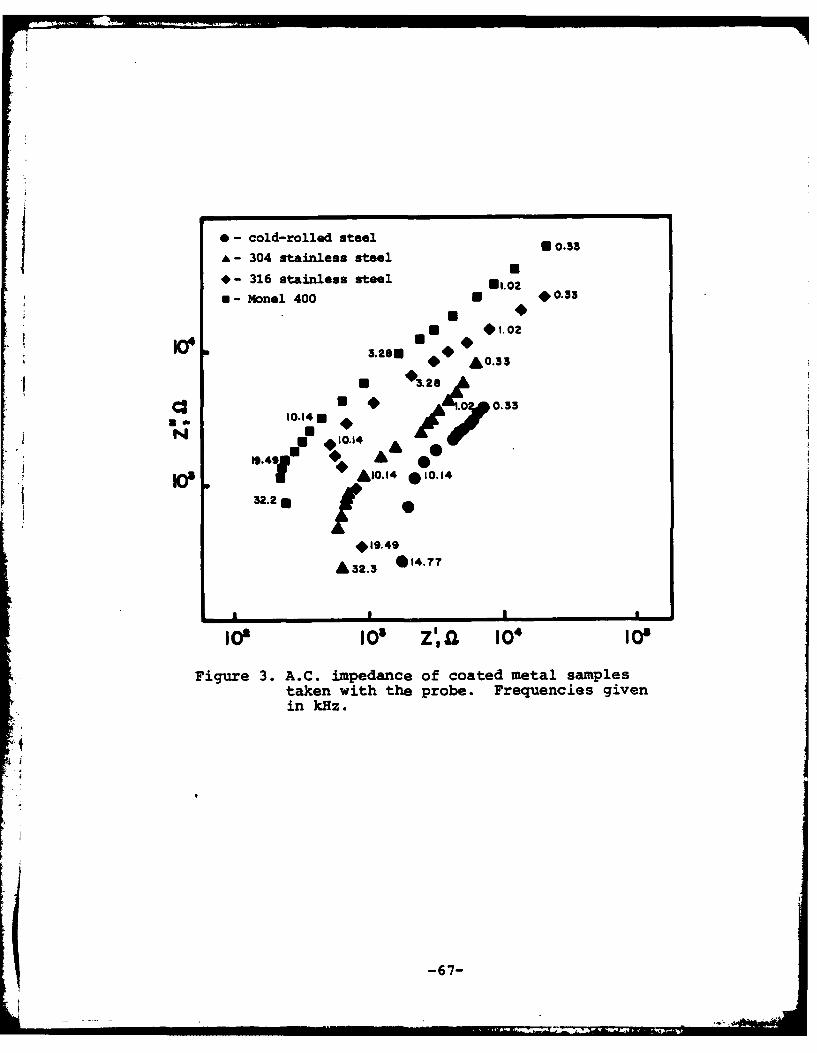
*-cold-rolled steel *03c - 304 stainless steel
F*- 316 stainless steel *o 03
AO .33
* *10.14 A *
4d * AJ0.14 * 10.14
32.2*
*19.49
A£32.3 *14.7T
Figure 3. A.C. impedance of coated metal samplestaken with the probe. Frequencies givenin kHz.
-67-

Table I
Coating Layers Thickness Time to *Delamination
CaigLyr.h( s Failure (Days) Rate (mm4/hr)
Epon 1001-F/ 1 15 0.11 (a)Emerez 1511 2 51 1.00
3 514 88
White Alkyd 1 13 17.85 17.602 68 41.91 11. 20
i 3 76 52.87 2.01
4 147 >:67 2.14
Alkyd Plus 1 94 > 50 (b) 1.442-Layer Primer o2 107 "1 .18
3 115 "0.66
4 122 "1 .23
Polybutadiene 1 9.0 >20 1.51
1 18.2 " 1.89
2 29.2 " 0.49
2 40.3 " 1.96
Green-Epoxy 1 36 > 30 (b) --
2 80 " 3.30
3 107 " 5.49
4 114 " 3.57
5 115 " 3.10
Blasted- 2 80 " 2.17~Surface
S a4 124 " 2.07
* Delamination rates determined by Lars Igetoft, VisitingScientist. Measurements taken at -0.8 VDC.
(a) Unable to determine due to overall poor adhesion.
(b) Exposure continuing beyond this writing.
-68-

108 04660. 1 kHz 0
10' 0. 01.4 *7.0
C10 20.1 A
0
o o20 3b40
TIME (days)
10" *604
0.1 kz 0
0.5 0101"1.4 *
7.0 X
20.1A
100,
0
0 10 20 30 40
TIME (days)
Figure 4. (Top) Tangent 8 vs. exposure timeto aerated 0.5M NaCi for alkydcoating, 13 urn thick, on steel.
Figure 5. (Bottom) Tangent 6 vs. exposuretime to aerated 0.5M NaCi foralkyd coating, 68 uim thick, onsteel.
-69-

10' *6120.1 kHz 0
0.510' 1.4 *
7.0 X
20.1 A106,
Z 1-
0
-10-,
0 o40 s s0
TIME (days)
10
10
WZ i-
*63610-a 0 0.1 kHz
0 o.s
0 1.40 X 7.0
A 20.1
-10-a
0 2t U0 60 8
TIME (days)
Figure 6. (Top) Tangent e vs. exposure timeto aerated 0.5M NaC1 for alkydcoating, 78 Um thick, Qn steel.
Figure 7. (Bottom) Tangent e vs. exposuretime to aerated 0.SM NaCI foralkyd coating, 147 um thick, onsteel.
-70-

10
10
100
10-i
0 102 Hz0 406* 1421
10-2 9 7006A 20110
0
-i0-20 10 20 30 40 60
TIME (days)
Figure 8. Tangent e vs. exposure time to aeratedO.5M NaCi for alkyd coating plus yellowprimer. Total coating thickness was9 4 vim.
-71-

10*
0 102 NZS 4960 1421X 7008£20110
0
-10
0 .2 .4 .6 .8 1.0
TIME (days)
Figure 9. Tangent e vs. exposure time to aeratedO.5M NaCi for Epon 1001-F/Emerez 1511coating, 15 uam thick, on steel.
-72-

10
o 102 Nz
0 1421700S
£201 10
10S
0'
0 2 4 a a 10
TIME (days)Figure 10. Tangent e vs. exposure time in aerated
0.SM NaCi for Epon 10O1-F/Emerez 151151 uim thick applied as 2 layers, onsteel.
-73-

100
10-01
0
o 102 Hz0 496
101 0 14219 7008£20110
0 2 0 10
TIME (days)Figure 11. Tangent 8 vs. exposure time in aerated
O.5M NaCi for Epon 1OO1-F/Emerez 1511coating, 51 umn applied as 3 layers,on steel.
-74-

103
10
0 10iz
10-2
10-3------
o 102 Hz0 456
£201 10
-10-2
0 a 10 15 20 25
TIME (days)
Figure 12. Tangent e vs. exposure time in aerated0.51 NaCi for Epon 1O01-F/Emerez 1511coating, e8 usm thick, on steel.
-75-

4
3 0w
150.
so.
6 @2
40
I z
II
afe exosr in aeae 0.MNI
/.
cotn on steel
/
0, 2 4 6 8 10 12
i SQ. RT. EXPOSURE TIME
Figure 13. Relationship between time to failureafter exposure in aerated 0.5M NaCivs. coating thickness for an alkydcoating on steel.
-76-

represent, low frequency impedance studies along with other sur-face analysis techniques are required.
The addition of the yellow primer to the alkyd system showedmarked inhibition of the breakdown process, with Tan 8 valuesrepresentative of nearly pure capacitive systems. Figures 4 and8 show the marked difference in the time to failure (crossingto neg Tan 8 values) for one coat of alkyd paint with and with-out primer.
Preliminary results for the alkyd system also show a highdegree of linearity between the square root of failure time andcoating thickness (Fig. 13). These findings may be unique forthis system and, thus, should not be extrapolated to othersystems. Too many factors (polymer matrix configuration, coat-ing defects prior to testing, etc.) can cause deviations fromlinearity. Thus,delamination rates (Table I) are helpful inproviding another evaluation of the coating.
The coating defect structure and thickness also play animportant role in the effect of oven-cure time on impedance re-sponse over this frequency range. Since these are two of themajor factors controlling coating breakdown, curing effects willonly be seen if there is a marked change in coating structureduring the curing process. Preliminary results on the polybuta-diene system show no measurable difference in impedance responsefor 10, 20 and 50 minute curing at 2000C after two weeks' ex-posure to 0.5M NaCi.
REFERENCES
[1] G. Reinhard, K. Hahn, and R. Kaltofen, Plaste Kautsch. 22,522 (1975).
[2] M. Piens and R. Verbist, "Corrosion Control by OrganicCoatings", H. Leidheiser, Jr., editor, Natl. Assocn. Corro-sion Engrs., Houston, Texas, in press.
[31 J. D. Scantlebury and G. A. M. Sussex, "Corrosion Controlby Organic Coatings", H. Leidheiser, Jr., editor, Natl.Assocn. Corrosion Engrs., Houston, Texas, in press.
[4] J. V. Standish and H. Leidheiser, Jr., Corrosion 36, 390(1980).
[5] M. C. Hughes and J. M. Parks, "Corrosion Control by OrganicCoatings", H. Leidheiser, Jr., editor, Natl. Assocn. Corro-sion Engrs., Houston, Texas, in press.
-77-

Program #5. Determination of the Acidity ofIron Oxide Surfaces
INTRODUCTION
The adhesion of organic polymers to inorganic oxides, suchas those on steel surfaces and iron oxide pigments, has beenshown to result entirely from acid/base interactions betweenthe polymer and the oxide. Hydrogen bonds have been shown tobe a sub-set of acid/base interactions and dipole/dipole inter-actions were shown to be so negligibly small that no experi-mental evidence for them has yet been found. It therefore be-comes important to find a method of measuring and predictingacid/base interactions in the bonding of organic polymers tometal oxide surfaces, especially the oxide layers on steel.
RESULTS AND DISCUSSION
This year the characterization of the acidity of iron oxidesurface by Drago's E and C constants [1] was devoted to investi-gations of the accuracy and reproducibility of the flow microrim-eter, the rate of adsorption, the effect of moisture on the inter-action of iron oxide surfaces with bases such as pyridine and tri-ethylamine, and the effect of different hydrocarbon solvents.
The Microscal Flow Microcalorimeter is a very sensitive de-vice for measuring heats of adsorption or desorption as a solu-tion is pumped through a bed of adsorbent, in our case a bed ofaboul 150 mg of iron oxide powder having a surface area of abouti0 m /g. The unit is calibrated by a resistance heater whichgenerates heat in nearly the same location as the surface of thepowder; we find the calibrations are only valid when the bedsize is kept within a certain range. Several other variablesin the operation of the calorimeter also had to be explored toensure that the observed heats of adsorption do not include anyadventitious effects.
The effect of trace water on the adsorption of pyridine outof cyclohexane onto iron oxide powder was studied in much detail.This was a very necessary part of the overall investigation be-cause the oxide, the cyclohexane and the pyridine always carrytrace moisture and the adsorption results are quite differentdepending upon the degree of dryness. We have chosen to con-trol the moisture content by drying the oxide in a vacuum oven,by drying the pyridine and the cyclohexane over molecular sieves,
-79- pm NO pAalB hION fl i4a

and then measuring the ppm of water in the cyclohexane using theKarl Fischer reagent. Powder placed in the calorimeter is alsocapable of being dried by a vacuum pump to about one torr (4%R.H. at 250C). The drying and handling of the solvent requiredconstruction of an all-glass liquid handling system and the fill-ing of ampoules through septa to facilitate solution preparation.We now have a system capable of dispensing the cyclohexane car-rier solvent with a water content of 10 ppm to saturation (99.6ppm at 250C) (2].
It was expected that the iron oxide surface would tend toadsorb both water and pyridine and that there would be a compe-tition for the acid sites leading to less pyridine adsorptionat higher water contents. Figures 1-3 are recorder traces fromthe calorimeter run for decreasing water contents. Note thatthe curves presented in Figures 2 and 3 were run on a more sensi-tive scale so these areas cannot be directly compared to theareas in Figure 1. The enthalpies of adsorption calculated from
SI these curves are 72, 40 and 52 millicalories (per 150 mg of ironoxide) for Figures 1, 2 and 3, respectively. We will addressthis apparent anomaly at a later point in this discussion.Figure 1 shows the results obtained without drying either theoxide or the cyclohexane; the adsorption peak is complete inabout 5 min and the desorption peak is of equal area; the de-sorption takes little longer than the adsorption process. InFigure 3, the adsorption is seen to be much slower for this low-est water case. The desorption rate is much more dependent uponthe water content, as evidenced by the decreasing area of thedesorption peak as compared with the adsorption peak. In Figure3, only 67% of the pyridine is desorbed in 30 min as compared to97% of the pyridine in Figure 1, indicating a much strongerinteraction occurs between pyridine and the oxide when lesswater is present.
Equilibrium adsorption isotherms were also determined insome detail as a function of water content. In our prior workusing Fe0 4 , ampoules of weighted iron oxide powder that had beenprevious y-dried and stored in a desiccator were contacted withundried cyclohexane solutions and tumbled for two hr to achieve"equilibrium" adsorption at two controlled temperatures (250Cand 450C). The pyridine remaining in solution was assayed byultraviolet light absorption at 252 nm. Results for pyridineadsorption on Fe304 using this procedure are presented inFigure 4, where the adsorption is plotted as the straight-lineLangmuir isotherm:
C 1 Cr' rK rM m
In this equation, C is the bulk concentration (moles/m3), r isthe surface concentration (moles/m2), r is the total surfaceconcentration of "adsorption sites", anW K is the equilibriumconstant for adsorption:
-80-

04)0
CA0
100
000 1
L.0
2 U0W'0
4
0L 00a) a0
0
00'j
(a 0 M
1.44
0%

04.)
m u0
4a) '-
0 00
8~ 4f)
LL ~ m 040r%(a 000 4-w0
4J$. (
L^ ~ 0 00 -- f
8~( 4J4
00
- OJQ.
0
4A 4 V 4J
.H
CD It-
-82-

0
OO. 0
.4
,, 0 r0 4J
(A,"000 w
0 o
41Q~
4
'.4
o 1
- 14 0'
(L"
-83-

20
ADSORPTION OF PYRIDINE FROM CYCLOHEXANE
, ONTO FE304
X, HEAT OF ADSORPTION -8.8 KCAL/MOLE
AREA PER PYRIDINE 87 R2
1110
0 0 C 10 MOLES/M2 20
Figure 4. Langmuir isotherm for adsorption of pyridinefrom cyclohexane onto iron oxide powder.
-84-
K c(r-rm) (2)
The straightness of the lines shows that all sites bind pyridinewith equal energy; this means that all of the adsorption sitesare of equal acidity. Such is not always the case; in some ofour other studies with silica surfaces using Cab-O-Sil and HiSilthere is a distribution of surface acidities which is moremarked with Cab-O-Sil, a surface only partly covered with SiOsites. Iron oxide surfaces are known to be more thoroughlycovered with FeOH sites, as evidenced by the work of Micale onthis project, so it may not be too surprising that the surfacesare more homogeneous than silica. Heterogeneity in acidity ofSiOR or FeOH surfaces results largely from having some of theseacid sites close to others (vicinal) where they can form localhydrogen-bonds in which the acidity of the hydrogens is reducedby complexation with neighboring oxygens. The fact that this isnot observed with FeOH surfaces may result from denser surfacecoverage so that there are no isolated FeOH groups as are indeedobserved on SiOH surfaces by infrared studies. Another possi-bility is that since the acidity of FeOH surfaces is nearly twiceas strong as SiOH (as evidenced by heats of adsorption), theoxygens of the FeOH sites may be too weakly basic to form hydro-gen bonds.
The heat of adsorption can be calculated from the ratio ofthe intercepts at the two temperatures since the intercepts areinversely proportional to the equilibriu constant K for adsorp-tion, as shown in Equation (2).
Hads= 1TI2ln(K 2/K1 ) (3)T 2-T 1
As shown in Figure 4. the heat of adsorption of pyridine onFe304 is -8.8 Kcal/mole. Similarly, results for triethylamineadsorption onto Fe304 gave a straight line plot and a heat ofadsorption of -13.2 Kcal/mole. Considerable effort was spentto verify that these results could be duplicated using thecalorimeter. It was determined that good agreement could be ob-tained if dried cyclohexane was allowed to percolate through thepowder bed for 24 to 48 hr prior to solute adsorption. If thisprocedure was not followed, however, significant variability inthe heat of adsorption obtained using the calorimeter occurredwhich indicates that the state of surface dryness is an importantfactor in interpreting the results obtained in the flow calorimeter.
More recent studies have concentrated onan a-Fe 20 3 powdersince it is stable to oxidation while the Fe3O4 surface is not.Adsorption isotherms have been determined as a function ofwater content for iron oxide samples dried in a vacuun ovenand capped under a positive flow of dry nitrogen. The pyridine
-85-
solutions were injected through the septa and the samples werethen agitated for several days in a constant temperature bath.Results of these studies are presented in Figure 5. No effectof trace water in the range of 19 to 35 ppm was observed underequilibrium conditions. As previously stated, these variationsin water content of the carrier solvent did result in signifi-cant differences in both the rate and amount of pyridine ad-sorption under flow conditions. A similar study was done forundried iron oxide powder and significantly less pyridine wasadsorbed from solution compared to the dried iron oxide, as canbe seen in Figure 6. It was found that the degree of agitationwas important in determining the amount of pyridine adsorbed onthe undried powder while it had no effect when using the driedpowder. This is consistent with the existence of water bridges[3]between some of the iron oxide particles which effectively re-
* duce the available surface area for pyridine adsorption on theundried powder. Increased agitation facilitates the dispersalof water into the cyclohexane and thus permits additional sitesfor pyridine adsorption on the iron oxide surface that hadpreviously been blocked by water molecules.
Returning to the calorimetry work, the unexpectedly largeenthalpy observed with the undried powder can be interpretedas the summation of two different interactions: The pyridine-water interaction (water is more readily removed from the ironoxide surface when the pyridine solution is present) plus theadsorption of pyridine on the iron oxide surface. Viewing thedata on the pre-dried systems alone, it is apparent that acompetition does exist for the acid sites since, when a great-er water concentration is present, the measured pyridine inter-action is lessened. It is of interest to note that the surfaceenergy determined for the (oxidized) Fe 304 and the Fe203 sur-faces dried by percolation of dried solvent or by evacuationare quite similar with values of 80 ergs/cm2 and 83 ergs/cm2 ,respectively.
One very important consideration in this study is the con-tribution of the dispersion forces of the solvent and the baseto the adsorption process. We have therefore adsorbed pyridinefrom three dried hydrocarbons of differing surface tension:hexane(18.4 dynes/cm), cyclohexane(25.5 dynes/cm), and deca-hydronaphthalene(31 dynes/cm). The areas per molecule are notvery different: 48,48 and 51 92 per molecule, respectively.
The above findings on the role of trace water on the ad-sorption of pyridine onto iron oxide are interesting. The factthat the heat evolved per unit area is so constant for two dif-ferent iron oxides, that the heat per mole of pyridine adsorbeddecreases with added water, and that the rate of adsorption in-creases quite appreciably with more water present are most im-portant considerations in understanding acid-base interactionson iron oxide surfaces. The faster rates of adsorption suggestthat the adsorbed pyridine is present as pyridinium ions, forthe high surface mobility of ionic adsorbed layers is known to
-86-

I
10- A 19 ppm
.3 22ppmC 0 35ppmr,8 0
6-
m%. 4-cl) (n)w w
2 250c AOn2-, 45OC A
" 0,
0 10 20
C PYRIDINE CONCENTRATION(MOLES/UTER x 103)
Figure 5. Langmuir plot of the adsorption of pyridineon dried a-Fe203 at 250 and 45*C.
-87-

3
MOLESADSORBED
2-(xf
moles
*.-Ne2 1 predried (.35%/wt iou.
0 5 10 15 20 25 30
C CONCENTRATION OF 'Y'RI2INE (xIO') MOLES/UTER
Figure 6. Adsorption of pyridine from cyclohexane ontoiron oxide powder as a function of initialpowder wetness.
-88-

enhance rates of adsorption, and amines adsorbed on iron oxidehave been proved to adsorb onto iron oxide out of oil as ions[4]. We might therefore conclude that the presence of tracewater at the oxide surface has increased the degree of ioniza-tion of the pyridine-oxide acid-base complex. Such ionizationcould well have increased the area per molecule in the wetterfilm as observed. A direct measurement of ionization could bemade by contact potential differences [4]. If indeed ionizationis needed to get rapid adsorption, it is not surprising that in
our initial adsorption studies with oxygen bases and sulfurbases we found the rates of adsorption to be extremely slowcompared to nitrogen bases.
REFERENCES
[11 R. S. Drago eta al., J. Am. Chem. Soc. 93, 6014 (1971).
[2] J. H. Hildebrand, Solubility of Non-Electrolytes, 3rd Ed.,
Reinhold, New York, 1950, p.266.
[3] M. C. Coelho and N. Harnby, Powder Tech. 20, 197 (1978).
[41 F. M. Fowkes, J. Phys. Chem. 64, 726 (1960).
-89-

Program #6. Ion Exchange Properties of Iron Surfaces
INTRODUCTION
Electron spectroscopic techniques have potential in studiesof a number of aspects of adhesion of organic coatings to metalsurfaces. Surface analysis of metal substrates as a function ofsurface preparation can be used to determine the surface compo-sition that either favors or interferes with adhesive bonding.The results of analysis of surfaces that have been producedduring adhesive failures may be used to determine whether thefailure occurred at the interface or in one or the other of thetwo phases (i.e., in the surface oxide or in the organic film).Electron spectroscopic studies of the adsorption of simple or-ganic molecules may lead to quantitative measurements of theadhesive bond strength between specific functional groups andthe substrate surface. Of these possible applications of elec-tron spectroscopy to studies of adhesion we have chosen to useAuger electron spectroscopy (AES) and X-ray photoelectron spec-troscopy (XPS) for characterizing the possible sites on metalsurfaces that may be available for adhesive bonding.
BACKGROUND
All metals exposed to ambient environments have an oxidefilm on their surfaces. Furthermore, the surface of this oxidewill be hydrated to some extent from either exposure to atmos-pheric moisture or from previous immersion in aqueous systemsthat may have been used in surface preparation. Metal surfacescan be realistically considered in terms of an oxide film andits interaction with water as follows:
H H
10.
0 0 0 0/
?I I
0 0 0 0 0 0 0 0
2 3
-91- FmxDIuG PA= s ux-NOT n
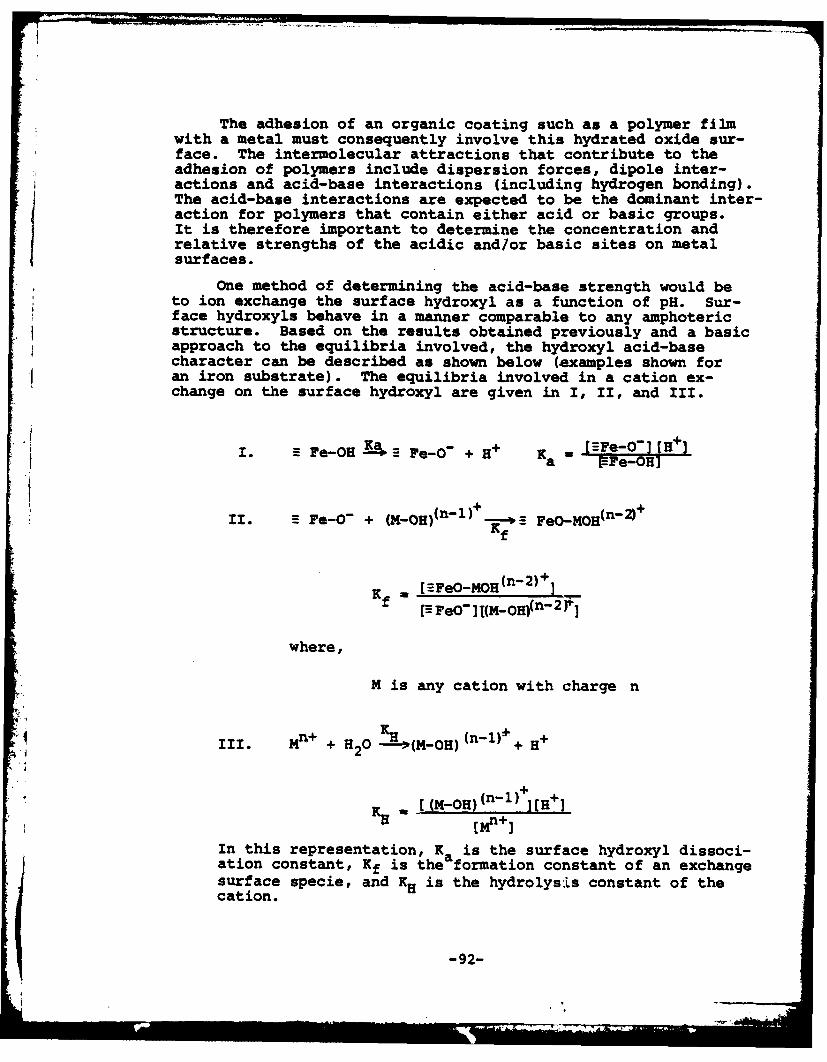
The adhesion of an organic coating such as a polymer filmwith a metal must consequently involve this hydrated oxide sur-face. The intermolecular attractions that contribute to theadhesion of polymers include dispersion forces, dipole inter-actions and acid-base interactions (including hydrogen bonding).The acid-base interactions are expected to be the dominant inter-action for polymers that contain either acid or basic groups.It is therefore important to determine the concentration andrelative strengths of the acidic and/or basic sites on metalsurfaces.
*One method of determining the acid-base strength would beto ion exchange the surface hydroxyl as a function of pH. Sur-face hydroxyls behave in a manner comparable to any amphotericstructure. Based on the results obtained previously and a basicapproach to the equilibria involved, the hydroxyl acid-basecharacter can be described as shown below (examples shown for
j an iron substrate). The equilibria involved in a cation ex-change on the surface hydroxyl are given in I, II, and III.
I. -Fe-OH Fe-O- + H+ K a -E!-O llH4a Fe-OH]
II. Fe-0- + (M-OH)K- ,,_,,,(n- Kf
Kf [FeO-MOH)(n-2)+
where,
M is any cation with charge n
*1 III. Mn + + H2 0 K H (M-OH) (n-)"' + H+
[Mn+]
In this representation, Ka is the surface hydroxyl dissoci-ation constant, Kf is the formation constant of an exchangesurface specie, and KH is the hydrolysis constant of thecation.
-92-

The overall reaction of the surface hydroxyl with acation is:
IV. FeOH + Mn + + H20--*FeO-MOH (n-2)++ 2H+
I Then
[-FeO-MOH (n-2 )] H+-
2
V f [M+n] [-Fe-OH]
Let - No = Total number of sites
N E [Fe-OH] + [-Fe-O-] + [-FeO-MOH(n - 2)]0
[Fe-MOH (n-2)+].1Define: O6 N0
Theta (6) is the fraction of exchanged surfaceI sites.
Rearranging V (assuming [-FeO- << [EFeO-MOH (n-2)])
VI. a f H [mnfl 6
[H+] +2 1-0
Simplifying VI,
VII. Log{KaKfK[M 1} + 2pH = Log 1-6
Under the assumption of no cation hydrolysis:
VIII. Log{KaKf[M + h I } + pH = Log
-93-

The extent of the surface exchange reaction is readily ob-served by AES. Samples prepared across the range of pH arestudied with Equations VII and VIII as models of the expectedbehavior. Application of VII and VIII to the results will leadto estimations of the acid-base strength.
The theoretical coverage (6) can be expressed in a formwhich allows the prediction of (6) as a function of pH.
-- -O n-FeO-MOH (n- 2)+
N o [ =FeOH]+[ Fe-O-]
where
[-FeO-MOH 2] [-FeO-]
Then 8 1= 3([H+J /ka+1
[=Fe-O-]
The form of 8 vs pH is plotted with an assumed pKa = 9.0(Fig. 1), as a demonstration of the expected pH dependence ofthe surface hydroxyl-cation exchange reaction.
Exchange of the surface OH is also followed by the oxygen(1s) photoelectron line. By noting the amount of OH present oneach sample, the amount of K can be related to the n.-ber ofsites present for reaction. From early studies it has beennoted that the amount of OH on the surface increases with immer-sion in solutions with increasing pH.
EXPERIMENTAL PROCEDURE
Samples were prepared following a procedure as outlinedbelow. Mild (1010) steel coupons (6 mm x12 mm xl mm) weremechanically polished under flowing water to a final aluminagrit size of 0.3 um, followed by a rinse with 3X distilledwater. Each sample was rinsed with ethyl alcohol, dried, andthen transferred directly to a 250*C oven for - 30minutes. Theoxidized specimens were cooled for - 2 minutes and then placedin potassium hydroxide solution. These solutions were preparedfrom fresh 3X distilled water and A.C.S. certified grade KOH.Individual volumes of this stock solution were adjusted for aspecific pH with 0.1M HNO3 (prepared from fresh 3X distilled
-94-
I I ll l II .. . lll' . .. ... . " '' - * "

:1I I I I I I I I 0
- V.
C. 00'II
U04~~o 41
I44 r.
044
Y. 00 0t 0
oo
I>
t5oO w'4
00wOD 0'
+ 41.0
0 .
0 04
e'3SV83AO3 a'
-95-
water and concentrated HNO 3 ). Potassium concentration in allsolutions was equal. Sample immersion times were 200 seconds,after which the specimens were carefully blotted dry and placedin a desiccator until mounted in the electron spectrometer(<2 hrs).
A change in procedure from the previous report has beenmade by switching to potassium exchange over calcium exchange.Hydrolysis of Ca + at pH's of greater than 10.5 made the studyof exchange difficult in the pH range where maximum exchangeoccurs.
Routine analysis of each sample included an Auger scan forthe K surface coverage along with an XPS survey scan and a highresolution XPS scan of the oxygen (1s) line for hydroxide/oxideratio determination.
EXPERIMENTAL RESULTS
Figure 2 is an Auger electron spectrum of a non-exchangedsample carried through the preparation as a control. Thespectrum shows the steel is oxidized and has no other surfaceelements to within the detection sensitivity of the instrument.The X-ray photoelectron oxygen (1s) line of the control sample(Fig. 3) displays the presence of two oxygen types on thesurface. The line with the lower binding energy is oxygen inthe oxide and a higher binding energy line is attributed tohydroxyl oxygen.
Figure 4 shows an AES spectrum of a sample exposed to apH= 11.2 potassium hydroxide solution. The large potassiumsignal at 250 eV is due to potassium that has undergone ex-change with the surface. The O(ls) photoelectron line for thissample (Fig. 5) indicates an increase in the hydroxyl line com-pared to that of the control, Figure 2. The change in thehydroxyl line may be due to hydration of the exchanged cation,or increased hydration of the oxide surface at higher pH's.
I
*The ratio of potassium Auger electron signal to the ironAuger electron signal, K/Fe,is plotted as a function of pH inFigure 6. The increase in potassium at the high pH values issimilar to that expected for K+ exchange with the surface hy-droxyls, cf. Figure 1. This increase in exchange in the pHrange 10-11 suggests that the pKa for the hydrated iron oxideon steel has a value of z 10.8.
The results described above were obtained for a "clean"specimen. Auger analyses of most specimens, however, haveshown the presence of other elements in addition to those iniron oxide. A spectrum of a specimen that was exposed to K
+
-96-

0
.44
00
w0z
004
4
0 U14)
w a
3P/NP
-97-

P-4
0
)4.IJ
w U)
0000o-LIJ4w
w X)00 410
f-l
z 0>1
".4
)U
xx0
4
(N
-98-
ANN...;

S AD-AI09 606 LEHIGH ,INIV BETHLEHEM PA CENTER FOR SURFACE ANO COA-ETC F/0 11/33 CORROSION CONTROL THROUGH A BETTER UNDERSTANDING OF THE METALLI-ETCIU)
UCNOV 81 H LEIDHEISER, E M ALLEN, M S EL-AASSER N00014-79-C-0731,)NCLASSI[FIEOD
I mmmmommrnmuri~ i fflfflfl l l /flfll
*EhEEI//M/EEIIINfNEII
I .llllflflfIlffllfElEEEElhllhlhI

HI 1.0 ' 111111.5UIII III6
S.W 1.5 , _ III _IIII1
11111_L15
MICROCOPY RESOLUTION TEST CHARTNATIONAL UR[AU OF STANDARDS lq6i A
U .

w
0
0 w
~1>
-JI
z0O *
Ill-I
N
0
w01
=P/NP
-99-

ad
LUU
LU C40.4J -
go0
FA 4
194
Ilk
-100-

44ww 00
00o 0
-P-
CL 4J
C.. 4)"94
(D04J
r4)

at a pH of 11.3 is shown in Figure 7, which shows C, S, Cl, Nin addition to K, 0 and Fe. Carbon was the most often en-countered extraneous element.
Once a procedure has been established for the preparationof reproducibly clean samples, studies of the interaction ofthe surface hydroxyls with various organic functional groupsare proposed. Such experiments are of interest owing to theirpossible implication of the chemistry at a coating substrateinterface. Choice of the functional groups can be based on the
knowledge of the surface pKa gained from the K exchange experi-ments. At present, several molecules are under consideration;all have been used in various studies of weak acids or hydroxyl-ated surfaces.
RI(a) RH2NCH2CH2NO2 + 2FeOH FeOH : N - CH2CH2NO2
H
XPS nitrogen (1s) binding energy shifts can benoted relative to -NO2 nitrogen allowing forinteraction strength study with various R groups.
Cl N-C
(b) =FeOH + FeO'- +
ClCl
(c) =FeOH + (CH3)3 SiNCH =NCH= CH Pyridine Fe-O-Si (CH3) 3
-102-
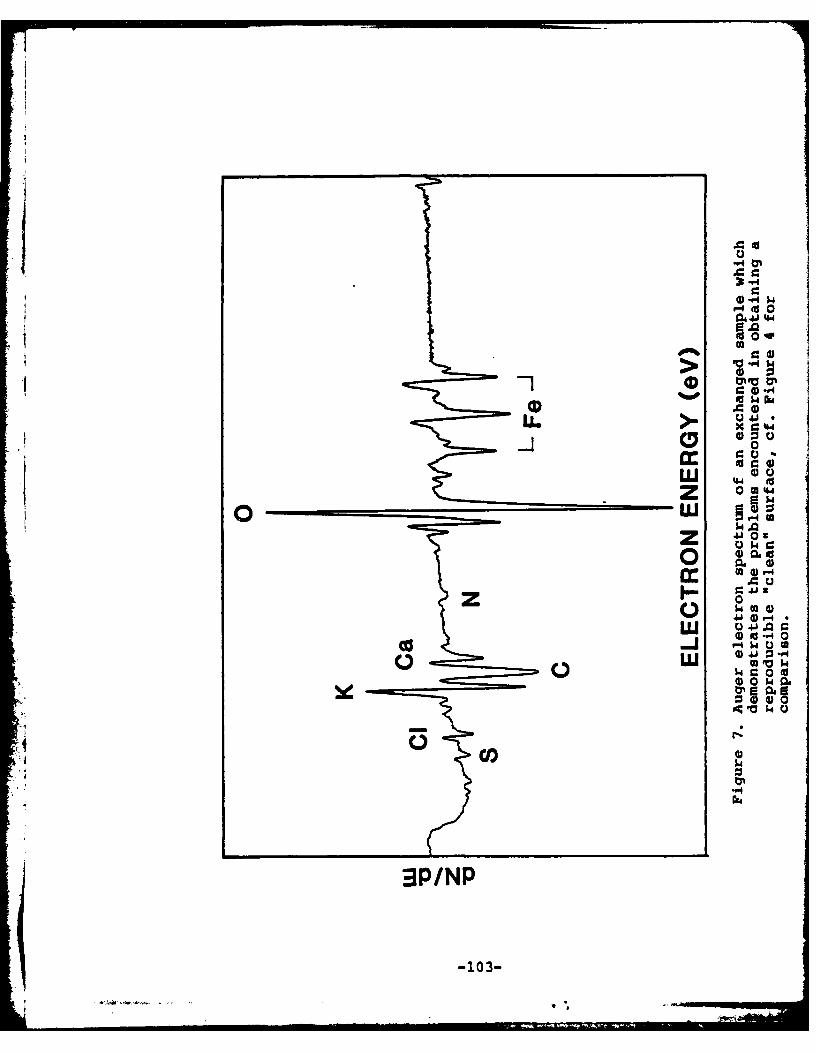
"4 .11 4.
~to 0
= 41"4
0
0OL 4) 0S'
41U-4 0o
0.4
r. 1 a1
-10 3-
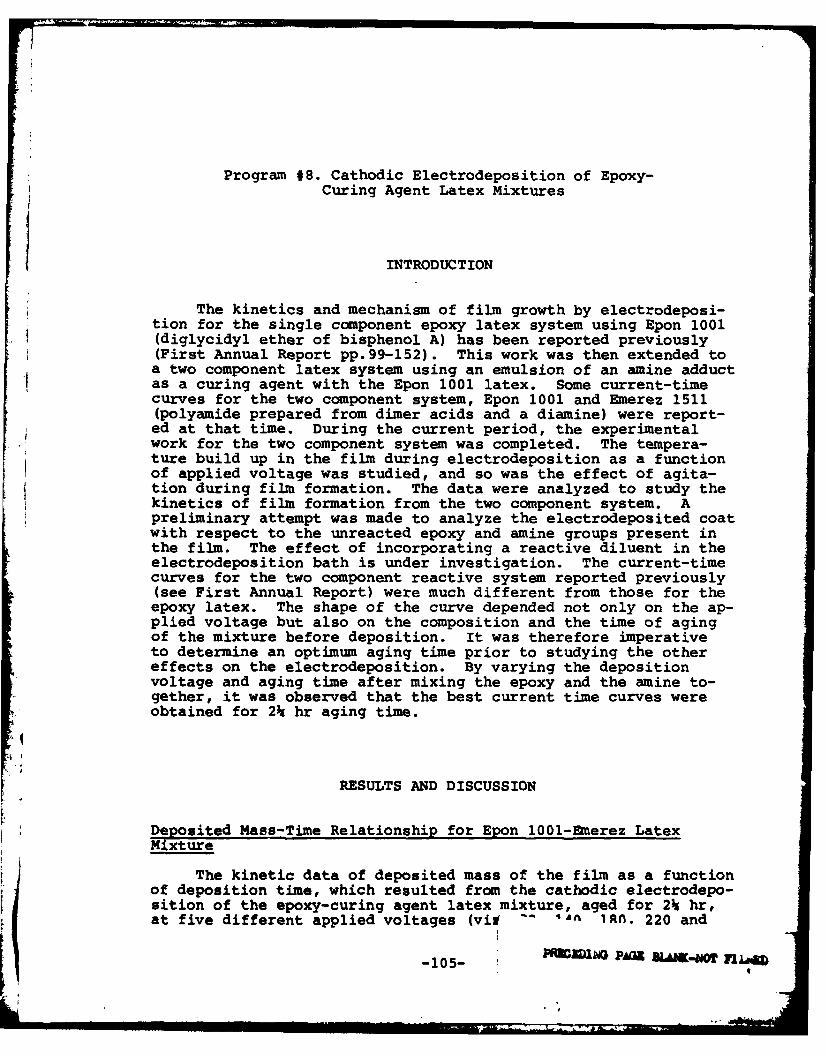
Program #8. Cathodic Electrodeposition of Epoxy-Curing Agent Latex Mixtures
INTRODUCTION
The kinetics and mechanism of film growth by electrodeposi-tion for the single component epoxy latex system using Epon 1001(diglycidyl ether of bisphenol A) has been reported previously(First Annual Report pp.99-152). This work was then extended toa two component latex system using an emulsion of an amine adductas a curing agent with the Epon 1001 latex. Some current-timecurves for the two component system, Epon 1001 and Emerez 1511(polyamide prepared from dimer acids and a diamine) were report-ed at that time. During the current period, the experimentalwork for the two component system was completed. The tempera-ture build up in the film during electrodeposition as a functionof applied voltage was studied, and so was the effect of agita-tion during film formation. The data were analyzed to study thekinetics of film formation from the two component system. Apreliminary attempt was made to analyze the electrodeposited coatwith respect to the unreacted epoxy and amine groups present inthe film. The effect of incorporating a reactive diluent in theelectrodeposition bath is under investigation. The current-timecurves for the two component reactive system reported previously(see First Annual Report) were much different from those for theepoxy latex. The shape of the curve depended not only on the ap-plied voltage but also on the composition and the time of agingof the mixture before deposition. It was therefore imperativeto determine an optimum aging time prior to studying the othereffects on the electrodeposition. By varying the depositionvoltage and aging time after mixing the epoxy and the amine to-gether, it was observed that the best current time curves wereobtained for 2 hr aging time.
RESULTS AND DISCUSSION
Deposited Mass-Time Relationship for Epon 1001-Emerez LatexMixture
The kinetic data of deposited mass of the film as a functionof deposition time, which resulted from the cathodic electrodepo-sition of the epoxy-curing agent latex mixture, aged for 24 hr,at five different applied voltages (vit ""' lAn. 220 and
-105- PRJWN& PAM BLAIK-Mo? F21

280 volts), were found to follow a linear function as shown inFigure 1. However, when the data were replotted against thesquare root and the logarithmic function of deposition time re-spectively, considerable scattering of the data points was notedand no obvious trend was observed as the applied voltage wasvaried. Thus, it could be seen that the data were best describedby a linear deposition time dependency as was already observed'in the single component system. According to Uhlig, ("Corrosionand Corrosion Control", p.156, John Wiley, 1963), this linearrelationship indicates that the presence of the film does notaffect continued film growth.
In contrast to the single component system, only one growthrate was observed for the entire deposition at low applied volt-ages, i.e., 90 and 140 volts. At higher applied voltages, i.e.,180, 220 and 280 volts, a change in the slope was noted at longerdeposition times indicating a transition to a more gradual filmbuildup after the initial steep rise. The transition to a slowerrate at longer deposition time could signify compaction of thecoating film and/or more crosslinking, after a certain coatingmass was reached, thereby slowing down the rate of further depo-sition. The initial growth rate was again strongly dependentupon the applied voltage. It varied from 1.28 xl0- 3 to 5.3 x10⁻³g/cm2 /sec; and as expected, higher film growth rates were associ-ated with higher deposition voltages. These rates were compara-ble to the initial film growth rates for the single componentsystem. The second slower growth rate at longer deposition timewas found to vary within a narrow range from 4.2 xl0- * to6.6 x10-4 g/cm2/sec in contrast to the single component systemwhere a constant value of 3.4 x10- 4 g/cm 2/sec was obtained. Theabsence of a transition to a slower growth rate at lower appliedvoltages could perhaps be taken as a lack of compaction of thedeposited layer.
The initial linear portion of the deposited mass versus timeplot for each applied voltage was found to pass through the ori-gin. This result shows that the film growth rate was directlyproportional to the deposition time, which would seem to be inagreement with previous observations by other workers on anodicdeposition of polymer resins where film deposition starts almostinstantaneously under constant voltage conditions. This is incontrast to the behavior of the single component system where aninduction time was observed. The two component system is compli-cated by the simultaneous occurrence of hetero-flocculation andchemical reaction of reactive groups at the particle surfacewhich would have a profound effect on the electrodepositionbehavior. Furthermore, a decrease in viscosity as a result ofhetero-flocculation could have altered the migration behaviorof these particles. All these could have contributed towardsthe differences observed between the two systems.
When the deposited mass per unit area was converted to filmthickness and the data plotted as a function of deposition time,a set of graphs similar to the mass deposited versus time plots
-106-

CA.00~ 00 2
>.6-I go0A GIbW
'3 '4
00
0 G-4 - S
0d2
00 0
0~4J J 0 (dM9~ 0 6-4
0 > 1-4
0 4 W.4 4
0 -0 54
0E 20
.,- .4J 4-)
0 u 041 0 c wA4. 0 r-4
:1 0 1 044 > 0 -4 4)
0~G 0 _ UC o~
N 0.
0 0V'44i
C 41 4
CA 0 0 w
0U OdN-4 4) t
0 P~~-4 10
-1 7-

was obtained. In each case, the initial linear portion wasstrongly dependent upon the applied voltage; the higher thevoltage, the higher the gradient, while the second linear por-tion had a somewhat constant gradient.
Coulombic Efficiency. The mass deposited per coulomb ofcharge passed for different deposition times at a given appliedvoltage is shown in Figure 2 for the highest and the lowestvoltages used, i.e., 280 and 90 volts, respectively. Theseexperimental data seem to fit a straight line passing throughthe origin. The gradient of these straight lines gives the
coulombic efficiency (in g deposited/coulomb), for the deposi-tion process. The data points for depositions at 140, 180 and220 volts generally fell between the lines obtained for thedepositions at 90 and 280 volts. The gradient of the line ob-tained for deposition at 90 volts is slightly less than thatobtained for the deposition at 280 volts, but the difference isI ~ rather small, and so for practical purposes can be taken asconstant. The average value for the coulambic efficiency thuscalculated for the two component system was 98.3 mg/coulomb,which is higher than those obtained for the single componentsystem (which was found to be in the range of 63 -85 mg/coulomb).
Effect of Current and Applied Voltage. From the current-time curves at each applied voltage, the current densities atvarious time intervals were calculated and plotted against time,as shown in Figure 3, for three different applied potentialvalues. Only the descending portion of the current-time curvesafter the maximum point "Y" on the current-time curves was con-sidered (First Annual Report, Fig. 48, p.113). These plotsshowed that the maximum current density for all the curves de-cayed towards a common residual current of approximately 7 mA/cm2
regardless of the applied voltage. This value is higher thanthat obtained for the one component system (ca. 3mA/cm2). How-ever, it is also evident from Figure 3 that there is a markeddecrease in current density with time for higher voltage, i.e.,280 volts, while this decrease is more gradual for the lowerapplied voltage, i.e., 220 volts. In other words, for depositionat higher applied voltage, there is a rapid current cut-off asthe film becomes insulating, while for a lower applied potential,the current cut-off is more gradual indicating that the film re-mains conducting for a longer time. Furthermore, for an appliedvoltage of 180 or less, after the initial rapid decrease in thecurrent density, a plateau region is reached, followed by a veryslow and gradual decrease. This might be the result of differentpatterns of deposition behavior under low applied potentials; and,perhaps, different film morphology.
The current density-time curves were analyzed according tothe treatment of Finn and Hasnip [J. Oil Color Chem. Assoc. 48,1121 (1965)] where the reciprocal of the inverse square of tl-ecurrent was plotted against deposition time, as shown in Figure 4.
-108-

4w rI40e4 >) 00
~ G0~ 0
4400 0 44 E
04) S4
01 E > 144 0 x s
U >0-4 0
0J 0% .x44 E 14) .)
0 > 41
4). 0
4)00.1 i
L^ ,-M v-4
0 Q~ *n 0
-.4 (4I@
0 0 )4
-0)4
-109-

60)
I(
40
E 0
E
S20
0 I ,0 20 40 60
time, sec.
Figure 3. Variation of current density with deposition timefor various applied voltages 180 volts (M), 220volts (A), and 280 volts (0), for stoichiometriclatex mixtures of Epon 1001 and Emerez 1511 agedfor 2* hr at room temperature before deposition.
-110-

140
70 "
4 00 20 40 60
time, sec.Figure 4. Reciprocal of square of current as a function of
deposition time for 180 volts (A), 220 volts (0),and 280 volts (0) for stoichiometric latex mix-tures of Epon 1001 and Emerez 1511 aged for 24hr at room temperature before deposition.
i -1II-

For the deposition at 280 volts, a straight line relationship isfound to hold indicating that the specific resistance of thefilm remains constant during the entire deposition period. Onthe other hand, a curve relationship was observed for depositionat lower voltages. The difference in the behavior of plots mayindicate differences in the mechanism of the film build-up underthe various applied voltages, and consequently differences infilm resistance.
The above analysis points out that two different depositionpatterns seem to exist; one-at low applied voltage <220 voltsand the second at higher voltages. The deposition patternshould reflect the chemical and physical nature of the coatingbath and the depositing film. It has been previously reported(S. Misra, Ph.D. Thesis, Lehigh University 1978) that, uponmixing curing agent latex together with epoxy latex, partialheterogeneous coagulation takes place between the smaller sizelatex particles (ca. 500AO) of the curing agent and the largersize (ca. 3000A*) epoxy latex particles to give larger globules.Chemical reaction between the epoxide groups and the curingagent will start immediately upon coalescence of the two com-ponents in the coating bath. Consequently, upon applying thevoltage in the coating bath, the deposition pattern will bedetermined by the following factors: (i) the relative mobili-ties of the various species (namely, epoxy particles, curingagent particles and aggregated globules of these two); (ii) thedegree of physical compaction at the cathode once depositiontakes place; and (iii) the degree of crosslinking as a resultof the chemical reaction between the epoxy and curing agentwhich takes place during aging and mixing in the coating bathas well as after the film deposition at the cathode. Thetemperature build-up at the cathode has to be considered, es-pecially its effect on the curing reaction which takes placeat the cathode.
It is suggested that at the lower applied voltage chemicalsegregation takes place within the thickness of the depositedfilm, as a result of differences in the electrophoretic mobili-ties of the different species in the coating bath. This mayresult in different degrees of physical compaction as well asdifferences in chemical composition across the film thickness.On the other hand, at higher applied voltages, perhaps the filmis more homogeneous both chemically and physically. Furtherstudy of the hetero-flocculation which takes place in the coat-ing bath prior to, and during the course of, deposition isrequired. Also chemical and morphological analysis of the filmduring the course of deposition must be conducted.
An attempt was made to calculate the field strength withinthe film during deposition. The field strength was assumed tobe equal to the applied voltage divided by the instantaneousthickness of the film. A plot of current density versus.fieldstrength for various voltages (see Fig. 5) indicates that asthe film thickness increases, both the field strength and the
-112-
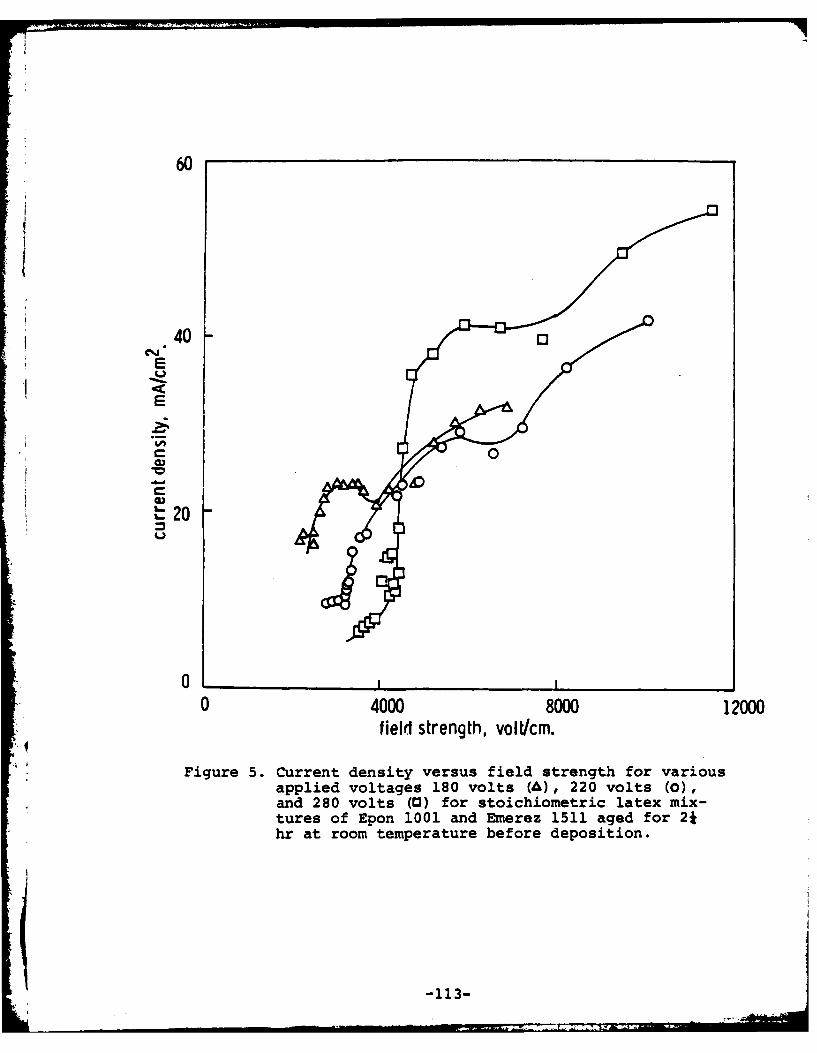
60
i
40 13
EoE
20
0 tI0 4000 8000 12000
field strength, volt/cm.
Figure 5. Current density versus field strength for various
applied voltages 180 volts (A), 220 volts (0),and 280 volts (0) for stoichiometric latex mix-tures of Epon 1001 and Emerez 1511 aged for 2*hr at room temperature before deposition.
-113-

current density decreases. This trend is somewhat similar tothat obtained for the one component system. No linear relation-ship between the current density and field strength was obtainedindicating that the current-time relationship was non-ohmic innature. The field strength operating in the electrodepoitionof latex system was found to be in the range of 3-11x 103 volt/cm.This range is about two orders of magnitude smaller than thosereported for gnodic deposition of solubilized polymer resins(i.e., ca. 10" volt/cm). The latex system requires less energyconsumption for electrodeposition.
Temperature Build-Up during Deposition. A thermocoupleprobe was placed very close to the test panel to record thetemperature inside the film as it was being formed. The responsefrom the thermocouple was recorded as a function of time and cur-rent as shown in Figure 6. The temperature build-up inside thefilm during electrodeposition was found to reach the maximumvalue within 5-10 seconds from the beginning of the depositionprocess. The maximum temperature attained within the film wasfound to increase with increasing the applied voltage. Table I
* gives the temperature data as a function of applied voltage.The maximum temperature reached 1000C for the deposition at 280volts. This high temperature build-up will have to be consider-ed in analyzing the morphology and the curing properties of the
* deposited films. This temperature build-up in the vicinity ofthe cathode should be very important in improving the "flow"required to give coherent film. This will be specially impor-tant in case of deposition of materials with higher molecularweight where their Tg values are higher than room temperature,such as the phenoxy compounds.
To study the effect of agitation, a small magnetic stirringbar was placed inside the cell with current and temperature-timedata being recorded as a function of applied voltage. Thecurrent-time curves obtained in this case were essentially thesame but the maximum temperature developed inside the film wasslightly lower.
Table I
Maximum Temperature Developed at the Deposited FilmAs a Function of Applied Voltage during the
Cathodic Electrodeposition Process
Applied Voltage Max. Temp. Recorded
280 volts 1000C
220 volts 810C
180 volts 580C
-114-
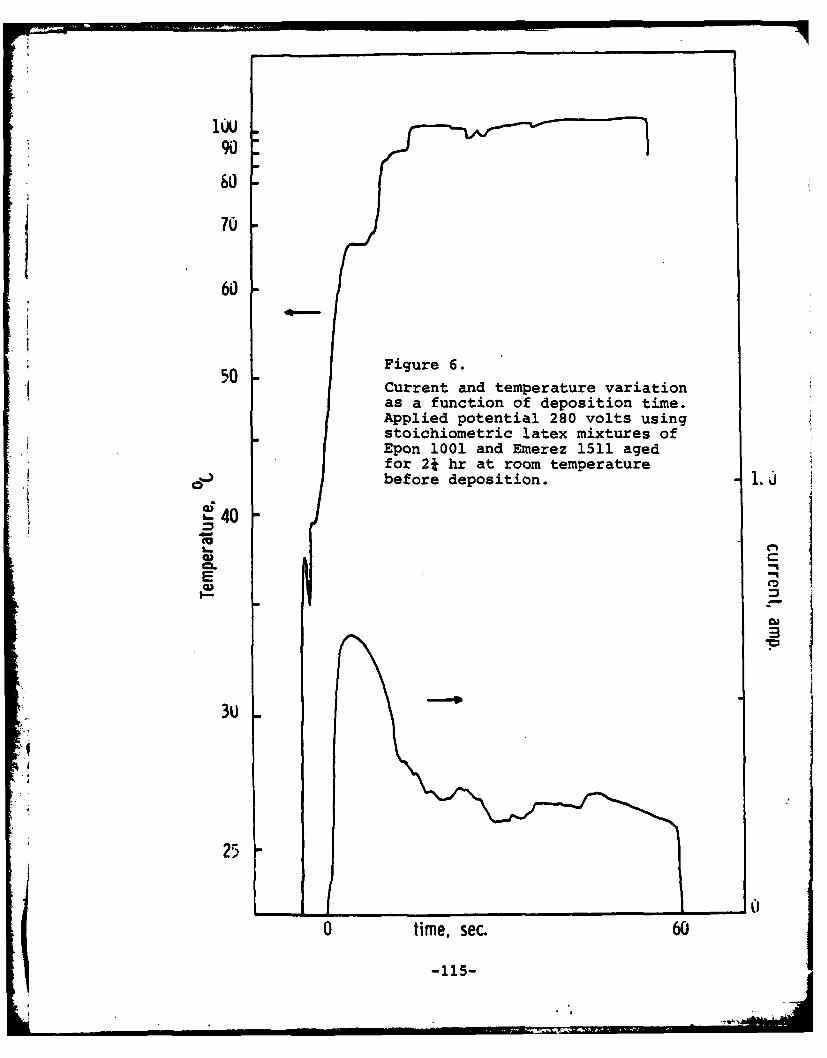
90
60
70
60
50 Figure 6.
Current and temperature variationas a function of deposition time.Applied potential 280 volts usingstoichiometric latex mixtures ofEpon 1001 and Emerez 1511 agedfor 2* hr at room temperaturebefore deposition. L
40
E -9
--"-
3U
25
,0
0 time, sec. 60
-115-

Epoxy-Amine Analysis. As shown in prev7ious sections, it isimperative to determine the degree of chemical heterogenietywithin the epoxy film during the duration of electrodeposition.Consequently an attempt was made to determine the unreactedepoxy and amine groups present in the film, by potentiometrictitration using a method outlined by Bell [J. Polymer Sci. 8,417-36 (1970)]. The procedure for epoxy groups involves the re-action with pyridinium chloride, followed by titration of theexcess pyridinium chloride with a standard base. The differencebetween the titer and a separate titer for the pryidinium chlo-ride alone is attributed to the epoxy content of the sample.The procedure for amine groups involves the use of carbon di-sulfide to convert the primary or secondary amine to the corre-sponding thiocarbamic acid, which is then titrated with thestandard base. In the combined method, the epoxy content ismeasured first and then the carbon disulfide is added, and thetiter for the amine is obtained.
Dried electrodeposited films of mixtures of Epon 1001 andEmerez 1511 latex mixtures were filed using a half-round,double cut file. One gram sample of the filed film was usedfor each analysis. In a round bottomed flask were pipetted
* !50 ml of 0.2N pyridinium chloride, 50 ml reagent isopropylalcohol and 25 ml distilled water. The filed sample was placedin the flask and refluxed for 25 minutes under continuous stir-ring with a magnetic stirrer. The solution was cooled to roomtemperature and poured into a standard 250 ml beaker, the pH ofthe above solution was around ca. 5.7. A standardized 0.5NNaOH solution was added in 2 ml increments until the increasingpH (near pH 7.0) indicated approach of the end point. By useof a microburet, 0.2 ml increments were added until the in-flection point in ml of NaOH added versus pH was reached (pHca. 10.5). At this point, 5 ml of carbon disulfide were addedwith stirring for 2 min before continuing the titration. Thetitration was continued by adding 0.2 ml of 0.5N NaOH every 2min until the amine end point was reached. The carbon disulfidereacts with the NaOH in high concentrations of sodium hydroxide,and this is the reason for recording the pH at constant timeinterval. The amine end point occurs between pH 9.5 and 10.5.The difference in ml of NaOH between the first and second endpoints is a measure of the amount of unreacted epoxy present inthe sample, while the difference between the third and secondend points gives the amount of unreacted amine present in thesample. The results of one complete titration, which includesblank, epoxy and amine end points, are given in Figure 7.
The preliminary results of the epoxy-amine analysis in thefilms deposited over a period of 60 seconds are given in TableII. These results indicate that the amount of unreacted epoxyand amine groups averaged over the total film thickness which iselectrodeposited over a period of 60 seconds is independent ofthe applied voltage. The aging time prior to electrodeposition
-116-

XI >1q9
__~~ x A C.i :
W P
01
44 r4 0
00 -H c
a.0
-117-

4J)~'I -I OD r. v0 A4
Q1 4 C; n A
iN 04 i IiD
0 ODOD C 0 0Ea 0 -1 u-I u-I C4 N
4IJ
0 r. rj
V-4 q" .Q *.* 1-1'
.0 rT a4 0 0- - .
go uw-I T-4 iN C4
0 -
in IA LO In U,
OC44 N N M 1
04d4 0 0 0 0 0r N r u-i 0 m~ m
CIA.O'. M N tN
th
A-I N A I

seems to have an effect on the unreacted epoxy content in thedeposited film as shown in Table II. This work will be ex-tended to determine the instantaneous film composition as afunction of deposition time and the applied voltage.
-19-
Program #9. Drying and Curing of Epoxy Films
The objectives of this work were: (i) to generate dryingcurves, under different drying conditions, for various formula-tions of epoxy-curing agent mixtures; (ii) to study the mecha-nism(s) of drying and curing of epoxy films.
The followi,.g mixtures of epoxy-curing agent werp studied:(i) Solvent-based Epon 1001 and Emerez 1511; (ii) Aqueous-basedEpon 1001 and Evnerez 1511 latex mixtures [Lehigh formula]; (iii)Aqueous-based modified Epon 1001 and Emerez 1511 latex mixtures[Lehigh formula (iv) Modified water soluble Epi-Rez 510 liquidepoxy resin and i ;i-cure W-50-8535 [Celanese formula]; and (v)Modified wacer soluble Epi-Rez 510 liquid epoxy resin and Epi-cure WC-60-8537 [Celanese formula].
During the past year the drying curves were generated undervarious drying conditions: relative humidity 10-52%; air veloc-ity 0-76 cm/sec, and temperature 25-40 0C. A chemical engineer-ing analysis of these drying curves has been completed.
A Master's thesis (by B. Aremu) has been completed and ac-cepted by the Department of Chemical Engineering. The thesisAbstract is as follows:
"The investigation of the effect of temperature,relative humidity and the flow rate of the drying airon the drying rate of latexes was carried out in anexperimental wind tunnel. The gravimetric techniquewas used to measure the evaporation rate of water andother volatiles from thin films cast from epoxy resin-curing agent systems on flat glass plates. The dryingair conditions were at°10.0% to 52.18% relative humidi-ties, 0.0 to 76.2 cm/sec air velocities, and 25.0°C to40.0 0C temperatures. The drying rates were calculatedfrom the weight loss that resulted from the evapora-tion of water and other volatiles and from the wetarea data under the assumption that evaporation oc-curred only from the wet portion of the film in theperiod during which experimental data were gathered.This assumption was necessary because of the limita-tion in the collection of data in the present experi-mental method.
"In general, the drying rates were observed to in-crease as the air flow rates and temperatures were in-creased and to decrease as the relative humidities wereincreased. Distinct drying behaviors were '--,,i toexist between the aqueous-based latex systs
-121-

solvent-based system, and the aqueuous-based solubilizedsystems. The drying behavior of the solvent-based sys-tem in this study appeared to be in agreement with thegenerally accepted drying characteristics of solvent-based paint films, i.e., the "wet" stage when thesolvent loss is fairly rapid and related to the vola-tility of the pure system and the "dry" stage. Thedrying rate (flux) for the solvent-based system rangedbetween 4.5 x 10- (g/cm2-sec) per g moisture contentS atthe beginning of the drying operation, and 0.5 x10(g/cm2-sec) per g moisture content at the end of theexperimental study. The aqueous-based latex systemsdisplayed a drying pattern characterized by an initialrelatively low and constant rate (in the range of l.Ox10-5 (g/cm2-sec) per g moisture content] followed by anincreased flux [order of 1.0 x 10- 4 (g/cm2-sec) per gmoisture content] as the drying operation proceeded.The drying behaviors of the aqueous-based solubilizedsystems were observed to be intermediate between thoseof the solvent-based and aqueous-based latex systems.
"An explanation of the reasons for the differencesobserved in the drying characteristics of the variouscoating systems based on the phenomenon of skin-formation is suggested."
Modification of Wind Tunnel
This work is being continued by Mr. A. Rahman with the fol-lowing objectives: to extend the drying curves to higher humid-ity (>50%) and higher temperature (>40*C); to characterize themorphology of the epoxy films dried under different conditions;and to initiate work on the rates of drying of pigmented epoxysystems.
In preparation for this phase of the work, the previouswind tunnel has been modified to improve the drying conditionsand increase sensitivity of measurements of temperature, airvelocity and relative humidity in the test chamber, as well asthe use of a 35 mm camera to record the wet/dry areas in thefilms during the drying process.
Accurate measurements of the changes in film weight, andreduction in the fluctuations in the specified parameters duringthe process of drying, are critical to any meaningful interpre-tation of data particularly while handling thin films, thedrying apparatus used previously (B. Aremu, M.S. Thesis, LehighUniversity 1981) is modified to further reduce the possibili-ties of fluctuations in the temperature and relative humidityof the drying air. The plywood control section has been re-placed by a 22 x6.5 x6 in. plexiglass air conditioning andmixing duct. The control section was divided into two sections:
-122-

the air conditioning zone and the mixing zone. The conditioningzone consists of a heater, and air and water vapor supply ducts.
them from the heat of the heater and to minimize the effect of
environmental conditions. The mixing zone contains baffles tomix air thoroughly before it enters the experimental tunnel.The baffles are arranged to turn the air twice around a hori-zontal axis and then twice around a vertical axis, when itfinally discharges through an orifice into the wind tunnel. Thisarrangement allows a thorough mixing of air to maintain uniformconditions throughout the wind tunnel. The start-up periodusually requires about two hr or more, but operating conditionsare steady once they are achieved. Figures 1 and 2 illustratethe system being used.
Other improvements in the experimental drying set-up andtechniques include the replacement of thermometers being usedfor determining the temperature with a set of more accurateones. Also, the anemometer for air velocity measurements isreplaced by a later model of the same type. The water reservoirof the wet bulb thermometer is shifted in the drying tunnel, sothat the make-up water supplied to the bulb should be at the wetbulb temperature with the result of reducing the dependence ofwet bulb temperature on air velocity. A single lens reflexcamera with a close-up lens has been installed on the testsection of the apparatus to take pictures of the drying film,for determining the wet area. A variable speed mixer with aglass rod is employed at a constant RPM to mix epoxy and curingagent for greater reproducibility of mixing and curing.
Currently experiments are being carried out to repeat someof the trials performed earlier, using the modified apparatusunder identical conditions of specific parameters for evaluatingthe effect of above-mentioned modifications on the drying ratesof epoxy resin-curing agent systems. Experiments will be con-ducted in order to generate rates of drying curves for the epoxy-curing agent systems to cover humidity ranges above 50% and thedrying temperature above 400C.
Work will be initiated to study the rates of drying offormulated pigmented epoxy-curing agent systems for corrosionprotection, and correlate the drying behavior with morphologyof coating films and efficiency of corrosion protection.
-123-

I
4i
Figure 1. View of the system being used for studying thedrying behavior of epoxy films.
-124-

M.W 4M.
.. .. . .-12..

Program #10. Detection of Aggregated Water in Polymer Coatings
INTRODUCTION
The detection of water within organic coatings is of interestsince corrosion under coatings is dependent on the presence ofwater. It may either exist as individual molecules randomly dis-persed in the coating (mobile water) or as aggregated "drops"throughout the coating or at the coating/substrate interface(aggregated water). Of special interest is the aggregated formwhich may eventually lead to corrosion and coating failure. Thedifferentiation and location of these two forms by some analyticalmeans would be very useful in studying the corrosion process undercoatings.
The technique that has been selected for initial examinationis the dielectric response over a frequency range. Aggregatedwater will react differently to an applied alternating electricfield than will an isolated water molecule. The location of thewater aggregate will also determine to some extent the dielectricresponse. Because water is such a small molecule, no appreciablechaige in the dielectric value occurs until the giga-hertz region(10' c/sec) is reached. Direct frequency measurements in thisregion become experimentally difficult. The high frequency di-electric response, however, can be obtained in an indirect mannerby a technique called Time Domain Spectroscopy (TDS).
Time Domain Spectroscopy-Basic Theory
As mentioned, high frequency measurements become difficultusing direct frequency measurements. One can, however, ascertainthe same information using a time variable or time domain tech-nique. In a time domain measurement the system is perturbed andthe response in time is monitored. With time domain informationthe frequency response can be obtained using a mathematical trans-form. In this case the transform (commonly called the FourierTransform) process involves a redistribution of the informationfrom the time to frequency domain.
The time domain response in TDS results from the applicationof an electrical pulse to the system under test. A typical TDSpulse has an extremely fast rise time (20 x 10-12 sec) and re-quires specialized equipment in order to monitor a response. Thesample under test is usually placed in a coaxial line which con-strains the pulse. When the pulse travels down the coaxial lineand encounters a change in dielectric permittivity (sample), it
- 12 7- JH W = NG P A W D - NOT P "44 0
is partially reflected and partially transmitted. The size andshape of the reflected pulsd are the time response of interest.The reflected pulse is mathematically combined with the inci-dent pulse to give a response function which can be related tothe frequency dependent dielectric response.
Perhaps the best way to understand a time domain techniqueis to consider the incident pulse as a combination of all fre-quencies delivered at once. Thus the reflected pulse containsthe response of all the frequencies brought about by the sample.The Fourier Transform process then allows the sorting out of eachfrequency response. The ability to measure high frequencies withthis method requires that a very small time scale be used whilein the time domain. Details of how these measurements will bemade are given in the next section.
IEXPERIMENTAL CONSIDERATIONS
At the present time there does not exist a commercial domain"spectrometer". Any research in this area requires the experi-menter to design and build an instrument based on several funda-mental components. A time domain spectrometer can be broken downinto three basic sections: data acquisition and processing, highspeed pulse measurement, and sample cell arrang.ieint. i: crip-tions of each section are given below.
Data Acquisition and Processing. Data acquisition and pro-cessing are actually two different functions; however, both arebest carried out by a computer. The data acquisition system hasseveral responsibilities. First, it must obtain the data incomputer-compatible form and store data for later use. Second,it must allow the experimenter to acquire data from differentsources and at different rates. Third, based upon data received,it must provide any feedback operations necessary for an intelli-gent data taking device. Data processing can begin once the dataare obtained and stored in the computer. All the mathematicalanalysis required can be performed at this time.
High Speed Pulse Measurement. Monitoring a TDS pulse re-quires sophisticated equipment. Fortunately such equipment isavailable commercially from several sources. The specific de-vice required is a sampling oscilloscope. A sampling oscillo-scope is much like a conventional oscilloscope but is constructedso as to permit very fast pulses and reflections to be recorded.
Sample Cell Arrangement. The arrangement of the sample cellis very important in TDS. Since the application of TDS to or-ganic coatings is new, experimentation with the method of sample
-128-

r
cell arrangement will be necessary. Thus it is very importantto insure the TDS system works properly before any such experi-mentation begins.
CURRENT STATUS
The effort to initiate TDS measurements commenced in thefall of 1980. A thorough literature investigation was madeand visits were made to Bell Telephone Laboratory in Murray Hill,New Jersey, to discuss the best components to use. The follow-ing system design resulted.
] Data Processing. The complex Fourier Transform will becarried out using the Lehigh computing center. Availability ofhigh level languages and mathematical subroutine packages makethe transform process manageable.
Data Acquisition. The real time nature of the data necessi-tate a dedicated microcomputer. A Rockwell International AIM-65microcomputer was chosen for its flexibility and superior micro-processing capabilities. Actual interface electronics have beenbuilt and the design and writing of appropriate software has beeninitiated.
High Speed Pulse Measurement. A Hewlett Packard samplingscope consisting of an 1817A remote sampler, 1815B sampler, 1106Btunnel diode pulse generator, and 180C mainframe scope were de-cided upon.
Sample Cell Arrangement. The sample cell in all likelihoodwill be of custom design and will be constructed. Appropriateconnectors and coaxial lines from GenRad will be used to transmitthe TDS signal.
Actual construction and assembly began in the early part of1981. At the present time the basic TDS system is near completion.The most difficult connection, that between oscilloscope and AIM-65, has been completed along with the successful reading andstoring of data from an actual oscilloscope trace. This connectionwas accomplished by constructing a general purpose interface panelwhich was then configured to the oscilloscope outputs. Along withthe interface electronics a computer card containing more datamemory, permanent program memory, and additional input/outputlines was developed and constructed.
Upon completion of the electronic interface details a seriesof computer programs for the AIM-65 were written. The programsperform a variety of functions which are required to obtain,I -129-

format, and store data from the oscilloscope. Presently underwayis the connection of the AIM-65 microcomputer to the Lehigh com-puter center via the phone line. Several high level data processing programs needed to perform the mathematical analysis havebeen completed.
Significant progress towards the successful design and con-struction of a TDS "spectrometer" has been made. It is antici-pated that the flexibility of the system will allow greater easeof experimentation with the sample cell arrangement and eventuallyin obtaining information which may lead to the detection andbetter understanding of aggregated water in organic coatings.
.1
-130-

TIME DOMAIN SPECTROSCOPY SETUP
TUNNEL
DIODECOAXIAL LINE
REMOTE
SAMPLER 8AMPLE
o AIM-65o MICROCOMPUTER
SAMPLING Q0SCOPE RECORDER I
FINAL OUTPUT OFLEHIGH COMPUTING CENTER
FREQUENCY RESPONSE
-131-

Program #11. Pigment-Binder Interactions inCorrosion Protecting Films
INTRODUCTION
Coatings based on zinc pigments are generally recognizedas being the most effective in protecting steel against corro-sion, e.g. in marine environments. Concentrations of Zn between85 and 96% are commonly used, the optimum concentration depend-ing on the binder [1-3]. Inert Fe-P alloys, e.g. FeP, mayalso be used as extenders [3,4]. While ordinary drying oilsare unsatisfactory as binders due to the formation of Zn soaps[5], plasticized or inherently flexible polymers such as poly-styrene, vinyl copolymers, chlorinated rubber, and epoxies aresuitable. In particular, polyamide-cured epoxies have been ofspecial commercial interest in the form of quick-drying formu-lations; also, the polyamide itself is believed to have an in-hibiting effect on corrosion [6]. With a given formulation, thepigment must be present at a concentration high enough to ensurepolarization resistance but not so high as to reduce cathodicprotection and minimize self-healing [1].
While the mechanism of protection is evidently complex [1-3],several major phenomena appear to be involved: electrochemical(cathodic) protection and the generation of inhibitive zinccompounds in the pores. The former is important because cath-odic alkali is necessary in order to precipitate the Zn compounds.While some researchers hold that these compounds protect by seal-ing the pores [1,2], there is evidence of specific inhibitionby deposition of these compounds on the steel substrate. Sincethe interfacial aspects of Zn-based coatings have received littleattention, we decided to examine the role of pigment-binderinteractions in more detail.
PREVIOUS LEHIGH WORK
In the previous report period, the adsorption of acidicand basic polymers on zinc dust was studied, several Zn-basedcoatings were studied, preliminary measurements of drying ratesand dynamic mechanical response were made, and preliminaryobservations of fracture surface morphology and of salt diffu-sion were made. It was shown that Zn dust appeared to possessacidic sites, and the kinetics of drying were established asa function of temperature.
-133- p pAW4 PA BL" M-
1~Q

During this period, our graduate student, Mr. M. Heffel-finger, resigned to take an industrial position at the end of1980, and Mr. A. Tiburcio (a graduate student in Chemical Engi-neering) joined us in June. Mr. Tiburcio has refined our tech-niques, and undertaken to complete the work begun on characteri-zation of the drying and curing stages, the morphology, and themechanical and permeability characterization. Having establishedbase-line properties, he will also begin studies of supportedfilms to obtain correlations between corrosion protection andfilm characteristics.
EXPERIMENTAL
" ' Film CompositionsThe formulation reported in a General Mills Technical
Bulletin [8] was used to make the 80% zinc-rich epoxy primer.Epon 1001F (Shell and Polyamide 1511 (Emerez)) constituted thebinder for this epoxy system. Zinc dust #22 (New Jersey ZincCo.; 8 pm in av. diameter). After mixing, films were cast on6" x6" Teflon-Coated glass plates using a #55 RDS coating rod.The films were allowed to dry for 24 hr at room temperature.This technique yielded flexible, undistorted films, 0.09 to0.12 mm thick, of excellent and uniform appearance. Curingconditions were varied as in Table II.
Solvent Retention
The rate of further drying was determined gravimetrically[9-11] using 2"x 3" specimens and was examined under dry andlaboratory atmospheres, and at both atmospheric and reducedpressures. Data for 3 specimens were averaged in each case;correction for variations in film thickness was negligible.
Differential Scanning Calorimetry (DSC)
Specimens were scanned in a DSC unit (Perkin-Elmer, modelDSC-1B) at a rate of 20°C/min to obtain glass transition tempera-tures (T ) and to look for evidence of incomplete curing [12].
Scanning Electron Microscopy (SEM)
Fracture surfaces were coated with an Au/Pt layer, and ex-amined using an ETEC SEM unit.
-134-

Table I
Formulation [8] of 80% Zinc Rich Primer
Ball Mill Base Fraction of Component in the Primer
Zinc dust #22 0.621(N.J. Zinc Co.)
Bentone 27 0.00631
Methanol 0.00291
Epon 1001 F (Shell) 0.101
Xylene 0.0951
Methyl Isobutyl Ketone 0.0388
n-Butanol 0.0573
Versamid Hardener
Versamid (Polyamide 1511; 0.0776Emerez)
Total 100%
Table II
Curing Conditions for Zinc/Epoxy Films
1. Room air (T = 24-28 0C)
2. Restricted access to air (T = 24-280C)(in desiccator with open valve)
3. Restricted access to air, but dry (T = 24-280C)(in closed desiccator).
4. Under vacuum (30 in of Hg) (T = 27-28.50C)
5. Under vacuum (30 in of Hg) (T = 380C)
6. Under vacuum (30 in of Hg) (T = 700C)
7. Under vacuum (30 in of Hg) (T = 880C)
-135-
RESULTS AND DISCUSSION
Drying Behavior
During the 24-hr pre-drying, an average of 13.4% (±1%) weightwas lost, in comparison with the theoretical limit of 15.5% fixedby the formulation. The drying behavior under the various con-ditions used subsequently is shown in Figures 1 and 2. Signifi-cant fluctuations were observed in the early stages of measurementof % weight loss, especially with the specimens dried at atmos-pheric pressure. Some variation was random, and in one case(condition 3) an initial increase in weight was noted (the causebeing unknown). Anomalies were noted in the early stages at 70and 880C in the vacuum drying experiments.
With drying at atmospheric pressure (conditions 1, 2 and 3),
data conformed reasonably well to a dependence on /t, where ttime, once steady-state drying rates were achieved (after -600and 1200 min for the closed-desiccator experiments). This de-pendence is not surprising, for the drying times are long enoughthat the drying process should be dominated by bulk diffusionrather than by surface evaporation [11]. However, a steady-stateconcentration of residual solvent has clearly not yet beenachieved. Extrapolation of the current data to zero solventcontent indicates times of 980, 1120, and 1170 hr for conditions1, 2, and 3. However, extrapolation of wt loss vs i/Vt suggeststhat no more than 0.8 to 0.9% could be removed at t = =. Theseestimations correspond to total solvent losses between 14.2 and14.3%, in good agreement wlth-the case of vacuum drying (seeTableIII). To reach the steady-state solvent loss obtained byvacuum drying (-14%, or 90% of the original solvent), from 30to 40 days would be required. As expected, evacuation and temper-ature both affect weight loss, though the behavior is complex.At 28, 38, and 700C a steady state is reached at -0.7, 0.9, and14 g wt loss, respectively. However, the behavior at 88*C isanomalous, the wt loss reaching only 0.9 g. Thus, at the high-est temperature, either the state of the polymer has been changeddue to changes in the degree of curing or in the crosslinkednetwork, or else the entrapment of solvent in the quickly curednetwork.
In any case, it is likely that up to 10% solvent may be re-tained, regardless of the rigor of drying. While the experi-mental error of -±1% (in absolute wt loss) implies that nearlycomplete drying (-15%) may have been obtained, the trend inTable 3 suggests that at least a few percent of solvent may beexpected. This is not surprising [11] and does not imply a del-eterious effect on properties, but obviously any comparison ofproperties must take into account residual solvent. Gas chroma-tography is a useful routine method for such characterization,and in addition would define the composition of residual solvent.
-136-
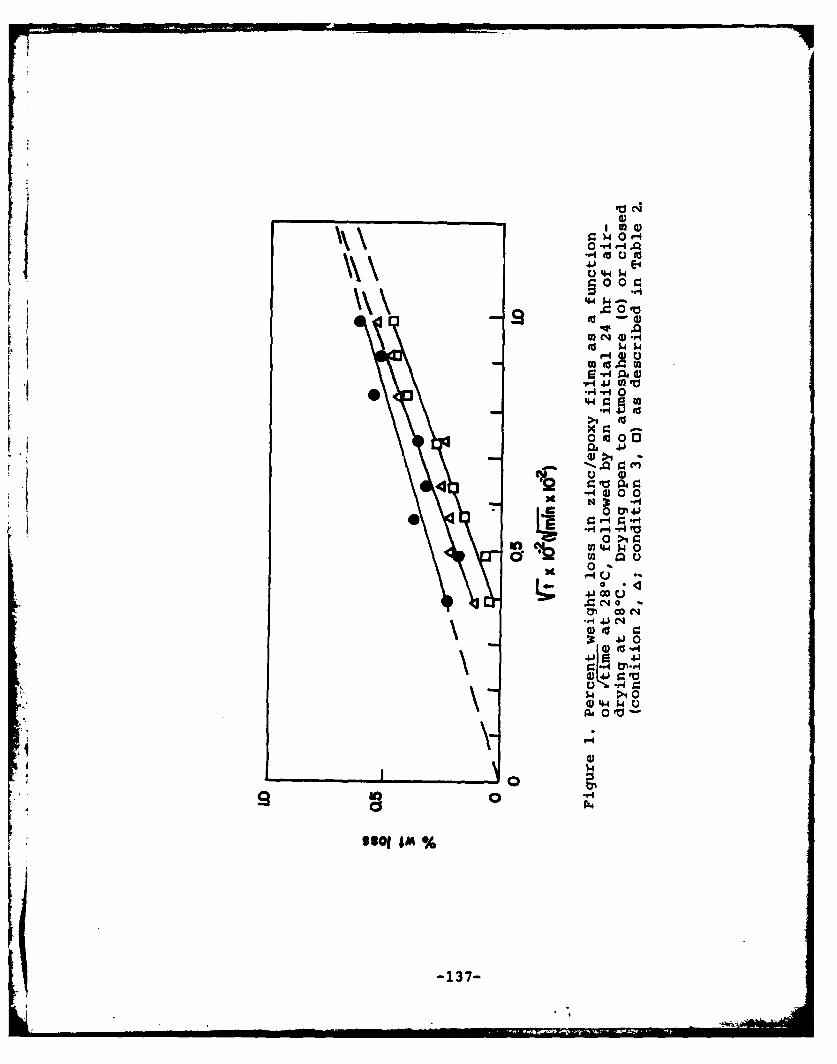
r. 0N-0 A ,-iIr a
044i 4
'I ~ 00.9
C4 N) a, *
r-4a,
41 0) U)-ri -4 ada
>1 4* W(a
x10
0 ad40
M N *M
0) 0 0'4
cl44 W-i0
0~
~ 0Goc. 04
ra44I9
41N 0
4J 4
A '- 0 r
$4i >1a,0 ~
00f
21101 4MA %
-137-

0 co '-0 IJW0
W 54 0
9 0 -r
44 $4f4J
x -V00 tou0 4 4 O
M 0 C44003 -4 *Ca
CA .r4 w
fto 0 4)4J 04
K 4J -l 44'WK
0 44
0k 0 Iq0o*00) 0 -cor.4
12 4'4 4 (N q
.54
rLD
33O~ $M
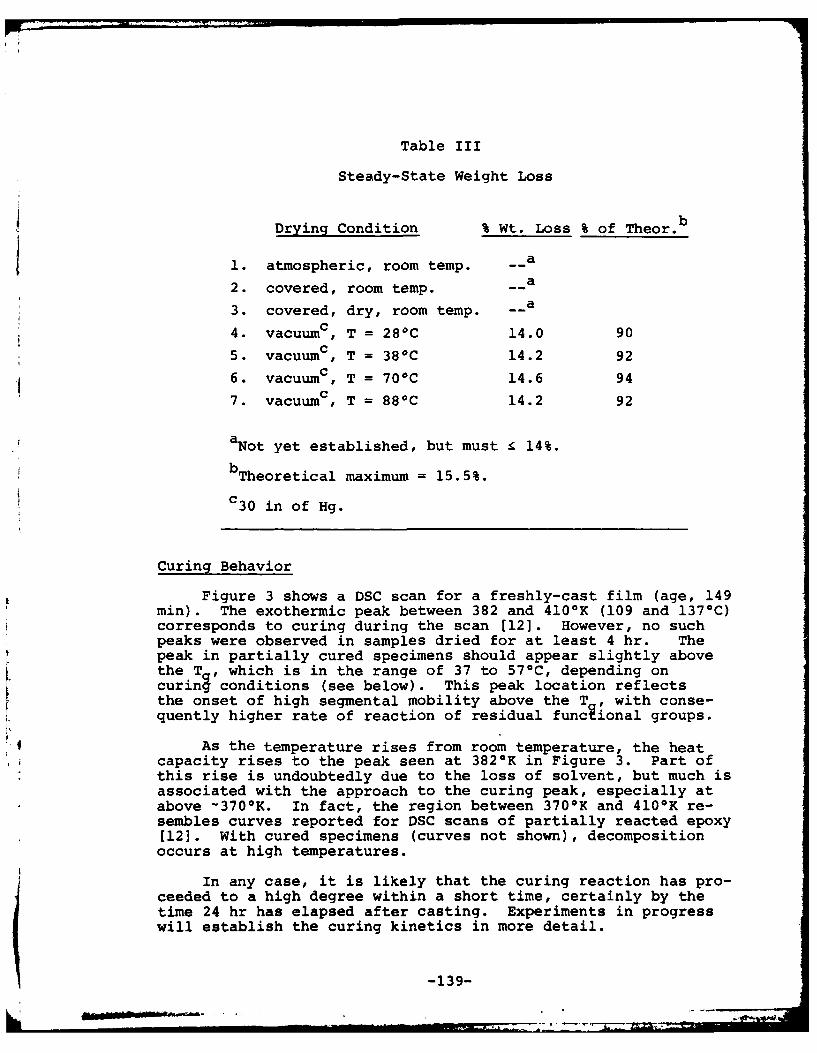
Table III
Steady-State Weight Loss
Drying Condition % Wt. Loss % of Theor.b
1. atmospheric, room temp.
2. covered, room temp. --a
3. covered, dry, room temp. --a
4. vacuum c, T = 28*C 14.0 90
5. vacuumc, T = 38*C 14.2 92
6. vacuumc, T = 70*C 14.6 94
7. vacuum , T = 88*C 14.2 92
aNot yet established, but must : 14%.
bTheoretical maximum = 15.5%.
c30 in of Hg.
Curing Behavior
Figure 3 shows a DSC scan for a freshly-cast film (age, 149min). The exothermic peak between 382 and 410 0K (109 and 137 0C)corresponds to curing during the scan [12]. However, no suchpeaks were observed in samples dried for at least 4 hr. Thepeak in partially cured specimens should appear slightly abovethe T , which is in the range of 37 to 57*C, depending oncurin& conditions (see below). This peak location reflectsthe onset of high segmental mobility above the T , with conse-quently higher rate of reaction of residual funcqional groups.
As the temperature rises from room temperature, the heatcapacity rises to the peak seen at 382*K in Figure 3. Part ofthis rise is undoubtedly due to the loss of solvent, but much isassociated with the approach to the curing peak, especially atabove -3700K. In fact, the region between 3700K and 410 0K re-sembles curves reported for DSC scans of partially reacted epoxy[12]. With cured specimens (curves not shown), decompositionoccurs at high temperatures.
In any case, it is likely that the curing reaction has pro-ceeded to a high degree within a short time, certainly by thetime 24 hr has elapsed after casting. Experiments in progresswill establish the curing kinetics in more detail.
-139-

.f44)4J
0
0
U 0
r4
-1400
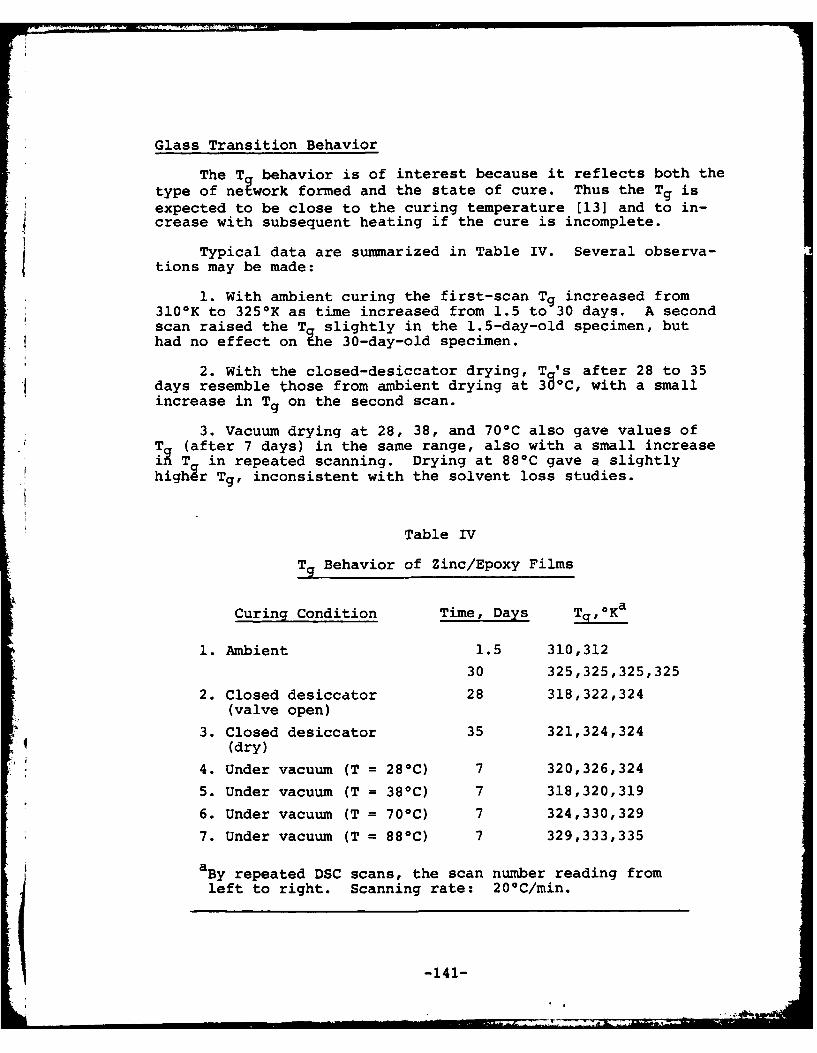
Glass Transition Behavior
The T behavior is of interest because it reflects both thetype of network formed and the state of cure. Thus the Tg isexpected to be close to the curing temperature [13] and to in-crease with subsequent heating if the cure is incomplete.
j Typical data are summarized in Table IV. Several observa-tions may be made:
1. With ambient curing the first-scan Tg increased from310 0 K to 325 0 K as time increased from 1.5 to 30 days. A secondscan raised the T slightly in the 1.5-day-old specimen, but
* 1had no effect on Zhe 30-day-old specimen.
2. With the closed-desiccator drying, T 's after 28 to 35days resemble those from ambient drying at 3 9-C, with a smallincrease in Tg on the second scan.
3. Vacuum drying at 28, 38, and 700 C also gave values ofT (after 7 days) in the same range, also with a small increaseig T in repeated scanning. Drying at 880C gave a slightlyhigher Tg, inconsistent with the solvent loss studies.
Table IV
T Behavior of Zinc/Epoxy Films
Curing Condition Time, Days TqoKa
1. Ambient 1.5 310,312
30 325,325,325,325
2. Closed desiccator 28 318,322,324(valve open)
3. Closed desiccator 35 321,324,324(dry)
4. Under vacuum (T = 280 C) 7 320,326,324
5. Under vacuum (T = 380 C) 7 318,320,319
6. Under vacuum (T = 700 C) 7 324,330,329
7. Under vacuum (T = 880C) 7 329,333,335
aBy repeated DSC scans, the scan number reading from
left to right. Scanning rate: 20°C/min.
-141-
These observations suggest that some variations in networkcharacter may develop, depending on the curing conditions. Theremay even be different curing mechanisms, depending on the temper-ature [15]. However, the trend towards an increasing Tg withincreasing temperature in the vacuum-drying experiments alsoparallels the trend in increased solvent loss (at least fortemperatures up to 700 C).
Morphology
Typical SEM micrographs of fracture surfaces are shown inFigure 4; the general appearance is similar for all films, whetherdried for 1.5 to 2 days under ambient conditions or dried for 7days under vacuum at 880 C. Several observations may be made:
1. Although most of the zinc particles are relatively smoothand featureless, some present a rough appearance with very smallparticles attached (Figs. 4a and b). It is not known if thereare impurities such as unslaked lime, which is added to a con-centration of 0.4% to minimize reduction of the binder.
2. While the binder portions show few pores (at least atthe magnifications used), small pores about 0.1 pm in diametermay be seen occasionally (see the lower left of Fig. 4a in thehole vacated by a large zinc particle).
3. In most cases, the pigment-binder adhesion is quite low,as shown in Figures 4a and b. Thus, even though earlier studies[14] showed a slight tendency for zinc to adsorb the Versamidcomponent, the net result is typical of a filler-matrix systempossessing a very weak interfacial bond. However, occasionalevidence for a higher degree of wetting and adhesion is seen, asin Figure 4c. The reason for the adhesion in this case is notknown, but must reflect a difference in -he surface chemistry ofthe zinc concerned. Clearly, characterization of the zinc sur-faces would be helpful.
Indeed, Figure 4c resembles a micrograph of a zinc/chlorin-ated rubber system exhibiting effective wetting [1], whileFigures 4a and b are similar to a micrograph of a zinc/poly-styrene system exhibiting poor wetting. Since the latter systemwas shown to be more effective in corrosion protection (at agiven zinc content) than the former, it was proposed [11 thatthe zinc particles bridge together more effectively with theformer case, so that the electrical resistance is significantlylowered. In addition, good wetting may hinder the formation ofcorrosion-inhibiting zinc compounds [21.
An interpretation in terms of acid-base interactions cer-tainly seems warranted. If acid-base interaction between apigment and its binder is high, dispersion of the pigment and
-142-

~Figure 4.
SEM micrographs of zinc-b epoxy primer films (80%
zinc). Micrographs aand b are more typicalthan c.
-143-

adhesion are both enhanced, whereas a low degree of interactionleads to agglomeration of the pigment and low adhesion. In fact,electron microprobe studies of the present system confirm a highlevel of clustering in the zinc particles. Also, adsorption ofresidual basic solvent (e.g. xylene) in preference to binder wouldtend to decrease interfacial adhesion.
While in most coatings good pigment dispersion and good
adhesion are desirable, in zinc-rich coatings these characteris-tics appear to be undesirable. Thus it will be of interest totry to maximize the agglomeration of the zinc. Further investi-gation of the binder/solvent system to minimize acid-base inter-action should confirm this hypothesis.
! CONCLUSIONS AND RECOMMENDATIONS
1. It has been shown that while curing of these zinc/epoxysystems takes place quickly, even under ambient conditions,some further curing may take place at elevated tempera-tures. Also, while drying takes place in a well-balancedfashion (a function of /t and temperature, at least up to700 C), considerable solvent (from 6 to 10%) remains. Inany studies of behavior, such retention should be charac-terized.
2. SEM micrographs confirm that pigment-binder adhesion isusually, though not always, very low. Further characteri-zation of the zinc surface would be desirable.
3. It is suggested that corrosion protection should be maxi-mized by minimizing acid-base interaction between the zincand the binder. Experiments are planned to test thishypothesis by varying the binder from acidic to basic (inan appropriate solvent).
4. Now that a baseline has been established for drying andcuring, research on mechanical and permeability behaviorwill be timely. Also, extension of research to includecorrelation of corrosion protection performance with filmproperties should be started.
-144-

REFERENCES
[1] F. Theiler, Corrosion Sci. 14, 405 (1974).
[21 T. K. Ross and J. Wolstenholme, Corrosion Sci. 17, 341(1977).
[3J V. P. Simpson and F. A. Simko, J. Oil Col. Chem. Assoc.56, 494 (1973).
[4] D. S. Newton and F. .G. Sampson, J. Oil Col. Chem. Assoc.48, 382 (1965).
[5] E. W. Horvick, Heat.,.Piping Air Cond. 42, 210 (1970).
j [6] H. Witcoff, Paintindia 14(5), 41 (1964).
[7] M. J. Marmo, M. A. Mostafa, H. Jinnai, F. M. Fowkes, andJ. A. Manson, I&EC Prod.' Res. Dev. 15, 206 (1976).
[8] Technical Bulletin 11-D-3, "Protective and DecorativeCoatings Based on Versamid Polyamide Resins", GeneralMills Chemical Division, 1963, p.19 .
[9] R. A. Scherzinger, Off. Dig. 32, 1197 (1960).
[10] R. E. Murdock and J. A. Carney, Off. Dig. 181(1961).
[11] D. J. Newman and C. J. Nunn, Prog. Org. Coatings 3, 221(1975).
[12] R. A. Fava, Polymer 9, 137 (1968).
[13] J. Gillham, Polym. Eng. Sci. 19, 676 (1979).
[14] J. A. Manson, in First Annual Report, this project, 1980.
[15] N. Levy, Org. Coatings Plast. Chem. 43, 485 (1980).
i
-145-
,~~~ ~ ~ ~~~ ,. ------_ -

Program #12. Electron Optical Studies ofOrganic Coatings
ABSTRACT
Studies have been conducted that show epoxies toconsist of primary microgels of 10-60 nm in size. Theseprimary microgels join together to form the secondarymicrogels which later interconnect to form the macro-gel exceeding as much as 0.5 um in size. The develop-ment of this crosslinked network has led to inhomo-geneities in the crosslink density. We believe thatthese inhomogeneities may serve as paths for the per-meation of corroding species.
Scanning electron microscopy with energy dispersiveX-ray spectroscopy was used to examine and analyze non-filled and Zn-filled epoxy films, and bulk glass beadfilled epoxy samples. These samples were derived froma variety of formulations and cured under various con-ditions. The films were cast on different substratesand subjected to an assortment of etching conditions.
Reqardless of any of the aforementioned variations,formulation, cure conditions, or etching treatment, thereults were the same. The area of epoxy in contactwith a surface was the most susceptible to attack by acorroding species.
Film samples of epoxy and polybutadiene derivedfrom cathodic delamination experiments were examinedin the scanning electron microscope (with an energydispersive spectrometer). The films showed regionaldifferences in concentrations of permeating ions. Trans-mission electron micioscopy was employed for the studyof epoxy thin sections. The use of this instrumentproved fruitless due to the problems of sample prepara-tion.
BACKGROUND
Extensive studies have been conducted relating the morphol-ogy of epoxies to their mechanical behavior (1-4]. Epoxies haveconsiderably lower tensile strengths than: -naths predictedby either primary bond breakage or van del.
-147-
Various experimental techniques have subsequently indicated mor-phological inhomogeneities that could explain these low tensilestrengths [6-10]. We believe that these inhomogeneities in apolymer film are related to the quality of corrosion control ex-hibited by that film. These differences or inhomogeneities inthe crosslink density may serve as paths for the permeation ofcorrodents in the initiation and propagation of corrosion.
Electron microscopic evidence indicates that epoxies havea primary morphology consisting of particles or microgels on theorder of 10 nm in size [111. These particles are formed duringthe initial stages of polymerization and interconnect to form20-60 nm aggregates. These network entities aggregate to formmacrogel particles sometimes exceeding 0.5 Um in size. Themacrogel particles are only weakly attached to the surroundingmatrix.
Two types of network structure have been observed [12]:regions of high crosslink density embedded in a low crosslinkdensity matrix or a low crosslink density region embedded in ahigh crosslink density matrix.
In addition to inhomogeneities in the crosslink density,the presence of microvoids must be accounted for when studyingstructure-behavior relationships [13]. The epoxy monomer presentin the partially cured thermoset resin may crystallize in micro-regions. The crystalline monomer may be suspended in a highermolecular weight matrix. Post curing can volatilize the monomerthus leaving microvoids.
Manson et al. has proposed a three-step mechanism for theformation of the microstructural network: formation of the pri-mary microgel, formation of the secondary microgel, and finallythe formation of the macrogel (Fig. 1).
During the formation of the primary microgel the reactingepoxy prepolymer diffuses to the nuclei of the curing agent.Throughout this process new nuclei are formed, giving rise to asize distribution of primary microgels (10-60 nm). After acertain concentration has been reached the primary microgelsand the growing nuclei join with each other to form the nucleiof the secondary microgel. The secondary microgel is not ascoherent as the primary microgel due to the new nuclei growingfrom the physical forces of a developing network and from thereaction of unreacted groups in the primary microgel.
The experimental gel point is observed at a critical solidconcentration where the secondary microgels pack together toform the macrogel. At this stage, phase inversion occurs wherethe secondary microgels become the matrix and the unreacted pre-polymer forms the dispersed phases. The coherence of the inter-connections of the secondary microgels determines the finalnetwork properties.
-148-
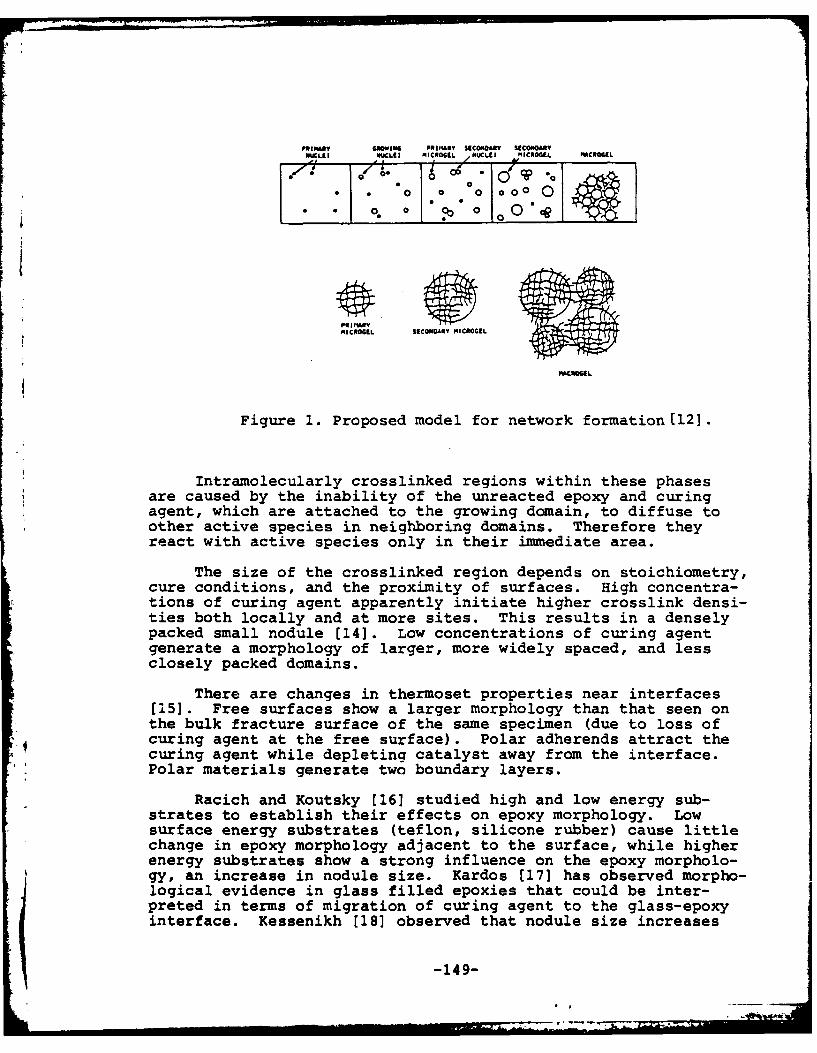
PRIMARY Gnu MIRN PRIMARY SECONOARY SECOROARYWAIL&I IKLI a ICROGL "NUCLEI MICROGIL MACROGL
0 a 0 0 00. 0 00 0 000. 4.
0
PR I 9ARYI CROGEL SCONDARY MICROGEL
MACROGSL
Figure 1. Proposed model for network formation [121.
Intramolecularly crosslinked regions within these phasesare caused by the inability of the unreacted epoxy and curingagent, which are attached to the growing domain, to diffuse toother active species in neighboring domains. Therefore theyreact with active species only in their immediate area.
The size of the crosslinked region depends on stoichiometry,cure conditions, and the proximity of surfaces. High concentra-tions of curing agent apparently initiate higher crosslink densi-ties both locally and at more sites. This results in a denselypacked small nodule [14]. Low concentrations of curing agentgenerate a morphology of larger, more widely spaced, and lessclosely packed domains.
There are changes in thermoset properties near interfaces(15]. Free surfaces show a larger morphology than that seen onthe bulk fracture surface of the same specimen (due to loss ofcuring agent at the free surface). Polar adherends attract thecuring agent while depleting catalyst away from the interface.Polar materials generate two boundary layers.
Racich and Koutsky [16] studied high and low energy sub-strates to establish their effects on epoxy morphology. Lowsurface energy substrates (teflon, silicone rubber) cause littlechange in epoxy morphology adjacent to the surface, while higherenergy substrates show a strong influence on the epoxy morpholo-gy, an increase in nodule size. Kardos (17] has observed morpho-logical evidence in glass filled epoxies that could be inter-preted in terms of migration of curing agent to the glass-epoxyinterface. Kessenikh [18] observed that nodule size increases
-149-

with the amount of dissolved foreign material.
Adhesion of a polymer to a substrate depends upon the re-striction of vibratory motion of the macromolecules near the sur-face [19]. Bascom [20] reviews the effects of adsorbed molecularspecies on the interfacial morphology. He suspects a reductionin molecular mobility (and the subsequent changes in properties)near rigid inclusions. The proximity of surfaces makes thesegmental mobilities of the polymer chains less homogeneous.The density at the interface of a film adsorbed on a surface isless than what it would be in the free state.
The decrease in vibratory motion creates a region of de-creased or restricted motion whose properties are different from
* that of the bulk. Kwei [21] and Kumins [22] deduced from waterdiffusion experiments the existence of a region approximately1000 A surrounding a filler particle; the epoxy polymer in thisboundary layer has significantly less molecular mobility than thatin the bulk.
RESULTS
Scanning electron microscopy(SEM) with energy dispersiveX-ray spectroscopy (EDS) was employed to study both the suitabili-ty of electron optical method and the susceptibility of epoxiesto permeating species. Zn-filled and non-filled epoxies, derivedfrom a variety of formulation and cure conditions, were prepared.These epoxies were cast on a variety of substrates. Bulk glass-bead-filled samples were also prepared. The film samples whichwere removed from the substrates, and the bulk samples were sub-jected to various forms of solvent and solution etching. In-cluded were solvent etching, Cr203 etching, and the Zn-filledepoxies were treated with HCI as well. Epoxy and polybutadienefilms cast on cold rolled steel and subjected to cathodic delami-nation were also examined. Transmission electron microscopy (TEM)was also attempted for some samples.
The epoxy samples were prepared from Epon 1001-F (solid,Shell Chemical) and Versamid 115 polyamide (General Mills), wherethe ratio of epoxy to polyamide was varied from 0.8 to 3.5(ratios = 0.8, 1.0, 1.5, 2.0, 2.75, 3.5). The epoxy was dis-solved in the equivalent weight of butyl cellosolve. The poly-amide was dissolved in 65% by weight of xylene and 35% by weightof butyl cellosolve. (Initially the epoxy was dissolved inmethyl isobutyl ketone, but it was discovered that the ketoneaffected the reactivity of the epoxy.) Non-filled, zinc-filled(8 pm diameter spheres) films, and bulk glass-bead-filled (40 Umaverage diameter spheres) systems were prepared.
The fracture surfaces of both the filled and non-filledsystems were observed under the scanning electron microscope (SEM),
-150-

Figures 2-4. In the filled systems the filler particles wereevenly dispersed throughout the epoxy. At the interface thefiller particles were found in higher concentration. This isdue to the settling of the filler from gravitational forces.The fracture surface showed that the epoxy encased the fillerparticles but was not bonded or very weakly bonded to thesurface. The fracture surface of the non-filled systems re-vealed nothing about the morphology of the thermoset resin.
I Fig. 2. Zinc particlesdispersed inepoxy.
Ii
Fig. 3. Glass beadsdispersed inepoxy (800X).
-151-

A *
Figure 4. Glass beads dispersed in epoxy.Glass beads were added 4 hrs afteronset of cure, as described later.Note region of filler exclusion(region E).
The filler particles were added at various times relativeto the curing of the epoxy. Some epoxy samples were placed inclosed containers and some samples were exposed to the atmos-phere during the curing process prior to the addition of thefiller. In samples, both film and bulk, where the filler wasadded at four or more hr after the onset of cure, SEM observa-tion of the fracture surfaces showed that there were regionsin the interior where the filler particles were excluded. Thereare factors to be considered in order to understand this obser-vation. First, in the exposed samples an increase in viscositydue to the loss of solvent through evaporation may have led toan inability of the epoxy-polyamide solution to wet the fillerparticles, thus preventing bonding to the epoxy matrix. Second,for both the contained and exposed epoxies, the onset ofpolymerization may have contributed to the exclusion of thefiller particles, due to the development of crosslinked regions.Thesemay have served as physical barriers for the filler.
It is believed, based on the following observation, that thelatter is the most responsible for the exclusion of the fillerparticles. A study was conducted concerning the consequences ofsolvent loss through evaporation during polymerization. Non-filled epoxies were formulated (noting the total weight) andplaced in closed containers to prevent solvent evaporation. After24 hr the result was a partially polymerized sample with no sol-vent loss (noting total weiqht). After a week it was evidentthat the epoxy had undergone additional curing. The samples were
-152-
then removed from the closed containers to determine the evapo-ration of the solvent from the cured epoxy. One month passedbefore the solvent had totally evaporated (determined by weightloss).
This study shows that a sufficient amount of polymerizationcan occur before a significant amount of solvent has evaporated.A significant amount may be interpreted as the amount of solventlost to evaporation needed to cause a high enough increase inviscosity to prevent the wetting of the filler particles.
Both the zinc-filled and the non-filled epoxies were caston various substrates, with film thickness varying from 20 to90 Um for the non-filled and 30 to 200 Um for the zinc-filledepoxies. The substrates used were aluminum foil, Teflon sheets,stainless steel, and cold rolled steel. (All substrates werecleaned and degreased by a preliminary wash with Alconox deter-gent followed by boiling acetone.) The epoxy was easily removedfrom the aluminum foil and the Teflon sheets. There was somedifficulty in separating the film from the stainless steel, butit was not possible to remove the films from the cold rolledsteel without damaging the film. Therefore the following studieswere on films cast on aluminum foil, Teflon sheets, and stain-less steel.
The zinc-filled films and the bulk glass-bead-filled systemswere formulated from epoxy to polyamide ratios ranging from 0.8to 3.5. They were cured at room temperature for 1-2 weeks.These samples were then etched using 1M aqueous solution of Cr203for 24, 48, 72, and 168 hr at room temperature and for 4-7 hrat 70*C. This solution preferentially attacks regions of lowcrosslink density. These samples were fractured at room tempera-ture and subsequent electron microscopic observation showed con-siderable erosion of the epoxy matrix (Figs. 5 and 6). The regionnear the substrate showed the most erosion and the interior of thefilm showed the least. This was confirmed for the zinc-filledfilms by EDS analysis, which showed the strongest Cr signal nearthe substrate, the weakest in the interior, and a somewhat highersignal near the free surface of the original film.
-Non-filled systems were treated and examined similarly.Non-filled systems which were post cured at 1200C for 24 hr werealso included. These films, cast on the various substrates,showed the same trend of Cr permeation. The differences betweenthe filled and non-filled systems were the magnitude of the Crsignal, the filled epoxy having a considerably stronger signal.Visual observation showed that erosion was greater in the filledsystem; the SEM revealed no appreciable attack by the etchingsolution on the non-filled samples (the substrate side showedsome erosion, Fig. 7, but it did not extend into the interior ofthe bulk epoxy).
-153-

A , ,- , -S
Figure 5. Zinc-filled epoxy etched for7 hr at 700C (600X). Area ofCr203.attack is at the top ofthe micrograph.
Figure 6. Glass bead-filled epoxy, etchedfor 7 hr at 601C (600X).
-154-

~Ik
Figure 7. Substrate face of non-filledepoxy after etching for 7 hrat 70*C (3000X).
There are two possibilities for the observed differencesbetween the filled and non-filled epoxies. There may be dif-ferences between the morphology or microstructure of the epoxyin the filled and non-filled systems. Also, there may bephysical differences on the macroscopic level. These differ-ences may include channels in the filled systems which mayallow transport of permeating species into the interior of thebulk epoxy. The SEM micrographs showed that the epoxy encasedthe filler particles, but was not bonded to it.
Another study of Zn-filled epoxies took advantage of thereaction, Zn + 2HC1 = ZnC12 + H2 . Zn-filled epoxies (epoxy topolyamide ratios were 2.0 and 3.0) were totally immersed in the0.5M HCl. Some samples were partially immersed, only the sub-strite side or the exposed side was in contact with the acidsolution. Sample treatment was for 24 hr at room temperatureor for 4-7 hr at 70*C. Using SEM-EDS analysis (with X-r:.y map-ping), it was possible to trace the permeation of the HC,through the filled epoxies by monitoring the X-ray signalsfor Zn and Cl (Fig. 8). The Cl signal was always detected inthe presence of Zn, but Zn was detected in the absence of Cl.Cl was not detected on the Zn particles, but was found in highconcentrations at the zinc-epoxy interface. In most cases theCl traversed a path from one Zn particle to the next; however,in some instances Cl appeared to accumulate in regions betweenthe filler particles. This study proposes the possible paththat permeating species may take in the failure of the filmand the subsequent corrosion.
-155-
dJ

Photo 1
Photo 2
Photo 3
Figure 8. Photo 1 of Zn-filled epoxy aftertreatment with 0.5M HCl. Substrateside is down. Photo 2, X-ray mapof Zn signal. Photo 3, X-ray mapof C1 signal.
Non-filled epoxies were subjected to solvent etching. Thesolvent used was butyl cellosolve and the epoxy filns wereformulated with epoxy to polyamide ratios of 2.0, 2.75, and 3.5.Samples were cured at room temperature for 24, 48, 168 and 336hr. Also, the samples were post cured at 120*C for 24 hr follow-ing the room temperature cures. These samples were then placedin the solvent for 24, 72 and 163 hr. These samples were thenexamined in the SEM. No characteristic morphology was observed(maximum magnification attained was 20,OOOX).
Following the solvent etch, the above samples were subjectedto a Cr203 etch at 70*C for 4-7 hr. SEM-EDS analysis indicatedsimilar trends in Cr permeation as reported previously for othersamples. The Cr signal was stronger throughout the fracturesurface, relative to those samples without the solvent etch. Insome of the two-to-one ratio samples, the substrate side wasvisually darker, and subsequent EDS analysis showed this regionto be very high in Cr.
Os04 stained samples were thin sectioned and observed inthe transmission electron microscope (TEM). Sodium oleate, aneighteen carbon chain with a double bond at the ninth carbon,was added at various times during the cure. It was hoped that
-156-
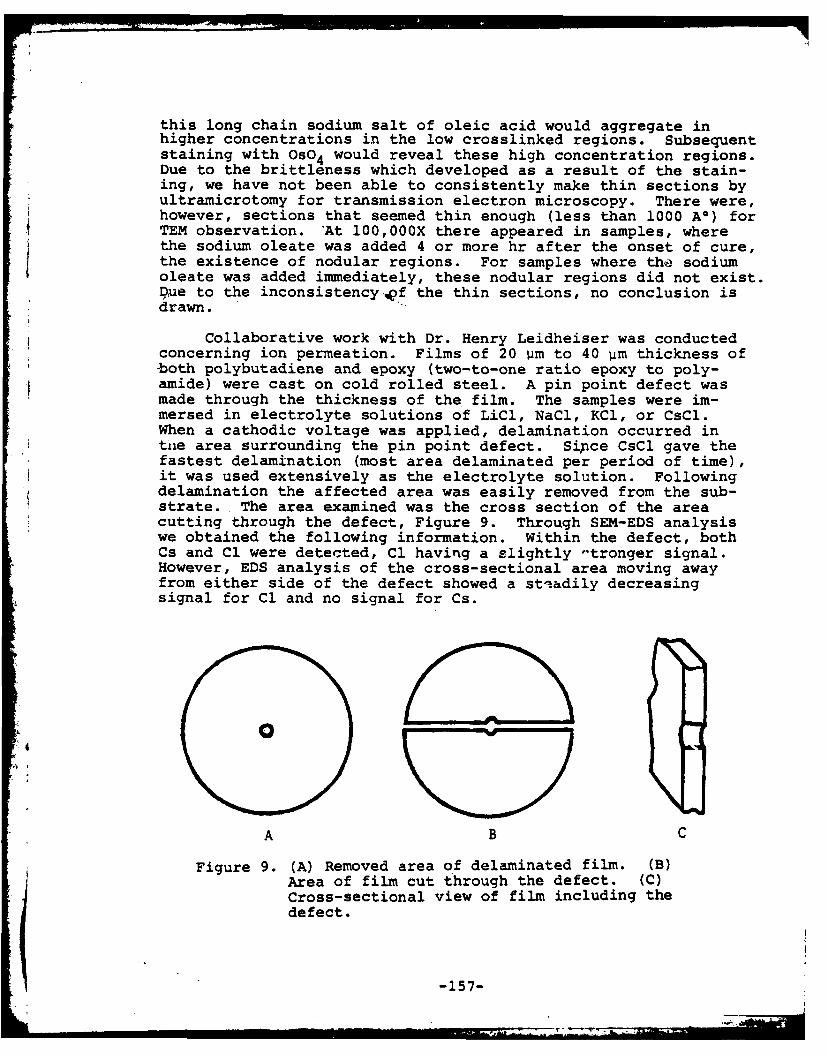
this long chain sodium salt of oleic acid would aggregate inhigher concentrations in the low crosslinked regions. Subsequentstaining with OsO4 would reveal these high concentration regions.Due to the brittleness which developed as a result of the stain-ing, we have not been able to consistently make thin sections byultramicrotomy for transmission electron microscopy. There were,however, sections that seemed thin enough (less than 1000 A*) forTEM observation. 'At 100,000X there appeared in samples, wherethe sodium oleate was added 4 or more hr after the onset of cure,the existence of nodular regions. For samples where the sodiumoleate was added immediately, these nodular regions did not exist.DPue to the inconsistency-,f the thin sections, no conclusion is
: , drawn.
Collaborative work with Dr. Henry Leidheiser was conductedconcerning ion permeation. Films of 20 um to 40 Um thickness ofboth polybutadiene and epoxy (two-to-one ratio epoxy to poly-amide) were cast on cold rolled steel. A pin point defect wasmade through the thickness of the film. The samples were im-mersed in electrolyte solutions of LiCl, NaCl, KCI, or CsCl.When a cathodic voltage was applied, delamination occurred intne area surrounding the pin point defect. Since CsCl gave thefastest delamination (most area delaminated per period of time),it was used extensively as the electrolyte solution. Followingdelamination the affected area was easily removed from the sub-strate. The area examined was the cross section of the areacutting through the defect, Figure 9. Through SEM-EDS analysiswe obtained the following information. Within the defect, bothCs and Cl were detected, Cl having a slightly -tronger signal.However, EDS analysis of the cross-sectional area moving awayfrom either side of the defect showed a steadily decreasingsignal for Cl and no signal for Cs.
$4
,%D
0
A B C
Figure 9. (A) Removed area of delaminated film. (B)Area of film cut through the defect. (C)Cross-sectional view of film including thedefect.
-157-

In another study the procedure was terminated at the onsetof delamination. Since the area of delamination was small, thefilm was not removed from the substrate. The coating-substratesamples were cut through the defect exposing the small area ofdelamination, thus revealing the coating-substrate interface.Analysis of the coating-substrate interface revealed the pres-ence of Fe, Cs, and Cl; X-ray signals for only Fe were obtainedfrom the substrate. Examination of the cross section withinthe defect revealed two distinct regions of interest. Theregion near the substrate-coating interface was higher in Csand Cl than the region above. In both regions the C1 signalwas stronger than the signal for Cs. When delamination was al-lowed to continue until a large area of film had delaminated,no regional differences within the defect were found.
DISCUSSION
Through the course of this study we have examined manysamples which were subjected to various corrosive conditions.Regardless of the epoxy formulation and cure conditions (in-cluding the specific samples of polybutadiene), the trends ofpermeating species were consistent for all samples. The filmsall fail in the same area; the protective coating in contactwith a surface, e.g. a filler particle or substrate, is theleast resistant to corrosion or the most susceptible to thepermeation of corroding elements.
There are limitations to SEM-EDS analysis. The observabili-ty of subtle differences in morphology, manifested as topographi-cal differences, is limited by the resolution of the instrument.As reported earlier, epoxies have density domains of approxi-mately 10-60 nm. The maximum resolution of the SEM is 20 nm.In addition, the EDS X-ray analysis is qualitative only, witha detectability of one thousand parts per million and 25-50%possible error. It at best will only give relative quantities.
Transmission electron microscopy has been done on bothfilled and non-filled (OsO4 stained) samples. The drawback ofthis technique lies in the sample preparation. ultramicrotomyis needed to obtain a workable sample. In the case of the Zn-filled samples, the shear action deforms the filler particleand tears it away from the epoxy matrix, thus distorting thetrue image of the filler-matrix interface. It has been report-ed [11] that the density domains, as described earlier, are notvisible in the thin sections as viewed in the TEM. The problemswith the stained non-filled samples have already been mentioned.
In order to quantitatively examine the films which havebeen subjected to corrosive conditions and etching solutions,scanning transmission electron microscopy (STEM), with a resolu-tion of 10 AO, should be exploited. Once again, there is theproblem of thin sectioning, but bulk samples can be examinedas well.
-158-

REFERENCES
* [1] R. J. Morgan and J. E. O'Neal, J. Mater. Sci. 12, 1966 (1977).
[2] R. J. Morgan and J. E. O'Neal, Polym. Plst. Tech. and Eng.1 0(1) , 49 (1978).
[3] R. J. Morgan and J. E. O'Neal, Org. Plast. Coat., Preprints(ACS) 38, 485 (1978).
(4] R. J. Morgan and J. E. O'Neal, J. Mater. Sci. 14, 109 (1979).
[5] J. L. Racich and J. A. Koutsky, J. AppI. Polym. Sci. 20,2111 (1976).
(6] R. Blockland and W. Prins, J. Polym. Sci., A2, 7, 1595(1969).
[7] R. E. Cuthrell, J. Appl. Polym. Sci. 11, 1495 (1967).
[8] A. S. Kenyon and L. E. Nielson, J. Macromol. Sci.-Chem.
A3(2), 275 (1969).
(9] H. H. M. Balyuzi and R. E. "Burgi, Nature 227, 489 (1970).
[10] L. Gallacher and F. A. Betteiheim, J. Polym. Sci. 58, 697(1962).
(11] J. L. Racich and J. A. Koutsky, "Chemistry and Propertiesof Crosslinked Polymers", S. S. Labana, Ed., p.303, Aca-demic Press, New York, 1977.
[12] S. C. Misra, J. A. Manson and L. H. Sperling, ACS SymposiumSeries No. 114, 157 (1979).
[13] R. J. Morgan and J. E. O'Neal, J. Polym. Sci. (Polym. Phys.Ed.) 14, 1053 (1976).
[14] J. L. Kardos, Trans. N.Y. Acad. of Sciences 11, 35(2), 136(1973).
(15] J. L. Racich and J. A. Koutsky, Bull. Am. Phys. Soc. 20, 456(1975).
(16] J. L. Racich, J. A. Koutsky, J. Appl. Polym. Sci. 20, 2111(1976).
[17] J. L. Kardos, Trans. N.Y. Acad. Sci. 11, 35(2), 136 (1973).
[181 R. M. Kessenikh, Polym. Sci. USSR 14, 466 (1972).
-159-

[19] C. A. Kumins, J. Coat. Tech. 52, 39 (1980).
(20] W. D. Bascom, "Composite Materials", Academic Press, N.Y.1974, L. J. Broutman and R. J. Krock, Eds., Vol. 6,Chapter 3.
[21] T. K. Kwei, J. Polym. Sci. A3, 3229 (1965).
[221 C. A. Kumins and J. Roteman, J. Polym. Sci. Al, 527 (1963).
116
- -
-160-

Program #13. Preparation of Colloidal Iron Sols by(a) Aqueous Precipitation and
(b) by Dispersion
BACKGROUND
The purpose of this work is to develop a fundamental under-standing of the application of coatings to corroded steel sur-faces after removal of only the loose surface rust. In such acase, the coating must wet the corrosion products of iron andpenetrate through the porous rusted layer to bind firmly to theunderlying solid substrate. The approach taken is to preparethe eight reported corrosion products of iron in the form ofcolloidal sols and determine the adsorption of suitable polymermolecules on the surfaces of these colloidal particles. Thevery large surface area of the colloidal iron corrosion parti-cles allows accurate measurement of the polymer adsorption.Interpretation of the adsorption results using the acid-baseinteraction scheme proposed by Powkes et al. [1,2] allows thecharacterization of the iron corrosion products as Lewis acidsor bases and the selection of polymer candidates for practicalcoatings systems on the same basis. Two approaches have beentaken to study these interactions: (i) preparation of the pureiron corrosion products as colloidal sols by aqueous precipita-tion reactions, followed by transfer of colloidal particles toorganic media for the polymer adsorption experiments; (ii) dis-persion of commercial iron corrosion products in aqueous andorganic media for characterization and polymer adsorptionstudies.
Part (a). Preparation of Iron Corrosion Productsas Colloidal Sols
Introduction
The preparation of colloidal sols of a-Fe203 (K-129-11),O-FeOOH (K-1151-1), and Fe304 (K-107-1) by aqueous precipitationreactions in closed systems at high temperatures was describedearlier [3]. These colloidal sols were cleaned by serum replace-ment and characterized. X-ray diffractograms of the recoveredsolids were compared with those of the corresponding commercialproducts as well as literature standards. X-ray diffractogramsof commercial y-Fe203 and a-FeOOH were also compared with litera-ture standards.
-161-
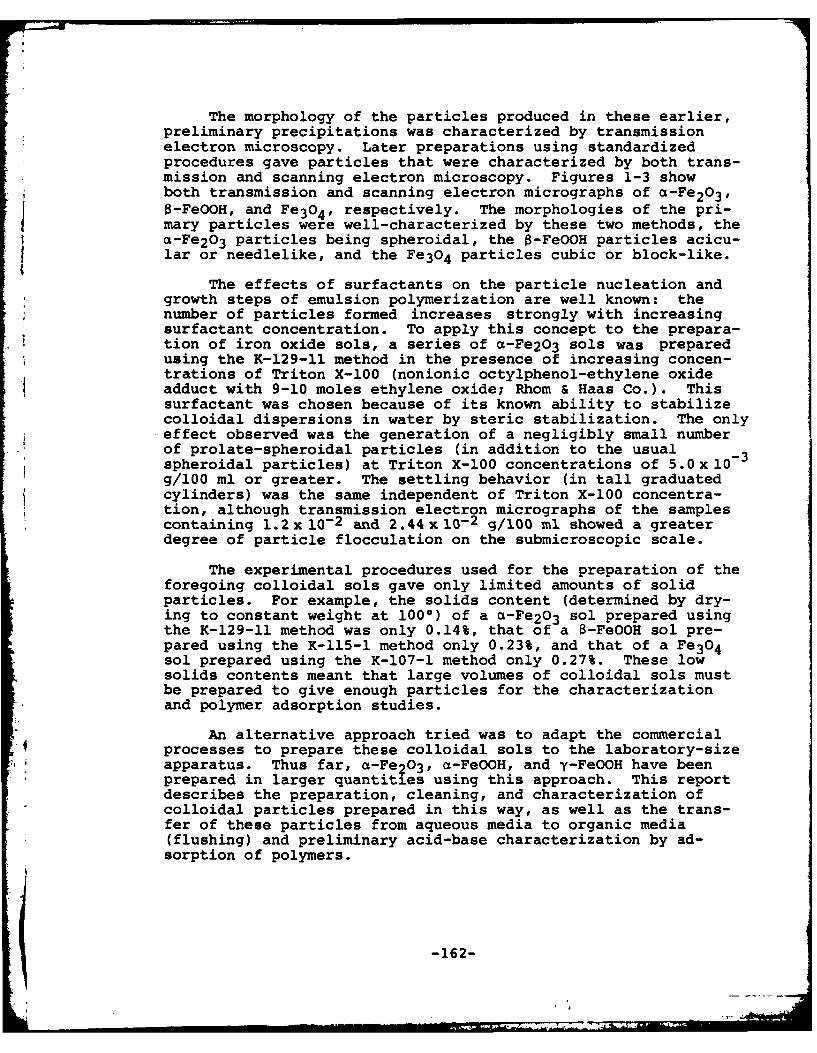
The morphology of the particles produced in these earlier,preliminary precipitations was characterized by transmissionelectron microscopy. Later preparations using standardizedprocedures gave particles that were characterized by both trans-mission and scanning electron microscopy. Figures 1-3 showboth transmission and scanning electron micrographs of a-Fe203 ,B-FeOOH, and Fe304 , respectively. The morphologies of the pri-mary particles were well-characterized by these two methods, thea-Fe203 particles being spheroidal, the 0-FeOOH particles acicu-lar or needlelike, and the Fe304 particles cubic or block-like.
The effects of surfactants on the particle nucleation andgrowth steps of emulsion polymerization are well known: thenumber of particles formed increases strongly with increasingsurfactant concentration. To apply this concept to the prepara-tion of iron oxide sols, a series of a-Fe203 sols was preparedusing the K-129-11 method in the presence of increasing concen-trations of Triton X-100 (nonionic octylphenol-ethylene oxideadduct with 9-10 moles ethylene oxide; Rhom & Haas Co.). Thissurfactant was chosen because of its known ability to stabilizecolloidal dispersions in water by steric stabilization. The onlyeffect observed was the generation of a negligibly small numberof prolate-spheroidal particles (in addition to the usualspheroidal particles) at Triton X-100 concentrations of 5.0 x 10
- 3
g/100 ml or greater. The settling behavior (in tall graduatedcylinders) was the same independent of Triton X-100 concentra-tion, although transmission electron micrographs of the samplescontaining 1.2x 10⁻² and 2.44x 10⁻² g/100 ml showed a greaterdegree of particle flocculation on the submicroscopic scale.
The experimental procedures used for the preparation of theforegoing colloidal sols gave only limited amounts of solidparticles. For example, the solids content (determined by dry-ing to constant weight at 100*) of a a-Fe203 sol prepared usingthe K-129-11 method was only 0.14%, that of a 8-FeOOH sol pre-pared using the K-115-1 method only 0.23%, and that of a Fe304sol prepared using the K-107-1 method only 0.27%. These lowsolids contents meant that large volumes of colloidal sols mustbe prepared to give enough particles for the characterizationand polymer adsorption studies.
An alternative approach tried was to adapt the commercialprocesses to prepare these colloidal sols to the laboratory-size
* apparatus. Thus far, c-Fe?03 , a-FeOOH, and y-FeOOH have beenprepared in larger quantities using this approach. This reportdescribes the preparation, cleaning, and characterization ofcolloidal particles prepared in this way, as well as the trans-fer of these particles from aqueous media to organic media(flushing) and preliminary acid-base characterization by ad-sorption of polymers.
-162-

SEM
Figure 1. Transmission and scanning electronmicrographs of cleaned a-Fe 203particles (K-129-11).
-163-

TEM
SEM
Figure 2. Transmission and scanning electronmicrographs of cleaned 3-FeOOHparticles (K-115-1).
,-2.64-
- d .* ,!q j~

TEM
SEM
Figure 3. Transmission and scanning electronmicrographs of cleaned Fe304 parti-cles (K-107-1).
(-165-
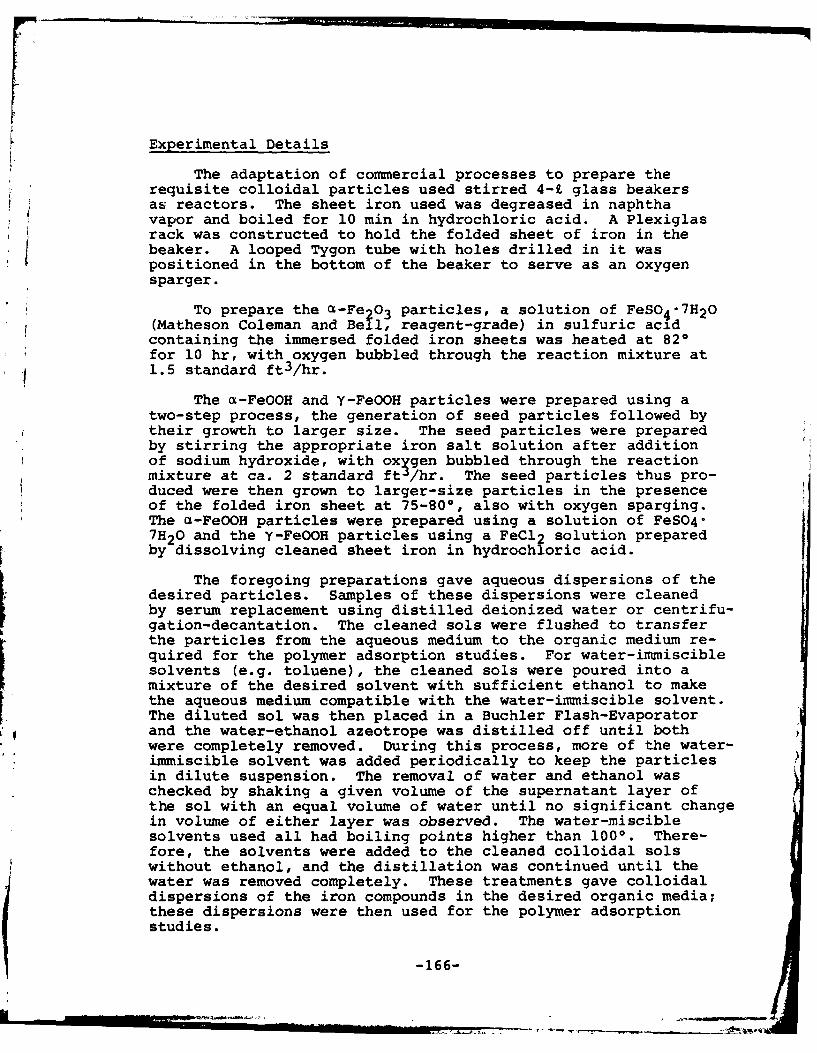
Experimental Details
The adaptation of commercial processes to prepare therequisite colloidal particles used stirred 4-X glass beakersas reactors. The sheet iron used was degreased in naphthavapor and boiled for 10 min in hydrochloric acid. A Plexiglasrack was constructed to hold the folded sheet of iron in theI beaker. A looped Tygon tube with holes drilled in it waspositioned in the bottom of the beaker to serve as an oxygensparger.
To prepare the a-Fe203 particles, a solution of FeSO 4 7H2 0(Matheson Coleman and Bell, reagent-grade) in sulfuric acidcontaining the immersed folded iron sheets was heated at 820for 10 hr, with oxygen bubbled through the reaction mixture at
*1 1.5 standard ft3 /hr.
The a-FeOOH and Y-FeOOH particles were prepared using atwo-step process, the generation of seed particles followed bytheir growth to larger size. The seed particles were preparedby stirring the appropriate iron salt solution after additionof sodium hydroxide, with oxygen bubbled through the reactionmixture at ca. 2 standard ft /hr. The seed particles thus pro-duced were then grown to larger-size particles in the presenceof the folded iron sheet at 75-800, also with oxygen sparging.The a-FeOOH particles were prepared using a solution of FeS04"7H20 and the Y-FeOOH particles using a FeC12 solution preparedby dissolving cleaned sheet iron in hydrochloric acid.
The foregoing preparations gave aqueous dispersions of thedesired particles. Samples of these dispersions were cleanedby serum replacement using distilled deionized water or centrifu-gation-decantation. The cleaned sols were flushed to transferthe particles from the aqueous medium to the organic medium re-quired for the polymer adsorption studies. For water-immisciblesolvents (e.g. toluene), the cleaned sols were poured into amixture of the desired solvent with sufficient ethanol to makethe aqueous medium compatible with the water-immiscible solvent.The diluted sol was then placed in a Buchler Flash-Evaporatorand the water-ethanol azeotrope was distilled off until bothwere completely removed. During this process, more of the water-immiscible solvent was added periodically to keep the particlesin dilute suspension. The removal of water and ethanol waschecked by shaking a given volume of the supernatant layer ofthe sol with an equal volume of water until no significant changein volume of either layer was observed. The water-misciblesolvents used all had boiling points higher than 1000. There-fore, the solvents were added to the cleaned colloidal solswithout ethanol, and the distillation was continued until thewater was removed completely. These treatments gave colloidaldispersions of the iron compounds in the desired organic media;these dispersions were then used for the polymer adsorptionstudies.
-166- _

The polymer adsorption studies used standard polymers recom-mended by Fowkes et al. [1,2] and Manson [4]: basic polymethylmethacrylate (Lucite 4F; E. I. du Pont de Nemours & Co.) andacidic post-chlorinated polyvinyl chloride (Geon 627x563;BFGoodrich Co.; 67% Cl; Mn 40000). In addition, Epon 1001Fepoxy resin (Shell Chemical Co.; epoxide equivalent weight 450-550) and Emerez 1511 curing agent (General Mills; amine equiva-lent weight 230-246) chosen as standards in the ONR CorrosionProgram were also used.
The polymer adsorption isotherms were determined by weigh-ing a given amount of iron oxide into an 8-oz. polypropylenebottle and adding a given amount of polymer solution. The basicpolymethyl methacrylate was dissolved in the neutral carbontetrachloride or toluene solvent and the acidic chlorinated poly-vinyl chloride in neutral methylene chloride or 1,4-dioxanesolvent. The Epon 1001F was dissolved in diethylene glycolmonobutyl ether. The iron oxide-polymer solution mixture wasagitated by adding glass beads to the bottle and rolling it onrollers to simulate ball-milling. At predetermined times, thedispersion was shaken vigorously, and a sample of the mixturewas withdrawn and centrifuged to separate the iron oxide; thena 10-ml aliquot of the supernatant layer was dried to constantweight under vacuum to determine the concentration of unadsorbedpolymer. The samples containing polymethyl methacrylate andchlorinated polyvinyl chloride were allowed to dry in an airoven to remove the bulk of the solvent and then were heatedunder vacuum for 48 hr at 120-1250 to achieve constant weight.The samples containing Epon 1001F epoxy resin were dried for 24hr at 1000 in an air oven; further drying for 48 hr at 600 undervacuum gave no change in weight. The first experiments com-prised determination of the time required to achieve adsorptionequilibrium using a given polymer solution concentration; laterexperiments, the determination of the adsorption isotherms usingpolymer solutions of different concentration.
Results and Discussion
The solids contents of the colloidal sols prepared usingthe laboratory adaptation of the commercial processes were muchhigher than those of the colloidal sols prepared using theclassical methods. These solids contents were determined bytitration of Fe(III) at the end of the preparation. Typicalvalues obtained were 9.60 g/100 ml for a-Fe 203, 5.38 g/100 mlfor a-FeOOH, and 3.97 g/100 ml for y-FeOOH. Of course, in eachcase, the solids content could have been increased by allowingthe reaction to proceed further before stopping it. The extentto which the reaction was allowed to proceed was determined bythe time required to produce a sufficiently large surface areafor the polymer adsorption studies, yet not so long as to pro-duce too large a particle size or particles of ill-defined shape.Therefore, the solids contents were controlled at values con-sidered to be suitable.
-167-

Figure 4 shows transmission electron micrographs of thesethree samples. The c-Fe 03 (Fig. 4A) particles were spheroidal,similar in shape but smaller in size than those produced by theK-129-11 method (Fig. 1). The c-FeOOH particles (Fig. 4B) andy-FeOOH particles (Fig. 4C) were acicular, similar in shape butsmaller in size compared with the $-FeOOH particles preparedusing the K-115-1 method (Fig. 2). Scanning electron micro-graphs, now in preparation, will confirm the morphology of theseparticles.
M6ssbauer spectroscopy (51 showed that both the c-FeOOH andy-FeOOH particles were essentially pure (Fig. 5). Titration ofthe Fe(III) in the Fe203 sample showed a purity of 92.5%. M6ss-bauer spectra of this sample will also be obtained.
Serum replacement was used to clean the sols prepared usingthe methods described earlier. For example, samples of an a-Fe2 03sol (K-129-11) containing 0.07, 0.28, 0.97, 1.02, 1.50, and4.50 g particles were cleaned in a 400-ml serum replacement cellequipped with a 0.5 um Nuclepore filtration membrane withoutsignificant loss of solids due to flocculation. The cleaningof the highest-concentration sol took 300 hr and 10 1 of dis-tilled deionized water. The cleaning process was monitored bythe conductance of the effluent stream; in each case, the con-ductance eventually reached a constant value, which was 2.5 timesthat of the distilled deionized water. Presumably this conductancewas representative of an equilibrium electrolyte concentration inthe presence of the colloidal a-Fe 203 particles.
The serum replacement method proved efficient for the lower-concentration sols prepared using the methods described earlier.However, it was more difficult to apply to the higher-concentra-tion sols prepared using the laboratory adaptation of the com-mercial processes. Therefore, these sols were cleaned by re-peated centrifugation and decantation, followed by redispersionin distilled deionized water.
The adsorption isotherms of polymethyl methacrylate, chlo-rinated polyvinyl chloride, Epon 1001F, and Emerez 1511 on thea-Fe203 , a-FeOOH, and y-FeOOH samples were determined. Thepolymethyl methacrylate and chlorinated polyvinyl chloridereached the equilibrium plateau values in 12 hr, the Epon 1001Fand Emerez 1511 in 2 hr. The difference in the time requiredto reach adsorption equilibrium is attributed to the much lowermolecular weight of the Epon 1001F and Emerez 1511 oligomers ascompared with the higher molecular weight polymethyl methacry-late and chlorinated polyvinyl chloride.
Ullman [61 claimed that electron microscopy showed that thesurfaces of iron oxide particles are smooth and that the adsorp-tion of polymer molecules is nearly instantaneous. In this work,the surface smoothness has not yet been demonstrated unequivocal-ly by transmission electron microscopy. Also, the relationship
-168-
-NM2=i_"__ =7.

a-Fe 203
A
a-FeOOI
B
l I)
y- FeOOH
C
Figure 4. Transmission electron micrographs of ironoxide particles prepared in larger quanti-ties: A. a-Fe2O 3 ; B. a-FeOOH; C. y-FeOOH.
-169-
Li,
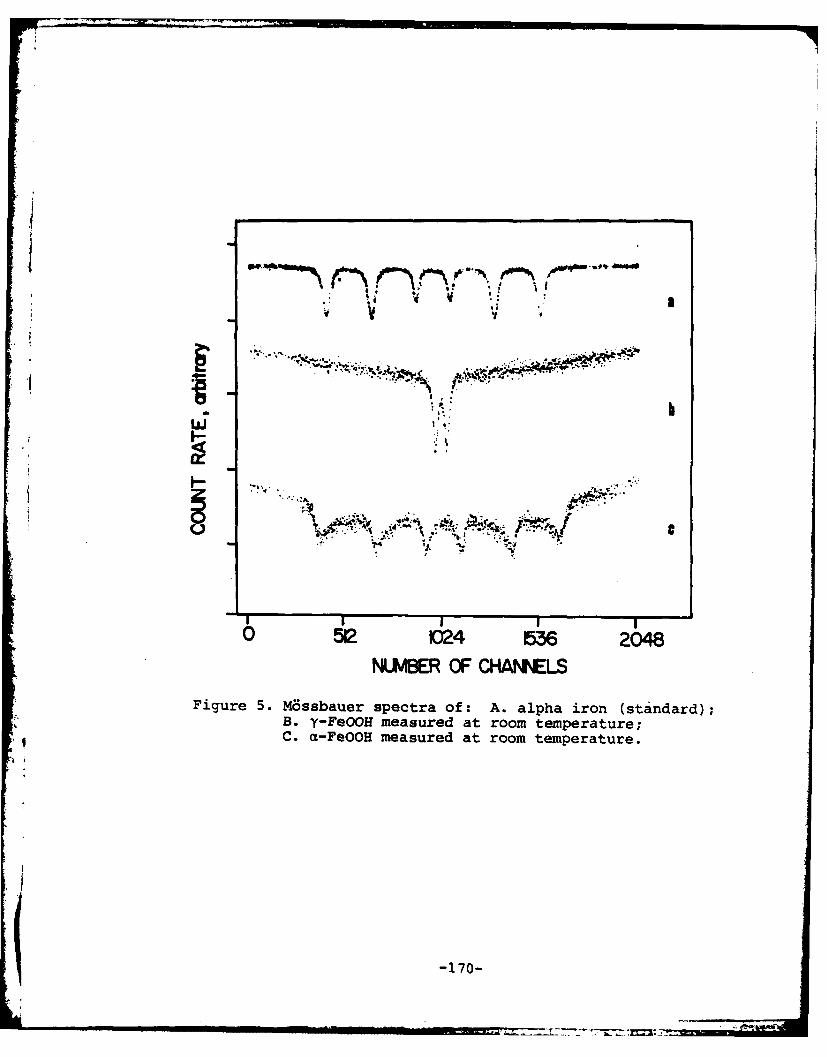
.a
iA V . ,
-170-
• 0- .. o., .. . . . s. -
I I ! II
0 512 024 536 2048
NLME OF CHA#JLS
Figure 5. Mossbauer spectra of: A. alpha iron (standard);B. y-FeOOH measured at room tem'perature;C. a-FeOOH measured at room temperature.
-170-
ii I I I- I1[.. . . Ill I II .... . ... ,,I .., . - 1 . "

between surface smoothness and rate of adsorption has not yetbeen defined. However, the shorter time required for the adsorp-tion of the oligomeric Epon 1001F is expected because entropyeffects are considered dominant in adsorption of polymer mole-cules from solution.
Figure 6-8 show the adsorption isotherms for a-Fe 203 , 0-FeOOH,and y-FeOOH, respectively, as the variation of g polymer adsorbed/gsubstrate with equilibrium polymer concentration in g/100 ml. Theadsorption isotherms should be expressed in terms of g polymeradsorbed/m2 substrate, but this requires the specific surfaceareas, which are now being measured. Nevertheless, the adsorptionisotherms show that all three iron oxides are amphoteric, i.e.,they contain both acidic and basic surface groups. Moreover, theamounts of polymer adsorbed are greater than for the correspondingcommercial c-Fe2 03 and c-FeOOH samples (see Table III), the resultsfor which are also shown in Figures 6 and 7. These results sug-gest that these prepared samples have higher specific surface areasthan the corresponding commercial samples.
Table I gives the equilibrium plateau values in terms of thenumber of polymer segments adsorbed/g substrate. For the a-Fe 2 03 ,the adsorption of Emerez 1511 is inordinately high relative tothe order observed for the commercial a-Fe 2 03. For the a-FeOOH,the order is the same as for the commercial c-FeOOH. Furtherconclusions must await the completion of the specific surfacearea determinations, but these results suggest that the surfacecharacteristics of the prepared a-Fe2 03 and a-FeOOH samples maybe different from those of the corresponding commercial samples.
Table I
Number of Polymer Segments Adsorbed/Unit Weight Substrate
Number of Polymer Segments Adsorbed/g Substrate, x 1020
Iron Oxide Cl-PVC PMMA EP 1001 EM 1511
a-Fe 203 33 22 12 55
a-FeOOH 77 64 18 24
y-FeOOH 28 53 25 38
a-Fe 203 * 8.6 6.6 1.2 1.5
a-FeOOH* 9.3 6.0 0.45 0.77
*Commercial samples (see Table III).
-171-

I 2.5fX -Pe2 O3
1.0
EQ I..I U COCNRAIN IV15011
Figure 6. Adsorption isotherms of differenti polymers on a-Fe20 3 .
t<
fa
. Figure 7. Adsorption isotherms of differenti polymers on a-FeOOH,
-1772-
i ..
Fi.e .Asopio sthrsifdffrn

a . -FOOH
0.0
CIPv
EQIIRU OCNTAIN 9104
Fiue8 dopiniohrso ifrnpoyesonyF4H
; 17.-

Part (b). Dispersions of Commercial Iron Oxides
Introduction
This approach used commercial iron oxides dispersed in aqu-eous media for characterization and in organic media for polymeradsorption studies. Of the eight corrosion products of iron,four were available commercially. These were obtained fromPfizer Inc., Pigment and Metals Division, Easton, Pa. (Table II).These iron oxide samples were used as received. However, trans-mission electron microscopy showed possible contamination of thec-FeOOH, so additional samples were obtained from Pfizer, theseed from which the oxide was produced and a sample of productionmaterial removed before the surface treatment. Transmissionelectron microscopy of these samples showed the same morphology,so the original sample was used.
Table II
Commercial Iron Oxides
Iron Oxide Sample Designation Lot Number
a-Fe2 03 R-2199 #E9036
y-Fe203 MO-2228 #E9460
Fe304 BK-5000 #E9516
a-FeOOH YLO-2288-D #F9006
Experimental Details
All four samples were characterized as to morphology bytransmission electron microscopy, and their specific surfaceareas, relative porosities, and relative adsorption energieswere measured by argon gas adsorption (Table III). The specificsurface areas of all four samples were great enough for thepolymer adsorption experiments. The high BET "C" values (theaverage energy of adsorption is an exponential function of C)showed that, with the possible exception of a-FeOOH, the parti-cle surfaces were crystalline. Also, the adsorption isothermsshowed that the samples were nonporous.
-174-

Table III
Argon Gas Adsorption on Iron Oxides
Iron Oxide Specific Surface Area, m2/g BET "C" Value
a-Fe20 3 9.96 3589
y-Fe203 19.80 1158
Fe30 4 5.72
c-FeOOH 10.66 445
Transmission electron microscopy [31 showed that all foursamples had a broad distribution of particle sizes. The y-Fe 203and a-FeOOH particles were acicular, and the a-Fe 203 andFe304 particles were spheroidal.
Aqueous dispersions of the four iron-oxide samples were pre-i pared in 250-ml polypropylene bottles containing 13 nn Burundumgrinding cylinders; the bottles were capped and allowed to rollon the rollers to simulate ball-milling. Samples were taken atvarious times, and the settling times were measured. Transmissionelectron micrographs showed that there was no change in crystalstructure upon dispersion.
The dispersions were cleaned by serum replacement in a 2000-ml glass cell shown in Figure 9. The large volume of the cellallowed the cleaning of a large volume of dispersion. The filtra-tion membrane was a 0.1 pm Nuclepore membrane supported by a per-forated Teflon disc. The ground-glass joints were sealed withDow Corning high vacuum sealant. Distilled deionized water waspumped through the cell until the effluent pH matched that of thedistilled deionized water (pH 6.8); then an additional 200 mldistilled deionized water was pumped through to complete thecleaning.
The oxides as received were not easily wetted by organic sol-vents. Their hydrophilic surfaces were attributed to the presenceof an adsorbed layer of water on the iron oxide surfaces. Washingthe particles with ethanol, followed by xylene-ethanol mixturesand later by xylene (good solvent for Epon 1001) gave dispersionsthat were still partially flocculated. Drying the iron oxide at1000 under vacuum for 24 hr enhanced its dispersion in water byball-milling and, following cleaning by serum replacement, itsdispersion in organic solvents. Finally, to obtain the iron oxidesamples for the polymer adsorption studies, the aqueous iron oxidedispersions in water were allowed to settle and the supernatant
-175-
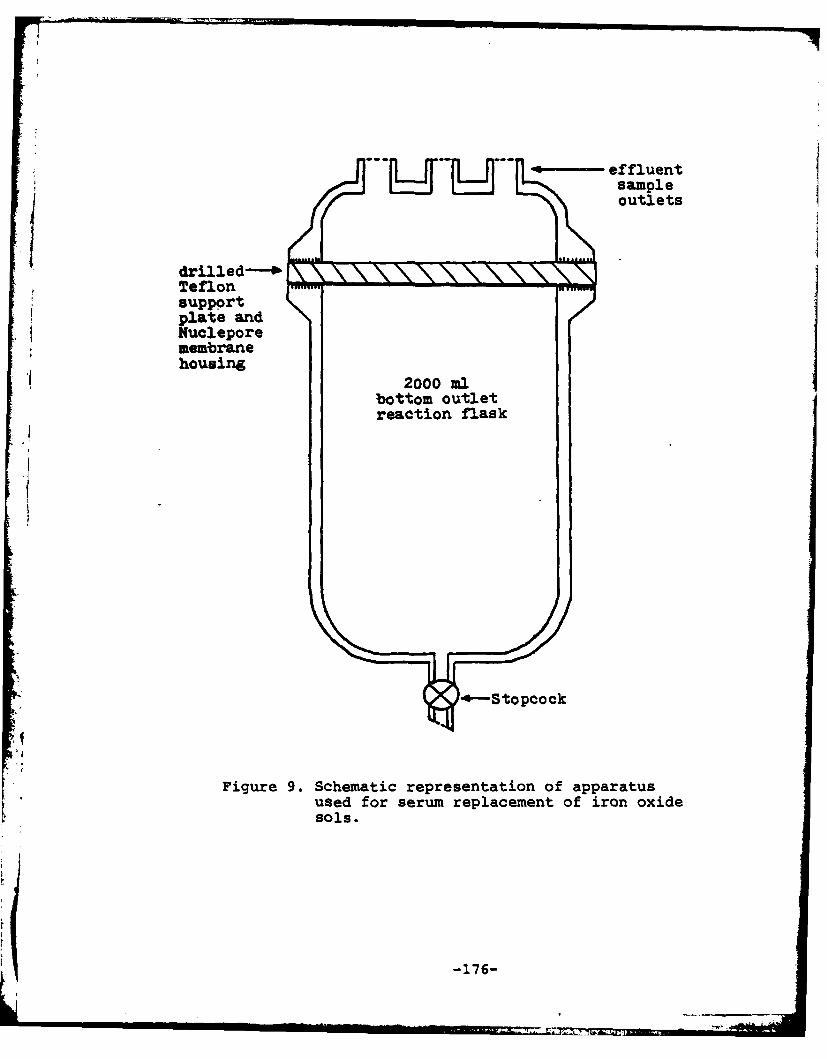
-- f...ffIL..J ~ -effluent
sample
j.Ii ! outlets
drille---\\*Teflon...
supportplate andNucleporemembranehousing
! 2000 ml1
bottom outletreaction flask
.1
4-Stopcock
Figure 9. Schematic representation of apparatusused for serum replacement of iron oxidesols.
-176-
ra

layer was decanted; this process was repeated several times, andthe slurries of resuspended iron oxide particles were dried at1000 under vacuum for 24 hr. The dried samples were kept intightly sealed bottles to hinder the adsorption of moisture.These iron oxide samples were easily dispersable in the organicsolvents and therefore were added directly to the polymer solu-tions.
Weighed amounts of the iron oxides were added to the polymersolutions in polypropylene bottles and rolled on the roller mill;the samples were then centrifuged to sediment the iron oxide, andan aliquot of the supernatant layer was dried to apparent drynessin a hood and then dried to constant weight in an air oven at 1000.This technique gave poor results, principally because the solventsmigrated through the polypropylene bottles. Therefore, 8-oz flintglass bottles were substituted for the polypropylene bottles;the bottle screw caps were lined with aluminum foil to preventcontamination from the vinyl cap liners.
The polymer adsorption on the iron oxide samples was com-plete in 3 days, so all experiments were run for that period oftime. The iron oxide-polymer mixture was shaken for 3 min on theRed Devil Paint Shaker and rolled on the roller mill for 72 hr.Double samples of each iron oxide were run, and calibrations wereobtained from polymer solutions run without iron oxides.
Results and Discussion
For the aqueous iron oxide dispersions, the degree of dis-persion was followed by measuring the time required for completesettling of the dispersion. Table IV shows that the settlingtime increased with increasing milling time over the 120-hrperiod, indicating that the degree of dispersion increased (orthe average particle size decreased) as the milling progressed.At the same time, the pH of the aqueous phase increased for allsamples except the Fe3O4. For the three a-FeOOH samples, thesettling times for the commercial sample and the final samplewithout surface treatment were about the same, but were greaterfor the a-FeOOH seed; since the seed particles were smaller thanthe final particles, longer settling times are expected. Also,the final pH of all three samples was the same within experiment-al error, but the initial pH was different, being lowest for thecommercial sample which had been subjected to surface treatment,much higher for the seed sample, and slightly higher than thatfor the final sample without surface treatment. The surfacetreatment is not known, but obviously involves a compound witha lower isoelectric point.
All of the foregoing samples settled as if they were stabledispersions, i.e., the sample soon showed a phase boundary withparticle movement back and forth across this boundary, followedby the formation of a settled oxide layer which slowly increased
-177-
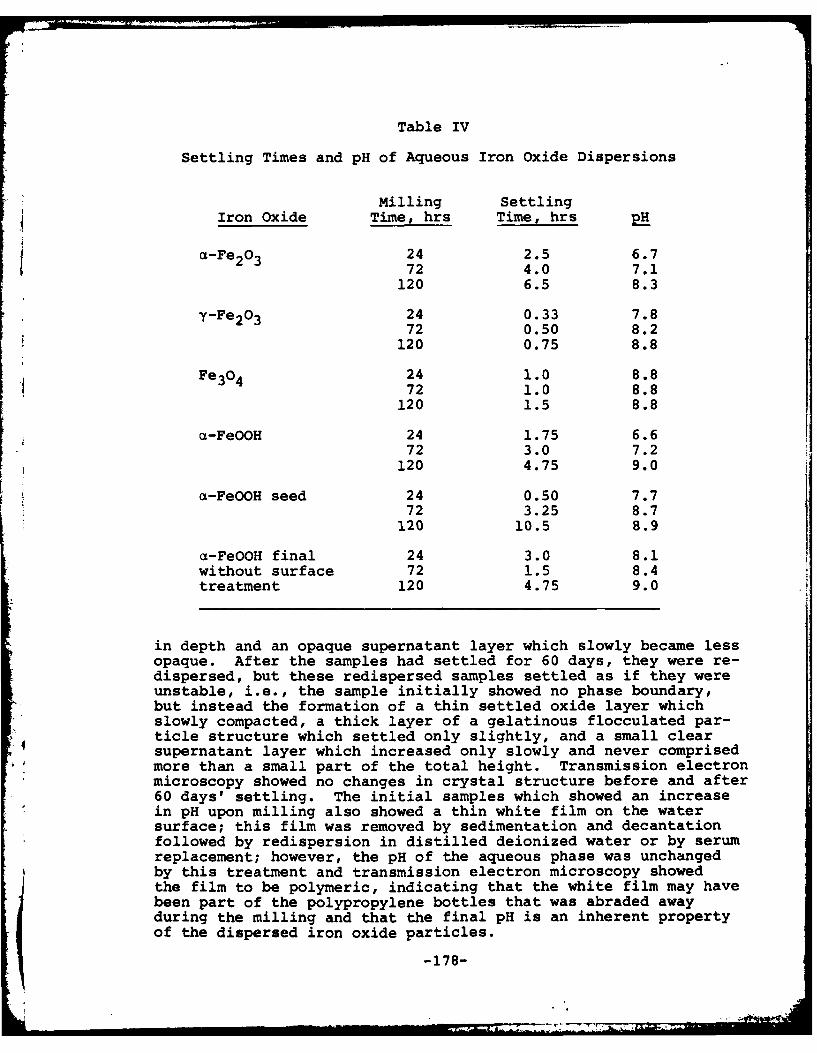
Table IV
Settling Times and pH of Aqueous Iron Oxide Dispersions
Milling SettlingIron Oxide Time, hrs Time, hrs pH
a-Fe203 24 2.5 6.7
72 4.0 7.1120 6.5 8.3
y-Fe203 24 0.33 7.872 0.50 8.2
120 0.75 8.8
Fe304 24 1.0 8.872 1.0 8.8120 1.5 8.8
a-FeOOH 24 1.75 6.672 3.0 7.2
120 4.75 9.0
ca-FeOOH seed 24 0.50 7.772 3.25 8.7120 10.5 8.9
c-FeOOH final 24 3.0 8.1without surface 72 1.5 8.4treatment 120 4.75 9.0
in depth and an opaque supernatant layer which slowly became lessopaque. After the samples had settled for 60 days, they were re-dispersed, but these redispersed samples settled as if they wereunstable, i.e., the sample initially showed no phase boundary,but instead the formation of a thin settled oxide layer whichslowly compacted, a thick layer of a gelatinous flocculated par-ticle structure which settled only slightly, and a small clearsupernatant layer which increased only slowly and never comprisedmore than a small part of the total height. Transmission electronmicroscopy showed no changes in crystal structure before and after60 days' settling. The initial samples which showed an increasein pH upon milling also showed a thin white film on the watersurface; this film was removed by sedimentation and decantationfollowed by redispersion in distilled deionized water or by serumreplacement; however, the pH of the aqueous phase was unchangedby this treatment and transmission electron microscopy showedthe film to be polymeric, indicating that the white film may havebeen part of the polypropylene bottles that was abraded awayduring the milling and that the final pH is an inherent propertyof the dispersed iron oxide particles.
-178-
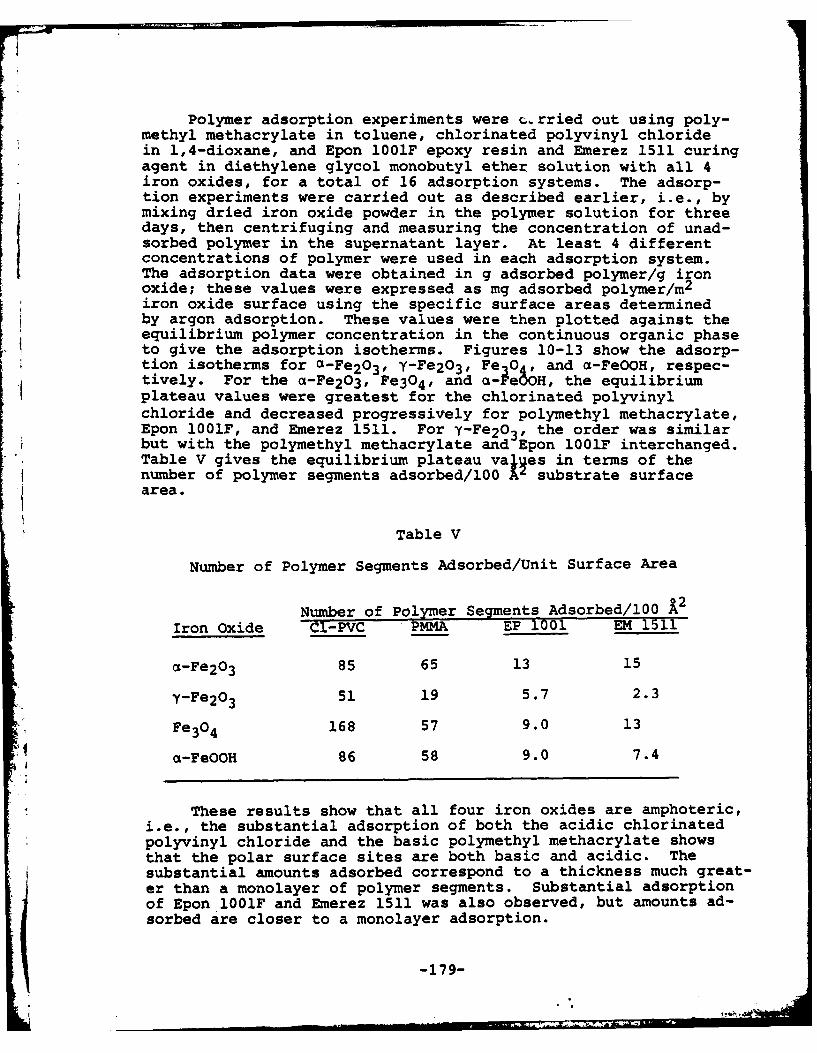
Polymer adsorption experiments were c-.rried out using poly-
methyl methacrylate in toluene, chlorinated polyvinyl chloridein 1,4-dioxane, and Epon 1001F epoxy resin and Emerez 1511 curingagent in diethylene glycol monobutyl ether solution with all 4iron oxides, for a total of 16 adsorption systems. The adsorp-tion experiments were carried out as described earlier, i.e., bymixing dried iron oxide powder in the polymer solution for threedays, then centrifuging and measuring the concentration of unad-sorbed polymer in the supernatant layer. At least 4 differentconcentrations of polymer were used in each adsorption system.The adsorption data were obtained in g adsorbed polymer/g ironoxide; these values were expressed as mg adsorbed polymer/m2
iron oxide surface using the specific surface areas determinedby argon adsorption. These values were then plotted against theequilibrium polymer concentration in the continuous organic phaseto give the adsorption isotherms. Figures 10-13 show the adsorp-I tion isotherms for a-Fe203, y-Fe203, Fe304 and a-FeOOH, respec-
tively. For the a-Fe203 , Fe30 4, and a-eOH, the equilibriumplateau values were greatest for the chlorinated polyvinylchloride and decreased progressively for polymethyl methacrylate,Epon 1001F, and Emerez 1511. For y-Fe203 , the order was similarbut with the polymethyl methacrylate and Epon 1001F interchanged.Table V gives the equilibrium plateau vabes in terms of thenumber of polymer segments adsorbed/100 A substrate surfacearea.
Table V
Number of Polymer Segments Adsorbed/Unit Surface Area
Number of Polymer Segments Adsorbed/100 X2
Iron Oxide Cl-PVC PMMA EP 1001 EM 1511
a-Fe203 85 65 13 15
y-Fe203 51 19 5.7 2.3
Fe304 168 57 9.0 13
a-FeOOH 86 58 9.0 7.4
These results show that all four iron oxides are amphoteric,i.e., the substantial adsorption of both the acidic chlorinatedpolyvinyl chloride and the basic polymethyl methacrylate showsthat the polar surface sites are both basic and acidic. Thesubstantial amounts adsorbed correspond to a thickness much great-er than a monolayer of polymer segments. Substantial adsorptionof Epon1001F and Emerez 1511 was also observed, but amounts ad-sorbed are closer to a monolayer adsorption.
-179-
.tL-

Figlure 10.
Adsorption isotherms of diffe-a ent polymers on commercial
at-Fe2O3.
olvigloaesU ft~vUw Cofb inh loon" ol
Figure 11.
Adsorption isotherms of differ-- II ent polymers on commercial
y-Fe2 03.
Pa
-IS
Adsorption isotherms of differ-ent polymers on commercial
jis Fe304 .
E.I~klu PilmifConcetllOU lonli all
Figure 13.
Adsorption isotherms of differ-ent polymers on commercialct-FeOOH.
I4Sfllblaa N~p III £.etll!5III l
-180-

WT
The number of polar sites per unit surface area was alsodetermined for a-Fe203 and Fe304 (measurements of the othersamples are in progress) by adsorption of water vapor on thedried iron oxides. This method does not distinguish betweenacidic or basic surface sites, but merely givV the total numberof such sites. The number of such sites/100 Al was 7.2 for a-Fe203 and 10.7 for Fe304. These values are at, or close to, theca. 10 water molecules/100 A2 concentration that corresponds toa saturated monolayer. The values determined by water vaporadsorption are in good agreement with the number of adsorbedpolymer segments for Epon 1001F and Emerez 1511. If the Epon1001F is difunctional in epoxide groups and the Emerez 1511difunctional in amine groups, the number of polymer segmentsadsorbed corresponds to adsorption of both functional groups onthe a-Fe 20 surface but adsorption of only a single functionalgroup on the Fe304 surface. This difference in the mode of ad-sorption may be due to the Fe(II) in the Fe304 as compared withthe Fe(III) in the a-Fe203.
The number of polymer segments adsorbed/100 A2 is muchgreater for the chlorinated polyvinyl chloride and polymethylmethacrylate than for Epon 1001F and Emerez 1511. This differ-ence is attributed to the much higher molecular weights of thechlorinated polyvinyl chloride and polymethyl methacrylate,which allow adsorption of individual segments on a polar site,with loops and chain ends of the polymer extending out into themedium. In contrast, the Epon 1001F and Emerez 1511 are oligo-mers which can arrange themselves in a packed surface layerwithout extending far out into the medium. The number of poly-mer segments adsorbed is significantly greater for the chlori-nated polyvinyl chloride than for the polymethyl methacrylate;this is attributed to the greater flexibility of the chlorinatedpolyvinyl chloride chains as compared with the relatively stiffpolymethyl metacrylate chains. The much greater adsorption ofchlorinated polyvinyl chloride on Fe304 than on the other threeiron oxides is attributed speculatively to the Fe(II) in theFe304 and the Fe(III) in the other three iron oxides.
It is of interest that, for chlorinated 0 olyvinyl chloride,the number of polymer segments adsorbed/100 A increased withdecreasing specific surface area (increasing average particlesize), i.e., the larger the iron oxide particles, the thickerthe layer of adsorbed polymer. The same variation was observedfor polymethyl methacrylate with a lesser spread of values, butnot with Epon 1001F or Emerez 1511. The thinner adsorption lay-ers of the smaller particle size iron oxides are attributedspeculatively to their smaller radii of curvature as well aspossibly their greater surface roughness and porosity.
In any event, these four iron oxides adsorb substantial-but-different concentrations of both the model acidic and basicpolymers as well as the prototype ingredients of a practicalcoatings system. Thus far the results are consistent with thosefor the iron oxides prepared in the laboratory. Further experi-ments are required to complete these adsorption studies and defineeach corrosion product of iron in terms of its surface properties.
-181-

CONCLUSIONS
The iron corrosion products prepared as colloidal solsand purchased commercially are both amphoteric, i.e., theirsurfaces comprise both acidic and basic groups as determinedby adsorption of basic polymethyl methacrylate and acidicchlorinated polyvinyl chloride standards. However, the pro-portion of acidic and basic groups may vary significantlyfrom one compound to another. Thus far all compounds studiedadsorb substantial-but-different proportions of Epon 1001F andEmerez 1511 (candidates for practical coatings systems).Further experiments are required to define completely theadsorption characteristics of these systems.
PERSONNEL
Graduate student M. H. Kang carried out the preparationand characterization of the colloidal sols of iron corrosionproducts and the corresponding polymer adsorption measurements.Graduate student D. W. Timmons carried out the characterizationand polymer adsorption experiments for the commercial ironoxide samples. Graduate student T. C. Huang assisted in thepolymer adsorption measurements beginning the summer of 1981.Mr. L. M. Bennetch served as consultant and helped in thepreparation of pure iron oxide sols. Visiting scientistDr. M. J. Cantow supervised the work of M. H. Kang and D. W.Timmons from the beginning of the project until June 1980.Staff member Ms. 0. L. Shaffer carried out the electronmicroscopy. Faculty member Dr. F. J. Micale carried out theargon and water adsorption experiments and assisted with theother experiments as did faculty member Dr. M. S. Ei-Aasser.
REFERENCES
[1] M. J. Marmo, M. A. Mostafa, H. Jinnai, F. M. Fowkes, andJ. A. Manson, I&EC Prod. Res. Dev. 15 (3), 206 (1976).
(2] F. M. Fowkes and M. A. Mostafa, I&EC Prod. Res. Dev. 17
(1), 3 (1978).
[3] First Annual Report, ONR Project, 1980.
(4] J. A. Manson, private communication, 1981.
[5] M6ssbauer spectrometry carried out by S. Music.
[6] R. Ullman, Encyl. Polym. Sci. Tech. 1, 551 (1964).
-182-

Program #14. M~ssbauer Studies of Iron Oxides
ABSTRACT
M6ssbauer spectroscopy has been used to investi-gate the precipitates formed by hydrolysis of 0.1M solu-tions of Fe(N0 3)3, FeC1 3, Fe2 (SO4 )3 , and NH4Fe(S04 )2 at900C. The isomer shifts, electric quadrupole splittings
* and nuclear magnetic splittings were used for the quali-tative and quantitative identification of the hydrolysis
I products. Proposals were made concerning the mechanismof formation of the oxides and hydroxyoxides of iron.Hydrolysis in the nitrate and chloride solutions pro-ceeds by the formation of monomers and dimers of iron(III)ions, followed by the formation of polymeric species.The polymers formed in the nitrate solution are notpresumed to include the nitrate ion in the polymer chain,whereas the polymers formed in the chloride solutioncontain some chloride ions in place of the hydroxyl ion.The next step in the precipitation process is the forma-tion of oxybridges and the development of c-FeOOH and0-FeOOH structures. This step is followed by loss ofwater and internal crystallization of a-FeOOH to a-Fe 203in nitrate solution or by dissolution of 8-FeOOH andgrowth of a-FeOOH in chloride solution. In sulfatesolutions the formation of a FeSO + complex suppressesthe polymerization process and the formation of oxyhy-droxides and oxides. Basic Fe(III) sulfates are formedinstead.
INTRODUCTION
The investigation and understanding of structural transfor-mations of iron hydroxides and oxides are important, since theyare common in nature and have great industrial importance (tocorrosion and protection, catalysis, pigments, magnetic tapes,cooling water treatment, etc.).
The composition and structures of iron(III) (hydr)oxideprecipitates depend on the Fe + concentration, the nature of theanion present, pH, temperature, time of aging and other topo-chemical parameters [1,2]. Difficulties in the investigation ofthese precipitation systems result from two facts. First, smalldifferences in the values of the parameters change the composition,
-183-
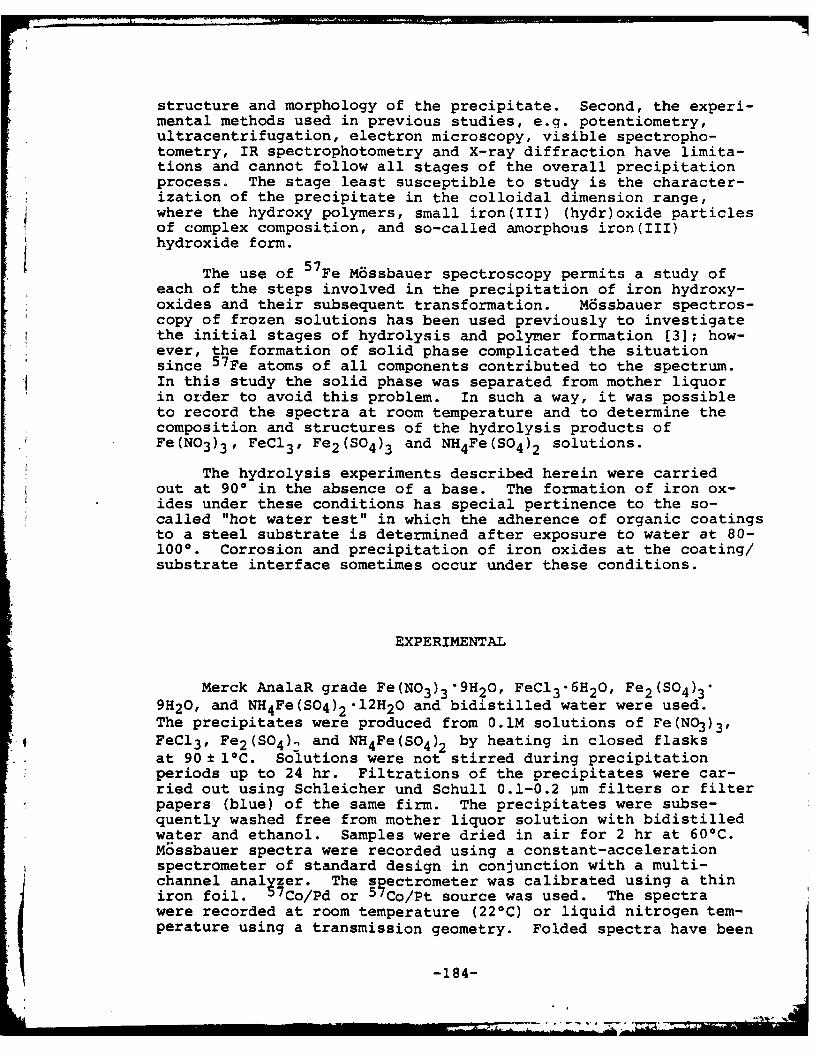
structure and morphology of the precipitate. Second, the experi-mental methods used in previous studies, e.g. potentiometry,ultracentrifugation, electron microscopy, visible spectropho-tometry, IR spectrophotometry and X-ray diffraction have limita-tions and cannot follow all stages of the overall precipitationprocess. The stage least susceptible to study is the character-ization of the precipitate in the colloidal dimension range,where the hydroxy polymers, small iron(III) (hydr)oxide particlesof complex composition, and so-called amorphous iron(III)hydroxide form.
The use of 57Fe M6ssbauer spectroscopy permits a study ofeach of the steps involved in the precipitation of iron hydroxy-oxides and their subsequent transformation. M6ssbauer spectros-copy of frozen solutions has been used previously to investigatethe initial stages of hydrolysis and polymer formation [3]; how-ever, the formation of solid phase complicated the situationsince 5 7Fe atoms of all components contributed to the spectrum.In this study the solid phase was separated from mother liquorin order to avoid this problem. In such a way, it was possibleto record the spectra at room temperature and to determine thecomposition and structures of the hydrolysis products ofFe(N03 )3 , FeCI 3 , Fe 2 (SO4 )3 and NH 4Fe(S04 )2 solutions.
* The hydrolysis experiments described herein were carriedout at 900 in the absence of a base. The formation of iron ox-ides under these conditions has special pertinence to the so-called "hot water test" in which the adherence of organic coatingsto a steel substrate is determined after exposure to water at 80-1000. Corrosion and precipitation of iron oxides at the coating/substrate interface sometimes occur under these conditions.
EXPERIMENTAL
Merck AnalaR grade Fe(N03 )3 -9H2 0, FeCl3-6H 20, Fe2 (SO4 )3 "
9H20, and NH4Fe(SO 4 )2 -12H 20 and bidistilled water were used.The precipitates were produced from 0.1M solutions of Fe(N03 )3,FeCI 3 , Fe2 (S04 ), and NH4Fe(S0 4 )2 by heating in closed flasksat 90 ± 1°C. Solutions were not stirred during precipitationperiods up to 24 hr. Filtrations of the precipitates were car-ried out using Schleicher und Schull 0.1-0.2 Um filters or filterpapers (blue) of the same firm. The precipitates were subse-quently washed free from mother liquor solution with bidistilledwater and ethanol. Samples were dried in air for 2 hr at 600 C.Mossbauer spectra were recorded using a constant-accelerationspectrometer of standard design in conjunction with a multi-channel analyzer. The spectrometer was calibrated using a thiniron foil. 57Co/Pd or 57Co/Pt source was used. The spectrawere recorded at room temperature (220 C) or liquid nitrogen tem-perature using a transmission geometry. Folded spectra have been
-184-

evaluated by fitting a sum of Lorentzian lines using a leastsquares SIRIUS program (Central Physical Research Institute,Budapest, Hungary) and its modification [4]. All chemical shiftsare given with respect to metallic iron.
RESULTS
Precipitation from Fe(N03 )3 Solution
M6ssbauer spectra of the precipitates formed by hydrolysisof 0.1M Fe(N03 )3 solution for different times of heating at 90*Care show- in Figures 1-4. M6ssbauer parameters obtained by com-puter evaluation of all measured spectra are summarized in TableI. The precipitate produced from 0.1M Fe(N03 )3 solution after80 min of heating was in the form of a stable colloidal dispersion.Half of the dispersion was removed by filtration (sample 41) andthe other half was aged for 2 additional days at room temperature(sample 41a). The M6ssbauer spectrum of sample 41 shows only aquadrupole doublet Q at room temperature and a magnetic splittingcomponent M1 with very broad lines at liquid nitrogen temperature.The spectrum indicates that there is superposition of severalmagnetic components and the value of the internal magnetic fieldH5/2=453kOe represents only a mean value. The M6ssbauer spec-trum of sample 41a shows a quadrupole doublet Q at room tempera-ture (Fig. la) and three relatively well resolved magnetic com-ponents (MIM 2 ,M ) at liquid nitrogen temperature (Fig. lb).The parameters ol component M1 are ascribed to a-FeOOH (goethite),and components M2 and M3 with small values of internal magneticfield H5/2 = 416 kOe and H%/. = 353 kOe at liquid nitrogen tempera-ture are ascribed to iron'IiI) hydroxy polymers. In Table I thevalues A(%) represent the percentages of each component in thesample investigated assuming similar values for the Debye-Wallerfactor. The values for internal magnetic field H5/2 near 470kOe obtained at liquid nitrogen temperature are slightly lessthan those for a-FeOOH (goethite) [5-8].
The precipitate produced by hydrolysis of 0.1M Fe(N03 )3 for6 hr at 900 C (sample 43) yields a different M6ssbauer spectrumat room temperature than that observed for shorter hydrolysistimes. This spectrum shows the superposition of a centralquadrupole doublet Q and two magnetic splitting components(MIM 2 ) with values H5/2
= 477 kOe for M1 and H5/2 =338 kOe forM2 (Fig. 2). Two magnetic splitting components (MIM 2 ) withvalues H5/2 = 528 kOe for M, and H5/2 = 492 kOe for M2 appear inthe spectrum recorded at liquid nitrogen temperature (Fig. 3).The M6ssbauer parameters of component M correspond to hematite(a-Fe2O 3 ) and of component M2 correspond to goethite (a-FeOOH).The spectrum of sample 39 prepared in Fe(N03 )3 containin- '.05MHNO 3 does not show a central quadrupole doublet at room temperature
-185-

0 00
a0000 0
0e
0 0
0 0
00
0* 0
00 +
* 04
*00 u
0 u
0 4
00 C0*~~~ 0 0n 14
00 000 44J W .0 0 w.-
00
00
0~ Z~
00* (N Q- -00 a) to
0.0
00.0
*00 ~r4O .
Si~~nO0- 3Aa)3
( 184J 0

00
00(
0004
0.o 0
0004
0
0 0 00
00 -4
0003 0
004
0 0 4)0
0 00 .1I '
0 0 r=0
0 o4. z
0-
0 0 1 a
000 00
a 0 0~00
00 (N
0. 0
00
0000
00 0 0
0 * -0 4
0, 00.: T 0004
S..NflOO 3AIIV138
-18 7-
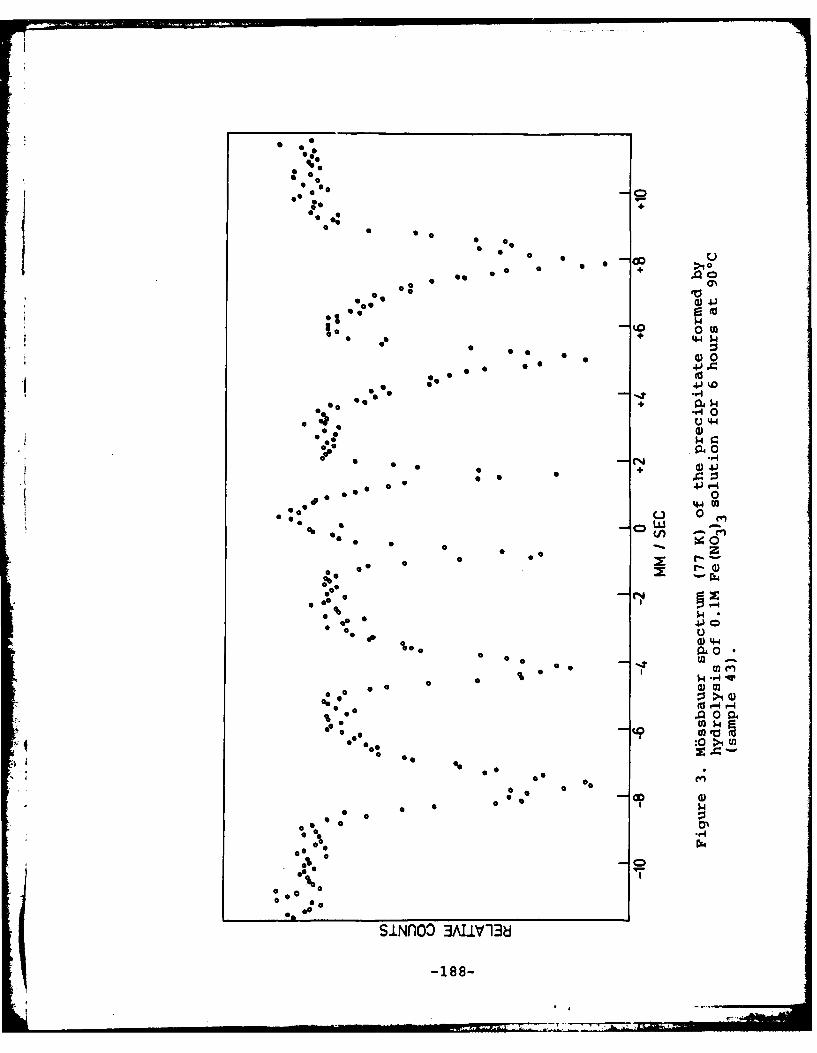
0+
00 4)0-00 t
0%
0 ~~~ 0 0 0 0
0 00 + 44 W
.: 0000 0W 04
0 + 0 $
0 *0
00
* r_
0000
0*0
.00
0000 440
00 a
00
00 0L 0
0 *4~ -4.V
00~~d M/ ~AD 0 04 0
0 0 00 a
0 $
000
0 z
.0 0 0)
00 0 0(
0 0 04-0 0. 04
0 U
00 000 >Q
000 o
0*
0
Si4O 00 'V.93
0 *gO 0188-

0 +
0 ° o O
04
0
• • so f o 01- 0.. 4.40
o 0
* 0.
0 0 W 04
e4 4-4
000 o o
'I °
oc00 0
0 •:: , €/' ::
00SS
+. .1+00N 00J
00 r,00
0 0 440 0 4J 0
00 0• r-4 -
0 00 0 * 0
0 0 Go 40"- OA
It 0 t
-189-
.... ....................0 z Iw~l

in contrast with the spectrum of sample 40 (Fig. 4). Themeasured effective magnetic fields (MIM 2 ) can be ascribed toa-Fe 203 of higher and lower crystallinity, respectively.
Precipitation from FeCl 3 Solution
M6ssbauer spectra of the precipitates formed by hydrolysis
of 0.1M FeCl 3 solution (samples 15, 44, 51) show a quadrupoledoublet (Q) at room temperature and two magnetic splitting com-ponents (MIM 2 ) at liquid nitrogen temperature. The Mdssbauerparameters of component M1 are ascribed to a-FeOOH and of com-ponent M2 to 8-FeOOH. No a-Fe 2 03 was detected.
Precipitation from Fe2 (SO4 )2 Solution
The M6ssbauer spectra of the precipitates (samples 16, 30,* 46) formed by hydrolysis of 0.1M Fe2 (SO4 )3 solution at 90*C
show a quadrupole doublet (Q) at room and liquid nitrogen tempera-tures. The precipitate formed by hydrolysis for 3 hr (sample 16)has M6ssbauer parameters 6 = 0.369 mm/s and A = 1.012 mm/s atroom temperature. From Table I it is seen that M6ssbauer parame-ters of samples 16 and 30 (yellow precipitate) are close to thoseof sample 46 (brown precipitate) with the exception of thequadrupole splitting value of sample 46, which was 0.689 mm/sat room temperature and 0.736 mm/s at liquid nitrogen temperature.This difference can be attributed to different compositions ofthe basic iron(III) sulfate formed. Fe(OH)SO4 is formed at shorttimes by hydrolysis of Fe2 (SO4 )3 solution at 900C and there istransformation to other relatively complex forms of basic iron-(III) sulfate (brown precipitate) at long times of hydrolysis.
The M6ssbauer spectrum of sample 85 prepared by hydrolysisof 0.1M NH 4 Fe(S04 )2 solution for 6 hr at 900C shows one quadru-pole doublet with parameters 6 = 0.396 mm/s and A = 1.101 mm/s,values which are comparable with those obtained for the precipi-tate produced by the hydrolysis of 0.1M Fe 2 (S04 )3 solution(Table I).
DISCUSSION
On the basis of earlier studies the hydrolysis of Fe(III)solution occurs by a sequence of stages which includes theformation of monomer and dimer hydrolysis species, their poly-merization, formation of a precipitate and subsequent transfor-mation of the precipitate to oxides of known composition and
-190-

= 44 C
04-
4J) _ _ __%_ _%_
0
0 U -A -A CDiI0-H N0 %W) 4) 0) VD iD 3: 0D1
41 1 oV4 04 V 34 0 -34
02 04
.p -40Hto 2
., -4 1 -
r. AdI -4 MM 04 rM go V C0
. ) 41 $4' IW r. 14 0 w
. ri w) to V ot0 HC1 4 > ) 4 1 0 44 .44 4 .
w 44 0.9 4 4 04 mC U0 ___ x___1 $ z 5
$44 W -- oV4 0 3-
44 )5 go -r4 4 V 0 0 00u WOL 44 04 Oi xD a (a a- to 39 ..
0) PC -P LA 0.. LA iD r, 0IIC4 %- N a% 0h-4 'UI r-4 M U C1 -1 Mn VA N n'Uw
.0 %D %"0'U ' 0 to 0n 0 oU 'U' W i n C"4 0to 02 Ln in0 CU D -4 D (A4 0U en CLA M ' a%
C' N i 0 ON4 m (A 0 %D 0% C1 4 -T r- en4 V
44-
w C4 -4 0 v. V' %0 N %D co N4 01 O C -14 co N M %U' -M 'U' LA IT r, 0' 'U' m I* M
N tr N, 0 0 0 0 0 0 0 0 0 00 o C r4( D 4C
0)
14 - M 4 V l I* M . I (nM .4 M N en v
4J 8. 08 C; 8V C; 8 01 C; 8 8
AdU U
U)
:0 0
4a4 E4 NNN
414

4
'%U
04
r4 J LO) 0 C 24 0 0 14
c ) 0 U) fn > $0.. 4 0 > 0 -4 0
4)0 CV) 0 . 0 0' 0 0 0N.41 1 0 V) 0.0 44 0 0.0
>1 . 14 4 0- 04 441 44 0 U 0 41 el >, 4 4' w mtc04 -A -0 1 4 - 0 41 V : -4 V
V -4 0 4 u N 4 4V U4 00 0 ~40 >, V 1 w 01o
01d 04 04 W. r 4 04 W10440 54 U 0) N 4 p x 2.$4-
014 4) r 0 m 0 N v v001 -1bl4.0 0 54 .0 0 4 0.000 '444 0.
14 44 04 0 4 44J 0C
4 eC -0 CD qw Ln IV r- C4 0 v. Ln 0 - (NV -4 r- r4 %0-n k (In %D Ma -1 CA' r-4 SD n
41r. - -I -I r-4 en r4 %D0 ' CA I 0 Wf Ml mD (0 U - r - %D LA 0% (N (A 1-4 w (N LA %D
2 Ln vs LA in LA f) %0 m LA eq %D v0 LA
re i CD V' 1- .4 %D en V' 07% I' V OE-' 4',, O
4gLn .4 c (4 s- M LA 0; C 0; i 0;s r- s LA (Y4 as 4 as m G% r- LA r- LA
v en LA -w If' v' LA v I* I* IV le
C) 0 V IV * Is . N MD co CD qT -4 0 IV 0 0 ODU) 0 s-I %.0 0 0 VO 0'n 0N .C4 v N v 0'C (7%~
r4%. ~ N r-4 (4 (N (N (N .-4 C4 %D 0 C4 %D r-I fn
< 2; C I I; I; I; c;2
* - LA r- %o LAO 0 D fn4 LA OD co CD LA (NOsco U)'D 0s iD co g 0 r- r- r- a's r. IT (71 ven fn CV Mw 0' M fn) I* v M IT V' fn v 0I
0 -I (N '-I (N V-I (N -.4 (N -I N 1-I (N
E-4 04 Z 2
0192

001
40 OD
04o .4
00 Cna
-4 -4
0 0 4 0 0 4-. 4 C' 4 -14 -.4 q 0
a-SO0 40 0)(4- .-4U0 $4k 0 0 0- ) 1ra) Id 0100 0 0 00
0.V4 ) 4>4u 4aN (440 -4 1 1-4~ -u 04 -4 V m 10 -40 mn en f q1- A0 0 - GI cc0 -0 0a aC) w N lw M C 4 MN UC) HNoto0) C > 0 > 0 0 >4 0 >1 - 1
41 w 0 (n 1-1 ( Cf-4 11 U1E)4En 4 ar.04-- - 0-0 v - 0 0 A*4) V r 14 w 44 w 4 ('4 4 C'lI~ 4 41A t 0 1 0v v OV > 0) V 0) a-M 141 N~ 0 A >4 fa to r4 01 44 >04 go to V a to to.
04 4) 00 * w 0 * 0 * 004 0 -1 0f W 004) 0 -4 A 03 - m 0 0A
x C 0 0 0 c0 . 0 0 0 0 0
0 v IA 0 0 0 0 0-4 0 V- --4 4 -4 -
-41
Eo en en
a 0
CIA -0 %D4 9 0 0 0
4cu -n 544 0 C
0N Nn C4 i 4 N- 0% %D
N rq I- C
041CD 0 0 (TA 0 ON% -4 ('4 1- V.
U) Cy% OD Un %D 0 CD '0 0 M"0*~~~~L m. e n~e . e Ae > 0)
do 4 -4)
14
-4 N' -4>-. 4 01 z 0f O' 01 01 01 0o 01 .40
44 0
A
00
0 9D ntn~~ *n-WG

structure. The monomeric and dimeric Fe+3 complexes have beenwell characterized [3,91. Formation of iron(III) hydroxypolymers from Fe(III) salt solutions has earlier been investi-gated by several methods [10-17]. Spiro and co-workers [10]reported an investigation of Fe(N03 )3 hydrolysis with gel chrom-atography. They concluded that high molecular weight ferric-hydroxy polycations are in the form of 7 nm spheres having theempirical formula [Fe(OH)A(NO 3)3 x]n, 2.3< x < 2.5, with Mw near140,000. The stages in the hydrolysis of Fe(III) salt solutionswere recently confirmed with pH titration of acidified iron(III)nitrate solution in the temperature range from 240 to 900C [11],light scattering, ultracentrifugation and electron microscopy[12]. The precipitates formed by the hydrolysis of Fe(III) saltsolutions under various experimental conditions were identifiedas c-FeOOH (goethite), y-FeOOH (lepidocrocite), and 8-FeOOHusing X-ray diffraction [13]. Ferric-hydroxy polycations formedin partially neutralized Fe(N03)3 solutions have been character-ized using electron microscopy and ultracentrifugation tech-niques [14,15]. The authors concluded that the anion presentduring the formation of the polycations didn't affect the struc-ture of the polycations, but did affect subsequent aging pro-cesses. M6ssbauer spectroscopic characterization of frozenferric perchlorate solutions suggests that a significant pro-portion of the hydrolysis product is hydroxy polymer molecules[16,17].
The results of these papers indicate that the polymerizationof iron(III) ions is an important stage in the process of theformation of oxyhydroxides and oxides. However, it is difficultto correlate these results because they were obtained undervarying experimental conditions, using several techniques ofdiffering capabilities. The experimental conditions utilizedin this work made it possible to follow all transformations fromiron(III) hydroxy polymers to well crystallized a-Fez03 endproduct by using M6ssbauer spectroscopy. The formation of iron-(III) oxyhydroxides and oxides has mainly been studied by addinga base to Fe(III) salt solution. It is well known that Fe3+ ionis characterized by high hydrolyzability and deprotonation ofits water complexes can easily be achieved at elevated tempera-tures and more slowly at room temperature. This characteristicof Fe3+ ion was used in the present study to produce iron(III)oxyhydroxide and (hydr)oxide precipitates from various Fe(III)salt solutions without adding the base and, in such a way, tosimplify these precipitation systems, generally known as verycomplicated. On the basis of the M6ssbauer spectroscopic measure-ments it was possible to make qualitative and quantitative analy-sis of all hydrolysis products of Fe(III) salt solutions atelevated temperature. These data will be used in the followingdiscussion to elucidate the mechanism of the formation of iron-(III) oxyhydroxides and (hydr)oxides from different iron(III)salt solutions.
-194-

Precipitation from Fe(N03)3 Solution
The Missbauer spectra of the hydrolysis products of Fe(N0 3)3solution formed between 80 and 120 min indicate the presence ofthree magnetic splitting components (Samples 41a and 42, Fig.ib). The value of H5/2 near 470 kOe obtained at liquid nitro-gen temperature and the isomer shift and quadrupole splitting canbe ascribed to superparamagnetic a-FeOOH (goethite) of poorcrystallinity [18] or nonstoichiometry.* The low values of theinternal magnetic field (416 kOe and 353 kOe) in the precipi-tates obtained after 80 min of heating of Fe(N03 )3 solution wereattributed to iron(III) hydroxy polymers with the general formula[Fe(OH)x (NO3)3 _x]n. The amount of nitrate in the polymers de-creases with the time of heating and further hydrolysis occurs.These polymers are proposed to be embedded in laterally arrayedislands of primary a-FeOOH particles. The primary particles arerod-like (-5 nm) as confirmed by electron microscopy [20]. Alsoprimary particles are uniform and monodisperse. These resultsare in accordance with the general rule which says that in thecase of hydrolysis of easily hydrolyzable metal cations at roomor elevated temperatures, the colloid particles are, in principle,uniform with a narrow particle-size distribution.
The spectra of the precipitate produced by hydrolysis for6 hr, as measured at room and liquid nitrogen temperatures, in-dicate the presence of superparamagnetic a-Fe203 and a-FeOOHwith a narrow particle size distribution (Figs. 2 and 3). Onthe basis of Mbssbauer parameters given in Table I and in ac-cordance with the literature data [5-8], it can be calculatedthat a-Fe 203 particles in this sample are between 7.0 nm -nd12.0 nm and the c-FeOOH particles are approximately 20-50 nmin average dimension. After 24 hr of hydrolysis, a-Fe203 be-comes the dominant species as seen from the increase in the M,component (a-Fe203 ) in Figure 4 and from A(%) values in Table I.In the M6ssbauer spectra of the precipitate produced by hydroly-sis for 24 hr in 0.05M HNO3 there is no central quadrupoledoublet indicating that particles in the sample are greaterthan 50 nm in average dimension.
The shape of the spectra shown in Figures 1-4 can be inter-preted as a common effect of narrow particle size distributionand superparamagnetism. The paramagnetic phase completely dis-appeared at liquid nitrogen temperature owing to the narrow sizedistribution (161.
*Superparamagnetism, poor crystallinity and stoichiometricdefects can decrease the effective magnetic field. Below themagnetic transition temperature ultrafine particles of ferro-and antiferromagnetic materials show a paramagnetic behavior.This phenomenon known as superparamagnetism is manifested asa drastic change in shape of the M6ssbauer hyperfine spectrum[3,19].
-195-

On the basis of the M6ssbauer measurements, the formationof solid phase by hydrolysis of Fe(N0 3)L solution at elevatedtemperature can be schematically descri ed as follows:
F3+ 2 + [F00H\Fe 4 + 100 Fe" n+Fe Fe (OH) 2+ FOH 4e FeFe Fe" Fe O
i OH/ 1-10 H' '*OH / n/
/OH OOH _H20
-* ~ 1 .F H0H nH -H20
. 0 ]n/2 + n -l a-Fe 203
IV. V.
Scheme 1.
In the first step there is the formation of simple hydrolysisproducts of iron(III), such as monomers (I) and dimers (II).The next step is the formation of iron(III) hydroxy polymers(III). Oxybridges form with prolonged time of heating or ag-ing, and the c-FeOOH structure (IV) develops. The final stepis loss of water and internal crystallization of a-FeOOH toa-Fe 2 03 (V).
Precipitation from FeCI 3 Solution
The influence of chloride ions on the formation of iron(III)oxyhydroxide and oxide has been extensively studied. Only inthe case of slow hydrolysis of FeC1 3 solution near room tempera-ture has it definitely been shown that the end product is com-pletely in the c-FeOOH form (21-23]. Also, it is known fromprevious studies [15,18,24-27] that the presence of chlorideions during the precipitation of iron(III) oxyhydroxide and
4 oxide may markedly influence the structure and composition ofthe solid phase. Studies of crystal nucleation and growth duringhydrolysis in FeC1 3 solutions (OH/Fe mol ratio - 0-2.75) hasshown that the transformations, 8-FeOCH-)--Fe 2O3 and B-FeOOHa-FeOOH at pH 1-2, proceed by dissolution and reprecipitationand the precipitation process is promoted by adding seed crystals[24]. The course of these reactions is strongly dependent on thestructure of the solvated iron species before the precipitation.The polymerization of Fe(III) ions is confirmed even in veryconcentrated aqueous FeCI 3 solutions (28,291.
Mbssbauer spectra of the precipitates formed by hydrolysisof FeCl3 solution for 3 and 24 hr at 900C show the presence of
-196-

two components (a-FeOOH and 8-FeOOH) as summarized in Table I.No evidence for the presence of c-Fe20 3 was observed in thesesamples. With prolonged time of hea~ing there is gradual in-crease in the amount of c-FeOOH as it is seen from A(%) valuesin Table I. The precipitation of oxyhydroxides by hydrolysisof FeC13 solution at 900C can be interpreted similarly as inthe case of the precipitation from Fe(NO 3 )3 solution. Iron-(III) hydroxy polymers formed as precipitate precursors inchloride solution very probably include some chloride ions inthe polymer chain instead of OH- groups. This conclusion isin accord with the results of the investigation of the polymericspecies in FeC13 acid solutions [28]. The chief difference incomparison with the polymers formed by hydrolysis of nitratesolution is in the fact that nitrate ions are not included inthe polymer chain (see Scheme 1) and they serve only for thecompensation of polymer positive charge. Results of a previousM6ssbauer spectroscopic study of the hydrolysis of iron(III)salt solution showed that chloride and sulfate ions occupy thefirst ligand sphere of iron(III), whereas nitrate and perchlorateions do not [3,30,31]. The process of polymerization is follow-ed by the incomplete elimination of chlorides in the course ofthe precipitation and the formation of the 6-FeOOH structure.Here it can be mentioned that an investigation of the B-FeOOHprecipitate showed that there is a minimum chloride content (-2%)in the precipitate which cannot be washed out [32]. The Mss-bauer spectra of the precipitate formed after 24 hr of hydroly-sis showed only a quadrupole doublet at room temperature and twomagnetic splitting components at liquid nitrogen temperature.
The results suggest the formation of a-FeOOH nuclei (freefrom C-) in the course of the formation of oxybridges. Withprolonged time of heating 8-FeOOH recrystalllizes via dissolutionand a-FeOOH crystals grow on preformed nuclei. The percentage of8-FeOOH after 24 hr of heating is high (15.1%) and this fact isin accord with the high stability of a-FeOOH and its slow disso-lution in the pH range investigated. In contrast to this be-havior the formation of a-FeOOH, or more precisely a-FeOOH anda-Fe 20 3 from "amorphous" iron(III) hydroxide gel, is a fasterprocess [33-37].
Precipitation from Fe 2 (SO 4 ) 3 or NH 4Fe(SO 4 )2 Solution
The influence of sulfate ions on the precipitation processfrom Fe2 (S04 )3 solution has been investigated in earlier studies[28-42]. The formation of Fe(OH)SO4, [Fe(OH) 2]2 SO4 andFe4 (SO4)(OH)I0 compounds by heating of acidic Fe2 (SO4)3 solu-tion has been observed [38]. Also, monodispersed basic iron-(III) sulfate sols of composition Fe3 (SO4)2 (OH)5 "2H20 have beenreported [391. Generally, the composition and crystal structureof basic iron(III) sulfates strongly depend on the preparationconditions (pH, temperature, time of heating, concentration ofsulfates).
-197-

M6ssbauer spectra and calculated M6ssbauer parameters(Table I) of precipitates produced by hydrolysis of Fe2 (SO4 )3or NH4Fe(SO 4 )2 solution for different times at 900 C indicatea markedly different influence of sulfate ions on the formationof iron(III) oxyhydroxides and oxides in comparison to thehydrolysis products formed in Fe(NO3 )3 and FeC 3 solutions.After 24 hr, the Fe(OH)SO 4 compound formed in short times ofhydrolysis at 90*C transforms to basic iron(III) sulfate of com-I plex composition. The precipitation process by hydrolysis ofFe(S0 4 )3 or NH 4Fe(SO4 )2 solution at 900C cannot be interpretedas in the cases of precipitation from Fe(N0 3 )3 and FeCl 3 solu-tions. Evidently, the formation of the dominant F-SO+ complex(91 suppresses the formation of iron(III) hydroxy polymers andsubsequent formation of iron(III) oxyhydroxides and oxides.
REFERENCES
[11 A. L. Mackay in "Reactivity of Solids", Proc. of the FourthInt. Symp. on the Reactivity of Solids, p.571-583 (J. H. deBoer et al., Eds.) Elsevier, Amsterdam, 1960.
[2] E. Matijevid, Progr. Colloid Polymer Sci. 61, 24 (1976).
[31 A. Vdrtes, L. Korecz, and K. Burger, "M6ssbauer Spectroscopy",Elsevier Pub. Co., Amsterdam, 1980.
[4] S. I. Nagy and T. W. Weir, The SIRIUS Evaluating Program(The manual for internal use), CSCR, Lehigh University, Bethle-hem, Pa., 1980.
(5] D. S. Kulgawczuk, Nukleonika 14, 777 (1969).
[6] A. M. van der Kraan, Mbssbauer Effect Studies of Superpara-magnetic c-FeOOH and a-Fe203 , Ph.D. Thesis, Technical HighSchool, Delft, 1972.
[7] W. Meisel, Kern. Kozlem. 48, 41 (1977).
(81 L. H. Bowen, "Mbssbauer Spectroscopy of Ferric Oxides andHydroxides" in M6ssbauer Effect Data Index, 1979, p.76-94.
[9) J. Bjerrum, G. Schwarzenbach, and L. G. Sillen, "StabilityConstants of Metal-Ion Complexes", No. 17, Spec. Publ. Chem.Soc., London, 1964.
-198-
[0] T. G. Spiro, S. E. Allerton, J. Renner, A. Terzis, R. Bils,and P. Saltman, J. Amer. Chem. Soc. 88, 2721 (1966).
[11] J. Dousma and P. L. de Bruyn, J. Colloid Interface Sci, 56,527 (1976).
[12] J. Dousma and P. L. de Bruyn, J. Colloid Interface Sci. 64,154 (1978).
(131 P. J. Murphy, A. M. Posner, and J. P. Quirk, Aust. J. SoilRes. 13, 189 (1975).
[14] P. J. Murphy, A. M. Posner, and J. P. Quirk, J. Colloid Inter-face Sci. 56, 270 (1976).
[151 P. J. Murphy, A. M. Posner, and J. P. Quirk, J. Colloid Inter-face Sci. 56, 312 (1976).
116] A. Vdrtes, M. Ranogajec-Komor, and P. Gelencser, Acta Chim.Acad. Sci. Hung. 77, 55 (1973).
[17] I. Dezsi, V. D. Gorobchenko, M. Komor, I. I. Lukashevich,A. Vdrtes, and K. F. Tsitskishvili, Acta Chim. Acad. Sci.Hung. 70, 329 (1971).
[18] K. Kauffman and F. Hazel, J. Inorg. Nucl. Chem. 37, 1139(1975).
(191 R. L. Cohen, "Application of Mbssbauer Spectroscopy", Vol.I, Academic Press, New York-San Francisco-London, 1976.
[20i S. Musid, unpublished results.
[21] S. MusiC, I. Nagy-Czak6, and A. Vdrtes, Colloid Polymer Sci.258, 469 (1980).
[22] J. H. L. Watson, R. R. Carell, Jr., and W. Heller, J. Phys.Chem. 66, 1757 (1962).
[23] R. H. H. Wolf, M. Wrischer, and J. Sipalo-Zuljevid, Kolloid-Z. Z. Polymere 215, 57 (1967).
[24] R. J. Atkinson, A. M. Posner, and J. P. Quirk, Clays ClayMinerals 25, 49 (1977).
[251 J. Dousma, T. J. van den Hoven, and P. L. de Bruyn, J. In-org. Nucl. Chem. 40, 1089 (1978).
[26] E. Matijevid and P. Scheiner, J. Colloid Interface Sci. 63,509 (1978).
(27] Y. Ujihira and M. Ohyabu, J. Physique 40, C2-347 (1979).
-199-

AD-AL09 606 LEHIGH UNIV BETHLEHEM PA CENTER FOR SURFACE AND COA-ETC F/6 11/3CORROSION CONTROL THROUGH A BETTER UNDERSTANDING OF THE METALLIETClU)NOV 81 N LEIDHEISER, E M ALLENW M 5 EL-AASSER N0001479-C-0731,
UNCLASS FIE M
3 EEEEEEEEIIIEIlEHEEHEELL
l i I -I II1
S 40 '.
111 . IIIII
1111.25 jff1.4 .
MICROCOPY RESOLUTION TEST CHART
NATIONAL BUREAU OF UANDARD I96 A

(28] G. W. Brady, M. B. Robin, and J. Varimbi, Inorg. Chem. 3,
1168 (1964).
[29] S. Balt, J. Inorg. Nucl. Chem. 29, 2307 (1967).
[301 A. Vdrtes, M. Suba, M. R. Komor, Ann. Univ. Sci. BudapestRolando-E6tvds Nom., Sect. Chim. 12, 69 (1971).
[31] A. Vdrtes, M. R. Komor, M. Suba, Ann. Univ. Sci. Budapest
Rolando-E~tvas Nora., Sect. Chim. 12, 79 (1971).
[32] J. Ellis, R. Giovanoli, and W. Stum, Chimia 30, 194 (1976).
[33] R. H. H. Wolf, M. Mirnik, and B. Telak, Kolloid-Z. Z. Poly-mere 205, 111 (1965).
[34] S. Okamoto, H. Sekizawa, and S. I. Okamoto, Proc. 7th Int.Symp. on the Reactivity of Solids, p.341 (Eds. J. S. Ander-son, M. W. Roberts, F. S. Stone) Chapman and Hall Ltd.,London 1972.
[351 W. R. Fischer and U. Schwertmann, Clays Clay Minerals 23,33 (1975).
[36] A. Vdrtes, K. Lazar, K. Keleman, and L. Bognar, Radiochem.Radioanal. Lett. 3, 375 (1970).
(37] A. A. van der Giessen, Chemical and Physical Properties ofIron(III)-Oxide Hydrate, Ph.D. Thesis, Technical University,Eindhoven, The Netherlands, 1968.
[38] T. V. Arden, J. Chem. Soc. 350 (1951).
[39] E. Matijevid, R. S. Sapieszko, and J. B. Melville, J. Col-loid Interface Sci. 50, 567 (1975).
[40] K. H. Lieser, Z. Elektrochemie Berichte Bunsen phys. Chemie63, 661 (1959).
[41] R. S. Sapieszko, R. C. Patel, and E. Matijevid, J. Phys.Chem. 81, 1061 (1977).
[42] J. Dousma, D. den Ottelander, and P. L. de Bruyn, J. Inorg.Nucl. Chem. 41, 1565 (1979).
-200-

Program #15. Characterization of the Surface Propertiesof Iron Oxides
INTRODUCTION
The development of protective coatings for corrosive materi-als requires a knowledge not only of the physical properties ofthe coating, but also the nature of the interaction of the coat-ing with the substrate and the affinity of the metal oxide/coating
* interface for water. Water plays an essential role in the corro-sion of iron. The experimental approaches used in this phase of
j the program to study the surface properties of materials requirehigh-surface-area, small-particle-size samples. Mbssbauer spec-troscopic and X-ray diffraction techniques have shown thata-FeOOH, y-FeOOH, a-Fe2O3 , and Fe304 are present as corrosionproducts on iron exposed to atmospheric conditions. High-purity,high-surface area powders of a number of these iron oxides havebeen obtained commercially and have been precipitated from solu-tion in other phases of this program.
The objectives of this research approach, therefore, are* concerned with the characterization of the intrinsic surface
properties of corrosion products, and the extent and manner inwhich the surface properties can be changed by pretreatment con-ditions such "s high temperature and chemisorption of surfaceactive materials. The solid/liquid interfacial properties ofthe iron oxide samples were investigated by electrophoreticmobility measurements as a function of pH where the acid-basecharacter of the surface groups was evaluated. The solid/gasinterfacial properties were investigated by water adsorptionisotherms where the surface polar site concentration on differ-ent iron oxides was determined as a function of activationtemperature and chemical treatment of the surface with hexamethyl-disilizane, HMDS, which interacts quantitatively with surfacehydroxyl groups.
EXPERIMENTAL
The iron oxide samples used in this study were Fe304 andc-Fe 2O3 obtained from Pfizer Inc. and a series of iron oxidesprecipitated from solution according to experimental techniquesdescribed in Section 13 of this report. Although the bulk ofresults is reported on the Pfizer samples, the current effortis primarily directed towards the samples precipitated in thislaboratory.
-201-
The argon gas adsorption isotherms for specific area deter-mination were obtained at liquid nitrogen temperatures using aclassical BET volumetric vacuum rig. The residual pressure of10- 6 Torr was monitored by an ion gauge. A capacitive electronicmanometer equipped with a 1000 Torr differential pressure trans-ducer (Datametrics, Inc.) was used to measure the argon gaspressure with a sensitivity of 10- 3 Torr. Specific areas werecalculated for argon molecular cross-section of 17 A2 . Thewater adsorption isotherms were measured on a quartz spring(Worden Quartz Co.) balance with a sensitivity of 10 ig/g ofsample. The equilibrium water vapor pressure was measured witha 100 Torr capacitive differential manometer (Datametrics, Inc.).
The iron oxide samples were prepared for electrophoreticmobility measurements by ultrasonic dispersion in the mediumof interest. Three electrophoresis systems were used in thisstudy: Rank Brothers Mark II, Pen Kem Model 500, Pen KemSystem 3000. The latter instrument was completely automatedaxA1 allowed rapid measurements to be made (less than 5 min perdetermination) so that the results could be followed as a functionof time. The results included in this report were found not tovary with time. General agreement, including measurements athigh electrolyte levels, between the three instruments wasestablished.
RESULTS AND DISCUSSION
Solid/Gas Interface
Water adsorption isotherms have been measured on c-Fe203and Fe304 samples which have been activated at 25, 100, 200, 300,and 4000C. Although the work included in this report is forthese two samples, gas adsorption isotherms are currently beingdetermined on iron oxide samples prepared in this laboratory andpresented in Section 13 of this report. The experimental approachadopted here is designed to determine the surface hydrophilicityof iron oxides under different conditions of high temperatureactivation. The procedure measures the weight loss as a functionof activation temperature, the water adsorption isotherms at25*C after activation at the specified elevated temperature,and a second series of isotherms which follows the previousseries after activation at 250C. The intent was to comparethe weight loss results to the amount of irreversibly adsorbedwater after each isotherm, and also the decrease in monolayercapacity of the second isotherm activated at 250C compared tothe first isotherm which was activated at the elevated tempera-ture. Since the intrinsic surface properties of the iron oxidesamples are sought in this approach, the specific surface area,as determind from a BET analysis of argon adsorption isothermsat -195*C, was measured as a function of activation temperature.
-202-

Tables I and II summarize the gas adsorption results ona-Fe 203 and Fe3O4 , respectively. The results show that the spe-cific surface area for a-Fe20 decreases nearly linearly withincreasing activation temperature above 100 0C. The results forFe304 , by contrast, show that the specific surface area increaseswith increasing activation temperature. Although there was noevidence of porosity from an analysis of the shape of the argonadsorption isotherms on both iron oxides, these results do sug-gest that for Fe304 high temperature activation leads to a smallincrease in surface porosity.
The water adsorption results for a-Fe203 in Table I areshown in Figures 1 and 2. Figure 1 presents the weight loss,amount of irreversibly adsorbed water, and the difference be-tween the first and second water adsorption monolayer value allas a function of activation temperature. The results show thatthe weight loss above 2000C is due to desorbed water primarilyfrom the bulk since it cannot be accounted for from analysis ofthe water adsorption isotherms. The correlation between thedifference in monolayer values between the first and secondisotherms and the irreversibly adsorbed water, both of whichare attributed to strongly adsorbed water on surface hydroxylgroups, is in good agreement. The indication is that the sur-face hydroxyl concentration does not change much with activationtemperature up to 400 0C. An analysis of the monolayer values,which are presented in Figure 2 in terms of water molecules/100 X2 as a function of activation temperature, is based uponthe assumption that a water molecule has a cross-sectional areaof 10 J2. The degree of surface hydrophilicity, which is pro-portional to the surface hydroxyl concentration, appears toincrease with increasing activation temperature.
The Fe30A results, which are summarized in Table II, arepresented in figures 3 and 4. The weight loss results in Figure3 indicate that the water loss at activation temperatures above100"C is due primarily to water loss from the bulk. The irre-versible water and difference in monolayer values between thefirst and second isotherms are almost constant over the entiretemperature range. The water monolayer values for the first andsecond isotherms as a function of activation temperature, Figure4, show that the first monolayer values increase with increasingactivation temperature up to 200°C followed by a decrease, whilethe second isotherm monolayer values decrease with increasingactivation temperature over the entire temperature range. Theinterpretation of these results is that below 200"C, strong physi-cally adsorbed water is removed, and there is evidence that par-tial dehydroxylation occurs above 200°C. Heats of immersionexperiments as a function of activation temperature are currentlybeing planned in order to verify the conclusions concerning de-hydroxylation of water from the iron oxide surfaces.
Another approach to hydrophobe iron oxides is by chemicaltreatment of the surface. Since surface hydroxyl groups on ironoxides are primarily responsible for the adsorption of water,the approach was to treat chemically these hydroxyls so as torender them hydrophobic. Silanes, in general, are known toreact with the proton of hydroxyls whether they are part of the
-203-
__ _ , A

0 0N 1 %0 Go 0- 0
r4
0~~ ~ u~r U
0 0 I r0 %0r r-4 0
r4 -4-4 U; j-41
0 0
N r- In inr.
.44
(D' N,
E-4 0 0 4 DL0 %n q " G
al0 41~ -I M'00 I- r- U rz 0; 0 1 f
034 a 00 I * w.
00 4FA> 4 )
N tn 0 tn N 0
H~- 0- 0 4
) 4) 4O-4 0
to D Go N o N 0 In
U sId '0I rI ~ "4
1 0
o 0 V-H~ 0.4
4J LN In N In N 0N. .-4 G 0 0 4
N N N NCN
-204

>1$4
9-44
4~~$ 09I n O2
10
NFA
0 w~ , IV 0%400 1 %0 CN r, (n
*1 r1
39 - -n M 0 41
N 0 0 0
4J10 N.
-A 41V to
en N 4 04) :O U.Wo
r4 *- . $4nLn(
4.>4 14
0'4.4 01V 0
0 0 -I 0 In r4 0 4
04 .- ~ ~ 0) ' 044 go
o0 P4 0 n kDL00 IV IV %0i r
4)> 0 4
N4 In (4 N. In to e4
M- *~ N ' r-40-
(a %0 N. 0 %0
0)
u-I0 U)
-H
0 0041
44 04
4 1<j %4 n 0 0N 0 U)
. . 9 205

0.,4
0
44I
0
m 0
r. $
4A 43 k4J&A .4. 4w
C) u. 14 4
L- 10
o~ON
oco cmC%
6 /6w LISBM oidweS
-206-
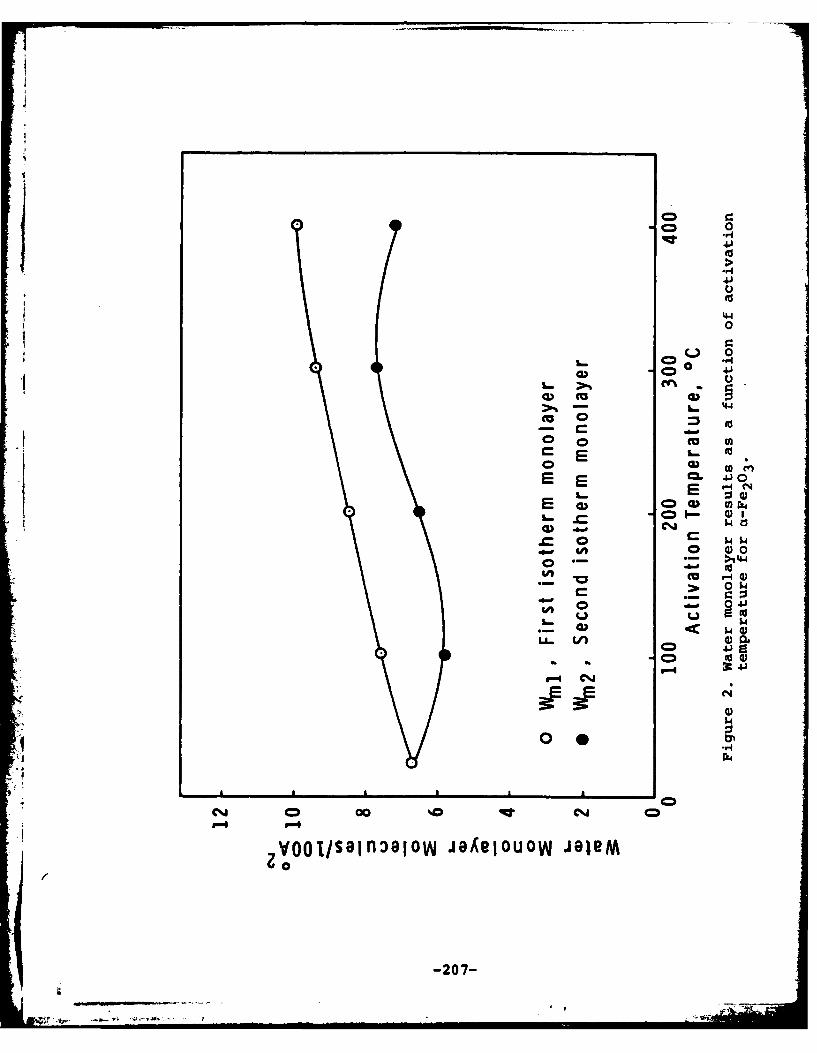
.44
a EU
E .E0 .
0- 4D.)
a) (U0C~
0 a EU
0 $
r. 0
00)
o * .
voolsainolowja~eouowjoEU(U -4
-207-.

crt 0
0V'4
CL
00
001m 0
$4>U (D
"- 4
0 03
CD 00o
cm 4J
CD~ ccC
6/5 114.a oldw
-208-~4
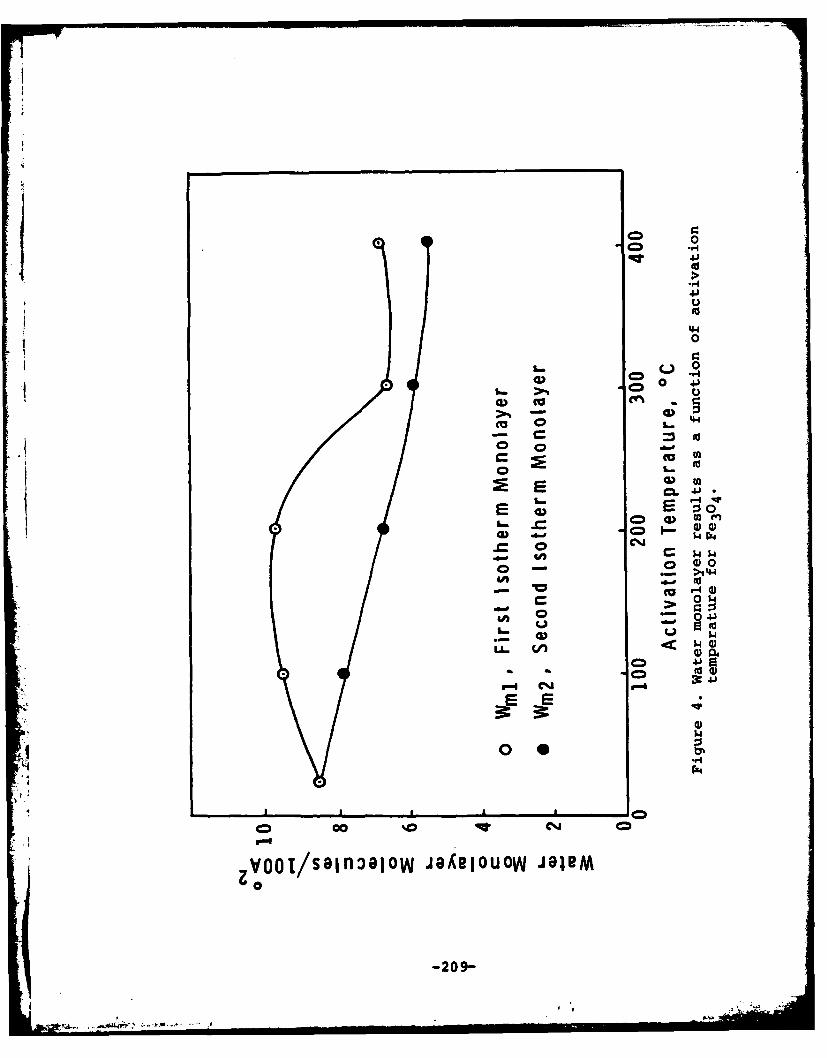
4.)0
.0"41
E :5 0
'9- >M M
A 0 0
> 0n
4C 54 WM
.AC 0 04~
0 - 0
0,
-209-

surface, or of an organic or inorganic molecule. Hexamethyldi-silizane, HMDS, was used to treat a-Fe 203 according to thefollowing reaction:
2ROH + (CH3)3Si----Si(CH3)3 NH3 + 2ROSi(CH3)3
where R represents the iron oxide surface. Adsorption isothermswere measured on a-Fe 203 after activation at 100 and 400 0C. Theresults, Figure 5, show that the adsorption is more pronouncedafter the 400 0C activation where there is also evidence of a"stepped" isotherm. Water adsorption isotherms were measuredon these samples after the HMDS treatment and the results, withand without the HMDS treatment, are summarized in Table III.Since it is assumed that the chemisorbed HMDS occurs accordingto the above chemical reaction, the amount of HMDS adsorbed inFigure 5 is expressed in terms of trimethylsilicon groups/100 A2.This measurement is not strictly accurate because adsorptionabove the inflection point is expected to occur by physical ad-sorption of the HMDS molecule. The irreversibly adsorbed HMDS,however, is expected to be due to chemisorbed trimethylsiliconand was found to be 1.04 and 5.45 trimethylsilicon groups/100X2for the 100 and 400 0C activated sample, respectively.
The first and second water adsorption isotherms for theHMDS-treated and untreated a-Fe203 activated at 100 0C are pre-sented in Figure 6. The monolayer results in Table III show thatthere is only a small decrease in the water monolayer valuesafter HMDS treatment. The monolayer values for the second iso-therms, W.2, show a decrease of 0.87 molecules/100 2, which isin good agreement with the irreversibly adsorbed, or chemisorbed,HMDS. Another significant feature of the water adsorption iso-therms in Figure 6 is that there is a decrease in adsorption inthe multi-layer region for the HMDS-treated sample. Figure 7presents the water adsorption isotherms for the HMDS-treated anduntreated a-Fe 2 activated at 400*C. The irreversibly, or chemi-cally, adsorbed ADMDS is much greater for this sample, 5.45 tri-methylsilicon groups/100 ,2 , and the result is a much greaterreduction in the amount of adsorbed water. The reduction in thesecond water monolayer value, 4.08 molecules/100 2 , is in goodagreement with the irreversibly adsorbed HMDS value of 5.45trimethylsilicon groups/100A 2 . It is also significant to notefrom the water adsorption results in Figure 7 that the amountadsorbed is much less for the HMDS-treated sample in the multi-layer region.
Solid/Liquid Interface
The electrophoretic mobility of Fe304 was measured as afunction of pH for samples which had been activated in vacuumup to 4000C in order to determine the effect of temperature on
-210-
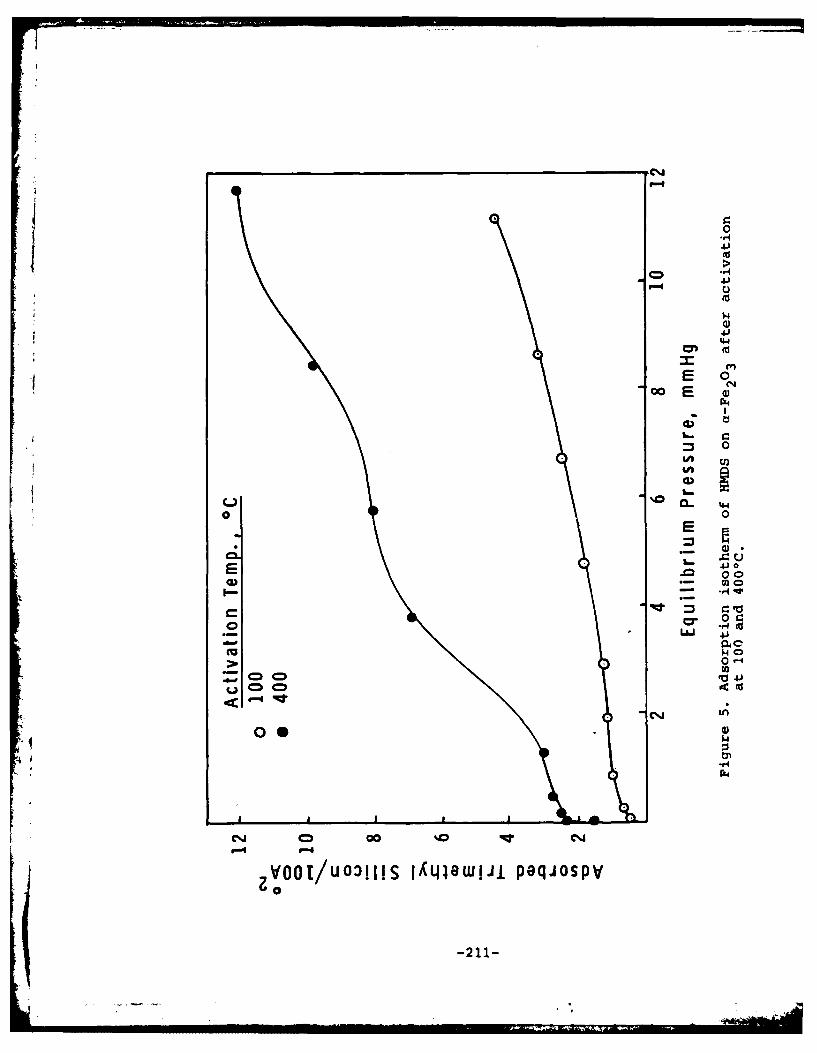
0.14
41
4dJ'44
0m
20
r1A14-4
4J 0
E 00
C2
Lo * q 00
0~
0 04C
00

-4 0 n 4 rN 4) 0)
'0041
41
r- 0% - 0
4J 0 01 0 4
0 0
-A 0to4i- 0 .- 400 N0
4) r4 >4J 41 0 n L n4
o4 -'4 0E-4 I 4-a 4
In 4 40 to*-
- 4 -AH) 1.4 U c -H 41H 4 0G V1 4.OD (0
:34. 0 0 C4) 0
0 .4Cl (4 '4 - f4 (4)
$41 aa .
4) 44
1~ 41 f
- 0)N v4a a- w n-
-44 -4 44Lo 1
w4 410 4
N1 01 I
a 4)
04 0 0 U) 04-r4 4J 14( 0
4J 4 a)0 0014 mb l
-2 12-
4)
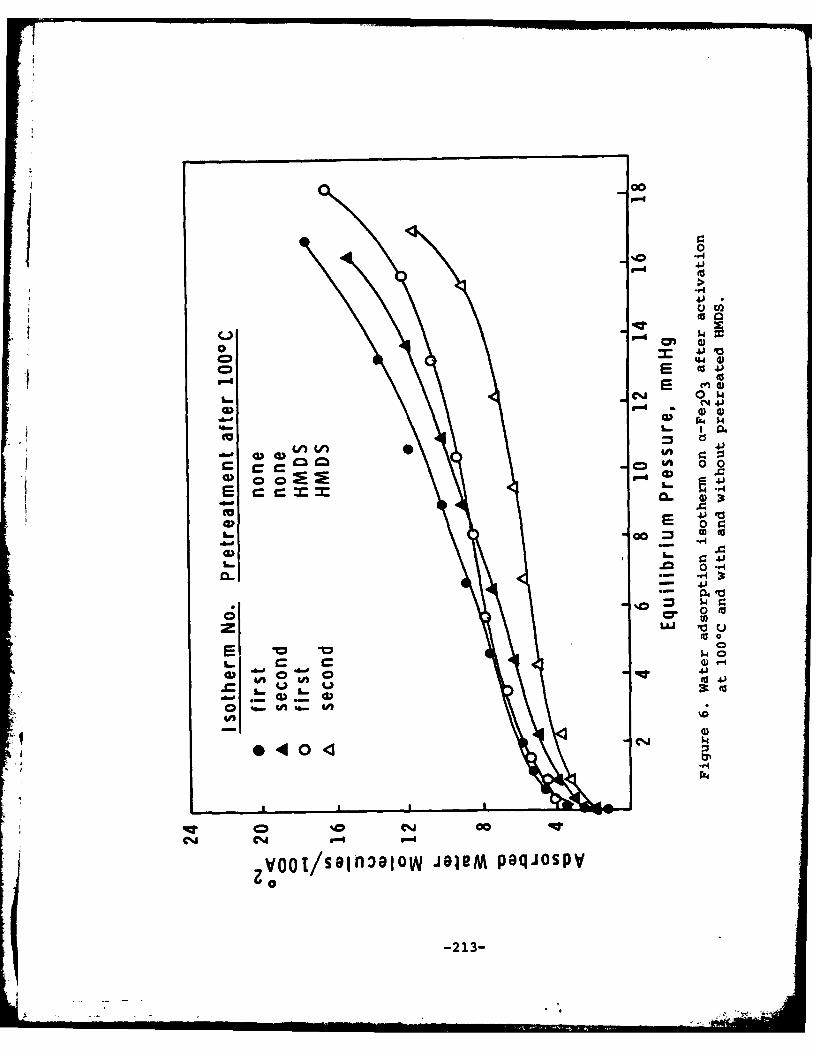
00
".0
1
0 41
C4 4JCD - a)
-~~ 0)r4~4JI~
CL 3
--
4)1
1iv 00
w -
4A A
o 0*z L.Z
2 o i/s a * a wjclMpqop
a- C 2134

000
P 2 4100-
L. 2 40
CI 4J
1 0
004
r4
4 .J
r 0. toLI
E IV
1.. 0
W2 (-3d.
U, *,
C~j cJ
~Vool/soln~otow joeM~ poqjospV
-214-

the positive or negative character of the surface, i.e., theproton donor or acceptor tendencies of surface functional groups.Surface hydroxyl groups which are amphoteric are known to bepresent on this surface, and high temperature can either dehy-droxylate the surface to Fe-O-Fe or change the electronegativityof the surface oxygen due to bulk changes in the crystal lattice.Dehydroxylation of the surface to Fe-O-Fe results in a surfacewhich is a proton acceptor, and hence an increase in the positivecharacter of the surface. The electrophoresis results in Figure8 show that the isoelectric point, IEP, i.e., the pH where theelectrophoretic mobility is equal to zero, decreases with in-creasing activation temperature. The interpretation of theseresults is that significant dehydroxylation of the surface doesnot occur at activation temperatures up to 400*C, which is con-
*sistent with the water adsorption results, but that the oxygenof the surface hydroxyls becomes more electropositive with in-creasing activation temperature and thus becomes stronger protondonors.
Electrophoresis measurements were made as a function of pHon a number of iron oxide compounds which were prepared byDr. Svetozar Musid and subsequently analyzed by him with Mss-bauer spectroscopic techniques. Although the interpretation ofresults is not yet complete, the results do point out some inter-esting trends and the utility of electrophoresis as an analyti-cal technique to investigate surface properties. The samplesinvestigated were Fe(OH)SO4 , a-Fe 203 , a mixture of 19.4% a-Fe2O3and 80.6% a-FeO(OH), and a mixture of 64.2% a-Fe20 and 35.8%FeO(OH). The results, Figure 9, show thata-Fe203 ?as an IEP ata pH of 5.7, which is in good agreement with previous measurements.The hydroxylation of this sample is entirely on the surface,while Fe(OH)SO4 and -FeO(OH) have hydroxyls in the crystalstructure. The Fe(OH)SO4 has the IEP at the lowest pH valuecompared to the other samples. The results for the other twosamples, which contain a mixture of a-Fe 203 and a-FeO(OH), showthat when a-Fe 203 is the dominant component, the IEP is close tothat of the pure material. Likewise, when a-FeO(OH) is dominant,the IEP is close to that of compounds containing OH groups in thecrystal lattice. These results suggest that it is possible touse electrophoresis as a tool for qualitatively distinguishingthe surface composition of corrosion products.
CONCLUSIONS
The gas adsorption results indicate that both a-Fe?0 3 andFe304 are relatively hydrophilic surfaces with Fe304 being themore hydrophilic. High temperature activation of c-Fe 203 above1000C results in the desorption of strong physically adsorbedwater which does not appear to increase with increasing tempera-ture. The strong physically adsorbed water is assumed to adsorbthrough hydrogen bonding with surface hydroxyls. There is no
-215-

4 -Fe 30 4
*N untreated
3 0 3000 C%o 4000 C
'! E
L 0
'1i -4
SI I I I2 4 6 8 10
pH
Figure 8. Electrophoretic mobility of Fe304 beforeand after 3000 or 4000C activation as afuntion of pH.
-216-

3H4
2.iiE
Q
L&J
-4
JI I I I I2 4 6 8 10
pHFigure 9. Electrophoretic mobility of Fe(OH)SO4 (0),
a-Fe 2 03 (), mixture of 19.4% a-Fe 2 03 and80.6% a-FeO(OH) (0), and mixture of 64.2%O -Fe2O3 and 35.8% a-FeO(OH) in the particle(0).
-217-

evidence of dehydroxylation of the c-Fe203 surface at activationtemperatures up to 400°C. The Fe203 surface shows similar be-havior in that high temperature activation up to 400*C also showssigns of desorption of strong physically adsorbed water. The firstand second water monolayer values, Wi and Wi respectively, how-ever, show a definite decreasing trend with increasing activationtemperature. This is interpreted as an irreversible decrease inthe surface hydroxyl concentration with increasing temperature.This decrease may be expressed as 8.46 water molecules/100 A2 forthe sample activated at 250C to 5.38 water molecules/100 12 forthe sample activated at 400°C. It is interesting to note thatfor the unactivated samples, Fe304 is more hydrophilic thana-Fe 203, and for the 4000C activated samples, a-Fe203 is more
hydrophilic than Fe304.
The HMDS treatment has a pronounced effect on decreasingthe surface hydrophilicity of a-Fe203, and probably by replacingthe proton of the surface hydroxyl with a trimethysilicon group.This effect is much more pronounced for the sample activated at400 0C than 1000C due to the fact that the irreversible adsorptionof HMDS is greater at the higher temperature. There appears tobe close to a one-to-one correlation between the concentration ofirreversibly adsorbed trimethylsilicon and the decrease in thesurface hydroxyl concentration as determined from analysis ofthe water adsorption isotherms.
-218-
'S

DAIE
FILMEI,