Embed Size (px)
Citation preview

University of ZurichZurich Open Repository and Archive
Winterthurerstr. 190
CH-8057 Zurich
http://www.zora.uzh.ch
Year: 2008
Flock flying improves pigeons' homing: GPS-track analysis ofindividual flyers versus small groups
Dell'Ariccia, G; Dell'Omo, G; Wolfer, D P; Lipp, H P
Dell'Ariccia, G; Dell'Omo, G; Wolfer, D P; Lipp, H P (2008). Flock flying improves pigeons' homing: GPS-trackanalysis of individual flyers versus small groups. Animal Behaviour, 76(4):1165-1172.Postprint available at:http://www.zora.uzh.ch
Posted at the Zurich Open Repository and Archive, University of Zurich.http://www.zora.uzh.ch
Originally published at:Animal Behaviour 2008, 76(4):1165-1172.

Flock flying improves pigeons' homing: GPS-track analysis ofindividual flyers versus small groups
Abstract
The effects of aggregation in navigating animals have generated growing interest in field and theoreticalstudies. The few studies on the effects of group flying on the performance of homing pigeons (Columbalivia) have led to controversial conclusions, chiefly because of the lack of appropriate technology tofollow pigeons during their entire homeward flight. Therefore, we used GPS data-loggers in six highlypre-trained pigeons from a familiar release site first by releasing them six times individually, then sixtimes as a group from the same site, and finally, again six times individually. Flight data showed that thehoming performance of the birds flying as a flock was significantly better than that of the birds releasedindividually. When flying in a flock, pigeons showed no resting episodes, shorter homing times, higherspeed, and almost no circling around the start zone in comparison to individual flights. Moreover,flock-flying pigeons took a nearly direct, “beeline” route to the loft, whereas individually flying birdspreferred to follow roads and other longitudinal landmarks leading towards the loft, even when it causeda detour. Our results show that group cohesion facilitates a shift towards more efficient homingstrategies: individuals prefer navigating by familiar landmarks, while flocks show a compass orientation.

Flock flying improves pigeons’ homing: GPS-track analysis of
individual flyers versus small groups
1
2
3
4
5
6
7
8
9
GAIA DELL’ARICCIA1, GIACOMO DELL’OMO1, DAVID P. WOLFER1,2 &
HANS-PETER LIPP1
1 Institute of Anatomy, University of Zurich
2 Department of Biology, Swiss Federal Institute of Technology, Zurich
Short Title for Running Headline: Dell’Ariccia et al.: Flock flying improves pigeons’
homing
10
11
12
Correspondence: G. Dell’Ariccia, Institute of Anatomy, University of Zurich,
Winterthurerstrasse 190, CH-8057 Zurich, Switzerland. (e-mail:
13
14
15
16
17
18
19
G. Dell’Omo, D.P. Wolfer and H.-P. Lipp, Institute of Anatomy, University of
Zurich, Winterthurerstrasse 190, CH-8057 Zurich, Switzerland.
Word count for the text: 3730 20

ABSTRACT 21
22
23
24
25
26
27
28
29
30
31
32
33
34
35
36
37
38
39
40
41
42
The effects of aggregation in navigating animals have generated growing interest in field
and theoretical studies. The few studies on the effects of group flying on the performance
of homing pigeons (Columba livia) have led to controversial conclusions, chiefly because
of the lack of appropriate technology to follow pigeons during their entire homeward
flight. Therefore, we used GPS data-loggers in six highly pre-trained pigeons from a
familiar release site first by releasing them six times individually, then six times as a
group from the same site, and finally, again six times individually. Flight data showed
that the homing performance of the birds flying as a flock was significantly better than
that of the birds released individually. When flying in a flock, pigeons showed no resting
episodes, shorter homing times, higher speed, and almost no circling around the start
zone in comparison to individual flights. Moreover, flock-flying pigeons took a nearly
direct, “beeline” route to the loft, whereas individually flying birds preferred to follow
roads and other longitudinal landmarks leading towards the loft, even when it caused a
detour. Our results show that group cohesion facilitates a shift towards more efficient
homing strategies: individuals prefer navigating by familiar landmarks, while flocks show
a compass orientation.
Keywords: Columba livia, GPS tracking, group flight, homing pigeon, landmarks,
leadership, “Many-wrongs principle”, navigation, road following, social cohesion.
2

43
44
45
46
47
48
49
50
51
52
53
54
55
56
57
58
59
60
61
62
63
64
Many animals spontaneously aggregate when foraging or when travelling. Aggregation
is commonly recognised to provide benefits for group members, for instance through
predation avoidance or improved foraging efficiency (Krause & Ruxton 2002). Recently,
there has been an increasing interest in the potential navigational advantages for animals
moving in groups (Simons 2004; Conradt & Roper 2005; Couzin et al. 2005; Hancock et
al. 2006, Codling et al. 2007).
According to the “Many-wrongs principle” (Bergman & Donner 1964; Hamilton 1967;
Wallraff 1978; Simons 2004) group cohesion allows a more accurate navigation because
individual errors are mutually corrected through information pooling. Such advantage of
group navigation found further support by theoretical models showing that even
experienced and informed individuals have a larger navigational error than the combined
error of several inexperienced group members (Conradt & Roper 2003).
Homing pigeons provide an optimal model for navigation research owing to their well
developed orientation capabilities and for the ease of their experimental manipulation
(Schmidt-Koenig 1980). Experimental studies have demonstrated the existence of
different orientation mechanisms (for a review see Walcott 2005). While there are
conflicting theories with respect to orientation mechanisms used by pigeons, the most
widely accepted notion is still Kramer’s “Map-and-Compass” model (1957). It holds that
displaced birds first determine their position (the map step) and then follow a homeward
course (the compass step). Ideally, this is the beeline from release site to the loft.
Calculation of this compass direction includes the position of the sun (if visible) and,
presumably, magnetic cues.
3

65
66
67
68
69
70
71
72
73
74
75
76
77
78
79
80
81
82
83
84
85
86
87
Pigeons that are repeatedly released from the same location generally improve homing
performance, reaching an asymptote after three to six releases (Graue 1965; Wallraff
2005). On the other hand, GPS tracking studies have shown that repeated releases from a
familiar location entails stereotyped routes during homing (Biro et al. 2004), often along
longitudinal landmarks such as highways and railroads (Lipp et al 2004).
The role of group flying on homing performance has been investigated in a limited
number of studies so far, and these have led to conflicting conclusions. Some of these
studies suggested that orientation in flock is more accurate than that of individual birds
(Hamilton 1967), with less-scattered vanishing bearings and shorter homing times (Tamm
1980). Contrarily, other experiments failed to demonstrate any improvement in
navigational accuracy of pigeons released in flocks (Keeton 1970; Benvenuti &
Baldaccini 1985). Part of these contradictions may reflect that these early studies were
conducted assessing directional information at the release site only, namely vanishing
bearings, and homing speed as the only performance variable.
The development of small GPS data-loggers now permits precise reconstruction of the
homeward journey of pigeons (Steiner et al. 2000; Von Hünerbein et al. 2000; Biro et al.
2002; Lipp et al. 2004), and thus a re-assessment of the problem.
In the present study, we compared homing performances of the same pigeons
successively released individually, in flock, and again individually, always from the same
site. All pigeons already were highly pre-trained from that release site to avoid increasing
familiarity confounds due to releases repetitions. Nonetheless, if flock navigation is
superior, one would expect an increase in homing performance in pigeons released in
flocks, and a subsequent performance drop upon reverting to the individual-release
4

88
89
90
schedule, even from a familiar release site. Our results, indeed, indicate that group
navigation is more efficient than that of individuals, chiefly because group flight corrects
the penchant of individual birds to follow suboptimal routes.
5

METHODS 91
92
93
94
95
96
97
98
99
100
101
102
103
104
105
106
107
108
109
110
111
112
113
Study Area and Facilities
Homing pigeons used for this study were kept in the facilities of the University of
Zurich at Testa di Lepre, Italy, 25 km NW of Rome (12.28° N; 41.93° E). There, in a
traditional farm setting, local homing pigeons were housed in 3 identical mobile lofts
equipped with aviaries (formerly Swiss Army) and cared for by an experienced breeder.
Pigeons of both sexes and with different flying experience were living in the same loft.
Food (a mixture of various cereals, peas, corn, and sunflower seeds sold commercially for
racing pigeons), grit and water were provided ad libitum. All birds were habitually
allowed to fly freely outside the lofts and they underwent regular training, which entailed
frequent handling. During training the birds were transported to various locations in all
directions in a range of 50 km from the loft and released in small flocks or individually.
Subjects and General Procedure
All the experimental releases took place between November 2005 and April 2006 under
sunny conditions, with no or light wind, from the release site Santa Severa (11.98° N;
42.03° E), 27 km NW of the home loft.
In this experiment we used six adult two-years-old pigeons (four males and two
females) which had been released from Santa Severa up to 20 times before the present
experiment took place and, thus, were in the asymptotic phase of their homing
performance (see also Graue 1965; Wallraff 2005).
6
114
115
116
117
118
119
120
121
122
123
124
125
126
127
128
129
130
131
132
133
134
135
136
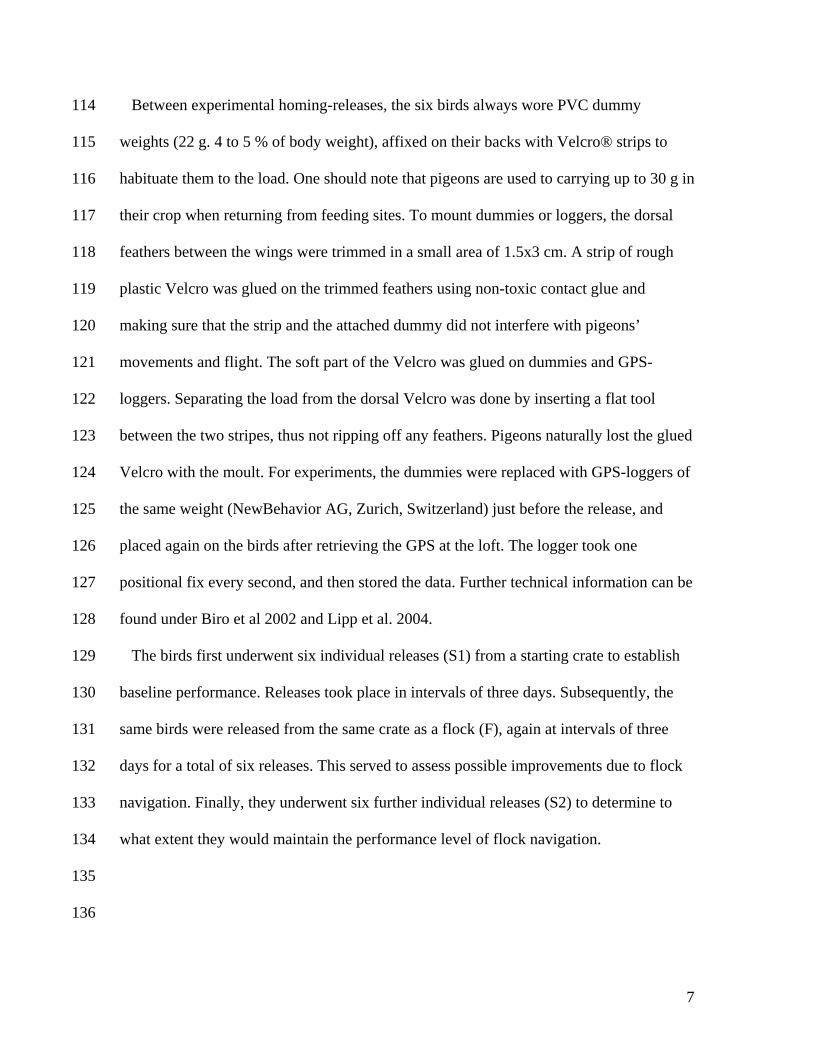
Between experimental homing-releases, the six birds always wore PVC dummy
weights (22 g. 4 to 5 % of body weight), affixed on their backs with Velcro® strips to
habituate them to the load. One should note that pigeons are used to carrying up to 30 g in
their crop when returning from feeding sites. To mount dummies or loggers, the dorsal
feathers between the wings were trimmed in a small area of 1.5x3 cm. A strip of rough
plastic Velcro was glued on the trimmed feathers using non-toxic contact glue and
making sure that the strip and the attached dummy did not interfere with pigeons’
movements and flight. The soft part of the Velcro was glued on dummies and GPS-
loggers. Separating the load from the dorsal Velcro was done by inserting a flat tool
between the two stripes, thus not ripping off any feathers. Pigeons naturally lost the glued
Velcro with the moult. For experiments, the dummies were replaced with GPS-loggers of
the same weight (NewBehavior AG, Zurich, Switzerland) just before the release, and
placed again on the birds after retrieving the GPS at the loft. The logger took one
positional fix every second, and then stored the data. Further technical information can be
found under Biro et al 2002 and Lipp et al. 2004.
The birds first underwent six individual releases (S1) from a starting crate to establish
baseline performance. Releases took place in intervals of three days. Subsequently, the
same birds were released from the same crate as a flock (F), again at intervals of three
days for a total of six releases. This served to assess possible improvements due to flock
navigation. Finally, they underwent six further individual releases (S2) to determine to
what extent they would maintain the performance level of flock navigation.
7

Data Analysis 137
138
139
140
141
142
143
144
145
146
147
148
149
150
151
152
153
154
155
156
157
158
159
The raw data were downloaded from the logger to a computer and analyzed first for
possible artefacts and irregularities of recording (program WINTRACK. Freeware D.P.
Wolfer at www.dpwolfer.ch/wintrack; Steiner et al. 2000; Wolfer et al. 2001). The
program then extracted the following variables: homing speed (average speed recorded
by GPS-logger during flight, excluding measures of speed of less than 5 km/h), flight
altitude, number and duration of rests (rests were defined as episodes longer than 5 sec
with GPS speed less than 5 km/h), total flying time, average distance to the beeline
between the release site and the loft, and number of km flown along the main roads and
the coast (episodes of road or coast following were defined as flying parallel to or at an
angle of <10° to the road/coastline at a distance of 200 m or less during at least 500m).
We also calculated the straightness index D/L for each track, in which D is the beeline
distance from the starting point to the goal, and L is the path actually followed by the
animal (Batschelet 1981; Benhamou 2004). This is a scale independent measure and,
given the high recording frequency of one positional fix per second, a reliable estimator
of the efficiency of the orientation process already used also by other authors (i.e. Biro et
al. 2004).
These parameters were analyzed using parametric and non-parametric procedures. In a
first step, simple Pearson product-moment correlations were used to check whether the
first series of six individual releases showed any improvement over asymptotic
performance during consecutive releases (x = order of releases per condition, y =
averaged score of the six birds). Likewise, this procedure was applied to the other
conditions to discover any effects of repeated releases.
8
160
161
162
163
164
165
166
167
168
169
170
171
172
173
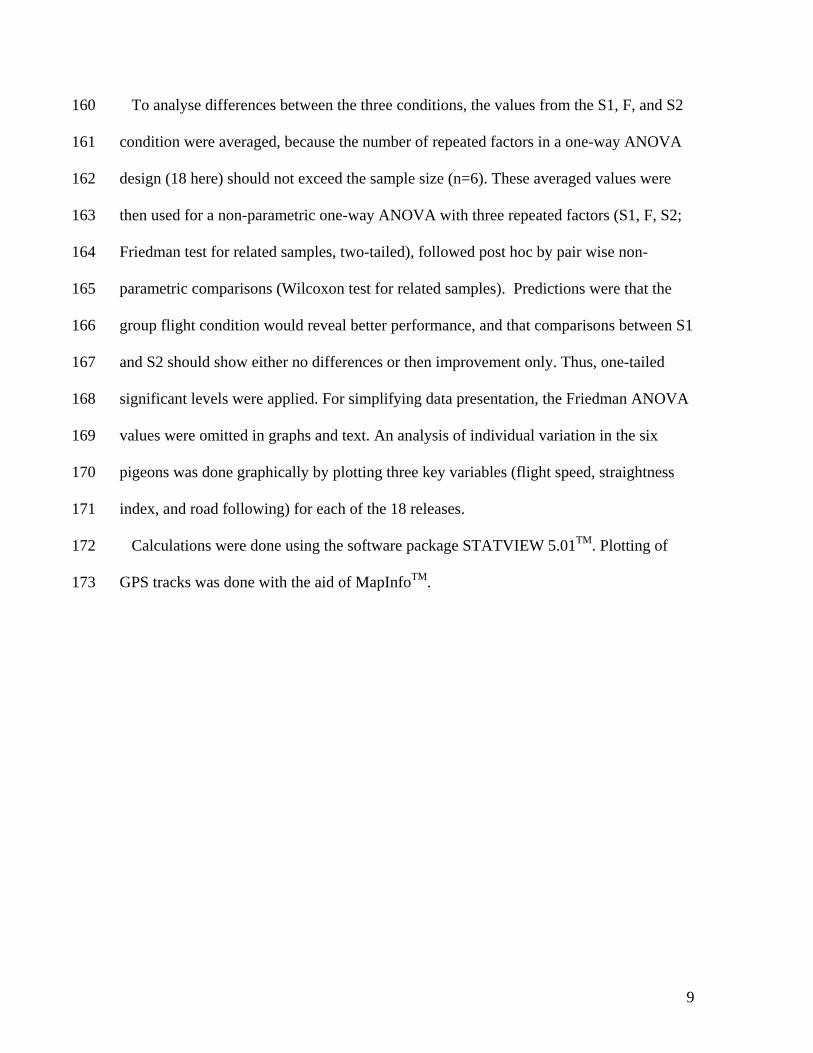
To analyse differences between the three conditions, the values from the S1, F, and S2
condition were averaged, because the number of repeated factors in a one-way ANOVA
design (18 here) should not exceed the sample size (n=6). These averaged values were
then used for a non-parametric one-way ANOVA with three repeated factors (S1, F, S2;
Friedman test for related samples, two-tailed), followed post hoc by pair wise non-
parametric comparisons (Wilcoxon test for related samples). Predictions were that the
group flight condition would reveal better performance, and that comparisons between S1
and S2 should show either no differences or then improvement only. Thus, one-tailed
significant levels were applied. For simplifying data presentation, the Friedman ANOVA
values were omitted in graphs and text. An analysis of individual variation in the six
pigeons was done graphically by plotting three key variables (flight speed, straightness
index, and road following) for each of the 18 releases.
Calculations were done using the software package STATVIEW 5.01TM. Plotting of
GPS tracks was done with the aid of MapInfoTM.
9

RESULTS 174
175
176
177
178
179
180
181
182
183
184
185
186
187
188
189
190
191
192
193
194
195
196
Overall, we conducted 107 releases out of the 108 planned (six pigeons released six times
in each of the three series of releases) with the GPS data-loggers and obtained complete
and technically valid tracks from all of them except for two tracks in the S1 series (p 613,
p830). For the last individual release in S2, one pigeon (p811) was excluded because it
had sustained injuries during the fifth release.
Figure 1 summarizes the main results in form of GPS tracks showing the first series of
single releases (S1, blue tracks), the flight paths of group releases, evident as one track
per group release as the pigeons flew together (F, red tracks), and the flight paths of the
same pigeons when released individually again (S2, green tracks). The tracks of singly
released birds, before and after group flights, were generally well oriented, but showed
considerable topographical scattering to the left and right of the beeline (a direct line
between release site and loft).
Prior to the group flights, this scatter was mainly towards the right side of the beeline
in a region rich in longitudinal landmarks pointing home, such as roads and railways. In
fact, as indicated by overlapping flight paths, the pigeons showed road following mostly
along the motorway A12.
When the same pigeons were released in groups of six, they flew much closer to the
beeline, but always followed somewhat different trajectories. In three of the six releases,
the pigeons flew closely together, from the releasing point to the loft; in two releases the
birds flew together but they split 1-3 km before the loft, following individual routes,
10
197
198
199
200
201
202
203
204
205
206
207
208
209
210
211
212
213
214
215
216
217
218
219
partially along a local road. During the first group release, the flock divided after about
10 km into individually flying birds; the particular path of splitting suggests a raptor
attack. However, they kept a relatively parallel course, not moving away more than one
km from each other, and they again formed a cohesive flock during subsequent flight, the
last pigeon to rejoin the group about seven km after the splitting. Thus, the splitting of the
terminal trajectories, and during the first group release, caused minor quantitative within-
group variation in the analysis of flight parameters.
In the individual releases subsequent to the group flights, S2, the flight trajectories
appeared again much more scattered. A number of flights appeared to have shifted to the
north into a region that does not contain structural cues leading homewards. Some
overlapping of tracks (implying development of new route preferences) was noted in
these regions, too, albeit less than in the S1 condition.
The comparison across the six successive releases of S1 for each individual pigeon
failed to detect any systematic trend in repeated flights, indicating that the pigeons had
already reached asymptotic (yet not invariant) homing performance from this familiar
site. Three of the birds (601, 811,823) showed high yet not temporally ordered variability
in flight speed, straightness index, and road following, while the others (613, 830, 848)
performed relatively constantly (Fig. 4).
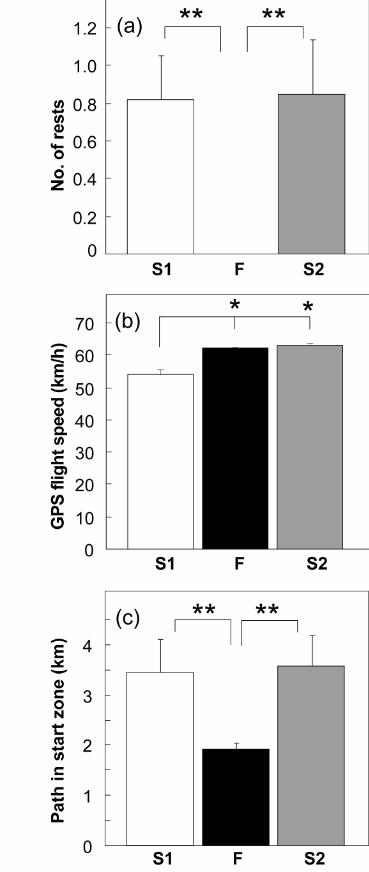
The overall comparison of flock-versus-individual releases revealed significant
differences in a number of variables. When pigeons were group-released they invariably
flew to the loft without any resting episode. Contrarily, when released individually some
of the pigeons took a rest on the way home (Fig. 2a). Moreover, the actual flight speed
recorded by GPS-loggers showed that flocks flew faster than did most of their members
11
220
221
222
223
224
225
226
227
228
229
230
231
232
233
234
235
236
237
238
239
240
241
242
during individual S1 releases, with the exception of one release when pigeons 601 and
811 flew faster than the flocks (see also Fig. 4). During flock flights, speed was
increasing significantly over releases (r = 0.82, p < 0.05, n = 6; x = order of releases, y =
average speed of birds per release). Individual birds then maintained this average group
flight speed during the S2 releases (Fig. 2b), possibly indicating a physical training effect.
Measures of path geometry revealed a more efficient navigation for group flights; the
path to leave the start zone (defined as the distance flown before leaving a circle of 1 km
radius about the release point) was significantly shorter when pigeons flew as a flock than
in the two series of individual releases (Wilcoxon signed-rank test, one-tailed: p = 0.023
for S1 vs. F, and F vs. S2). There was no significant difference between the two series of
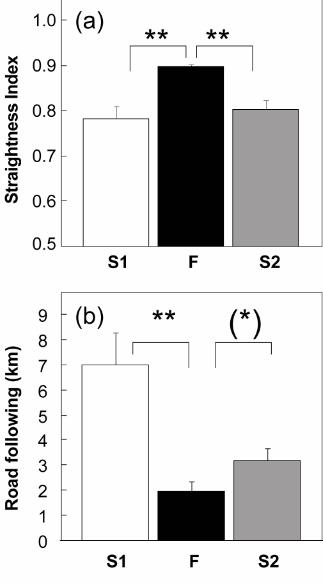
individual releases (Fig. 2c). Likewise, the straightness index was significantly higher in
flocks, indicating a more linear way home (Wilcoxon signed-rank test, one-tailed: p =
0.014 for S1 vs. F, and F vs. S2), than in both series of individual releases, with no
statistical difference between the latter (Fig. 3a). The average distance of the track from
the beeline between release site and loft was shorter when pigeons were flying as a flock
than in the first series of individual releases (Wilcoxon signed-rank test, one-tailed: p =
0.014). Again, S2 pigeons showed an average increase of the distance to the beeline as
compared to F1 condition, yet non-significantly (Wilcoxon signed-rank test, one-tailed: p
= 0.058).
To find reasons for the prolonged flight paths of singly flying birds, we also measured
the total cumulative length of flight tracks along longitudinal landmarks, such as
highways, roads, and coastline (known to be followed by pigeons released from this
place, Lipp et al. 2004). Individually flying pigeons in S1 flew along the main roads
12

243
244
245
246
247
248
249
250
251
252
253
254
255
256
257
258
259
260
261
262
263
264
265
(particularly the highway) significantly more than flock-flying pigeons (Wilcoxon
signed-rank test, one-tailed: p < 0.07). In the S2 condition, road-following increased non-
significantly as compared to the F condition (Wilcoxon signed-rank test, one-tailed: p =
0.058) (Fig. 3b). An analysis of correlations, however, showed a significant reduction of
road following over consecutive releases (r = -0.87, p < 0.05, n=6; x = order of S2
releases, y = average road-following scores per release).
No differences were observed in flight altitude.
A graphical inspection of individual variation in three key variables (flight speed,
straightness index, and road following. Fig. 4) largely confirmed the results of the
ANOVA using averaged data, but revealed some interesting aspects. For example, two
pigeons (601 and 811) showed, during the fourth S1 release, high flight speed, and a
flock-like straightness index. During the following release, however, they were much
slower and showed a high road following score.
Between-release variation of measures in the flock condition showed a much more
homogeneous performance than for both individual-release conditions. However, a
clearly lower straightness index was observed for the last of the group releases, indicating
a suboptimal group trajectory on that day, although homing speed and road following
were not affected. A detailed analysis of GPS tracks revealed that the flock, while
following approximately the beeline, performed a series of loops and turns over the first 3
km from the release site, as it is was often observed in singly released pigeons.
The analysis of individual transitions from flock releases to individual releases showed
that flight speed and straightness index dropped most distinctly during the first or second
release after flock conditions, during which 4 pigeons also increased their road following
13

266
267
268
269
270
score. Thereafter, four of the six pigeons (601, 613, 823, 848) regained a straightness
index that was comparable or only slightly inferior to the flock condition. While this
temporary impairment resulted in significant (non-parametric) group differences for the
averaged values between the F and the S2 condition, it also indicates that the pigeons did
not lose their ability for well-directed homing.
14

DISCUSSION 271
272
273
274
275
276
277
278
279
280
281
282
283
284
285
286
287
288
289
290
291
292
293
Our data demonstrate superior homing performance of pigeons released in small flocks as
compared to pigeon released individually, even when tested in releases from a highly
familiar location. In comparison to individual flights, pigeons in a flock left the release
site faster, flew generally faster, made no stops, and showed improved directionality
during their homeward flight. For one, this confirms the predictions of the many-wrongs
principle and other models of group navigation predicting cancelling of individual
navigational errors (Bergman & Donner 1964; Simons 2004; Codling et al. 2007).
In this study, the homing performance of pigeons is a compound of initial flight
behaviour at the release site, actual flight speed, number of rests, and navigational
accuracy during homing. It is unlikely, however, that all these parameters can be
classified only as mutually cancelling navigational errors. Prolonged circling around the
release site may be taken as an indicator of directional uncertainty. But, since the release
site was thoroughly familiar, it is more likely to reflect the tendency of waiting for a
companion bird. Likewise, stops during flight may be caused by orientation problems, by
lack of flight motivation or, again, by waiting for a companion. The changes in these two
variables suggest, at least in part, motivational problems associated with the individual
flight condition, particularly so as they are observed after successive fast and efficient
flock homing. Thus, flying in flocks appears, somehow, to increase homing motivation.
This conclusion is supported by the observation that reverting from flock to individual
flight condition caused a drop in homing performance during the first release of the S2
15
294
295
296
297
298
299
300
301
302
303
304
305
306
307
308
309
310
311
312
313
314
315
316
condition, while pigeons attained levels comparable to flock flight afterwards, mostly
regarding homing speed.
On the other hand, the improvement in directionality observed in flock flying pigeons,
and the lower variability of all measured variables, is in agreement with superior flock
navigation predicted by group navigation models (Bergman & Donner 1964; Simons
2004; Codling et al. 2007). However, in such models directional errors are assumed to be
random. In our case, the directional error is a systematic bias introduced by previous
development of individual stereotyped routes, typically observed after repeated releases
from a familiar location (Biro et al. 2004; Lipp et al. 2004). The reasons underlying
development of stereotyped routes are still unclear. These directional biases cannot be
qualified as actual navigational errors (the birds return reliably), but may be considered as
a suboptimal homing strategy. Nevertheless, flock flying significantly reduces such
individual directional biases. Based on these findings, one can probably expect larger
corrections by group flights in releases from unfamiliar sites, where the probability of
true navigation errors is higher.
It is important to note that, occasionally, individually flying pigeons were able to show
almost perfect homing in terms of directionality and speed. This indicates that
individually flying pigeons, released from a familiar site, can choose between following a
rather precise compass direction, or alternatively follow landmarks providing a
suboptimal but predictable way home. In the majority of cases, pigeons flying alone seem
to prefer such route following, while this strategy is shown by flocks only occasionally.
Thus, flying in flocks appears to shift the balance between homing strategies in favour of
compass navigation that is always used by pigeons from unfamiliar sites.
16

317
318
319
320
321
322
323
324
325
326
327
328
329
330
331
332
333
334
335
336
337
338
339
Homing pigeons have an innate tendency to group when flying due to their evolution
and breeding history (Schmidt-Koenig 1980), and group cohesion is actively kept. GPS
tracks show that the splitting of groups rarely occurs, and if so, subgroups may separate
up to 1 km before joining each other, as observed during the first group release. At least
in small flocks, group cohesion prevents landing and rests of individual flock members,
and also drives pigeons to adopt flight speeds they would not maintain while flying alone.
Future research should investigate whether there are changes in some measurable
physiological parameter, such as physical effort or stress, among pigeons released
individually or in flocks.
The reasons why flock flying pigeons abandon acquired route strategies in favour of
(superior) compass orientation are unknown. One possible explanation is that flock
flying pigeons must pay visual attention to their companions for maintaining flock
cohesion, thusly cancelling the attraction of landmarks, and possibly also the influence of
other distracting visual cues. In consequence, the flock maintains the compass direction
to the loft better than individually flying pigeons. This idea needs to be tested, but
preliminary data from EEG recording in flock versus individually flying pigeons shows
less attentional EEG responses of flock flying birds when passing familiar landmarks
(Vyssotski et al. unpublished).
A possible alternative explanation of superior homing performance of flocks is the
presence of a leader bird with better navigational abilities, leading the companions home.
Since the precision of the GPS used did not allow testing this hypothesis directly, we
checked for every release the rank order of the pigeons according to their performance. In
the case of a typical leader dictating speed and direction of the flock, the leader bird
17

340
341
342
343
344
345
346
347
348
349
should have consistent performance in individual and group flights. However, we failed
to identify a pigeon with constant superior performance. This observation corresponds to
previous results showing increased performance in all pigeons (Benvenuti & Baldaccini
1985, Biro et al. 2006).
In conclusion, flying in small flocks has an important positive effect on homing
performance, in terms of navigational accuracy, speed, and motivation, even in releases
from highly familiar release sites. GPS tracking evidences that pigeons can dynamically
shift between different coexisting strategies: individually flying pigeons show a greater
reliance on topographical features for homing, keeping habitual home routes, while flocks
tend to adopt a compass-based navigation.
18
ACKNOWLEDGEMENTS 350
351
352
353
354
355
356
357
We thank Cesare & Maria Calderoni and Hans Cattin for expert care of pigeons, Phillip
Hendrickson for proofreading, the Swiss Homing Pigeon Foundation for providing
mobile lofts, and two anonymous referees for helpful comments on the manuscript. This
work was supported by the Swiss National Science Foundation and the NCCR “Neural
Plasticity and Repair”.
19

REFERENCES 358
359
360
361
362
363
364
365
366
367
368
369
370
371
372
373
374
375
376
377
378
379
380
381
382
383
Batschelet, E. 1981. Circular statistics in biology. London: Academic Press.
Benhamou, S. 2004. How to reliably estimate the tortuosity of an animal's path:
straightness, sinuosity, or fractal dimension? Journal of Theoretical Biology, 229,
209-220.
Benvenuti, S. & Baldaccini, N. E. 1985. Pigeon orientation: a comparison between
single birds and small flocks. Ornis Scandinavica, 16, 45-48.
Bergman, G. & Donner, K. O. 1964. An analysis of the spring migration of the common
scoter and the long-tailed duck in southern Finland. Acta Zoologica Fennica, 105,
1-59.
Biro, D., Guilford, T., Dell'Omo, G. & Lipp, H.-P. 2002. How the viewing of familiar
landscapes prior to release allows pigeons to home faster: evidence from GPS
tracking. J Exp Biol, 205, 3833-3844.
Biro, D., Meade, J. & Guilford, T. 2004. Familiar route loyalty implies visual pilotage in
the homing pigeon. PNAS, 101, 17440-17443.
Biro, D., Sumpter, D. J. T., Meade, J. & Guilford, T. 2006. From compromise to
leadership in pigeons homing. Current Biology, 16, 2123-2128.
Codling, E. A., Pitchford, J. W. & Simpson, S. D. 2007. Group navigation and the
"Many-wrongs principle" in models of animal movements. Ecology, 88, 1864-
1870.
Conradt, L. & Roper, T. J. 2003. Group decision making in animals. Nature, 421, 155-
158.
Conradt, L. & Roper, T. J. 2005. Consensus decision making in animals. Trends in
Ecology and Evolution, 20, 449-456.
20
384
385
386
387
388
389
390
391
392
393
394
395
396
397
398
399
400
401
402
403
404
405
406
407
408
Couzin, I. D., Krause, J., Franks, N. R. & Levin, S. A. 2005. Effective leadership and
decision making in animal groups on the move. Nature, 433, 513-516.
Graue, L. C. 1965. Experience effect on initial orientation in pigeon homing. Animal
Behaviour, 13, 149-153.
Hamilton, W. J. 1967. Social aspects of bird orientation mechanisms. In: Animal
Orientation and Navigation (Ed. by Storm, R.), pp. 57-71: Oregon State Univ.
Press.
Hancock, P. A., Milner-Gulland, E. J. & Keeling, M. J. 2006. Modelling the many-
wrongs principle: the navigational advantages of aggregation in nomadic
foragers. Journal of Theoretical Biology, 240, 302-310.
Keeton, W. T. 1970. Comparative orientational and homing performances of single
pigeons and small flocks. Auk, 87, 797-799.
Kramer, G. 1957. Experiments in bird orientation and their interpretation. Ibis, 99, 196-
227.
Krause, J. & Ruxton, G. D. 2002. Living in groups. Oxford: Oxford Univ. Press.
Lipp, H.-P., Vyssotsky, A. L., Wolfer, D. P., Renaudineau, S., Savini, M., Tröster, G.
& Dell'Omo, G. 2004. Pigeon homing along highways and exits. Current Biology,
14, 1239-1249.
Schmidt-Koenig, K. 1980. Das Rätsel des Vogelzugs. Faszinierende Erkenntnisse über
das Orientierungsvermögen der Vögel. Hamburg: Hoffman und Campe Verlag.
Simons, A. M. 2004. Many wrongs: the advantage of group navigation. Trends in
Ecology and Evolution, 19, 453-455.
Steiner, I., Bürgi, C., Werffeli, S., Dell'Omo, G., Valenti, P., Tröster, G., Wolfer, D. P.
& Lipp, H.-P. 2000. A GPS logger and software for analysis of homing in
pigeons and small mammals. Physiology & Behavior, 71, 589-596.
21
409
410
411
412
413
414
415
416
417
418
419
420
421
Tamm, S. 1980. Bird orientation: single homing pigeons compared with small flocks.
Behavioral Ecology and Sociobiology, 7, 319-322.
Von Hünerbein, K., Hamann, H. J., Rüter, E. & Wiltschko, W. 2000. A GPS-based system for
recording the flight paths of birds. Naturwissenschaften, 87, 278-279.
Walcott, C. 2005. Multi-modal orientation cues in homing pigeons. Integrative and
Comparative Biology, 45, 574-581.
Wallraff, H. G. 1978. Social interrelations involved in migratory orientation of birds:
possible contributions of field studies. Oikos, 30, 401-404.
Wallraff, H. G. 2005. Avian Navigation: Pigeon Homing as a Paradigm.: Springer-
Verlag.
Wolfer, D. P., Madani, R., Valenti, P. & Lipp, H.-P. 2001. Extended analysis of path
data from mutant mice using the public domain software Wintrack. Physiology
and Behavior, 73, 745-753.
22

Figure legends 422
423
424
425
426
427
428
429
430
431
432
433
434
435
436
437
438
439
440
441
442
443
Figure 1. GPS tracks of homing pigeons between the release site (R) and the home loft
(H). Blue tracks: 36 individual flights of six experienced pigeons released six times,
condition S1. Red tracks: 6 group releases of the same six pigeons as a flock (apparent as
one track per release because pigeons not split from the flock), condition F. Green tracks:
35 individual flights performed after the group releases, condition S2. Note the larger
dispersal of flight paths under individual-release conditions S1 and S2. During S1, many
flight paths coincide with roads. Tracks of group flight (red) do not coincide. During S2,
some degree of coincidence of green tracks in regions devoid of roads pointing
homewards is observed.
Figure 2. (a) Average number of rests during flight. Flock-flying pigeons never stopped,
but individually released pigeons did so, both before and after the group flights. (b)
Average homing speed recorded by the GPS-logger. Flock flying improved homing speed
with respect to individual releases; after flying in flocks pigeons maintained the higher
flight speed in the S2 condition. (c) Path to leave start zone (defined as the distance flown
before leaving a circle of 1 km radius around the release point). Individually released
birds fly significantly more within the start zone before leaving. Bars indicate means and
S.E.M. ** p < 0.025. S1: individual flights; F: group flights; S2: individual flights after
group releases.
23
Figure 3. (a) Straightness index. Flock flying pigeons maintained a straighter course
homewards. (b) Road following scores showing loss of road and coastline following
during group flight, resulting in improved directionality homewards. After the flock
flights, the routes of individually released pigeons (S2) appeared to be shifted to the north
(see Fig. 1) where conspicuous longitudinal landmarks such as roads pointing homewards
are scarce. Bars indicate means and S.E.M. ** p < 0.025. S1: individual flights; F: group
flights; S2: individual flights after group releases.
444
445
446
447
448
449
450
451
452
453
454
455
456
457
458
459
Figure 4. Individual scores for homing speed, straightness index, and road following
across different releases plotted for the six pigeons (p601, p613, p811, p823, p830, p848).
The corresponding but averaged values per condition and related statistics are shown in
Figures 2b, 3a, and 3b. All Y-values show the same scale for comparison. White dots:
first series of individual releases (condition S1). Black dots: flock releases (condition F).
Grey dots: second series of individual releases, performed after the flock releases
(condition S2). (p613 and p830 have five S1 releases condition because of a corrupted
track recorded by GPS; p811 has five S2 releases because it sustained injuries).
24