Embed Size (px)
Citation preview

University of Westminster Eprints http://eprints.wmin.ac.uk Determinants of Foreign Direct Investment in Ethiopia: a time-series analysis. Getinet Haile* Hirut Assefa Policy Studies Institute * Getinet Haile now works within the Westminster Business School
This is an electronic version of a paper presented at the 4th International Conference on the Ethiopian Economy, 10-12 Jun 2006, Addis Ababa, Ethiopia. The Eprints service at the University of Westminster aims to make the research output of the University available to a wider audience. Copyright and Moral Rights remain with the authors and/or copyright owners. Users are permitted to download and/or print one copy for non-commercial private study or research. Further distribution and any use of material from within this archive for profit-making enterprises or for commercial gain is strictly forbidden. Whilst further distribution of specific materials from within this archive is forbidden, you may freely distribute the URL of the University of Westminster Eprints (http://eprints.wmin.ac.uk). In case of abuse or copyright appearing without permission e-mail [email protected].
Determinants of Foreign Direct Investment in Ethiopia: A time-series analysis
Getinet Astatike† & Hirut Assefa Paper prepared for the 4th International Conference on the Ethiopian Economy, June
2005
Abstract In their attempt to attract Foreign Direct Investment (FDI), most African countries have liberalised trade and attempted to create enabling environment in recent decades. Ethiopia, like many African countries, took some steps towards liberalising trade and the macroeconomic regime as well as introducing some measures aimed at improving the FDI regulatory framework. This paper attempts to study the nature and determinants of foreign direct investment in Ethiopia over the period 1974-2001. The study gives an extensive account of the theoretical explanation of FDI as well as reviewing the policy regimes, the FDI regulatory framework and institutional set up in the country over the study period. It also undertakes empirical analysis to establish the determining factors of FDI in Ethiopia. Our findings show that growth rate of real GDP, export orientation, and liberalisation, among others, have positive impact on FDI. On the other hand, macroeconomic instability and poor infrastructure have negative impact on FDI. These findings imply that liberalisation of the trade and regulatory regimes, stable macroeconomic and political environment, and major improvements in infrastructure are essential to attract FDI to Ethiopia. Key words: FDI, Ethiopia JEL Classifications: F21, F23, O55
† Address for correspondence: Policy Studies Institute, 50 Hanson Street, London W1W 6UP. Tel: 020 7911 7504, Fax: 020 7911 7501; Email: [email protected].
1. Introduction
Foreign direct investment is one of the most striking features of the global economy today. The rapid growth in FDI over the last few decades has spurred a large body of empirical literature to examine the determinants and the growth enhancing effects of FDI. The effects of FDI can be wide ranging since FDI typically encompasses packages of capital as well as technical, managerial and organisational know-how. FDI is particularly important for developing countries since it provides access to resources that would otherwise be unavailable to these countries. Its contribution to economic development and therefore poverty reduction comes through its role as a conduit for:2
� Transferring advanced technology and organisational forms to the host country;
� Triggering technological and other spillovers to domestically owned enterprises;
� Assisting human capital formation; � Contributing to international trade integration; and � Helping to create a more competitive business environment.
As a result of these benefits of FDI, many developing countries are now actively seeking foreign investment by taking measures that include economic and political reforms designed to improve their investment environment.3 In Ethiopia, the gap between domestic investment and savings has remained wide due to the low levels of income and domestic savings. FDI as a source of capital and other business know-how is therefore desperately essential to finance growth and development. Between 1990 and 1997, gross domestic investment as a proportion of GDP rose from 12 per cent to 19 percent, while gross domestic savings remained at the same rate4. This saving gap can be filled by loans and development assistance from multilateral agencies such as the World Bank or by private foreign investment. However, the former sources of official finance have been declining. It has been reported that development assistance to Sub-Saharan Africa declined from $17 billion in 1990 to $ 10 billion.5 Given this, FDI is the most important alternative source of foreign capital for these countries.6 In view of this important role of FDI, it is essential to understand the principal determinants of FDI in these countries in general and Ethiopia in particular. Different factors including the level of economic development of an economy, the policy regime in place, social and political factors may play a role in determining the inflow of foreign direct investment. In recent years, Ethiopia has started encouraging the inflow of FDI by improving the investment climate and by providing different incentive packages. This study aims to:
2 Ikiara (2003) 3 Nonetheless, Africa remains to be the least attractive as a FDI destination due to “heavy legal burdens and piecemeal reforms” (see, for example, recent WB reports on ‘Doing Business’). 4 UNCTAD,(2002) 5 Asiedu,(2003) 6 In addition, FDI makes possible the transfer of technology and skills which may not necessarily form part of development assistance.

3
� Review the economic and FDI performance of Ethiopia; � Empirically investigate the determinants of FDI inflows in to the
country; and � Highlight some of the policy issues thought to be essential for
attracting FDI to Ethiopia. The two main approaches used in this study involve a review of existing theoretical and empirical literature on foreign direct investment and an empirical investigation of the determinants of foreign direct investment in Ethiopia. The paper has six sections. Section two reviews the theoretical and empirical literature on foreign direct investment. Section three focuses on the review of the economic policy regimes in Ethiopia and their possible impacts on FDI. Section four is devoted to the discussion of the data used and the empirical methodology employed. Section five discusses the results obtained from the empirical exercise. The final section concludes the paper summarising the main findings of the paper and making some policy recommendations. 2. Literature review As noted in the introduction, the crucial role of FDI in terms of capital formation, spillover effects on trade and technological progress has led to the development of theoretical and empirical literatures which have focused on identifying the possible determinants of FDI. This section provides a survey of the theoretical and empirical literature on FDI. 2.1 Theoretical explanations of FDI The theoretical explanations of FDI largely stem from traditional theories of international trade that are based on the theory of comparative advantage and differences in factors endowments between countries. Multinational companies are usually attracted to a particular country by the comparative advantage that the country or region offers. For instance, multinational companies may establish foreign subsidiaries in one country to take advantage of its lower labour costs or its large market size. Thus, in their basic form, traditional theories of international trade do offer some explanation of FDI. Nonetheless, the traditional trade theories do not provide full answers as to why multinational companies prefer to operate in a foreign country rather than engaging in exporting or licensing, which are alternatives to FDI. This has led to the development of alternative explanations of FDI. The theory of portfolio investment (the neoclassical financial theory of portfolio flows) is one of the earliest explanations of FDI. The basis for this explanation lies in interest rate differentials between countries. Capital, according to this explanation, moves in response to changes in interest rate differentials between countries/regions and multinational companies are simply viewed as arbitrageur of capital from countries where its return is low to countries where it is high. This explanation, however, fails to account for the cross movements of capital between/across countries. In practice, capital moves in both directions between countries. In addition,

4
that capital is only a complementary factor in direct investment and that this theory does not explain why firms go abroad contribute to the criticism of the neoclassical theory of portfolio investment (Harrison et al, 2000). Vernon’s product life cycle theory is another explanation of FDI worthy of some discussion. This theory focuses on the role of innovation and economies of scale in determining trade patterns. It states that FDI is a stage in the life cycle of a new product from its invention to maturity. A new product is first manufactured in the home country for the home market. When the home market is saturated, the product is exported to other countries. At later stages, when the new product reaches maturity and loses its uniqueness, competition from similar rival products becomes more intense. At this stage producers would then look for lower cost foreign locations. This theory shows how market seeking and cost reduction motives of companies lead to FDI. It also explains the behaviours of multinational companies and how they take advantage of different countries that are at different levels of development. Additionally, it has been noted that Vernon’s theory perceives foreign direct investment as a defensive strategy by firms to protect their existing market position (Dunning 1993). Knickerbocker (1973), following Vernon’s theory, argues that there is follow-the-leader type of defensive FDI especially in industries characterised by oligopoly. His argument relies on uncertainty and risk aversion behaviour of oligopolists. This theory suggests that firms go abroad because of oligopolistic reaction which is “an interactive kind of corporate behaviour by which rivals in industries composed of a few large firms counter one another’s moves by making similar moves themselves” (Knickerbocker, 1973). However, this theory does not explain why FDI is more efficient than exporting or licensing for expanding abroad. Hymer’s (1976) pioneering study on multinational companies draws attention to the role of multinational companies as global industrial organisations. Hymer’s major contribution was to shift attention away from neoclassical financial theory. He argued that the need to exercise control over operation is the main motive for FDI than the mere flow of capital. Capital is used to facilitate the establishment of FDI rather than an end in itself. He states that for firms to engage in cross border activities, they must possess some kind of monopolistic advantages. The advantages result from a foreign company’s ownership of patents, know how, managerial skills and so on and these advantages are unavailable to local companies. His argument relies on the existence of market imperfections, such as difficulty of marketing and pricing know how, or in some cases markets may not exist for such products, or if they exist, they may involve huge transaction costs or time-lags. In such cases it would be more efficient for the company to engage in direct investment than exporting or licensing. FDI will allow the companies to control and exploit their monopoly power to the full. Hymer’s argument led the way to the development of internalisation theory. According to this theory the firms internalise their activities whenever there are inefficiencies in dealing with the external market and FDI would occur when this internalisation involves operation across countries (Harrison et al, 2000). By incorporating Hymer’s explanations and various other theories of FDI, Dunning’s eclectic paradigm provides a general explanation for the determinants of FDI. Dunning (1993) identified three factors which must be satisfied before engaging in cross border activities.

5
� The ownership advantages of a firm: These advantages are firm specific as
they are assumed to be exclusive to the firm that owns them. These advantages arise from firms possessing proprietary technology or other unique intangible assets, and the firm’s ability to coordinate complementary activities such as manufacturing and distribution. These kinds of advantages give foreign firms more power over their local counterparts.
� Internalisation advantages: These advantages refer to the firm’s ability to internalise its activities, which can be done through market transactions. Through internalisation, the firm can reduce its transaction costs. Moreover, the firm can retain exclusive rights to its assets and it maintains its competitive advantage.
� Location specific advantages: these advantages include host countries natural resource endowments, superior infrastructure, and macroeconomic stability. These location advantages determine the profitability with which the ownership advantage and internalisation advantage of the firm should be combined.
From these three advantages if only one is met, then firms will rely on exports, licensing or the sale of patent, to service foreign markets. Thus, the generalised predictions of the eclectic theory are that a firm can only capture a foreign market through FDI if it has the capacity to exploit simultaneously all the three advantages. In Dunning’s eclectic theory, the ownership and internalisation advantages are firm specific features whilst the location advantages are country specific characteristics which the host country can influence directly. In general, countries that have location advantages can attract more FDI. But firms do not undertake FDI only for the presence of location specific advantages in the host country. Their location choice decisions consider the profitability with which the ownership and internalisation advantage can be combined with the location ones. Dunning (1993) pointed out that the principal objective of firms in undertaking foreign production is to advance their long-term profitability. In addition to the profitability motives, some firms may undertake FDI as part of their corporate strategies. For instance, firms may try to spread or reduce risks, and to match competitors’ actions. In general Dunning (1993) identified three possible motives for FDI:
� Market seeking FDI: refers to FDI for the purpose of serving local and regional markets. Host countries’ characteristics that can attract market-seeking FDI include market size of the host country, per capita income and growth (potential) of the market.
� Resource/asset seeking FDI: refers to FDI for the purpose of acquiring resources which are not available in the home country. Such resources include natural resources, availability of raw materials, and productivity and availability of skilled and unskilled labour.
� Efficiency seeking FDI: This kind of FDI occurs when the firm can gain from the common governance of geographically dispersed activities, especially in the presence of economics of scale and scope and diversification of risk.
The above three motives of FDI are categorised under economic determinants of FDI. Besides these economic determinants, there are also two other crucial

6
determinants of FDI: host country FDI policy framework and business facilitation. According to the 1998 World Investment Report, the policy framework for FDI includes: economic, political and social stability, rules regulating entry and operation of FDI, standard of treatment of foreign affiliates, policies on functioning and structure of the markets, international agreement on FDI, privatisation policy, trade policy and tax policy. Business facilitation refers to the ease with which business can be conducted in the host country. The most important business facilitations include investment promotions and incentives, hassle costs related to corruption and administrative efficiency, development of financial institutions, enforceability of contracts and protection of property rights, and quality of life (UNCTAD, 1998).
2.2 Empirical evidence on the determinants of FDI7
On the determinants of FDI in Africa, most studies argue that FDI inflow is attracted largely by natural resource endowments. Almost 40 percent of FDI has been in the primary sector, particularly oil and mineral extraction business. Countries like Angola, Botswana, Namibia and Nigeria have received foreign investment targeted at the oil and minerals sectors of their economy (Basu and Srinivasan, 2002). Morisset (2000) reports that, on a survey conducted on 29 African countries, there is a high correlation between FDI inflows and total value of natural resources in each country.
Though natural resource abundance is a common factor explaining much of the FDI inflows, the few successful African countries have also put particular attention to the creation of favourable economic, social and political environment for FDI. Other countries, such as Mauritius and Seychelles have managed to attract FDI by tailoring their FDI policies through liberalisation, export orientation, tax and other investment incentives. Moreover, some countries like Lesotho and Swaziland have attracted FDI because they are near to South Africa and investors wishing to serve the large market in South Africa have located their subsidiaries in these countries (UNCTAD, 1998; Basu and Srinivasan, 2002).
Empirically, Root and Ahmed (1979) analysed the determinants of non-extractive direct investment inflows for 70 developing countries over the period 1966-70. Their analysis focuses on testing the significance of the economic, social and political variables in explaining the determinants of FDI. They conclude that developing countries that have attracted the most non-extractive direct foreign investment are those that have substantial urbanisation, a relatively advanced infrastructure, comparatively high growth rates in per capita GDP, and political stability. Asiedu (2002) has also expressed a similar view analysing the impact of natural resources, infrastructure and openness to trade on FDI flows to Sub-Saharan Africa. Her findings indicate that FDI in Africa is not solely determined by availability of natural resources and that governments can play an important role in directing FDI through trade reform, macroeconomic and political stability, efficient institutions and improvement in infrastructure.
7 Since this study attempts to identify factors determining foreign direct investment in Ethiopia, the review of the empirical literature is made to focus largely on determinants of FDI in developing countries in general and Africa in particular.
7
Several other studies find that countries that have a higher degree of openness8 attract more FDI. Singh and Jun (1995) find export orientation (export as percentage of GDP) to be the strongest factor explaining why a country attracts FDI. Chakrabarti’s (2001) finds openness to trade, measured by exports plus imports to GDP, being positively correlated with FDI. Morisset (2000) finds a positive and significant correlation between trade openness and the investment climate for 29 African countries. Studying factors that significantly influence the long-run investment decision-making process of investors in 19 Sub-Saharan African countries, Bende-Nabende (2002) finds market growth, export-orientation policy and liberalisation as the most dominant long-run determinants of FDI. Salisu (2003) finds openness to trade having positive and significant effect on FDI in Nigeria while Tsikata et al (2000) find export-orientation as a significant determinant of FDI inflows to Ghana. Asiedu (2002), using exports and imports as a percentage of GDP to proxy openness, comes to a similar conclusion for Sub-Saharan African host countries. Focusing on manufactured goods, primary commodities and services, Kandieru and Chitiya (2003) analyse the impact of openness on FDI in 51 African countries. Their findings indicate that FDI responds significantly to increased openness in the whole economy and in the services sector in particular. In general, the empirical evidence supports the theoretical argument in favour of favourable government policies and liberal trade regimes as important determinants of FDI.
From the theoretical point of view market size, which is usually measured by real per capita income, plays an important role in attracting FDI, especially market seeking FDI. However, the empirical evidence for market size as a determinant of FDI has mixed results. Obwona (2001) finds market size to be a significant determinant of FDI in Uganda. Investigating the determinants of FDI on developing and developed countries, Chakrabarti (2001) concludes that host country market size, measured by per capita GDP, has positive and significant effect on FDI.9 On the other hand, however, Salisu (2003) finds both per capita income and growth rate of GDP to be statistically insignificant determinants of FDI in Nigeria while Tsikata et al (2000) fail to support the market size as an important determinant of FDI in Ghana.
It has been argued that macroeconomic stability, government policies and political variables are more important determinants of FDI in Africa than the market variables. Schneider and Frey (1985) used politico-economic model which simultaneously includes economic and political determinants of FDI in explaining the flow of foreign direct investment in 80 less developed countries. They find that the most important determinant of FDI is a country’s level of development, measured by real per capita GNP and the balance of payments. The higher the per capita income and the lower the balance of payments deficit, the higher the amount of foreign direct investment attracted. Regarding the political determinants of FDI, Schneider and Frey conclude that political instability significantly reduces the inflow of foreign direct investment. Lemi and Asefa (2001) also arrive at similar conclusions. Their study examines the impact of economic and political uncertainty on foreign direct investment flow to 31 African countries. Their study indicates that for U.S. manufacturing FDI in particular,
8 In most studies openness is measured by the ratio of exports (or exports & imports) to GDP. 9 Agodo (1975), Schneider and Frey (1985), Morisset (2000), Lemi and Asefa (2001), and Lee (2003) are some of the other studies with evidence in support of the hypothesis that large market size encourages FDI.
8
political stability and government policy commitment are the most important factors. Moreover economic factors such as labour, trade connection, size of the export sector, external debt, and market size of the countries are found to be significant determinants of FDI flows to African countries. These findings are in line with the findings of Agodo (1975) who finds that the U.S private investors’ corporate decisions to undertake manufacturing investments in Africa are essentially determined by the expected rates of return on investment, political stability and favourable investment climate, the size of the domestic market, the presence of needed raw materials, and infrastructure. Lee (2003) draws particular attention to the effectiveness of government policies towards foreign direct investment activity. Using an index that reflects a country’s general regulatory environment and treatment for foreign businesses for a cross section of 153 developing and developed countries over the period 1995-2000, his findings indicate that while a country’s market size and openness to trade are crucial factors for foreign investment flows, government policies play an important role to FDI inflows. Corruption is also another key concern of foreign investors on top of political and policy instability. The World investment Report (1999) reports that factors most frequently mentioned by foreign investors in Africa as having a negative influence on investment are bribery, high administrative cost of doing business and access to capital. Empirically, Salisu (2003) analyses the impact of corruption on FDI in Nigeria and finds corruption having a significant detrimental effect on FDI. In general, greater red tape, more restrictive performance requirements, an unstable political situation, or economic instability would make the host country less attractive for FDI (Lim, 2001).
Human capital, both in terms of quantity and quality, is another important factor in promoting labour intensive and export oriented FDI in particular. Noorbakhsh et al (2001), using secondary school enrolment ratio and the number of accumulated years of secondary and tertiary education in the working age population as a proxy to human capital, find human capital to be a significant determinant of FDI inflows for 36 developing countries. Lewis (1999) also provides support to the proposition that human capital in host countries is a key determinant of foreign direct investment in developing countries. He notes that education, especially in technical discipline, provides least developed countries with the skills that are required by the multinational companies. Nunnenkamp (2002) has analysed globalisation-induced changes in the relative importance of foreign direct investment in developing countries. His findings indicate that traditional market-related determinants are still dominant factors but the availability of local skills has become a relevant pull factor of FDI in the process of globalisation. Salisu (2003) also finds low level of human capital, as measured by the illiteracy rate, having a discouraging effect on FDI in Nigeria. 3. Overview of Ethiopia’s recent economic and FDI performance and policies The Ethiopian economy is highly dependent on agriculture, which accounts for 45 percent of GDP. Around 80 percent of the population derives its livelihood directly or indirectly from agricultural production. Various studies indicate that agricultural exports, mainly coffee and processed and semi-processed hides and skins, account for over 80 percent of all exports, with coffee alone accounting for over 64 percent of

9
foreign exchange earnings. Manufacturing, mining, trade, tourism, construction, services, and other sectors make up the remaining 55 percent of GDP.
The Ethiopian economic and FDI performance over the study period (1974-2001) can be reviewed on the basis of the two regimes that have been in place in the country. The first period, 1974-1991 (the pre-191 period) relates to the period when policies that were in place were more or less in line with the command system of economic management. The second period, the post-1991 period, signify some move away from the command system and commenced with the stabilisation and adjustment programs (SAP) of the World Bank (WB) and the International Monetary Fund (IMF). In the section that follows some of the major features of the two periods in terms of economic performance and the FDI policy framework in Ethiopia will be reviewed. 3.1 The pre-1991 period This period marked the introduction of the command system of economic management in 1974. The mainly liberal policies of the pre-1974 Imperial/feudal era were replaced with centralised policies that discouraged market economy and private property. The land reform measure that was undertaken in 1975 was one of the major policy reforms that took place immediately. Land was nationalised and private ownership of land ceased. Medium-size and large enterprises were also nationalised. The government also nationalised and subsequently reorganised private banks and insurance companies. In general, the economic performance of the pre-1991 period was characterised by three phases. During the first phase of the regime 1974-78, economic performance was poor due to the emerging new policies and the nationalisation measures. Average annual growth rate of GDP was 0.3 percent while per capita growth was negative. During the second phase of the regime, 1978-80, the economy began to recover and the growth rate increased to 4.6 percent. This period was characterised by stability and it also benefited from good weather. Agricultural production increased at an average annul rate of 3.6 percent. But in the third phase 1980-1985, the economy performed badly again. The major reason for this was the severe drought that affected almost all regions of the country. After this period the economy continued to stagnate. To tackle the structural problems of the country the government eventually adopted a long-term plan (the Ten Year Perspective Plan). The aim of the plan was to reduce the share of agriculture in GDP, increase the share of industry, increasing foreign exchange earnings, diversification of the country’s export sector and real GDP growth of 6.9 percent per annum during the target period. However, most of the targets were not realised. Growth remained at about 2 percent and GDP per capita was negative during the pre-1991 period (Geda and Degefe, 2002)
The investment climate in general and FDI in particular was not encouraging during this period. The problems of political instability, insecurity, and the nationalisation of major industries severely discouraged foreign private investment. Realising the importance of FDI, the government then attempted to revive FDI through the 1983 Joint Venture Proclamation. The proclamation offered incentives such as a five-year period of income tax relief, import and export duty relief, tariff protection and repatriation of profits and capital. However, the proclamation failed to attract foreign investors. In 1989, the government revised the 1983 proclamation by allowing

10
majority foreign ownership in many sectors. It also attempted to provide more protection to investors. However, the political instability and the prolonged civil war at the time further discouraged FDI. The political instability got worse and it consequently led to the overthrow of the regime in 1991. 3.2 The post-1991 period The post-1991 period began with the coming to power of TPLF/EPRDF in 1991 and the adoption of the WB/IMF sponsored Structural Adjustment Programme soon after. Among the stated objectives of the new government were/are: reducing macroeconomic imbalances, eliminating structural distortion, improving the country’s human capital and infrastructure as well as poverty reduction. The government implemented a series of reform measures in order to change the command economic system that had been in place to a free market economy, to speed up the integration of the economy into the world economy and to encourage the wider participation of the private sector in the development process of the national economy (FDRE-MOFED, 2002). The specific measures taken to promote the export sector and participation of the private sector include the following:
� Deregulation of domestic prices � Devaluation of the national currency by 141.55 percent, from 2.07 birr per
dollar to 5 birr per dollar; � Liberalisation of the foreign exchange market � Elimination of Export taxes except for coffee; � Lowering of Maximum import duties from 230 percent to 60 percent; � Simplification of Export licensing regulation and procedure; � Provision of adequate incentives, strengthening and enhancing
institutional support for the export sector. Increasing the role of the private sector in the economy being one of the main objectives of the government, the privatisation programme was started in 1994. The Ethiopian Privatisation Agency (EPA) which has the power and duties of transferring state-owned enterprises to private ownership was established. To date, the government had privatised 200 enterprises to domestic and foreign investors (AFDB/OECD, 2003). The government has also adopted “agriculture-led industrialisation” as a central plank of its development programme, with a focus on productivity growth on small farms and labour-intensive industrialisation” (Economic Commission for Africa, p.83, 2002). Except for the two year period of conflict with Eritrea (1998-2000), the reform measures have brought about some positive changes. Economic growth during this period (1992-2001) has improved with an average rate of 5 percent. GDP per capita has also grown by 2.4 percent per annum and the rate of inflation declined from 21 percent in 1992 to less than 5 percent in 2001. By 2000/01 total investment accounted for 16 percent of GDP (Geda and Degefe, 2002; Economic Commission for Africa, 2002). The overall GDP growth rate over this period (1991-2003) stands at 4 percent (Andrews, et al. 2005) faring moderately better to the pre-1991 growth performance that stood at 2.8 percent. Although domestic investments constitute the main component of capital formation in Ethiopia, accounting for about 64 percent of total investment, FDI has started to play

11
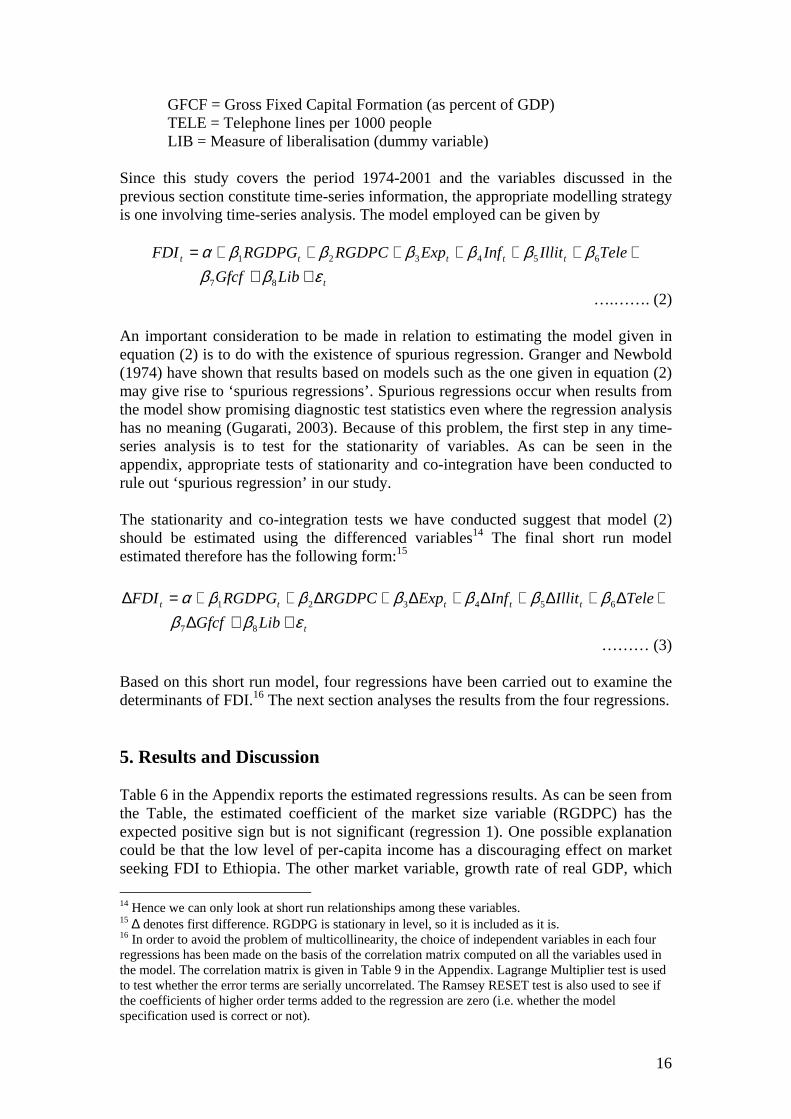
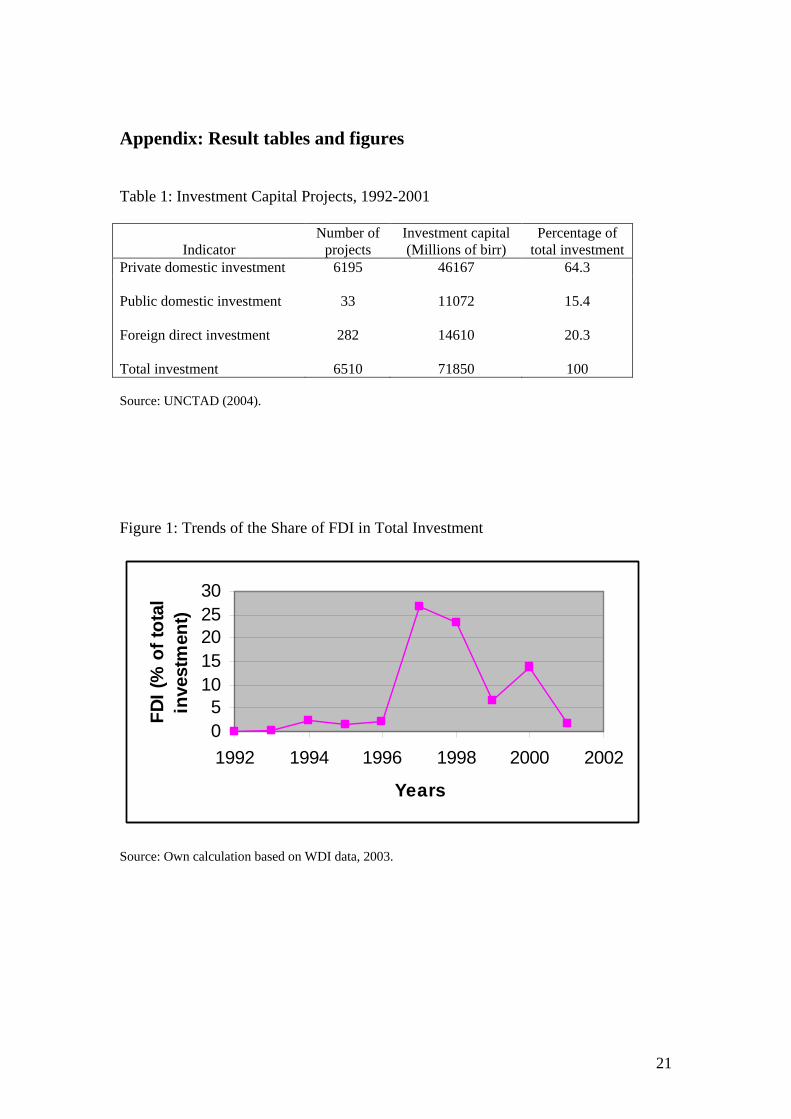
some role in the country following the 1992 liberalisation programme (see Table 1 in the appendix). The reforms as well as the government introduction of investment guarantee schemes and incentives helped to raise the share of inward FDI in total investment form 0.04 percent in 1992 to 27 percent in 1997 (Figure 1). However, the war with Eritrea in particular has disrupted the rising trend of FDI inflows.10
< table 1 here >
< figure 1 here>
According to Ethiopian Investment and Innovation Policy Review (UNCTAD, 2002), the Middle East accounted for the largest share of the post-1992 FDI projects in the country. This was followed by the European Union as the second largest source of FDI to Ethiopia over the period 1992 to1998 (see Table 2 in the appendix).
< table 2 here >
3.3 Regulatory and institutional framework of FDI in Ethiopia Implementing market oriented development strategies encourages the role of the private sector involvement in the development process. In order to encourage, promote and expand private investment in the country; the Ethiopian government has set out some private sector development initiatives. These initiatives are about enabling the enhanced utilisation of the country’s resources through the growth of private businesses by providing predictable and enabling environment (FDRE-MOFED, 2002). The programme highlights the importance of competitiveness as a key to success for sustained economic development in the country. Some of the important factors mentioned as a basis for competitiveness include conducive investment climate, which focuses on macro-economic stability, sound policy and regulatory framework for the private investment sector and strong institutions that run and support the system. 3.3.1 The FDI regulatory framework Under the current regulatory framework, foreign participation in investment may be carried out either through the establishment of branches or through locally incorporated enterprises. Foreign investors are encouraged to invest in all economic sectors, except those currently reserved for domestic private and state investment (Table 3).
< table 3 here>
10 The piecemeal nature of the reform process and inefficiency associated with it, the growing culture of corruption, the expansion of parastatals and, particularly since 1998, the growing political uncertainty in the country are also to blame for the drop in FDI. According to recent reports, Ethiopia is one of the countries in Africa, the continent with the least attraction for FDI, that fares poorly in terms of its rank in ‘Ease of doing business’ ( see, for example, http://www.doingbusiness.org/Documents/2006-country-tables.pdf)

12
There is also a continuous review of the investment code regarding the sectors excluded from FDI. For example, the revised investment proclamation No.116/1998 has opened up the hydropower generation to local and foreign investment. The 1998 investment code also allowed private-government joint investment in defence and telecommunication. The main business sectors which are open and in which the country is currently seeking foreign investment include:
• Manufacturing industries (including food, beverages, chemicals and pharmaceuticals, plastics, metallic and non-metallic products, paper products, leather and leather products, textiles and garments);
• Agriculture, including agribusiness and processing for exports; • Real-estate development; • Education and health services; • Grade 1 construction contract; • Mining and quarrying of gold, marble and granite; and • Engineering and management consultancy.
Since 1996, with the objective of promoting private investment and the inflow of foreign investment, a series of investment proclamations have been issued. These proclamations impose some requirement and ownership limitation. There is a minimum entry capital for FDI for both wholly-owned operations and joint ventures with Ethiopian companies or individuals. In the case of joint venture the investment proclamation requires that domestic partners must hold a minimum of 27 percent equity ownership interest. Moreover both FDI and domestic investors are required to submit progress reports every six months. Apart from these requirements, investors are not required to meet specific goals like local content requirement or operational guidelines (UNCTAD-ICC, 2004). The investment legislation has also attempted to provide a favourable investment climate by offering fiscal incentives and investment guarantees to foreign and domestic investors engaged in new enterprise development and expansion. The major investment incentives for FDI include: 100 percent exemption from payment of import duties and import taxes levied on all capital equipments; exemption from payment of export taxes (except for coffee); income tax holidays varying from one to five years; tax deductible research and development expenditure; no taxes on the remittance of capital; the carrying forward of initial operating losses and investor choice of depreciation model of capital assets. The Ethiopian investment codes also provide guarantees to create a reassuring business environment for potential foreign investors. Specific investment guarantees that have been issued for FDI include: full repatriation of capital and profits including dividends and interest payment on foreign loans; payments for technology transfer and management agreements; full repatriation of proceeds from sale or transfer of shares or liquidation of enterprises. Moreover, the investment proclamation No.37/1996 provides investment guarantees against measures of expropriation and nationalisation, except in major cases of public interest when full market value will be paid promptly (UNCTAD-ICC, 2000). 3.3.2 The FDI institutional framework
13
The government of Ethiopia has established the Ethiopian Investment Authority (EIA) to promote, coordinate and facilitate foreign investment in the country. According to the Investment Guide to Ethiopia (UNCTAD-ICC, 2000) the functions of the EIA, among others, include:
• Providing all the necessary information required by foreign investors; • Approving foreign investment applications and issuing investment
permits; • Providing registration services to newly incorporated business
organisations; • Approving expatriate posts in approved investments and issuing work
permits to foreign employees; • Issuing trade and operating licences for foreign investments; • Monitoring the implantation of licensed investment projects; • Approving and registering technology transfer agreements between
local companies and foreign technology suppliers; and • Facilitating the acquisition of land by foreign investors in accordance
with the relevant federal and regional Government laws and regulations.
It has been reported that as of December 2003 the EIA has processed a total of 572 FDI projects, of which 77 projects have become operational while another 103 projects are under implementation. The rest 392 projects are approved foreign investment projects awaiting implementation (Table 4). Out of the 392 FDI approved projects the manufacturing and processing sector accounted for the highest share, 46.57 percent, followed by trade, hotels and tourism 40.7 percent; and agriculture and mining 12.7 percent. (UNCTAD, 2004)
< table 4 here >
The establishment of the Ethiopian Privatisation Agency (EPA) is also another significant step in the promotion of FDI. The government is keen to encourage the participation of foreign investors in the privatisation programme, particularly in large state owned companies. Other government departments that are involved in the attraction of FDI to Ethiopia include: the Ministry of Trade and Industry; the ministries and agencies associated with specific sectors such as mining and tourism; the ministry of Foreign Affairs and ministries dealing with taxation remits including customs. Moreover there are regional investment promotion agencies that encourage FDI into their region (UNCTAD, 2002). The establishment of the EIA and other investment promotion and support institutions is also a step forward in the right direction. This, however, necessitates high coordination among the various institutions to raise the effectiveness of the present national effort to attract FDI. That the Ethiopian Investment Authority has recently restructured itself to improve the efficiency and effectiveness of the service delivery processes for investors is a measure that recognises the need for effective co-ordination.
4. Data and empirical methodology
14
This section presents a general description of the data and the empirical methodology used in this study. Secondary data is employed in the present study for the period 1974-2001 and the data sources are IMF International Financial Statistics Year Books and the World Bank World Development Indicators CD-ROM 2003. Summary statistics of the variables included in this study are reported in Table 5 in the appendix.
< table 5 here > 4.1 Definitions of variables The World Bank World Development Indicators (2003) defined FDI as the net amount invested or reinvested by non-residents to acquire a lasting interest (10 percent or more of voting stock) in enterprises in which they exercise significant managerial control. There are a number of FDI variables included in World Development Indicators data set: net FDI, BOP in current U.S. $; net FDI inflows as percent of gross capital formation; net FDI inflows BOP in current U.S $ and net FDI inflows as percent of GDP. IN line with the approach used in the FDI literature, the dependent variable used in this study is the net foreign direct investment inflows as a percentage of GDP. The choice of independent variables is constrained by data availability, as is mostly the case with time-series data in developing countries. For example, time-series data on some of the factors such as tariff rates, trade taxes, real effective exchange rate, real wages, and corruption index that are used in some studies of this nature are not readily available for Ethiopia over the (entire) study period. Not withstanding this constraint, this study uses the following variables that are commonly used in studies of FDI. Market Size: the market size hypothesis states that multinational firms are attracted to a larger market in order to utilise resources efficiently and exploit economies of scale (Chakrabarti, 2001). Market size has been represented by real per capita GDP and growth rate of real GDP (as market growth potential). Real GDP per capita and Real GDP growth rates are included in the regression as measures of market attractiveness and FDI is expected to be positively related to these two variables.11 Export orientation: openness promotes FDI, and one indicator of openness is the relative size of the export sector (Singh and Jun, 1995).12 Macroeconomic stability: there is a widespread perception that macroeconomic stability shows the strength of an economy and provides a degree of certainty of being able to operate profitably (Balasubramanyam, 2001). Inflation rates and exchange rates are used as proxy variables for macroeconomic stability. Low inflation and stable exchange rates are expected to have a positive impact on FDI. As pointed out
11 The IMF International Financial Statistics Year Book reports GDP values using the local currencies, so annual average exchange rate is used to convert the local currency values into US$ equivalent. The nominal values of GDP were, then, converted into real value using GDP deflator. 12 The ratio of trade to GDP is often used as a measure of openness in some studies but this measure was not found to have a significant effect in this study.
15
earlier, data on real exchange rate is not readily available. As a result, only the rate of inflation (based on consumer price index) is included to capture the effect of macroeconomic stability on FDI. Infrastructure: infrastructure covers many dimensions ranging from roads, ports, railways and telecommunication systems to the level of institutional development. The availability of well-developed infrastructure will reduce the cost of doing business for foreign investors and enable them to maximise the rate of return on investment (Morriset, 2001). Therefore countries with good infrastructures are expected to attract more FDI. It is a standard practice to measure infrastructure by the number of telephone lines per 1000 people in a country. Asiedu (2004) argues that this measure does not include mobile phones. Moreover, it only captures existing infrastructure and fails to take into account potential infrastructure. Taking this into account Gross fixed capital formation (percent of GDP) has been included to proxy infrastructure development in addition to number of telephones.13 These two variables are expected to be positively correlated with FDI. Human capital: human capital is considered to be an important factor for location strategies of multinational companies. When investing for the long term in another country, multinational companies have in mind the human resources in the host country. Large, efficient, educated population is a requirement for an attractive investment. The more educated the population is, the more likely it is for a country to attract more FDI (Lewis, 1999). In this study, human capital is measured by adult illiteracy rate (percent of people aged 15 and above). This indictor is expected to be negatively correlated with FDI. Liberalisation: liberalisation of trade and FDI regimes are assumed to have a positive influence on the inflow of FDI since they facilitate a freer trade and investment in conjunction with the repatriation of dividends and profits to home countries (Bende-Nabende, 2002). As explained in section three, Ethiopia has been introducing some liberalisation measures since 1991 and a dummy variable is used to capture the effect of the change in policy environment on FDI. The dummy variable assumes a value of 0 for the pre-liberalisation period (i.e. up to 1990) and 1 for the post liberalisation period (from 1991 onwards). The dummy variable is expected to have a positive sign. 4.2 Model specification
The general form of the model estimated has the following form:
( )LIB,TELE,GFCF,ILLIT,INF,EXP,RGDPC,RGDPGfFDI = …………… (1) Where RGDPG = Growth Rate of Real Gross Domestic Product RGDPC = Real Gross Domestic Product per capita EXP = Exports as percentage of GDP (measures openness) INF = Annual rate of inflation based on consumer price index ILLIT = Rate of adult illiteracy
13 Gross fixed capital formation includes land improvements, construction of roads, railways, schools, and industrial and commercial buildings (Asiedu, 2004)
16
GFCF = Gross Fixed Capital Formation (as percent of GDP) TELE = Telephone lines per 1000 people LIB = Measure of liberalisation (dummy variable)
Since this study covers the period 1974-2001 and the variables discussed in the previous section constitute time-series information, the appropriate modelling strategy is one involving time-series analysis. The model employed can be given by
t
ttttt
LibGfcf
TeleIllitInfExpRGDPCRGDPGFDI
εββββββββα
+++++++++=
87
654321
….……. (2)
An important consideration to be made in relation to estimating the model given in equation (2) is to do with the existence of spurious regression. Granger and Newbold (1974) have shown that results based on models such as the one given in equation (2) may give rise to ‘spurious regressions’. Spurious regressions occur when results from the model show promising diagnostic test statistics even where the regression analysis has no meaning (Gugarati, 2003). Because of this problem, the first step in any time-series analysis is to test for the stationarity of variables. As can be seen in the appendix, appropriate tests of stationarity and co-integration have been conducted to rule out ‘spurious regression’ in our study. The stationarity and co-integration tests we have conducted suggest that model (2) should be estimated using the differenced variables14 The final short run model estimated therefore has the following form:15
t
ttttt
LibGfcf
TeleIllitInfExpRGDPCRGDPGFDI
εββββββββα
++∆+∆+∆+∆+∆+∆++=∆
87
654321
……… (3) Based on this short run model, four regressions have been carried out to examine the determinants of FDI.16 The next section analyses the results from the four regressions. 5. Results and Discussion Table 6 in the Appendix reports the estimated regressions results. As can be seen from the Table, the estimated coefficient of the market size variable (RGDPC) has the expected positive sign but is not significant (regression 1). One possible explanation could be that the low level of per-capita income has a discouraging effect on market seeking FDI to Ethiopia. The other market variable, growth rate of real GDP, which
14 Hence we can only look at short run relationships among these variables. 15 ∆ denotes first difference. RGDPG is stationary in level, so it is included as it is. 16 In order to avoid the problem of multicollinearity, the choice of independent variables in each four regressions has been made on the basis of the correlation matrix computed on all the variables used in the model. The correlation matrix is given in Table 9 in the Appendix. Lagrange Multiplier test is used to test whether the error terms are serially uncorrelated. The Ramsey RESET test is also used to see if the coefficients of higher order terms added to the regression are zero (i.e. whether the model specification used is correct or not).

17
measures the growth prospects of the economy/market, has a positive and significant coefficient in three of the four regressions (2, 3 and 4). This finding is in line with the hypothesis that a growing economy attracts more FDI.
< table 6 here >
An important finding is the positive and significant effect of export orientation (i.e. exports/GDP ratio). It is significant at 1 percent level of significance in all regressions. This finding suggests that FDI in Ethiopia is of the vertical type17 which is normally export oriented and tends to be unaffected by the market size of the host economy. This finding seems to reinforce our earlier finding that market size is not an important determinant of FDI in Ethiopia. The degree of export orientation of the economy is more important than market size to foreign investors who tend to locate in the export sector. The main export items of the country come from agricultural, mining and the manufacturing and processing sectors which also account for some 59 percent of approved FDI projects in the country. This, therefore, explains the strong positive effect of export orientation on FDI. The inflation variable is significant with the expected sign. It is significant at 5 percent in all regressions. This finding implies that macroeconomic stability is an important determinant of foreign direct investment inflows to Ethiopia. Similarly, the liberalisation dummy is found to be a significant determinant of FDI, with the estimated coefficient possessing the expected sign in all regressions. This result suggests that liberalisation of the Ethiopian economy has encouraged FDI inflows and it also supports the proposition that foreign investors are more likely to invest in countries that have opened up to the outside world. One of the two infrastructure indicators, telephone lines per 1000 people, is found to yield a negative and significant coefficient (regression 4). This result may be explained by the poor telecommunication facility which is detrimental to FDI inflow into the country. UNCTAD (2002) pointed out that one of the specific economic challenges and constrains identified by private investors in Ethiopia is the poor infrastructure facilities, in particular in the areas of telecommunications, transport and power supply. The coefficient of GFCF, which constitutes all kinds of infrastructure development, is also found to be negative but insignificant (regression 4). Even if the coefficient of GFCF is insignificant, its negative effect on FDI might indicate, again, that the poor infrastructural facilities in Ethiopia having a detrimental effect on FDI since lack of proper infrastructure increases the cost of doing business. The human capital variable (measured by rate of adult illiteracy) is not statistically significant (regression 3), although it has the right sign suggesting that, an economy with high fraction of unskilled workers is likely to be much less productive and less attractive to foreign investors.
17 FDI in search of low-cost inputs is called vertical FDI. The low cost inputs can be primary commodities or raw material (Lim, 2001).

18
6. Summary and conclusion This study attempts to study the determinants of FDI in Ethiopia. To this end, we have reviewed theoretical explanations relating to the determinants of FDI. We have also reviewed relevant literature pertaining to the determinants of FDI in the context of developing and developed countries. The empirical analysis we conduct and its findings show that economic growth, export orientation (openness) and liberalisation have a significant positive impact on FDI, while macroeconomic instability and low level physical infrastructure have a negative impact on the same. The findings of this paper can be summarised as follows:
� The positive and significant effect of economic growth on FDI emphasises
the crucial role of economic growth in stimulating investment by foreign as well as domestic investors. Ethiopia has had a respectable growth performance in the post-1991 period18. High rate of GDP growth signals a country’s economic prospects and encourages foreign investors. Keeping up the growth momentum and ascertaining its sustainability is a key to attracting more FDI. In this regard, furthering the growth performance of the economy through the creation of favourable macroeconomic environment, developing vital infrastructure, ensuring the quality of institutions as well as improving the quality of human capital are some of the important measures essential to attract FDI.
� The positive and significant export orientation coefficient signifies the
importance of implementing a more outward looking growth strategy. � The negative and significant inflation coefficient signifies the importance
of a more focused macro economic policy environment that strengthens the economy and builds confidence for potential investors. Necessary steps have to be taken to contain inflation and stabilise exchange rate through the adoption of sound fiscal and monetary policies.
� The significantly negative coefficient of the infrastructure variable
(telephone lines per 1000 people) highlights the need for big investment in infrastructural development, which is essential for the creation of a productive business environment. There should be concerted effort to upgrade the country’s poor infrastructure particularly in relation to transportation, power and telecommunication.
� The significantly positive effect of liberalisation on FDI indicates that an
efficient environment that comes with liberalised economy is likely to attract foreign investors. To induce more FDI to Ethiopia, the government needs to focus on improving the investment climate through further measures of liberalisation as well as creating efficient bureaucracy that facilitates entry and speedy operation of foreign investors. Further measures aimed at encouraging privatisation and the promotion of the domestic private sector too is essential for the inflow of FDI depends to a degree on how the domestic private sector is treated.
18 Albeit being heavily subsidised by official development assistance (ODA) and bilateral aid.

19
References
AFDB/OECD (2003), African Economic Outlook. Agodo, Oriye (1975), The Determinants of U.S. Private Manufacturing Investment in Africa, The Graduate Scholl of Management, Northwestern University. Andrews, D, Erasmus, L and Powell, R (2005), “Ethiopia: Scaling Up”, Finance and Development, Vol. 42, No. 3 Asiedu, Elizabeth (2002), “On the Determinants of Foreign Direct Investment to Developing Countries: Is Africa Different?” World Development, Vol.30, No.1, pp.107-119. Asiedu, Elizabeth (2003), Foreign Direct Investment to Africa: The Role of Government Policy, Governance and Political Instability. Department of Economics, University of Kansas. Asiedu, Elizabeth (2004), “Policy Reform and Foreign Direct Investment in Africa: Absolute Progress but Relative Decline”, Development Policy Review, 22(1): 41-48 Balasubramanyam, V. N. (2001), Foreign Direct Investment in Developing Countries: Determinants and Impact, OECD, New Horizons and Policy Challenges for FDI in the 21st Century. Basu, Anupam and Srinivasan, Krishna, (2002), Foreign Direct Investment in Africa – Some Case Studies. IMF Working Paper 61. Bende-Nabende, A. (2000), “Foreign direct investment determinants in Sub-Sahara Africa: A co-integration analysis”, Economics Bulletin, Vol.6, No.4, 1-19. Chakrabarti, Avik (2001), “The Determinants of Foreign Direct Investment: Sensitivity Analyses of Cross-Country Regressions”, KYKLOS, Vol.54, pp. 89-114. Dunning, J.H (1993) Multinational Enterprises and the Global Economy. Wokingham, England: Addison-Wesley. Economic Commission to Africa (2002), Economic Report on Africa: Tracking performance and progress Engle, R.F. and Granger, C.W.J (1987), “Co-integration and Error-correction: Representation, Estimation and Testing”, Econometrica, March, Vol.55, pp.251-276. Federal Democratic Republic of Ethiopia (FDRE) and Ministry of Finance and Economic Development (MOFED) (2002), Ethiopia: sustainable development and poverty reduction program. Geda A. and Degefe B. (2002), Explaining African Growth performance: The case of Ethiopia, Paper to be presented on AERC Growth Research Workshop, Nairobi, Kenya. Gujarati, Damodar N. (2003), Basic Econometrics, McGraw-Hill/Irwin, New York. Harrison, Andrew L., Dalkiran, Ertugrul and Elsey, Ena (2000), International Business: Global Competition from a European Perspective, Oxford: New York: Oxford University Press. Hymer, Stephen Herber (1976), The International Operations of National Firms: A Study of Direct Foreign Investment. The M.I.T Press. Ikiara, Moses M. (2003), Foreign Direct Investment, Technology Transfer and Poverty Alleviation: Africa’s Hopes and Dilemma, African Technology Policy Studies Network Special Paper Series No. 16. Kandiero, Tonia and Chitiga, Margaret (2003), Trade Openness and Foreign Direct Investment in Africa. Paper prepare for the Economic Society of Southern Africa Annual Conference. Department of Economics, University of Pretoria. Kindleberger, Charles P. (1970), the International Corporation: A Symposium. The M.I.T Press.

20
Knickerbocker, Frederick T. (1973) Oligopolistic Reaction and Multinational Enterprise. Harvard Universtiy, USA. Lee, Jim (2003), Cross-Country Evidence on the Effectiveness of Foreign Investment Policies, Texas A&M University. Lemi, Adugna and Asefa, Sisay (2001), Foreign Direct Investment and Uncertainty: Empirical Evidence from Africa, Department of Economics, Western Michigan University. Lewis, Jason (1999), “Factors Influencing Foreign Direct Investment in Lesser Developed Countries”, The Park Palace Economist, Vol. VIII, pp.99-107. Lim, Ewe-Ghee (2001), Determinants of, and the Relation Between, Foreign Direct Investment and Growth: A Summary of the Recent Literature, IMF Working Paper, and No.175. Morisset, Jacques (2000), “Foreign Direct Investment in Africa: Policies Also matter.” Transnational Corporation, 9(2), 107-125. Noorbakhsh, F. Paloni, A. and Youssef, A. (2001), “Human Capital and FDI Inflows to Developing countries: New Empirical Evidence”, World Development, Vol.29, No. 9, pp. 1593-1601. Nunnenkamp, Peter (2002), Determinants of FDI in Developing Countries: Has Globalisation Changed the Rules of the Game, Kiel Institute of World Economics, Working Paper No. 1122. Obwona, Marios B. (2001), Determinants of FDI and their Impact on Economic Growth in Uganda. Economic Policy Research Centre. African Development Bank. Root, Franklin R. and Ahmed, Ahmed A. “Empirical Determinants of Manufacturing Direct Foreign Investment in Developing Countries”, Economic Development and Cultural Change, 27:751-767. Rugman, Alan M. (1982) New Theories of the Multinational Enterprise. Cambridge Univesity Press. UK. Salisu, Mohammed (2003), Foreign Direct Investment in Sub-Saharan Africa, The management School, Lancaster University. Singh, Harinder and Jun, Kwang W. (1995), Some New Evidence on Determinants of Foreign Direct Investment In Developing Countries, The World Bank Policy Research Working Paper, No, 1531 Tsikata, G.K, Asante, Yaw and E.M. Gyasi (2000), Determinants of Foreign Direct Investment in Ghana. Overseas Development Institute. London. UK. UNCTAD (1998), World Investment Report: Trends and Determinants. United Nations Conference on Trade and Development. New York and Geneva, United Nations. UNCTAD (1999), World Investment Report: Foreign Direct investment and the Challenge of Development. United Nations Conference on Trade and Development. New York and Geneva, United Nations. UNCTAD (2002), “Ethiopia: Investment and Innovation Policy Review”, United Nations. UNCTAD/ICC (2000), “An Investment Guide to Ethiopia: Opportunities and conditions”. United Nations, New York and Geneva. UNCTAD/ICC (2004), “An Investment Guide to Ethiopia: Opportunities and conditions”. United Nations, New York and Geneva.
21
Appendix: Result tables and figures
Table 1: Investment Capital Projects, 1992-2001
Indicator Number of
projects Investment capital (Millions of birr)
Percentage of total investment
Private domestic investment 6195 46167 64.3 Public domestic investment 33 11072 15.4 Foreign direct investment 282 14610 20.3 Total investment 6510 71850 100 Source: UNCTAD (2004).
Figure 1: Trends of the Share of FDI in Total Investment
Source: Own calculation based on WDI data, 2003.
05
1015202530
1992 1994 1996 1998 2000 2002
Years
FD
I (%
of
tota
l in
vest
men
t)

22
Table 2: Foreign Investment Projects by Region of Origin 1992-mid 1998
Region of Origin Number of
Projects Percentage Middle East 49 32 European Union 42 28 Africa 26 17 North America 14 9 Asia 13 9 Other Europe 6 4 Others 2 1 Total 152 100 Source: UNCTAD (2002), Ethiopian investment and innovation policy review. Table 3: Areas of Investment Reserved for Government and Domestic Investors.
Areas exclusively reserved for the government: • Postal services except courier services, • Transmission and supply of electric energy through the integrated national grid system,
and • Domestic air transport using aircraft with a capacity of more than 20 passengers.
Areas exclusively reserved for domestic investors: • Radio and television broadcasting services. • Retail trade and brokerage. • Wholesale trade (excluding supply of petroleum and its by-products) as well as wholesale
by foreign investors of their locally produced products. • Import trade. • Export of raw coffee, oil seeds, pulses, hides and skins, and export of live sheep, goats and
cattle not raised or fattened on own farm. • Construction companies, excluding grade 1 contractor. • Tanning of hides and skins up to crust level. • Hotels other than star-designated hotels, motels, pensions, tearooms, coffee shops, bars,
night clubs and restaurants (excluding international and specialised restaurants). • Tour operations, travel agency, commission agency and ticket offices. • Car hires and taxicabs transport. • Commercial road transport and inland-water transport services. • Bakery products and pastries exclusively for the domestic market. • Grinding mills. • Barbershops, beauty salons, smith workshops and tailoring (excluding garment
factories). • Building maintenance services, repair and maintenance of vehicles. • Sawmills and manufacture of wood products exclusively for the domestic market • Customs clearance services. • Museums, theatres and cinema hall operations. • Printing industry.
Source: UNCTAD (2004)

23
Table 4: Foreign Direct Investment Projects in Ethiopia, December 2003
Status Number of
Projects Foreign Investment
Cumulative in $ millions
Operational 77 486.66 Under Construction 103 724.43
Approved 392 2172.49
Total 572 3383.58 Source: UNCTAD/ICC, 2004 Table 5: Summary Statistics for the Sample Period 1974-2001
Variable(s) FDI RGDPG RGDPC EXP INF ILLIT GFCF TELE LIB Maximum 4.66 11 182 16 36 84 20.6 4 1 Minimum -0.05 -12 94 5 -10 60 7.5 1 0 Mean 0.57 1.25 133.39 11.29 7.57 73 13.56 2.43 0.39 Std. Deviation 1.18 6.17 29.84 3.21 9.86 7.58 3.56 0.74 0.5 Skewness 2.62 -0.71 0.24 -0.1 0.89 -0.15 0.05 0.25 0.44 Kurtosis - 3 5.8 0.11 -1.29 -1.09 1.43 -1.24 -1.07 -0.2 -1.81 Coef. of Var’n 2.09 4.94 0.22 0.28 1.3 0.1 0.26 0.31 1.27

24
Table 6: Results of OLS estimation (1974-2001), Dependent Variable: FDI inflows (percent of GDP)
Specification Independent Variables 1 2 3 4
Constant -0.6729 -0.8059** -0.8104** -0.88531** (0.191) (0.017) (0.019) (0.008) RGDP GROWTH 0.6704 0.7791 0.78467 1.0174
(0.129) (0.011)** (0.012)** (0.002)** RGDP PERCAPITA 1.8045 (0.732)
EXPORT 3.9976*** 4.0406*** 3.9998*** 4.3979*** (0.005) (0.004) (0.005) (0.002)
INFLATION -0.7555** -0.7737** -0.7533** -0.83057** (0.033) (0.024) (0.034) (0.015)
LIBERAL DUMMY 2.2522** 2.3002** 2.1827** 2.2753** (0.026) (0.019) (0.039) (0.016) ILLITERACY -1.6236 (0.741)
TELEPHONE -2.2175*
(0.072) GFCF -0.79866 (0.227)
Adjusted R2 0.53 0.55 0.53 0.59
LM-SC1 0.02526 0.08031 0.06006 0.5337 (0.874) (0.777) (0.806) (0.465)
LM-FF2 0.324 0.2682 0.2946 0.05807 (0.569) (0.605) (0.587) (0.507)
Figures in parenthesis denote p-values, *** significant at 1 percent, ** significant at 5 percent,
* significant at 10 percent. 1: LM-SC denotes the Lagrange multiplier test for residual serial correlation. The null hypothesis for the test is there is no serial correlation and the test statistic is distributed as χ2 with 1 degree of freedom. The 95 percent and 90 percent critical values for χ2
are 3.84 and 2.71 respectively. 2: LM-FF denotes Ramsey’s RESET test of functional form. The null hypothesis for the test is the regression model is specified correctly. The 95 percent and 90 percent critical values for χ2 at 1 degree of freedom are 3.84 and 2.71 respectively.

25
Tests for stationarity: Stationary time-series is said to exist if the mean and variance are constant over time while the value of the covariance between two periods depends only on the gap or lag between the two time periods and not the actual time at which the covariance is computed (Gugarati, 2003). If the time-series is non-stationary, the mean, variance or covariance will not be constant and one is likely to end up with spurious regression where statistical inference on the basis of the classical regression model will be invalid. For the purpose of testing the stationarity of the time-series used in this study, Dickey-Fuller (DF) and Augmented Dickey-Fuller tests have been conducted. The null hypothesis in these tests is that the underlying process which generated the time-series in non-stationary. This will be tested against the alternative hypothesis that the time-series information of interest is stationary. If the null hypothesis is rejected, it means that the series is stationary i.e. it is integrated to order zero. If, on the other hand, the series is non-stationary, it is integrated to a higher order and must be differenced till it becomes stationary.19 As can be seen from the results given in Table 7 below, all the variables used in the model, except RGDPG, are not stationary in. This implies that the null hypothesis cannot be rejected and that the time-series has to be differenced. We then conduct the same tests on the first difference of the time-series. As can be seen from the test results on the first difference given in Table 7, the null hypothesis has been rejected for all variables indicating that all variables become stationary at their first difference. Table 7: Unit-Root Tests on Variables
Levels First difference DF ADF (1) DF ADF (1)
Variables W/o trend
With trend
W/o trend
With trend
W/o trend
With trend
W/o trend
With trend
FDI -2.13 -3.36 -1.4 -2.77 -7.62 -7.64 -3.92 -3.96 (-2.98) (-3.59) (-2.98) (-3.59) (-2.99) (-3.60) (-2.99) (-3.60) RGDPG -4.66 -4.67 -3.85 -3.94 -7.16 -7.00 -6.59 -6.45 (-2.98) (-3.59) (-2.98) (-3.59) (-2.99) (-3.60) (-2.99) (-3.60) RGDPC -1.15 -2.85 -1.06 -3.08 -5.60 -5.61 -5.06 -5.06 (-2.98) (-3.59) (-2.98) (-3.59) (-2.99) (-3.60) (-2.99) (-3.60) EXP -1.42 -1.6 -1.69 -1.79 -4.39 -4.44 -3.45 -3.58 (-2.99) (-3.60) (-2.99) (-3.60) (-2.99) (-3.60) (-2.99) (-3.60) INF -2.14 -3.34 -2.19 -3.48 -6.96 -6.77 -6.31 -6.15 (-2.99) (-3.60) (-2.99) (-3.60) (-2.99) (-3.61) (-2.99) (-3.61) ILLIT 1.63 -2.37 1.87 -2.1 -5.23 -5.92 -4.13 -5.49 (-2.99) (-3.60) (-2.99) (-3.60) (-2.99) (-3.60) (-2.99) (-3.60) TELE -0.83 -2.86 -0.26 -2.3 -6.99 -6.98 -4.45 -4.34 (-2.99) (-3.60) (-2.99) (-3.60) (-2.99) (-3.60) (-2.99) (-3.60) GFCF -2.29 -3.13 -1.64 -2.31 -7.06 -6.92 -3.17 -3.71 (-2.98) (-3.59) (-2.98) (-3.59) (-2.99) (-3.60) (-2.99) (-3.60)
95 percent critical values in parenthesis
19 The order of integration of a time series data set shows the number of times the series has to be differenced before it becomes stationary (Gugarati, 2003).

26
Test for co-integration: Having tested our time-series for stationarity, the next step of our time-series analysis is testing for co-integration which amounts to checking whether the linear combination of the variables is (also) stationary or not. It requires that the variables of interest have the same order of integration. It is only when the variables are integrated of the same order that a linear relationship among them can be expected. Variables are said to be co-integrated if a long run equilibrium relationship exists among them. Engle and Granger (1987) argue that for such relationships to exist, the error terms of the model should be stationary. We have applied the Engle-Granger procedure to test for co-integration. The first stage of the co-integration test involves estimating model/equation (2) (given in section 4.2) and saving the error terms. Then the DF and ADF tests are applied on the error terms. If the error terms are found to be stationary, the variables are said to be co-integrated and this necessitates the estimation of an Error Correction Model involving long run relationships. If, on the other hand, the variables are not co-integrated, then the modelling should proceed with the differenced time-series. Table 8 below reports the test statistics from the unit root tests. As can be seen from the Table, reported test results are lower, in absolute terms, than the critical values both with and without trend. This suggests that the variables in equation (2) are not co-integrated. In other words, an error correction model is not required. Table 8: Unit-Root Test results on Residuals
DF ADF (1) Without Trend -4.8074 (-5.3798) -4.5972 (-5.3798) With Trend -4.8140 (-5.7933) -4.5901 (-5.7933) 95percent critical values in brackets Table 9: Estimated Correlation Matrix of Variables
FDI RGDPG GDPC EXP INF ILLIT GFCF TELE LIB
FDI 1 0.38 0.25 0.61 -0.19 -0.45 0.36 0.3 0.45 RGDPG 1 -0.06 0.18 -0.11 0.06 -0.08 0.03 -0.01 RGDPC 1 0.24 -0.45 -0.94 0.66 0.87 0.72 EXP 1 -0.24 -0.23 0.21 0.12 0.28 INF 1 0.36 -0.59 -0.21 -0.1 ILLIT 1 -0.66 -0.86 -0.86 GFCF 1 0.38 0.39 TELE 1 0.73 LIB 1