Embed Size (px)
Citation preview

UNIVERSITY OF VICTORIA DEPARTMENT OF ECONOMICS
FALL 2012
ECON 204 (A01): Intermediate Macroeconomics
ASSIGNMENT I: SUGGESTED SOLUTIONS
Instructions: Please drop your assignment in the department’s assignment box marked “ECON 204
(A01)” by no later than 4:00 pm, Wednesday, October 03. Do not forget to print your name and stuent ID clearly on the front page and staple the
assignment securely. Show your all works – calculations, explanations and diagrams, where applicable.
Question 01 (Marks 10)
How will a change in the price of steel affect the price and quantity of automobiles sold on the
market? Explain your answer based on the demand-supply diagram for the automobile industry.
Identify the exogenous and endogenous variables in this example.
Ans. A change in the price of steel will lead to a shifting in the supply curve of automobiles. If there is any
increase in the steel price, the supply curve of automobile will shift to the left. If there is any decrease in the
steel price, the supply curve of automobile will shift to the right. For instance, if there is any technological
improvement in the steel production system, the supply of steel function will shift to the right – a decrease
in steel price and increase of steel supply in the steel market. Now as the steel, a basic intermediate good,
is now cheaper, the car manufacturers find cost of car going down. This is a positive supply shock in the
car/automobile market, which can be illustrated as of Figure 1.
The price of steel is the exogenous variable in this question, while the price and quantity of automobiles are
the endogenous variables.

ECON204 (A01) Fall 2012
2
Question 02 (Marks 10)
Consider a hypothetical economy described by the following equations:
, , , and ,
where is the consumption expenditure, is the personal disposable income = is the
investment expenditure, is the government expenditure, is the personal tax rate, is export
and is the marginal propensity to import.
a. Derive the equilibrium level of national income, consumption expenditure, savings and net
exports in this economy.
Ans. The equilibrium national income is derived from the Aggregate Expenditure (AE)
model. For this economy:
In equilibrium, the national income is equal AE. So,
Equilibrium consumption expenditure is
Equilibrium savings:

ECON204 (A01) Fall 2012
3
Equilibrium net export:
b. Illustrate your findings graphically.
c. What is the formula for the multiplier in this economy? Compute the value of the
multiplier and discuss its implication.
For this economy the multiplier is
When there is a change in the autonomous expenditure, the output increases by the
multiplier:
For example if the government spending increases by $100, the equilibrium national
income would go up by $500

ECON204 (A01) Fall 2012
4
Question 03 (Marks 10)
The Cobb-Douglas production function is given by: where is the capital share to the real income.
a. Derive the expression for the marginal product of labor (MPL) and the marginal product of capital (MPK).
Ans. Marginal product of labor is the partial derivative of with respect to .
Interpretation: Change in output due to one extra unit of labor addition to the production system Marginal product of labor is the partial derivative of with respect to K.
Interpretation: Change in output due to one extra unit of capital addition to the production system
b. For the optimal level of production, Capital and Labour should be hired up to the points
where
and
for capital and labour respectively. Using these
conditions show that the capital share to the real income is and the labour share to real income is
Ans. Real rent for capital is
. So the total capital income is
.
c. Suppose that immigration raises the labour force by 10 percent. What will happen to total output (in percent)? (assume ) Ans. A 10% increase in labour force means the labour input is now 1.1L and the new output
is: . The change in national income is
Output increases by 6.56%
ECON204 (A01) Fall 2012
5
Question 04 (Marks 10)
You can calculate Canadian economic growth rates for several years using the CANSIM statistical
Table 380-0056 (http://www5.statcan.gc.ca/cansim/home-accueil?lang=eng&tz=120308).
Canadian unemployment rate for the same period can be found on CANSIM Table 109-5324. Do you
think that the relationship between the growth rates and the unemployment rates is consistent
with your textbook lesson? In other way, do you think the prediction of the Okun's law is realistic in
the case? Explain with necessary calculations and arguments.
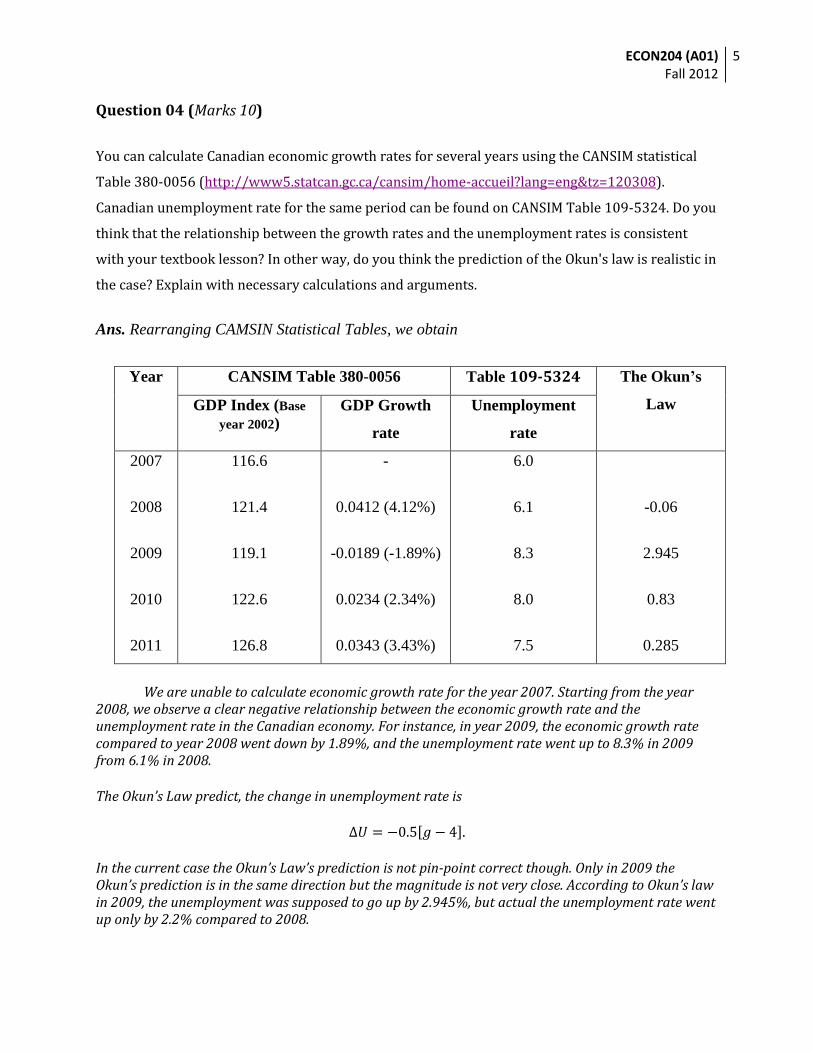
Ans. Rearranging CAMSIN Statistical Tables, we obtain
Year CANSIM Table 380-0056 Table 109-5324 The Okun’s
Law GDP Index (Base
year 2002)
GDP Growth
rate
Unemployment
rate
2007
2008
2009
2010
2011
116.6
121.4
119.1
122.6
126.8
-
0.0412 (4.12%)
-0.0189 (-1.89%)
0.0234 (2.34%)
0.0343 (3.43%)
6.0
6.1
8.3
8.0
7.5
-0.06
2.945
0.83
0.285
We are unable to calculate economic growth rate for the year 2007. Starting from the year 2008, we observe a clear negative relationship between the economic growth rate and the unemployment rate in the Canadian economy. For instance, in year 2009, the economic growth rate compared to year 2008 went down by 1.89%, and the unemployment rate went up to 8.3% in 2009 from 6.1% in 2008.
The Okun’s Law predict, the change in unemployment rate is
In the current case the Okun’s Law’s prediction is not pin-point correct though. Only in 2009 the Okun’s prediction is in the same direction but the magnitude is not very close. According to Okun’s law in 2009, the unemployment was supposed to go up by 2.945%, but actual the unemployment rate went up only by 2.2% compared to 2008.