Embed Size (px)
Citation preview


i
University of Southern Queensland Faculty of Engineering and Surveying
The Effect of Water Ratio on the Mechanical Properties of Refractory Materials
A dissertation submitted by
Aaron Massaro
In fulfillment of the requirements of
ENG4112 Research Project
towards the degree of
Bachelor of Engineering (Mechanical Engineering)
Submitted: January, 2006

ii
Abstract This study was carried out to investigate the effect water ratio in relation to dry
mass has on the mechanical properties of refractory materials. A number of
different refractory materials ranging from lightweight to dense grade were
investigated for the following properties:
- permanent dimensional change;
- bulk density;
- cold compressive strength; and
- cold modulus of rupture.
Water is an essential component when preparing refractory materials however
with increased water ratio adverse mechanical properties developed.
Each of the materials tested suffered an increase in permanent dimensional
change as a result of increased water ratio between the dried and the fired state.
The degree of shrinkage associated with the increase in water ratio was more
significant in the dense materials.
Each material tested exhibited a reduction in fired bulk density associated with
an increase in water ratio. This reduction was relatively consistent across all
materials tested.
An increase in water ratio was associated with a reduction in each material’s
ability to withstand a compressive force. The cold compressive test results

iii tended to display a more significant reduction in compressive strength for the
denser materials.
All materials exhibited a greater than expected flexural strength when prepared
in accordance with manufacturers’ recommendations. As additional water was
used the cold modulus of rupture results of all materials reduced indicating that
increased water ratio decreases a refractory materials ability to withstand a
bending force.

iv
University of Southern Queensland
Faculty of Engineering and Surveying
ENG4111 & ENG4112 Research Project
Limitations of Use The Council of the University of Southern Queensland, its Faculty of
Engineering and Surveying, and the staff of the University of Southern
Queensland, do not accept any responsibility for the truth, accuracy or
completeness of material contained within or associated with this dissertation.
Persons using all or any part of this material do so at their own risk, and not at
the risk of the Council of the University of Southern Queensland, its Faculty of
Engineering and Surveying or the staff of the University of Southern
Queensland.
This dissertation reports an educational exercise and has no purpose or validity
beyond this exercise. The sole purpose of the course pair entitled "Research
Project" is to contribute to the overall education within the student’s chosen
degree program. This document, the associated hardware, software, drawings,
and other material set out in the associated appendices should not be used for any
other purpose: if they are so used, it is entirely at the risk of the user.
Prof G Baker
Dean
Faculty of Engineering and Surveying
v
Certification I certify that the ideas, designs and experimental work, results, analyses and
conclusions set out in this dissertation are entirely my own effort, except where
otherwise indicated and acknowledged.
I further certify that the work is original and has not been previously submitted
for assessment in any other institution, except where specifically stated.
Aaron Massaro Student Number: 0050034503
Signature
Date

vi
Acknowledgements The author is greatly indebted to Lex McKenzie for providing encouragement
and guidance throughout the duration of the project.
I would also like to thank John Holland Pty Ltd, in particular Ian Cherry and
Simon Bazely, for the fabrication of all testing equipment and their assistance
throughout the duration of the project.
Lastly I would like to thank Loy Yang Power, in particular Joe Krusec, for
providing access to their laboratory and equipment, all of which was necessary to
undertake the required testing.
Aaron Massaro

vii
Contents Abstract ii Acknowledgments vi List of Figures xi List of Tables xiii Nomenclature xiv Chapter 1 Introduction 1 Chapter 2 Review of Water Ratio and Refractory Materials 2 Chapter 3 Mechanical Properties 8
3.1 Permanent Dimensional Change 8
3.1.1 Determination of Permanent Dimensional Change 9
3.2 Bulk Density 9
3.2.1 Determination of Bulk Density 10
3.3 Cold Compressive Strength 11
3.3.1 Determination of Cold Compressive Strength 11
3.4 Cold Modulus of Rupture 11
3.4.1 Determination of Cold Modulus of Rupture 12

Contents viii
3.5 Summary of Mechanical Properties 12 Chapter 4 Testing Equipment 13
4.1 Drying Oven 13
4.2 Firing Kiln 14
4.3 Dimensional Measurement Tool 15
4.4 Test Machine 16
4.4.1 Machine Frame 17
4.4.2 Hydraulic System 17
4.4.3 Bearing Pads 20
4.5 Summary of Test Equipment 21 Chapter 5 Testing Methodology 22
5.1 Preparation of Refractory Samples 22
5.2 Drying and Firing of Refractory Samples 24
5.2.1 Drying of Samples 25
5.2.3 Firing of Samples 26
5.3 Dimensional Measurement of Refractory Samples 27
5.4 Measurement of Permanent Dimensional Change 28
5.5 Measurement of Bulk Density 28
5.6 Measurement of Cold Crushing Strength 29
5.7 Measurement of Cold Modulus of Rupture 30
5.8 Summary of Methodology 32 Chapter 6 Test Results 34
6.1 Material Specifications 34
6.2 Measurements – Dimensions, Mass and Gauge Pressures 35

Contents ix
6.3 Determination of Results 35 Chapter 7 Discussion of Water Ratio and Test Results 37
7.1 Permanent Dimensional Change 37
7.1.1 Permanent Dimensional Change – Shiragun 160 38
7.1.2 Permanent Dimensional Change – LEL70488 38
7.1.3 Permanent Dimensional Change – Shiracast 145 Gun 39
7.1.4 Permanent Dimensional Change – Sila LW100 39
7.2 Bulk Density 40
7.2.1 Bulk Density – Shiragun 160 40
7.2.2 Bulk Density – LEL70488 41
7.2.3 Bulk Density – Shiracast 145 Gun 41
7.2.4 Bulk Density – Sila LW100 41
7.3 Cold Compressive Strength 42
7.3.1 Cold Compressive Strength – Shiragun 160 43
7.3.2 Cold Compressive Strength – LEL70488 43
7.3.3 Cold Compressive Strength – Shiracast 145 Gun 43
7.3.4 Cold Compressive Strength – Sila LW100 44
7.4 Cold Modulus of Rupture 44
7.4.1 Cold Modulus of Rupture – Shiragun 160 45
7.4.2 Cold Modulus of Rupture – LEL70488 45
7.4.3 Cold Modulus of Rupture – Shiracast 145 Gun 46
7.4.4 Cold Modulus of Rupture – Sila LW100 46
7.5 Summary 46
Chapter 8 Conclusions 49

Contents x
8.1 Achievement of Objectives 49
8.2 Further Work 50 References 51 Appendix A Project Specification A1 Appendix B Drying and Firing Schedules
B.1 Lightweight Drying and Firing Schedule B1
B.2 Dense Drying and Firing Schedule B2 Appendix C Product Datasheets
C.1 Shiragun 160 Product Datasheet C1
C.2 LEL70488 Product Datasheet C2
C.3 Shiracast 145 Gun Product Datasheet C3
C.4 Sila LW100 Product Information C4 Appendix D Test Results
D.1 Manufacturers’ Published Data D1
D.2 Refractory Samples D2
D.3 Test Results D3
D.4 Permanent Dimensional Change Results D4
D.5 Bulk Density Results D5
D.6 Cold Compressive Strength Results D6
D.7 Cold Modulus of Rupture Results D6

xi
List of Figures 2.1 Typical effect of water ratio on strength, porosity and density
(Pilbrico 1984). 6 2.2 Effect of casting water ratio on strength of various materials (Krietz
& Fisher 1989). 7 4.1 Drying oven with internal shelving for drying a number of samples
at any time. 14 4.2 Firing kiln complete with digital temperature programmer. 15 4.3 Sketch of dimensional measurement tool. 16 4.4 Dimensional measurement tool including 75.00 mm steel sample
for zeroing. 16 4.5 Test machine schematic diagram. 19 4.6 Test machine. 19 4.7 Cold compressive strength bearing pads and 75 mm cube sample. 20 4.8 Cold modulus of rupture bearing pads and brick sample. 21 5.1 Cast refractory samples. 24 5.2 Typical firing schedule (adapted from AS 1774.30 (2005)). 27 5.3 Dimensional measurement of cube sample in three planes. 28 5.4 Cold compressive strength test. 29 5.5 Cold modulus of rupture test. 31 7.1 Results - Permanent dimensional change. 38 7.2 Results – Bulk density. 40

List of Figures xii 7.3 Results – Cold compressive strength. 42 7.4 Results – Cold modulus of rupture. 45 B.1 Lightweight drying and firing schedule (courtesy of Shinagawa
Refractories Australasia Pty Ltd). B1 B.2 Dense drying and firing schedule (courtesy of Shinagawa
Refractories Australasia Pty Ltd). B2

xiii
List of Tables 5.1 Mixing ratio of water to refractory dry material. 23 5.2 Minimum drying times of refractory samples (adapted from
AS 1774.30 (2005)). 26 5.3 Determination of rate of application of force for cold compressive
test (adapted from AS 1774.1 (2000)). 30 5.4 Determination of rate of application of force for cold modulus of
rupture test (adapted from AS 1774.3 (2000)). 32 6.1 Summary of test materials’ mechanical properties. 34 6.2 Summary of measured mechanical properties. 36 D.1 Summary manufacturers’ published data. D1 D.2 List of refractory samples. D2 D.3 Summary of test results. D3 D.4 Results of permanent dimensional change tests. D4 D.5 Results of bulk density tests. D5 D.6 Results of cold compressive tests. D6 D.7 Results of cold modulus of rupture tests. D7

xiv
Nomenclature PDC: Permanent dimensional change. BD: Bulk density. CCS: Cold compressive strength CMOR: Cold modulus of rupture

1
Chapter 1 Introduction
Refractory materials are ceramics which exhibit great durability to high
temperatures. Refractories are manufactured from a variety of ceramic and non
oxide raw materials and require the addition of water to the dry materials which
bond loosely to form a workable product.
The manufacturer’s recommended water quantity is developed to provide
optimum mechanical properties. The ratio of water is a relatively dry mix which
is difficult to work with and difficult to place. Where placement conditions are
difficult or the ambient temperature is high additional time may be required to
prevent the refractory material from curing before the work is finished. To
overcome this additional water is used.
A common method of placement of refractory material is gunning. This requires
refractory material to be transported pneumatically from a dry mixing station to
the point of application where it is then mixed with water by means of a reed gun
or similar. The ratio of water to dry refractory material is adjusted by the
operator by controlling the delivery air pressure of the refractory material and the
water pressure. A certain degree of wastage is encountered in this method due to
rebounded material. Rebound can be reduced by increasing the water pressure,
thus increasing the ratio of water used.
The objectives of this report is to investigate the adverse effects on the
mechanical properties of a refractory material by the addition of water above the
recommended manufacturer’s ratio. The properties to be investigated are:
Chapter 1 Introduction 2
- permanent dimensional change;
- bulk density;
- cold compressive strength; and
- cold modulus of rupture.
The characteristics of each of these properties are outlined and their importance
to designing and developing a suitable refractory lining highlighted. Refractory
samples prepared according to manufacturer’s specifications are compared with
samples with additional water ratio used and any deviations in the mechanical
properties are investigated.

3
Chapter 2 Review of Water Ratio and Refractory Materials
Refractories are ceramic products manufactured for the express purpose of
withstanding high temperature corrosive conditions. As a class of materials,
refractories must have high melting temperatures, good hot strength, resistance to
chemical attack, resistance to abrasion, and tailored thermal properties (Jones and
Bernard 1993).
The science and testing of the mechanical properties of refractory materials has
evolved significantly since they first came into use. A thorough understanding of
the entire system including support structure, thermal conditions, chemical
properties and operating environment are required to predict the behaviour of a
refractory lining in service. The results of this type of testing are very complex
and can only be predicted using computer modelling.
Simple and reproducible tests have been developed to enable the mechanical
properties of a refractory material to be investigated which can be used to gain an
understanding of how the material will behave in service. These tests provide an
assurance that the material has been prepared to provide optimum performance.
The addition of water to a refractory dry material is necessary to create a
hydration reaction with the cement agents in commercially available refractory
materials. Alumina cements are the most commonly used binding agent and
require the addition of water to develop hydraulic setting. Despite having an
adverse effect on the strength of the refractory material at elevated temperatures

Chapter 2 Water Ratio and Refractory Materials 4 the use of alumina cements is necessary to provide strength during installation
(Richmond and Chaille 1984).
Refractory materials contain water in a number of forms. The most significant of
these are:
- Free water which is not combined in any way with the particles of the
refractory material and includes any excess water added during
preparation.
- Hydrate water which is associated with hydraulic bonding of the
refractory materials including the cements.
- Combined water which forms part of the molecular structure of the
refractory materials.
Free water present in a refractory material is dispersed by drying. This process
can be broken into two main stages. Firstly adiabatic evaporation at the exposed
surface occurs at ambient temperature and up to the boiling point of 100oC when
heated. Above this boiling point steam is generated and the pressure generated
drives the water from the pore spaces. It is critical at this second stage that the
rate of temperature increase is carefully monitored to allow trapped steam to
escape gradually. According to Innocentini et. al. 2001 if the rate of heating is
too rapid, steam is generated faster than it can be eliminated from the material
and its release is shifted chaotically to higher temperatures. Further to this,
liquid water retains all of the heat it receives while evaporating and the apparent
jump in temperature resulting when boiling finishes causes a thermal shock in the
refractory structure.
Further dewatering occurs at slightly higher temperatures depending on the
nature of the refractory material. It is at this point that hydrate water is lost
reverting crystalline structures within the atomic configuration of the material to
their dehydrated state (Grimshaw 1971).
Combined water forms part of the crystal lattice of refractory materials and is
only released at comparatively high temperatures. This is associated with the

Chapter 2 Water Ratio and Refractory Materials 5 decomposition of the mineral components and once removed the mineral is no
longer posses the characteristics of the original form (Grimshaw 1971).
The drying and firing of refractory materials must be controlled to prevent
defects. Some common defects associated with poor drying and firing practice
as described by Grimshaw (1971) are:
- Induced stress associated with differential drying between the surface and
the interior of the material.
- Segregation of fine particles as water moves to the surface.
- Rapid dewatering associated with excessive heat causing volatility in the
structure of the refractory material.
According to Pilbrico (1984) when refractory materials are mixed with water for
placement not all of this water is used in the hydraulic setting of the material but
is required for flowability. This excess water must be controlled and if not can
have significant effects on the structure of the dried and fired material ultimately
leading to undesirable mechanical properties.
Water for placement causes a discontinuous phase between the solids in the
refractory material. During drying this excess water is evaporated creating pores
which directly reduce the density of the dried material. A dense dried refractory
material with low porosity exhibits a greater bonding strength which is desirable
to improve the mechanical properties of the dried product. Another adverse
effect resulting from excess water is the tendency for the refractory slurry to
exhibit bleeding, where the segregation between fine and heavy particles
becomes pronounced (Pilbrico 1984).
A typical relationship between water ratio, strength (modulus of rupture),
porosity and density is shown in Figure 2.1. It is evident that there is a direct
relationship between density and porosity, the more dense a material the less
porous it will be. This can be expected because trapped water molecules will
create cavities, or pores, when evaporated thus reducing the density of the
refractory material. A high water ratio will provide low density and high

Chapter 2 Water Ratio and Refractory Materials 6 porosity. To achieve a high strength, a low water ratio is desirable but the water
requirements for placement must be considered.
Figure 2.1: Typical effect of water ratio on strength, porosity and density (Pilbrico
1984).
While water required for placement of a refractory material is necessary it is
evident that this ratio must be closely monitored. The adverse effect of increased
porosity and the associated reduction in density have led to recent developments
of low cement castables, LCC, which exhibit superior mechanical properties to
conventional refractory materials. Krietz and Fisher (1989) state that low cement
castables are sensitive to installation conditions and can have their physical
properties severely affected if excess water and / or improper placement
procedures are used.

Chapter 2 Water Ratio and Refractory Materials 7 Another group of products developed to increase density and tolerance to water
ratio variation are high cement, low moisture (HCLM) castables. These products
are a hybrid refractory material which combine certain aspects of LCC
technology with high cement make up similar to conventional castables. HCLM
castables possess high strength as well as being less sensitive to installation
conditions. HCLM castables have the advantage that where excess water is
present further hydration of the under-hydrated cement component present at the
optimum casting ratio occurs (Krietz and Fisher 1989).
The effect of additional water on the optimum cold compressive strength of
conventional, low cement, and high cement, low moisture castables is shown in
Figure 2.2. It is clearly shown that a small increase in castable water
significantly reduces the strength of conventional and low cement castables while
exhibiting an increase in strength in high cement, low moisture castables.
Cold Compressive Strength v's Casting Water Ratio
0
20
40
60
80
100
120
LCC HCLM CC
Material Type
% C
CS
of O
ptim
um C
astin
g W
ater
Rat
io Optimum WaterOptimum + 1%Optimum + 1.5%
Figure 2.2: Effect of casting water ratio on strength of various materials (Krietz &
Fisher 1989).

8
Chapter 3 Mechanical Properties
The mechanical properties of a refractory material determine how the material
will behave physically. The mechanical properties under investigation are
permanent linear change, bulk density, cold compressive strength and cold
modulus of rupture.
The mechanical properties of refractory materials vary with the state in which
they are measured. The various states in which a refractory material can exist
can be summarised as:
- cast;
- dried; and
- fired.
It is important when measuring the mechanical properties of a refractory material
that the state be recorded as the properties can vary substantially between states.
3.1 Permanent Dimensional Change
The permanent dimensional change of a refractory material is a measure of the
degree of expansion or contraction of the material from its dried state to its fired
state. It is important to know and understand a refractory material’s permanent
Chapter 3 Mechanical Properties 9 dimensional change so that when designing a refractory lining no undue stresses
are developed due to the mechanisms of this expansion or contraction.
The permanent dimensional change of a refractory material is associated with the
removal of hydrated and combined water and generally a reduction in size is
experienced. An understanding of permanent dimensional change is necessary to
determine what type of supporting methods can be successfully adopted to
develop a refractory lining and the degree and spacing of expansion joints if
necessary.
3.1.1 Determination of Permanent Dimensional Change
Permanent dimensional change is a unit free percentage of a refractory material’s
change in dimensions between changes in state. The permanent dimensional
change can be either positive or negative and is given by:
(3.1) 100
0
01 ×−
=∆L
LLL
where ∆L is permanent dimensional change [%];
L0 is length at initial state [mm];
L1 is length at final state [mm].
3.2 Bulk Density
The bulk density of a refractory material is a measure of the amount of material
mass in a given volume. The bulk density of a refractory material provides an
indication to the suitability of a material for its use in varied applications.
Broadly speaking refractory materials can be classified into three categories
based on the material’s bulk density:
Chapter 3 Mechanical Properties 10
- Light weight refractories which are used primarily as insulating
refractories.
- Medium weight refractories which can serve to fill the role of either a
light weight or dense refractory in specialised circumstances.
- Dense refractories which act as a protective barrier at the working face of
a refractory lining.
The bulk density of a refractory material can vary depending on the state. A
green refractory material which has undergone no drying retains a large amount
of free water located in pores throughout the material and as such exhibits a high
bulk density. As free water is evaporated during drying the bulk density
decreases. A further decrease in bulk density is experienced as hydrated water is
lost. The high temperature loss of combined water changes the chemical
composition of the refractory material and is often associated with an increase in
bulk density as pores are filled with the new minerals. At each of these stages
the material shrinks and loses mass, the bulk density being a factor of these
properties.
3.2.1 Determination of Bulk Density
Bulk density takes into consideration the mass and volume of a refractory
material and can be measured in any state provided that the state is recorded. It
is most commonly measured in the fired state as this provides the true working
density. The bulk density of a refractory material is determined by:
(3.2) HWL
mDb ××=
where Db is bulk density [kg/m3];
m is mass [kg];
L is length [m];
W is width [m];
H is depth [m].

Chapter 3 Mechanical Properties 11
3.3 Cold Compressive Strength
The cold compressive strength of a refractory material is a measure of a
refractory material’s ability to withstand compressive forces before failure. An
understanding of the cold compressive strength provides a measurement of the
effectiveness of the refractory material’s chemical bonding. As refractory
materials are significantly stronger in compression than in tension a true
compressive failure is very difficult to achieve. Despite this the cold
compressive strength is the industry benchmark for determining a refractory
material’s strength as the test is easily undertaken and the results obtained are
reproducible.
3.3.1 Determination of the Cold Compressive Strength
Cold compressive strength is a pressure measurement and is determined by the
force applied over a given area to cause failure. The cold compressive strength is
measured as such:
(3.3) WL
FSc ×=
where Sc is cold compressive strength [Pa];
F is force at failure [N];
L is length [m];
W is width [m].
3.4 Cold Modulus of Rupture
The cold modulus of rupture is a measure of a refractory material’s resistance to
bending or flexural load before failure occurs. The cold modulus of rupture is an
important measure when selecting a material for a refractory lining when

Chapter 3 Mechanical Properties 12 bending forces are expected. The test for cold modulus of rupture is relatively
simple and reproducible and as such is an important quality control test.
3.4.1 Determination of Cold Modulus of Rupture
When determining the cold modulus of rupture a load is applied over the
longitudinal centre of a simply supported specimen. A measurement of cold
modulus of rupture can be measured as such:
(3.4) 22
3HWLFTr ××
××=
where Tr is cold modulus of rupture [Pa];
F is force at failure [N];
L is span between support surfaces [m];
W is width [m];
H is depth [m].
3.5 Summary of Mechanical Properties
When selecting a material for a refractory lining it is important to know how the
material will withstand compressive and tensile forces, how it will expand or
contract from initial to final state and what mass can be expected for any given
volume.
The combination of permanent linear change, bulk density, cold compressive
strength and cold modulus of rupture provide the user with information on the
mechanical properties of refractory materials. Other mechanical properties that
are often used are mechanical stress, mechanical strain, thermal expansion, hot
modulus of rupture and abrasion resistance.

13
Chapter 4 Testing Equipment
To successfully prepare and test the mechanical properties of refractory materials
it is necessary to have suitable equipment. Refractory test samples need to be
prepared and tested in accordance with Australian Standard AS1774 and it is this
Standard that determines what type of equipment is suitable for use.
The key pieces of equipment required to prepare samples and determine the
mechanical properties of refractory materials detailed in Chapter 3 are:
- Drying oven capable of holding temperature at 110o Celsius.
- Firing kiln capable of reaching temperatures over 1300o Celsius.
- Dimensional measurement equipment capable of measuring the centre
point of rectangular samples.
- Weighing device capable of measuring mass to within 1 gram.
- Test machine capable of applying a load for cold compressive tests or
cold modulus of rupture tests.
4.1 Drying Oven
The drying oven is a common laboratory oven used for sterilising equipment.
The oven is capable of reaching temperatures to 200o Celsius and temperature
control is achieved by a simple analogue dial. To ensure that the temperature
inside the oven is 110o Celsius it is necessary to operate the oven free of any

Chapter 4 Testing Equipment 14 refractory samples prior to commencing drying and use a thermometer to set the
scale on the dial accurately.
Figure 4.1: Drying oven with internal shelving for drying a number of samples at
any time.
4.2 Firing Kiln
To properly prepare refractory samples for testing it is necessary that the firing
kiln be able to achieve any combination of the following parameters:
- Ramp up / ramp down with a rate of 15 - 600o Celsius per hour.
- Hold or soak at any given temperature of operation.
- Achieve maximum operation temperature of 1300o Celsius.
The firing kiln shown in Figure 4.2 provided all of the above requirements. The
kiln is fully temperature programmable which allows it to be set for the full firing
cycle of each type of refractory material. Four different cycles can be saved at
any one time which reduces the need to reprogram if only a small range of firing
cycles are required. A digital display indicates the current temperature of the

Chapter 4 Testing Equipment 15 kiln, the current cycle, the firing phase, elapsed time and time remaining, and
positive or negative trend when ramping.
Figure 4.2: Firing kiln complete with digital temperature programmer.
4.3 Dimensional Measurement Tool
It is important to take accurate dimensional measurements of refractory test
pieces to ensure the validity of test results. This requires that the instrument be
capable of measuring the distance between the centres of opposing faces of a
75 mm cube to an accuracy of 0.1 mm.
This was achieved by developing a rig fabricated from steel which supports a
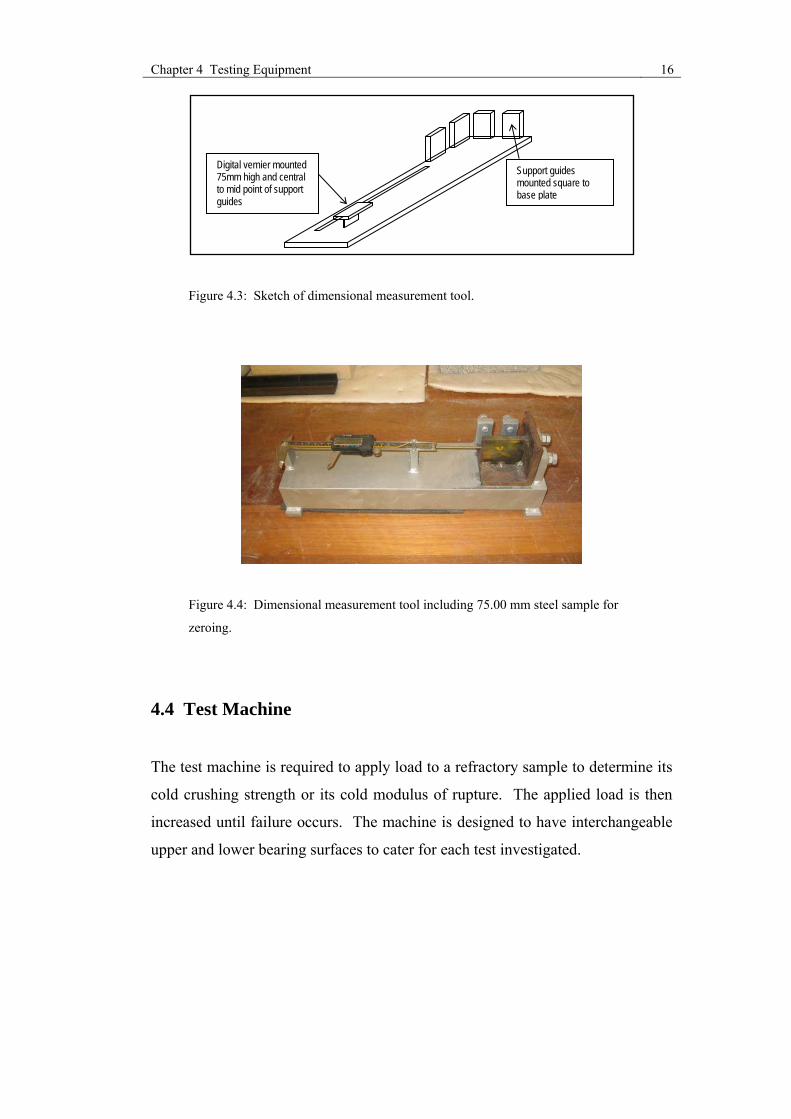
75 mm cube and is complete with a digital vernier mounted so as to measure the
centre of the cube as shown in Figure 4.3 and Figure 4.4. In order to zero the
vernier a 75 mm steel calibration piece was fabricated which rested centrally in
the supports of the rig.
Chapter 4 Testing Equipment 16
Digital vernier mounted 75mm high and central to mid point of support guides
Support guides mounted square to base plate
Figure 4.3: Sketch of dimensional measurement tool.
Figure 4.4: Dimensional measurement tool including 75.00 mm steel sample for
zeroing.
4.4 Test Machine
The test machine is required to apply load to a refractory sample to determine its
cold crushing strength or its cold modulus of rupture. The applied load is then
increased until failure occurs. The machine is designed to have interchangeable
upper and lower bearing surfaces to cater for each test investigated.

Chapter 4 Testing Equipment 17 4.4.1 Machine Frame
The machine frame provides the structure for supporting all of the components
necessary to undertake the required test. In its design the following aspects had
to be considered and met:
- Ability to withstand forces applied during testing.
- House the hydraulic ram including hosing.
- House test sample lower bearing supports.
- Provide protection to the machine operator from projectile material and
moving parts under load.
- Be easily and inexpensively fabricated.
The frame is fabricated from readily available steel sections and plate and
incorporates a mounting bracket to suit the hydraulic ram and Perspex safety
shields with a locking front access door. The base of the frame provides an area
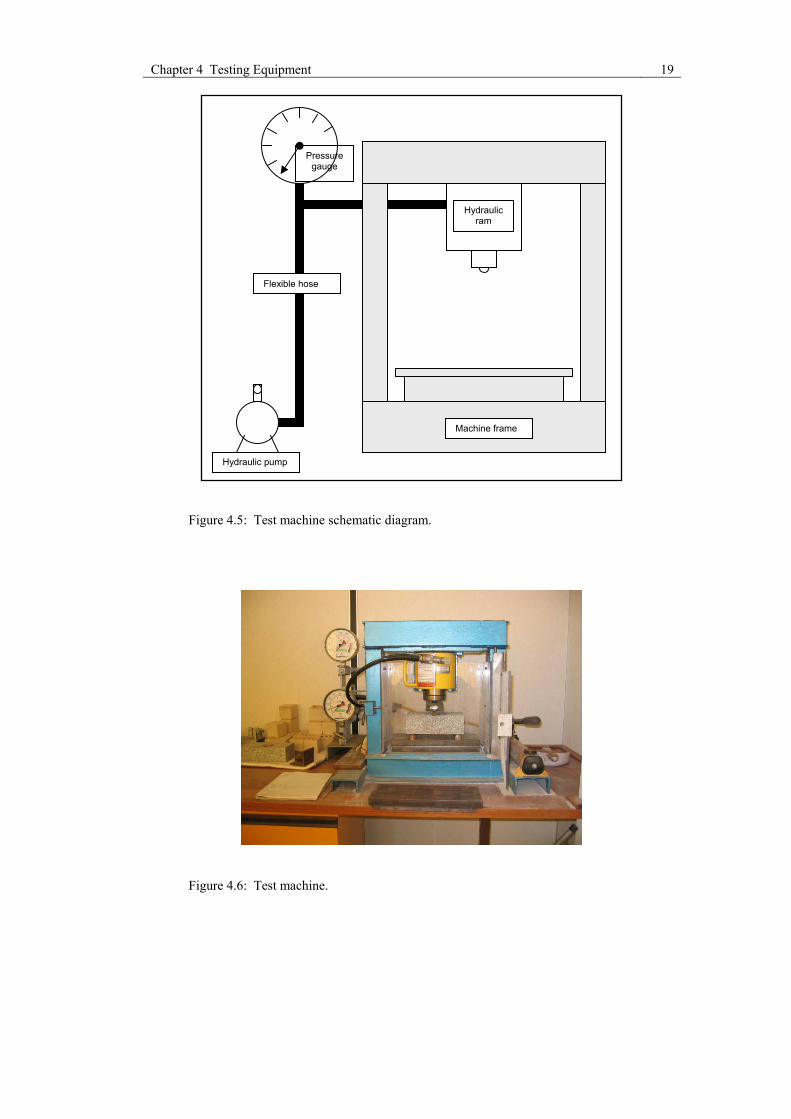
for mounting the test sample lower bearing supports. The test machine including
the hydraulic ram is shown in Figure 4.5 and Figure 4.6.
4.4.2 Hydraulic System
The purpose of the hydraulic system is to deliver the pressure to the refractory
test sample. A number of components are used in the hydraulic system:
- hydraulic oil pump;
- hydraulic ram;
- pressure gauge;
- isolation valve; and
- flexible pressure hose.
The hydraulic oil pump is manually operated and is capable of applying pressure
to the degree and rate required to test refractory samples for cold compressive

Chapter 4 Testing Equipment 18 strength and cold modulus of rupture. The pump is commercially available and
simple and inexpensive to operate and maintain.
The hydraulic ram is suitable for inverted operation and can be fitted with a
range of rod sizes which can be used to control the rate of pressure applied to the
refractory test sample. Each rod is fitted with a spherical end which mates with
the various upper bearing pieces used in the tests.
To record the pressure in the hydraulic system low pressure and high pressure
gauges are used which are calibrated and NATA certified. The low pressure
gauge is rated to 70 bar and can be isolated from the system by a manual
isolation valve at any time if this pressure is to be exceeded. The high pressure
gauge is always live and has a range to 700 bar. The gauges are mounted on a
stand which can be positioned so as to be clearly visible to the operator at all
times.
To complete the hydraulic system flexible hose is used. The hose joins each of
the components by means of hydraulic fittings suitable for use with hydraulic oil.
Chapter 4 Testing Equipment 19
Flexible hose
Machine frame
Hydraulic ram
Pressure gauge
Hydraulic pump
Figure 4.5: Test machine schematic diagram.
Figure 4.6: Test machine.
Chapter 4 Testing Equipment 20 4.4.3 Bearing Pads
To apply the load to the test samples for cold compressive strength and cold
modulus of rupture, different support surfaces are required to ensure that the
bearing areas are suitable for the test.
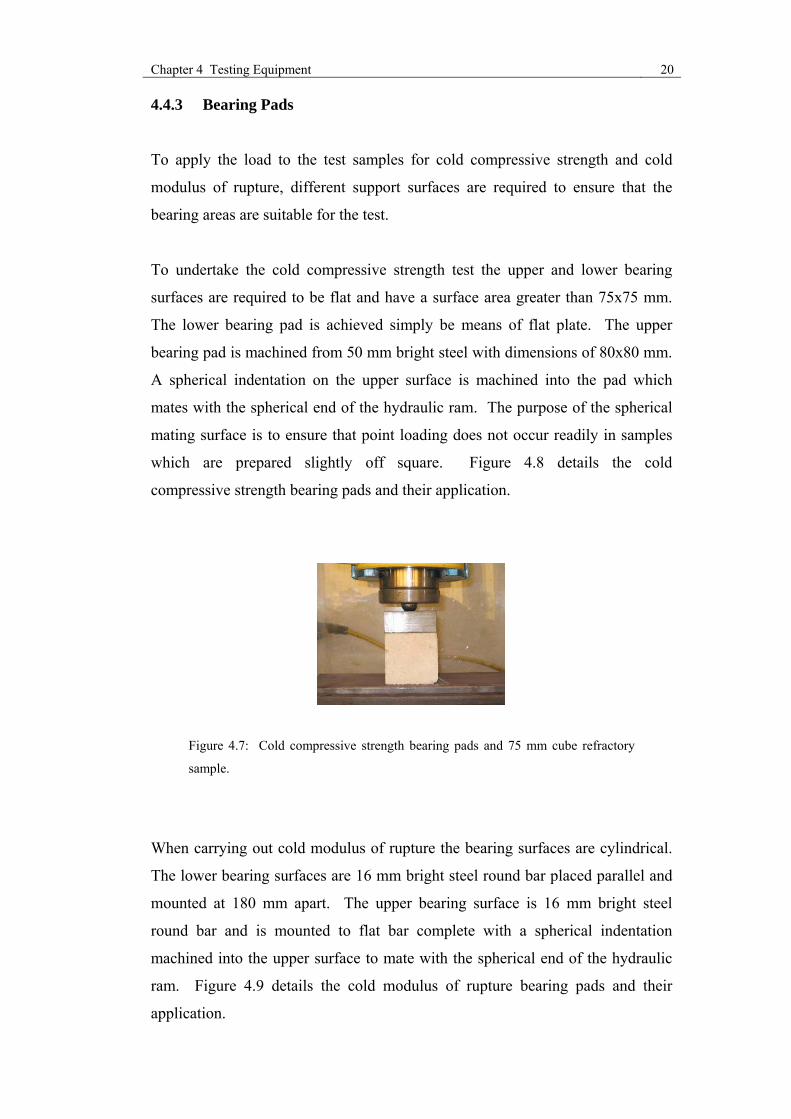
To undertake the cold compressive strength test the upper and lower bearing
surfaces are required to be flat and have a surface area greater than 75x75 mm.
The lower bearing pad is achieved simply be means of flat plate. The upper
bearing pad is machined from 50 mm bright steel with dimensions of 80x80 mm.
A spherical indentation on the upper surface is machined into the pad which
mates with the spherical end of the hydraulic ram. The purpose of the spherical
mating surface is to ensure that point loading does not occur readily in samples
which are prepared slightly off square. Figure 4.8 details the cold
compressive strength bearing pads and their application.
Figure 4.7: Cold compressive strength bearing pads and 75 mm cube refractory
sample.
When carrying out cold modulus of rupture the bearing surfaces are cylindrical.
The lower bearing surfaces are 16 mm bright steel round bar placed parallel and
mounted at 180 mm apart. The upper bearing surface is 16 mm bright steel
round bar and is mounted to flat bar complete with a spherical indentation
machined into the upper surface to mate with the spherical end of the hydraulic
ram. Figure 4.9 details the cold modulus of rupture bearing pads and their
application.

Chapter 4 Testing Equipment 21
Figure 4.8: Cold modulus of rupture mounting pads and brick sample.
4.5 Summary of Test Equipment
The primary criteria for equipment selection was fitness for purpose, with the
purpose being to successfully undertake mechanical tests on refractory samples
in accordance with Australian Standards and manufacturers’ recommendations.
The underlying factors behind the selection of the equipment used were:
1. Develop and utilise strategies for using equipment and materials already
on hand.
2. Purchase specialised equipment where necessary which was inexpensive
and met the primary criteria.
3. Ease of fabrication and maintenance of components.
4. Ease and safety of operation.

22
Chapter 5 Testing Methodology
All refractory testing has been carried out to Australian Standards and is detailed
in each section of this chapter. To test the effects of water ratio on the
mechanical properties of the refractory material the manufacturer’s
recommendations of water content was used as a benchmark and increases to this
water ratio were investigated.
5.1 Preparation of Refractory Samples
Refractory material is available in a dry powder form complete with any cement
and aggregate and requires the addition of water. Manufacturers provide a
recommended water content as a percentage of mass. Typically a dense
refractory dry material will require between 5-15% water by mass when mixed
depending on the material used and lightweight materials can require over 100%
water by mass.
The dry refractory material is mixed to ensure that all constituents are evenly
distributed. The dry mix is then weighed to determine the mass. Water of
potable quality is added to the dry mixture to produce refractory samples with
varying degrees of water ratio as per Table 5.1. To achieve this each batch of dry
material must be carefully weighed to ensure the mass of water added provides
the required mixing ratio. Each material was prepared in 5 batches according to
the following water to dry material ratio:
Chapter 5 Testing Methodology 23
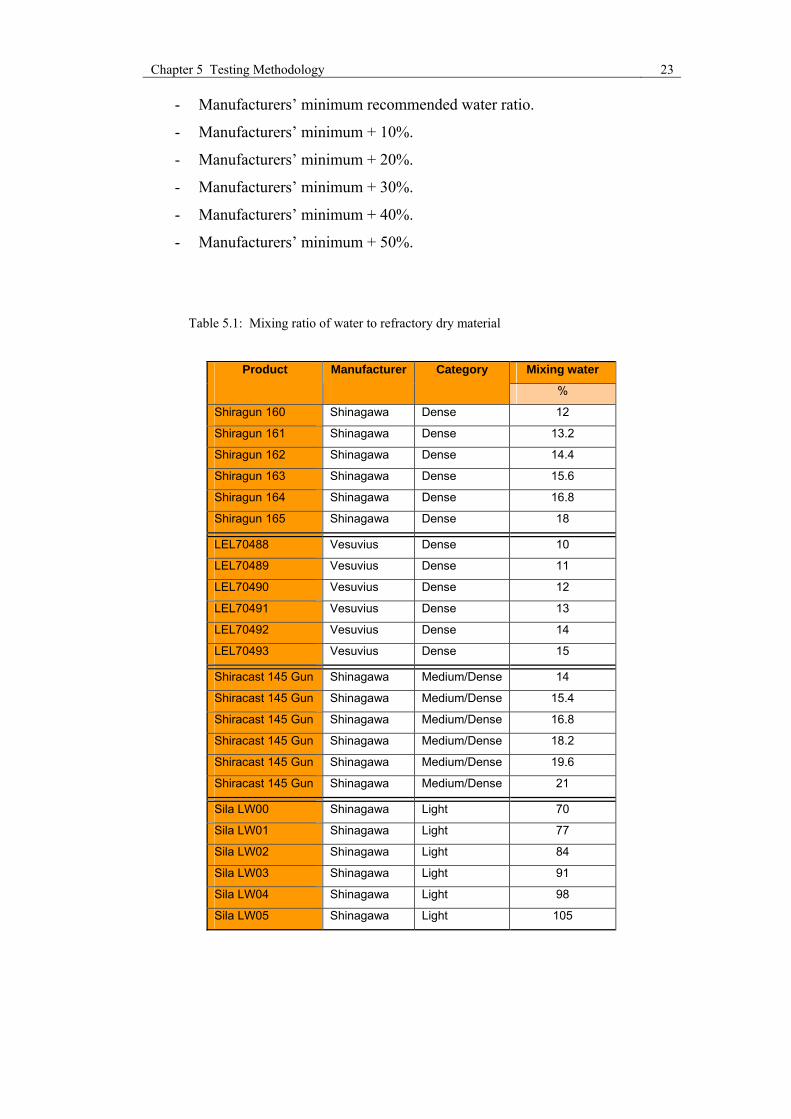
- Manufacturers’ minimum recommended water ratio.
- Manufacturers’ minimum + 10%.
- Manufacturers’ minimum + 20%.
- Manufacturers’ minimum + 30%.
- Manufacturers’ minimum + 40%.
- Manufacturers’ minimum + 50%.
Table 5.1: Mixing ratio of water to refractory dry material
Mixing water Product
Manufacturer
Category %
Shiragun 160 Shinagawa Dense 12
Shiragun 161 Shinagawa Dense 13.2
Shiragun 162 Shinagawa Dense 14.4
Shiragun 163 Shinagawa Dense 15.6
Shiragun 164 Shinagawa Dense 16.8
Shiragun 165 Shinagawa Dense 18
LEL70488 Vesuvius Dense 10
LEL70489 Vesuvius Dense 11
LEL70490 Vesuvius Dense 12
LEL70491 Vesuvius Dense 13
LEL70492 Vesuvius Dense 14
LEL70493 Vesuvius Dense 15
Shiracast 145 Gun Shinagawa Medium/Dense 14
Shiracast 145 Gun Shinagawa Medium/Dense 15.4
Shiracast 145 Gun Shinagawa Medium/Dense 16.8
Shiracast 145 Gun Shinagawa Medium/Dense 18.2
Shiracast 145 Gun Shinagawa Medium/Dense 19.6
Shiracast 145 Gun Shinagawa Medium/Dense 21
Sila LW00 Shinagawa Light 70
Sila LW01 Shinagawa Light 77
Sila LW02 Shinagawa Light 84
Sila LW03 Shinagawa Light 91
Sila LW04 Shinagawa Light 98
Sila LW05 Shinagawa Light 105

Chapter 5 Testing Methodology 24 The mixed refractory material is then cast into moulds developed to provide
75 mm cubes for testing permanent dimensional change, bulk density and cold
compressive strength and 230x115x75 mm bricks for testing cold modulus of
rupture as shown in Figure 5.1. Each mould is labelled with the cast material and
water ratio used to provide traceability of sample batches. The cast samples
remain in the moulds until sufficiently cured to enable removal without
damaging the sample. Once removed from the mould the upper surface is
trimmed using a diamond tipped brick saw to provide a flat and level surface
with a height of 75mm. It is important to record the direction of casting and it is
at this point iron oxide identification can be applied to the upper surface of the
sample by means of a small artist’s paint brush. Before drying of refractory
samples can commence, all free water present as a result of casting and cutting
must be allowed to evaporate.
Figure 5.1: Cast refractory samples displaying visible difference associated with
water ratio.
5.2 Drying and Firing of Refractory Samples
After a refractory sample has been prepared in accordance with Section 5.1 it
must be allowed to cure at ambient temperatures before applying any additional
heat. Curing times vary with different refractory materials and manufacturer’s
recommendations should be followed. Additional curing time may be required
where the water ratio used exceeds that recommended by the manufacturer and
Chapter 5 Testing Methodology 25 this should be taken into consideration before any drying at elevated temperature
occurs.
After curing, the refractory sample is then dried to achieve constant mass
following which it is then fired to test temperature. Australian Standard
AS 1774.30 Refractory and refractory materials – Physical test methods, Method
30: Drying and firing schedules (2005) provides recommended minimum
heating times and heating rates for different density categories of refractory
materials.
It is important to note that refractory Manufacturer’s recommendations may
differ from those provided in AS 1774.30 (2005) and where this is the case the
longer durations or slower rates should apply. If a heating rate is too high then
undesirable physical properties may develop such as spalling and cracking and in
some cases explosive failure may occur.
5.2.1 Drying of Samples
Drying is the process of removing the free water present in refractory materials
and it is important that the drying temperature does not exceed 115o Celsius.
Drying is achieved by placing the refractory samples in a drying oven such as
that outlined in Section 4.1 set to a constant temperature of 110o Celsius. The
drying temperature must be maintained with an accuracy of ± 5o Celsius. The
recommended minimum drying times recommended by AS 1774.30 (2005) are
shown in Table 5.2.
At regular intervals not exceeding two hours each sample is removed from the
drying oven and the mass recorded. Constant mass is achieved when two
consecutive weighings do not differ by more than 0.5%. Dried refractory
samples are then allowed to cool under ambient conditions to enable safe
handling when carrying out further testing. It is important that the rate of drying
is not too rapid as a dried surface may cause water to be trapped within the
interior of the sample.

Chapter 5 Testing Methodology 26
Table 5.2: Minimum drying times of refractory samples (adapted from
AS 1774.30 (2005)).
Drying time Type
h
Dense 16
Medium 24
Lightweight 36
5.2.2 Firing of Samples
After recording the dimensions of each dried refractory sample the specimen is
then fired. A firing schedule consists of at least 5 stages, and in the case of a test
temperature being equal to or greater than 1000o Celsius at least 6 stages as
follows:
1. primary ramp up;
2. secondary ramp up;
3. final ramp up;
4. soak at test temperature;
5. ramp down if above 1000o Celsius; and
6. natural cool.
The firing schedule including ramp rates and soaking durations recommended by
AS 1774.30 (2005) is shown in Figure 5.2. Again it must be noted here that
Manufacturer’s recommendations must be followed if the ramp rate is lower or
the duration longer. In actuality this is usually the case. Appendix 2 contains
firing schedules for dense and lightweight refractory materials.
The firing kiln specified in Section 4.2 is used to fire the test samples after
drying. The kiln is programmed using the ramp durations and soaking times as
specified by the manufacturer where available or using the typical firing schedule
in Figure 5.2. To ensure that the test temperature has been reached, rated
pyrometric cones which deform at a nominated temperature are used.

Chapter 5 Testing Methodology 27
0
200
400
600
800
1000
1200
1400
0 100 200 300 400 500 600 700 800 900 1000
Time, minutes
Tem
pera
ture
, deg
rees
CStage 5 5oC/min to 10oC/min Stage 4
Stage 3 to 400oC below test temp. Soak 5 – 12 hrs 1oC/min to 2oC/min at test temp. to test temp.
Figure 5.2: Typical firing schedule (adapted from AS 1774.30 (2005)).
5.3 Dimensional Measurement of Refractory Test Samples
Refractory samples are dimensionally measured after drying as described in
Section 5.2.1 and after firing as described in Section 5.2.2. The dimensional
measurement tool detailed in Section 4.3 is calibrated by zeroing the vernier with
the 75.00 mm cube calibration piece firmly in place.
Each 75 mm cube sample is then measured in three planes by rotating the sample
in the apparatus. The casting direction as indicated by the iron oxide
identification label is important and the dimension in this direction is always
clearly noted. A positive reading on the vernier indicates the sample is less than
75 mm and the reading must be subtracted from 75 mm to give the actual
dimension. The opposite is the case for a negative reading. The dimensional
measurements obtained are recorded and are important for future use in
determining the mechanical properties detailed in the following sections.
Stage 1 10oC/min to 400oC below test temp.
Stage 2 2oC/min to 5oC/min to 100oC below test temp.
Stage6 Natural cool to ambient

Chapter 5 Testing Methodology 28
5.4 Measurement of Permanent Dimensional Change
The measurement of permanent dimensional change as described in Section 3.1
is a measure of the change in a refractory material’s dimensions between the cast
and the fired state. Australian Standard AS 1774.13 Refractory and refractory
materials – Physical test methods, Method 13: Permanent dimensional change
(2000) outlines the procedure for determining a refractory sample’s permanent
dimensional change.
Each 75 mm sample cube is measured across each plane, x, y and z, with z
always being direction of casting as per figure 5.3, across the centre of the face
after the sample has been dried. The sample is then fired and remeasured across
each plane. A ratio of change in dimension is obtained using Equation 3.1.
z
y
x
Figure 5.3: Dimensional measurement of cube sample in three planes.
5.5 Measurement of Bulk Density
The measurement of bulk density as described in Section 3.2 determines the
mass of material in a given volume. After a 75 mm cube refractory sample has
been fired and measured across planes x, y and z its mass is measured and
recorded. Australian Standard AS 1774.5 Refractory and refractory materials –
Physical test methods, Method 5: Determination of density, porosity and water
absorption (2001) details the measurement of a refractory sample’s bulk density
and the bulk density is determined using Equation 3.2.

Chapter 5 Testing Methodology 29
5.6 Measurement of Cold Crushing Strength
The measurement of cold crushing strength as detailed in Section 3.3 is the
industry benchmark in determining a refractory material’s strength. It is a
measure of a refractory material’s ability to withstand a compressive force before
failure.
The cold crushing strength is obtained by crushing a fired 75 mm cube refractory
sample according to Australian Standard AS 1774.1 Refractories and refractory
materials – Physical test methods, Method 1: Determination of cold compressive
strength (2000).
The refractory sample is measured dimensionally across the x and y planes and
the cross sectional area determined. The sample is placed in the test machine
detailed in Section 4.4 in the same direction of casting as shown in Figure 5.3.
The cold compressive strength bearing pads are adjusted to ensure that the
applied force is distributed evenly over the test face of the sample. This step is
very important as point loading can occur if continuous contact is not made
between the bearing surfaces and the faces of the sample. The hydraulic pressure
gauges are zeroed before any force is applied to the sample.
Sample indicating cast direction
5.4: Cold compressive strength test.

Chapter 5 Testing Methodology 30 A force is applied to the sample until failure occurs. The rate of this force is
dependent on the anticipated results of the cold compressive strength of the test
material and is shown in Table 5.3. As the gauges in the hydraulic system of the
test machine read the oil pressure of the system it is important to convert this
pressure to the force applied by the hydraulic ram. The cross sectional area of
the ram is used and the force is calculated as follows:
(5.1) 4
2dPF gaugeπ
=
where Pgauge is gauge pressure [Pa];
F is force [N];
d is diameter of hydraulic ram [m].
Table 5.3: Determination of rate of application of force for cold compressive test
(adapted from AS 1774.1 (2000)).
Cold compressive
strength
Rate of application of
force
MPa kN/s
≤ 10 1.0 ± 0.1
> 10 2.5 ± 0.25
The force at which failure occurs is recorded. This force and the dimensional
measurements enable the determination of cold compressive strength by means
of Equation 3.3.
5.7 Measurement of Cold Modulus of Rupture
The measurement of cold modulus of rupture is an indication of a refractory
material’s ability to withstand a bending force as indicated in Section 3.4. The

Chapter 5 Testing Methodology 31 test is carried out on a brick sample measuring 230 x 115 x 75 mm. The cold
modulus of rupture is obtained by testing according to Australian Standard AS
1774.3 Refractories and refractory materials – Physical test methods, Method 3:
Determination of cold modulus of rupture (2000).
A brick sample is prepared and fired as in Sections 5.1 and 5.2. The sample is
then dimensionally measured across its width and height. The length of the
sample is not critical as the sample will be supported in the test machine on the
cold modulus of rupture bearing pads.
The sample is placed in the test machine as detailed in Section 4.4 and supported
by the cold modulus of rupture bearing pads with the direction of casting
vertically as shown in Figure 5.4. The sample and the bearing pads are adjusted
to ensure the load will be applied transversely across the upper surface of the
sample. All pressure gauges are zeroed and all safety mechanisms are in place
before and load is applied to the sample.
Sample indicating cast direction
5.5: Cold modulus of rupture test.
A force is applied to the sample until failure occurs. The rate of this force is
dependent on the anticipated results of the cold modulus of rupture of the test

Chapter 5 Testing Methodology 32 refractory material and is shown in Table 5.4. As detailed in Section 5.6 the
force must be determined by converting the hydraulic gauge pressure using the
ram cross sectional area as shown in Equation 5.1.
The force at which failure occurs is recorded. This force and the dimensional
measurements enable the determination of cold modulus of rupture by means of
Equation 3.4.
Table 5.4: Determination of rate of application of force for cold modulus of
rupture test (adapted from AS 1774.3 (2000)).
Cold modulus of
rupture
Rate of application of
force
MPa N/s
≤ 2 75 ± 8
>2 ≤ 5 150 ± 15
> 5 300 ± 30
5.8 Summary of Methodology
The preparation of samples requires that clean and potable water is used. Care
must be taken to accurately weigh all dry material to ensure that the volume of
water added is accurate. All samples must be clearly labelled with reference to
the material and water ratio used to ensure that there is full traceability when
carrying out tests.
Curing, drying and firing times and rates should follow manufacturer’s
recommendations where available. Where these are not available
AS 1774.30 (2005) can be used. Where a refractory sample has been prepared
with additional water than recommended by the manufacturer, additional time for
curing and drying should be allowed.
Chapter 5 Testing Methodology 33 The dimensional measurements of a refractory sample are important for
determining each of the mechanical properties investigated. It is important that
each sample is clearly labelled and referenced accordingly to ensure the accuracy
of the results obtained.
Mechanical tests involving the test machine require that the hydraulic pressure be
converted to a force to determine the actual load at which failure occurred. It is
important that the hydraulic gauges be zeroed between tests and that the samples
are placed level on clean bearing surfaces.
All measurements recorded must be applied using the appropriate calculation to
obtain the results of the tests.

34
Chapter 6 Test Results
Measurements of dimensions, mass and gauge pressure are recorded in
Appendix D and the equations of Chapter 3 applied to determine the mechanical
properties of permanent dimensional change, bulk density, cold compressive
strength and cold modulus of rupture.
6.1 Material Specifications
Each manufacturer provides datasheets for their products which document the
recommended water ratio and the mechanical properties to be expected.
Appendix C contains datasheets for the test materials used and these properties
are summarised in table 6.1.
Table 6.1: Summary of test materials’ mechanical properties.
Mixing water PDC BD CCS CMOR Product % % kg/m3 MPa MPa
Shiragun 160 12 to 15 -0.3 to -0.1 2140 to 2240 80 to 95 12 to 15
LEL70488 10 to 12 -0.2 2150 80 10
Shiracast 145 Gun 14 to 16 -0.3 to -0.1 1870 to 1970 15 to 35 3 to 6
SilaLite LW100 70 to 90 -0.3 to -0.2 650 to 800 2 to 3 0.1 to 0.8

Chapter 6 Test Results 35 It is common for manufacturers to provide a range of water ratios to be used and
a range of expected values for each of permanent dimensional change, bulk
density, cold compressive strength and cold modulus of rupture as can be seen
from Table 6.1.
6.2 Measurements - Dimensions, Mass and Gauge Pressures
Each cube refractory sample can be used to determine the permanent
dimensional change, bulk density and cold compressive strength. To avoid any
duplication all recorded dimensions are measured once only and the data
obtained used for each of the tests. All of the recorded measurements and the
results obtained are found in Appendix D.
To determine the permanent dimensional change of a refractory sample
dimensional measurements are taken in the x, y and z direction after drying each
cube sample and then once again after each sample has been fired. The mass of
the fired samples then determines the bulk density. Each fired cube is then
crushed and the gauge pressure at failure recorded to determine the cold
compressive strength. To determine the cold modulus of rupture each brick
shaped refractory sample is dimensionally measured in the x and z direction and
the data recorded. Each brick sample is then subjected to a bending force in the
test machine and the gauge pressure at failure recorded.
6.3 Determination of Results
The recorded measurements detailed in Section 6.2 are then applied to each of
the equations in Chapter 3 to determine the value of each of the mechanical
properties tested and are listed in Table 6.2.

Chapter 6 Test Results 36
Table 6.2: Summary of measured mechanical properties.
Water ratio PDC BD CCS CMOR Product
% man. min. % kg/m3 MPa MPa
Shiragun 160 100 -0.200 2463 95.79 20.57
Shiragun 160 110 -0.215 2338 81.63 16.38
Shiragun 160 120 -0.315 2160 81.86 12.16
Shiragun 160 130 -0.417 2091 77.17 8.93
Shiragun 160 140 -0.488 2084 72.15 3.31
Shiragun 160 150 -0.522 2046 52.43 2.62
LEL70488 100 -0.137 2268 74.65 13.42
LEL70488 110 -0.243 2169 68.61 8.42
LEL70488 120 -0.296 2132 64.88 4.28
LEL70488 130 -0.358 1982 49.01 3.13
LEL70488 140 -0.478 1871 40.33 2.43
LEL70488 150 -0.483 1812 32.30 2.00
Shiracast 145 Gun 100 -0.163 1876 28.38 7.72
Shiracast 145 Gun 110 -0.231 1862 26.71 5.36
Shiracast 145 Gun 120 -0.331 1812 23.32 4.26
Shiracast 145 Gun 130 -0.339 1675 17.84 3.85
Shiracast 145 Gun 140 -0.464 1465 9.90 3.47
Shiracast 145 Gun 150 -0.547 1381 4.41 3.05
SilaLite LW100 100 -0.244 798 2.93 3.41
SilaLite LW100 110 -0.232 738 2.69 3.63
SilaLite LW100 120 -0.266 691 2.46 3.32
SilaLite LW100 130 -0.272 590 2.42 2.92
SilaLite LW100 140 -0.263 462 2.20 2.72
SilaLite LW100 150 -0.289 408 2.10 2.50
37
Chapter 7 Discussion of Water Ratio and Test Results
To properly analyse the results obtained in Section 6 each of the properties tested
has to be looked at individually. As each material tested exhibits different
mechanical properties and varying susceptibility to the water ratio used it is
important to further differentiate the results by test material.
7.1 Permanent Dimensional Change
As mentioned earlier the permanent dimensional change is the degree of
expansion of contraction of a refractory material between states. The permanent
dimensional change measured is between the dried and fired states of each of the
materials tested. All of the materials exhibited a reduction in dimensions in all
directions across the full range of water ratios tested. This indicates that a
refractory lining will shrink after it has been fired. Figure 7.1 summarises the
permanent dimensional change results obtained and is derived from the detailed
permanent dimensional change contained in Appendix D4.

Chapter 7 Discussion of Water Ratio and Test Results 38
Permanent Dimensional Change
-0.6
-0.5
-0.4
-0.3
-0.2
-0.1
0100 110 120 130 140 150
Mixing Water% of Manufacturers' Recommended Minimum
PDC
%
Shiragun 160LEL70488Shiracast 145Sila LW100
Figure 7.1: Results - Permanent dimensional change.
7.1.1 Permanent Dimensional Change – Shiragun 160
Shiragun 160 displayed significant change in permanent dimensional change
over the range of water ratios tested. The manufacturer’s published permanent
dimensional change when using the recommended water ratio was between -0.3
and -0.1 % as shown in Table 6.1. As the water ratio used increased so to did the
magnitude of permanent dimensional change. It can be expected that a water
ratio of 20% or more in excess of manufacturer’s minimum recommended will
produce permanent dimensional change results outside those published.
7.1.2 Permanent Dimensional Change – LEL70488
Again LEL70488 displayed significant change in permanent dimensional change
over the range of water ratios tested. The manufacturer’s published permanent
dimensional change when using the recommended water ratio was -0.2 %. When
mixed with the minimum manufacturer’s water ratio the permanent dimensional
change achieved is less in magnitude than published however slight increases in

Chapter 7 Discussion of Water Ratio and Test Results 39 water ratio produce substantial changes to permanent dimensional change. The
range of mixing water ratio recommended and the expected permanent
dimensional change as shown in Table 6.1 cannot be achieved. The
manufacturer’s recommended water ratio is 10 – 12 % by mass however when
using a water ratio of 11 % (110 % of manufacturer’s minimum) the permanent
dimensional change obtained is -0.243 % and when using a water ratio of 12 %
the permanent dimensional change obtained is -0.296 %. Quite clearly even
small increases in mixing water will cause this material to suffer a permanent
dimensional change outside those published.
7.1.3 Permanent Dimensional Change – Shiracast 145 Gun
Shiracast 145 Gun displayed permanent dimensional change results outside of
manufacturer’s published properties once the mixing water used exceeded 120%
of manufacturer’s minimum. A gradual increase in the magnitude of permanent
dimensional change is exhibited as the water ratio is increased in this material.
The permanent dimensional change results obtained for this medium/dense
material closely resemble those obtained for Shiragun 160, a dense refractory
material.
7.1.4 Permanent Dimensional Change – Sila LW100
The ratio of mixing water had very little effect on the permanent dimensional
change obtained for the lightweight Sila LW100. Table 6.1 provides a broad
recommended range of 70 – 90 % by mass of mixing water ratio recommended.
This suggests that the amount of water used is not as critical as the medium and
dense materials tested. The permanent dimensional change results obtained
throughout the spectrum of water ratios tested all fell within the manufacturer’s
published figures of -0.3 to -0.2 indicating that increased water ratio has very
little effect on permanent dimensional change for this material.

Chapter 7 Discussion of Water Ratio and Test Results 40
7.2 Bulk Density
The bulk density of a refractory material is a measure of mass over a given area.
The water ratio used has an effect on a material’s bulk density as an increase in
water will produces more free water in the mixture. When dried this free water
escapes and produces pores in the material. A further loss of water is
experienced when the material is fired and hydraulically bonded water is
dispersed. The bulk density of the material decreases with these changes. Figure
7.2 summarises the bulk density results obtained and is derived from the detailed
bulk density results contained in Appendix D5.
Bulk Density
0
500
1000
1500
2000
2500
3000
100 110 120 130 140 150
Mixing Water% of Manufacturers' Recommended Minimum
Bul
k D
esni
tykg
/m3
Shiragun 160LEL70488Shiracast 145Sila LW100
Figure 7.2: Results – Bulk density.
7.2.1 Bulk Density – Shiragun 160
Shiragun 160 proved to maintain a bulk density within the manufacturer’s
published range with water ratios between 100 – 120 % of manufacturer’s
minimum. As the water ratio used increased the bulk density reduced.
Interestingly the bulk density results obtained when using between 100 – 110 %

Chapter 7 Discussion of Water Ratio and Test Results 41 of manufacturer’s minimum exceeded the published values. A high bulk density
can be favourable but the additional mass must be considered when designing the
supporting system for a refractory lining.
7.2.2 Bulk Density – LEL70488
As with Shiragun 160 the LEL70488 material exhibited bulk density results in
excess of the manufacturer’s published values for the range of water ratios
between 100 – 110 % of manufacturer’s minimum. The reduction in bulk
density associated with additional mixing water was gradual indicating that bulk
density of this material is not particularly susceptible to increases in water ratio.
7.2.3 Bulk Density – Shiracast 145 Gun
When mixed with the minimum manufacturer’s recommended water ratio
Shiracast 145 Gun achieved a bulk density within the lower end of the
manufacturer’s published range. As the water ratio increased the results of this
material’s bulk density decreased. This material cannot be expected to provide a
bulk density within the published range unless it is mixed with the
manufacturer’s recommended minimum water ratio. All water ratios above this
ratio will produce a refractory lining with poor bulk density so much so that a 50
% increase in the manufacturer’s minimum water ratio will provide a bulk
density of approximately 70 % of that published.
7.2.4 Bulk Density – Sila LW100
The bulk density obtained for Sila LW100 displayed results which fell within
manufacturer’s published values for water ratios between 100 – 120 % of
manufacturer’s minimum recommended. The reduction in bulk density with
water ratio over the range tested was close to linear however a water ratio of 150
% of manufacturer’s minimum provided a 60 % reduction in bulk density. This

Chapter 7 Discussion of Water Ratio and Test Results 42 material is a lightweight refractory and a low bulk density indicates high
porosity. High porosity in a refractory lining provides good insulating properties
and as this is the primary role for this material the reduction in bulk density
associated with additional mixing water can be beneficial.
7.3 Cold Compressive Strength
A refractory material’s cold compressive strength is a measure of the materials
ability to withstand a compressive force. It is widely accepted as the industry
standard for a materials strength a plays a significant role in material selection.
The cold compressive strength to be expected vary significantly between
different refractory materials with dense materials exhibiting a significantly
higher cold compressive strength than lightweight materials. Figure 7.3
summarises the cold compressive strength results obtained and is derived from
the detailed cold compressive strength results contained in Appendix D6.
Cold Compressive Strength
0
20
40
60
80
100
120
100 110 120 130 140 150
Mixing Water% of Manufacturers' Recommended Minimum
Col
d C
ompr
essi
ve S
tren
gth
MPa
Shiragun 160LEL70488Shiracast 145Sila LW100
Figure 7.3: Results – Cold compressive strength.

Chapter 7 Discussion of Water Ratio and Test Results 43 7.3.1 Cold Compressive Strength – Shiragun 160
Shiragun 160 is a dense refractory material which exhibits high cold compressive
strength however the use of additional mixing water has a significant effect on
this material’s cold compressive strength properties. When mixed with the
minimum manufacturer’s water ratio this product exhibited a cold compressive
strength in excess of the published values. At the upper end of the
manufacturer’s recommended water ratio of 15 % by mass as indicated in Table
6.1 the documented cold compressive strength of 80 – 95 MPa was not
achievable, instead a cold compressive strength in the range of 70 – 80 MPa can
be expected. A cold compressive strength of 80 MPa can be expected when the
water ratio is around 13.5 % or a little above 110 % of manufacturer’s minimum
recommended. To achieve a high cold compressive strength when using this
material it is important that the water ratio used be kept as low as possible.
7.3.2 Cold Compressive Strength – LEL70488
The manufacturer’s published cold compressive strength for LEL70488 is 80
MPa. When prepared with the minimum recommended water ratio only one of
three samples achieved this value, with the average being 75 MPa. This material
was very susceptible to the ratio of mixing water used and as the ratio increased
the cold compressive strength decreased significantly. When designing a
refractory lining using this material it must be considered that the published cold
compressive strength values will not be achieved and an allowance for this must
be made.
7.3.3 Cold Compressive Strength – Shiracast 145 Gun
The medium/dense Shiracast 145 Gun material does not exhibit high values for
cold compressive strength compared with the dense refractories discussed in the
previous two Sections. The manufacturer’s published cold compressive strength

Chapter 7 Discussion of Water Ratio and Test Results 44 is between 15 – 35 MPa as detailed in Table 6.1. Despite not achieving the 35
MPa this material displayed it was proved that this material was capable of being
mixed with additional water without significantly reducing the cold compressive
strength. It was only as the water ratio approached 140 % of manufacturer’s
recommended minimum that the cold compressive strength achieved fell below
the published values.
7.3.4 Cold Compressive Strength – Sila LW100
Sila LW 100 is a lightweight material and has very poor cold compressive
strength. In service it is generally used as an insulating material and is protected
by a layer of more dense material. The cold compressive strength achieved
throughout the water ratio test range all fell within the manufacturer’s published
values indicating that this material is very capable of maintaining its cold
compressive strength when additional mixing water is used.
7.4 Cold Modulus of Rupture
The cold modulus of rupture is a measure of a material’s ability to withstand a
bending force. For most refractory materials the cold modulus of rupture is quite
low. Generally a small increase in water ratio reduces a material’s cold modulus
of rupture quite dramatically. Figure 7.4 summarises the cold modulus of rupture
results obtained and is derived from the detailed cold modulus of rupture
contained in Appendix D7.

Chapter 7 Discussion of Water Ratio and Test Results 45
Cold Modulus of Rupture
0.00
5.00
10.00
15.00
20.00
25.00
100 110 120 130 140 150
Mixing Water% of Manufacturers' Recommended Minimum
Col
d M
odul
us o
f Rup
ture
MPa
Shiragun 160LEL70488Shiracast 145Sila LW100
Figure 7.3: Results – Cold modulus of rupture.
7.4.1 Cold Modulus of Rupture – Shiragun 160
Shiragun 160 has a high cold modulus of rupture compared with many refractory
materials. This material exhibited a better than published result for cold modulus
of rupture when prepared with a water ratio of 100 – 110 % of manufacturer’s
minimum recommended water. Even when prepared with 120 % of
manufacturer’s minimum recommended water ratio the results achieved were
still within the manufacturer’s published values. The decrease in cold modulus
of rupture results with additional water was quite dramatic as shown in Figure
7.4 and when using this material it is important to maintain a low water ratio to
avoid poor cold modulus of rupture behaviour.
7.4.2 Cold Modulus of Rupture – LEL70488
The manufacturer’s published value of cold modulus of rupture for LEL70488 is
10 MPa. When prepared with the manufacturer’s minimum water ratio this value
was exceeded. As the ratio of mixing water was increased a significant reduction

Chapter 7 Discussion of Water Ratio and Test Results 46 in cold modulus of rupture was displayed. Any increase in water ratio above the
manufacturer’s recommended minimum caused this material to have very poor
cold modulus of rupture results.
7.4.3 Cold Modulus of Rupture – Shiracast 145 Gun
The manufacturer’s published values of cold modulus of rupture for Shiracast
145 Gun range between 3 – 6 MPa. When prepared with the manufacturer’s
minimum water ratio the results exceeded the published values. All results
obtained throughout the test range achieved the manufacturer’s published values
for cold modulus of rupture which proves that this material does not exhibit any
significant adverse cold modulus of rupture properties as the water ratio is
increased.
7.4.4 Cold Modulus of Rupture – Sila LW100
It was anticipated that the cold modulus of rupture for Sila LW100 would not be
measurable due to the very low manufacturer’s published values being 0.1 – 0.8
MPa. When tested the results proved to be significantly higher than these
published values across the full range of water ratios used. Despite not being
expected to withstand significant bending forces this material displayed cold
modulus of rupture results 3 – 4 times the published values.
7.5 Summary
The water ratio used has an effect on the mechanical properties of refractory
materials. Without exception an increase in mixing water produced a higher
magnitude of permanent dimensional change and a decrease in the bulk density,
cold compressive strength and cold modulus of rupture in all of the materials

Chapter 7 Discussion of Water Ratio and Test Results 47 tested. The susceptibility of each material to the increased water ratio varied
depending on the property being tested.
When investigating the permanent dimensional change the dense and
medium/dense materials were all affected by small increases in water ratio. To
prevent adverse reductions in dimensions of these materials the recommended
water ratio must be adhered to and the volume of water used be the minimum to
allow for successful installation. The lightweight material investigated did not
display any significant adverse permanent dimensional change properties over
the range of water ratios investigated.
A small increase in water ratio did not cause the dense materials to exhibit
significant reductions in bulk density. It was only when mixing water was
increased significantly that the bulk density achieved by these materials was
adversely affected. The medium/dense material was far more susceptible to
increases in water ratio and a small increase resulted in unacceptable reductions
in bulk density. The bulk density for the lightweight material also suffered from
increases in water ratio but the reduction in bulk density is offset by the
improved thermal insulation properties that are associated with this the porosity
in this material.
When investigating the cold compressive strength the dense materials were very
susceptible to increases in water ratio. To achieve a high cold compressive
strength the mixing water used must be kept to a minimum and even in this case
the cold compressive strength may not meet the desired level. The
medium/dense material which displays a significantly lower cold compressive
strength compared with the dense materials was much less prone to exhibit
drastic reductions in cold compressive strength associated with increased mixing
water. Over the range of water ratios tested the lightweight material did not
exhibit any significant reductions in cold compressive strength.
All materials displayed a higher than expected cold modulus of rupture when
prepared with the minimum recommended water ratio. The dense materials
displayed a significant reduction in cold modulus of rupture as the mixing water

Chapter 7 Discussion of Water Ratio and Test Results 48 used increased. The medium/dense material was less affected by the increase
with all tested results falling within an acceptable range. The lightweight
material exhibited significantly higher cold modulus of rupture results than were
to be expected.

49
Chapter 8 Conclusions
The water ratio used when mixing refractory materials does have an effect on the
mechanical properties of the materials tested. Adverse properties were
experienced across the range of products investigated as the water ratio
increased. Different materials proved to be more susceptible to any increase in
mixing water and each exhibited unique responses to the mechanical properties
investigated.
8.1 Achievement of Objectives
All materials investigated suffered from a greater degree of shrinkage associated
with increased water ratio when subjected to permanent dimensional change
tests. Lightweight materials which require a large percentage of water by mass
for mixing suffer the least as water is dispersed through drying and firing.
The bulk density of all materials decreased with additional mixing water. The
rate of reduction in bulk density was relatively linear for all materials. The extra
free water associated with excess mixing water created pores as this water was
dispersed, proving that additional mixing water decreased each material’s bulk
density.
Some materials performed better in compression than expected with low water
ratios but with the exception of the lightweight material the cold compressive

Chapter 8 Conclusions 50 strength reduced markedly with increased mixing water. The increase in water
ratio increases the porosity within the material and thus creates localised stresses
when under load.
Small increases in water ratio had significant effects on the cold modulus of
rupture of all materials tested with the exception of the lightweight material. The
flexural strength dropped rapidly as the water ratio was increased and ultimately
provided very inferior results.
8.2 Further Work
The materials tested in this investigation all contain a relatively high degree of
alumina cement. As mentioned in Chapter 2, low cement castable refractories
are now commonly used. These materials are very susceptible to the water ratio
used and investigating the mechanical properties associated with excess mixing
water should provide more definitive results.
The curing and drying times noticeable increased as additional water was used.
No data was recorded in relation to this observation. In practice refractory
linings are often installed, repaired or replaced under outage situations where
time is an important factor. An investigation into the effects on mechanical
properties of refractory materials which have not been sufficiently cured or dried
is an area which could be further investigated.
51
References Bakker, WT 1993, ‘Refractories for present and future electric power plants’,
Key Engineering Materials, Vol. 88, pp. 41-70.
Banerjee, S, Kilgore, RV, & Knowlton, DA 1984 ‘Low-Moisture Castables:
Properties and Applications’, Advances in ceramics, Vol. 13, pp. 257-273.
Bradt, RC 1993, ‘Elastic moduli, strength and fracture characteristics of
refractories’, Key Engineering Materials, Vol. 88, pp. 165-192.
Chesters, JH 1973, Refractories production and properties, Iron and Steel
Institute, London.
Grimshaw, RW 1971, The Chemistry ands Physics of Clays and Allied Ceramic
Materials, Ernest Benn Limited, London.
Innocentini, MDM, Cardosa, FA, Akyioshi, MM, & Pandolfelli, VC 2003,
‘Drying Stages during the Heating of High-Alumina, Ultra-Low-Cement
Refractory Castables’, Journal of the American Ceramic Society, Vol. 86, pp.
1146-1148.
Innocentini, MDM, Ribeiro, C, Bittencourt, LRM, Pandolfelli, VC 2001, ‘Fluid
Dynamics and Thermal Aspects of the Dewatering of High Alumina Refractory
Castables: Removal of Physically Absorbed Water’, Journal of the American
Ceramic Society, Vol. 84, pp. 2696-2698.

References 52 Jones, TF & Berard, MF 1993, Cermamics: Industrial Processing and Testing,
Iowa State University Press, Iowa.
Krietz, LP & Fisher, RE 1989, ‘Field performance and fracture behaviour of low
cement, conventional and high cement, low moisture castables’, UNITECR ’89
Proceedings, Vol. 2, pp. 1116-1126.
McGee, TD 1993, ‘High temperature deformation of refractories’, Key
Engineering Materials’, Vol. 88, pp 123-164.
Padgett, GC & Palin, FT 1984, ‘Test Methods for Monolithic Materials’,
Advances in ceramics, Vol. 13, pp. 81-96
Richmond, C & Chaille, CE 1984, ‘High-Performance Castables for Severe
Applications’, Advances in ceramics, Vol. 13, pp. 230-273.
Schacht, CA 1995, Refractory linings: thermomechanical design and
applications Marcel Dekker, New York.
Severin, NW 1984, ‘Dryouts and Heatups of Refractory Monoliths’, Advances in
ceramics, Vol. 13, pp. 192-198.
Technology of monolithic refractories 1984, Pilbrico Japan Company Limited,
Tokyo.

Appendix A Project Specification Appendix A Project Specification

Appendix A Project Specification A1
Student Name: Aaron Massaro Date: 16/03/05 Student Number: 0050034503 Revision: A
University of Southern Queensland Faculty of Engineering and Surveying
ENG 4111 / ENG 4112 Research Project
PROJECT SPECIFICATION For: Aaron MASSARO Topic: Effect of water ratio on the mechanical properties of refractory
materials. Sponsorship: Lucon Pty Ltd Supervisors: Dr. David Wood
Mr. Ian Cherry, Lucon Pty Ltd Mr. Simon Bazeley, Lucon Pty Ltd
Project Aim: This project aims to investigate the effects of water ratio on the mechanical properties of commercially available refractory materials used in lining boilers.
Programme: Issue A, 16th March 2005
1. Research information on mechanical properties of refractory materials.
2. Identify Lucon’s current practice for mixing and applying refractory linings.
3. Undertake controlled tests to generate base data.
4. Analyse test results and correlate with historical data.
5. Develop and implement procedures for mixing and applying refractory materials.
6. Research industry practices for refractory condition monitoring.
7. Research most frequent failure modes of refractory linings in industry.
As time permits:
8. Develop test to investigate affects of cyclic duty on refractory linings.
9. Undertake cyclic testing and investigate results.
Agreed: _____________ (Student) ____________, ____________ (Supervisors)
___/___/___ ___/___/___ ___/___/___

Appendix B Drying and Firing Schedules Appendix B Drying and Firing Schedules Appendix B.1 Lightweight Drying and Firing Schedule B1 Appendix B.2 Dense Drying and Firing Schedule B2

Appendix B.1 Lightweight Drying and Firing Schedule B1
Figu
re B
.1:
Ligh
twei
ght d
ryin
g an
d fir
ing
sche
dule
(cou
rtesy
of S
hina
gaw
a R
efra
ctor
ies
A
ustra
lisia
Pty
Ltd
).
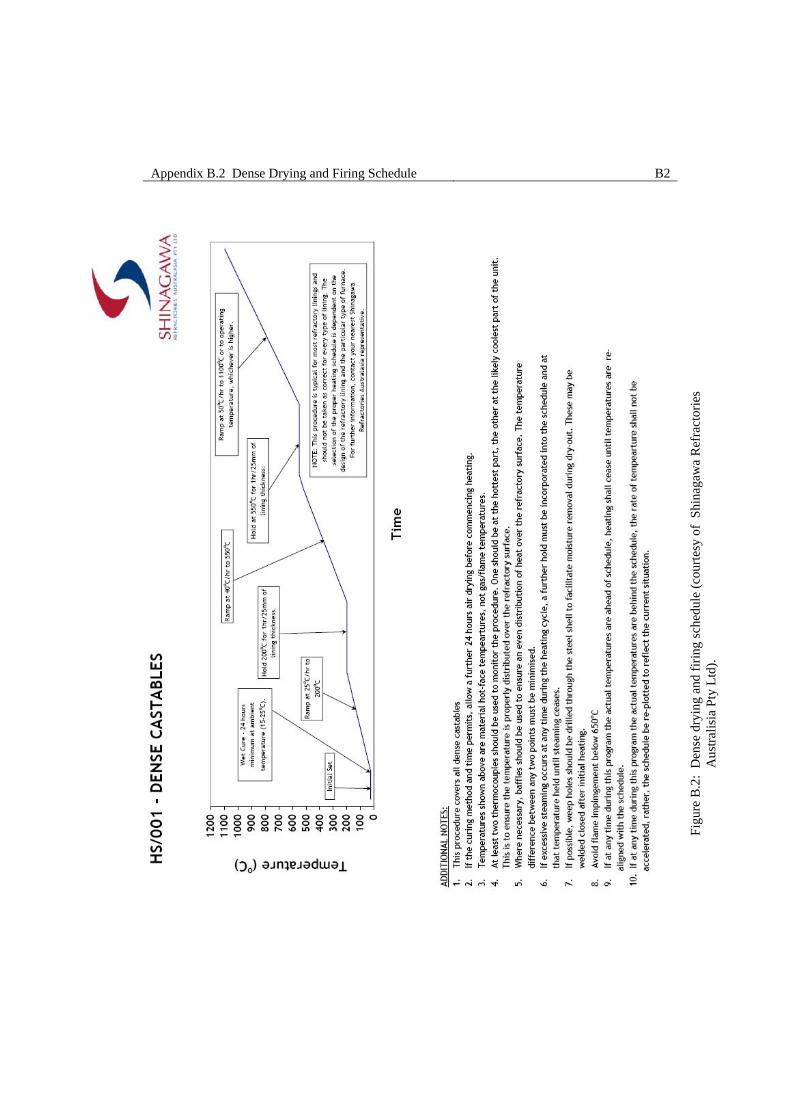
Appendix B.2 Dense Drying and Firing Schedule B2
Figu
re B
.2:
Den
se d
ryin
g an
d fir
ing
sche
dule
(cou
rtesy
of
Shin
agaw
a R
efra
ctor
ies
A
ustra
lisia
Pty
Ltd
).

Appendix C Product Datasheets Appendix C Product Datasheets Appendix C.1 Shiragun 160 Product Datasheet C1 Appendix C.2 LEL70488 Product Datasheet C2 Appendix C.3 Shiracast 145 Gun Product Datasheet C3 Appendix C.4 Sila LW100 Product Information C4

Appendix C Product Datasheets C1 Appendix C.1 Shiragun 160 Product Datasheet
Courtesy of Shinagawa Refractories Australasia.

Appendix C Product Datasheets C2 Appendix C.2 LEL70488 Product Datasheet
Courtesy of Vesuvius Refractories Australasia.

Appendix C Product Datasheets C3 Appendix C.3 Shiracast 145 Gun Product Datasheet
Courtesy of Shinagawa Refractories Australasia.

Appendix C Product Datasheets C4 Appendix C.4 Sila LW100 Product Information
Courtesy of Shinagawa Refractories Australasia.

Appendix D Test Results Appendix D Test Results D.1 Manufacturers’ Published Data D1 D.2 Refractory Samples D2 D.3 Test Results D3 D.4 Permanent Dimensional Change Results D4 D.5 Bulk Density Results D5 D.6 Cold Compressive Strength Results D6 D.7 Cold Modulus of Rupture Results D6

Appendix D.1 Manufacturers’ Published Data D1
Table D.1: Summary of manufacturers' published data
Product Manufacturer Category Mixing water PDC BD CCS CMOR% % kg/m3 MPa MPa
Shiragun 160 Shinagawa Dense 12 - 15 -0.3 - -0.1 2140 - 2240 80 - 95 12 - 15 *LEL70488 Vesuvius Dense 10 - 12 -0.2 2150 80 10 +Shiracast 145 Gun Shinagawa Medium/Dense 14 - 16 -0.3 - -0.1 1870 - 1970 15 - 35 3 - 6 *SilaLite LW00 Shinagawa Light 70 - 90 -0.3 - -0.2 650 - 800 2 - 3 0.1 - 0.8 *
* Adapted from Shinagawa Refractories Australasia Published Data+ Adapted from Vesuvius Refractories Published Data

Appendix D.2 Refractory Samples D2
Table D.2: List of refractory samples
Sample number Product Type Mixing water Sample number Product Type Mixing water% %
160/0/a Shiragun 160 Cube 12 145/0/a Shiracast 145 Gun Cube 14160/0/b Shiragun 160 Cube 12 145/0/b Shiracast 145 Gun Cube 14160/0/c Shiragun 160 Cube 12 145/0/c Shiracast 145 Gun Cube 14160/0/d Shiragun 160 Brick 12 145/0/d Shiracast 145 Gun Brick 14160/1/a Shiragun 160 Cube 13.2 145/1/a Shiracast 145 Gun Cube 15.4160/1/b Shiragun 160 Cube 13.2 145/1/b Shiracast 145 Gun Cube 15.4160/1/c Shiragun 160 Cube 13.2 145/1/c Shiracast 145 Gun Cube 15.4160/1/d Shiragun 160 Brick 13.2 145/1/d Shiracast 145 Gun Brick 15.4160/2/a Shiragun 160 Cube 14.4 145/2/a Shiracast 145 Gun Cube 16.8160/2/b Shiragun 160 Cube 14.4 145/2/b Shiracast 145 Gun Cube 16.8160/2/c Shiragun 160 Cube 14.4 145/2/c Shiracast 145 Gun Cube 16.8160/2/d Shiragun 160 Brick 14.4 145/2/d Shiracast 145 Gun Brick 16.8160/3/a Shiragun 160 Cube 15.6 145/3/a Shiracast 145 Gun Cube 18.2160/3/b Shiragun 160 Cube 15.6 145/3/b Shiracast 145 Gun Cube 18.2160/3/c Shiragun 160 Cube 15.6 145/3/c Shiracast 145 Gun Cube 18.2160/3/d Shiragun 160 Brick 15.6 145/3/d Shiracast 145 Gun Brick 18.2160/4/a Shiragun 160 Cube 16.8 145/4/a Shiracast 145 Gun Cube 19.6160/4/b Shiragun 160 Cube 16.8 145/4/b Shiracast 145 Gun Cube 19.6160/4/c Shiragun 160 Cube 16.8 145/4/c Shiracast 145 Gun Cube 19.6160/4/d Shiragun 160 Brick 16.8 145/4/d Shiracast 145 Gun Brick 19.6160/5/a Shiragun 160 Cube 18 145/5/a Shiracast 145 Gun Cube 21160/5/b Shiragun 160 Cube 18 145/5/b Shiracast 145 Gun Cube 21160/5/c Shiragun 160 Cube 18 145/5/c Shiracast 145 Gun Cube 21160/5/d Shiragun 160 Brick 18 145/5/d Shiracast 145 Gun Brick 21LEL/0/a LEL70488 Cube 10 100/0/a SilaLite LW00 Cube 70LEL/0/b LEL70488 Cube 10 100/0/b SilaLite LW00 Cube 70LEL/0/c LEL70488 Cube 10 100/0/c SilaLite LW00 Cube 70LEL/0/d LEL70488 Brick 10 100/0/d SilaLite LW00 Brick 70LEL/1/a LEL70488 Cube 11 100/1/a SilaLite LW00 Cube 77LEL/1/b LEL70488 Cube 11 100/1/b SilaLite LW00 Cube 77LEL/1/c LEL70488 Cube 11 100/1/c SilaLite LW00 Cube 77LEL/1/d LEL70488 Brick 11 100/1/d SilaLite LW00 Brick 77LEL/2/a LEL70488 Cube 12 100/2/a SilaLite LW00 Cube 84LEL/2/b LEL70488 Cube 12 100/2/b SilaLite LW00 Cube 84LEL/2/c LEL70488 Cube 12 100/2/c SilaLite LW00 Cube 84LEL/2/d LEL70488 Brick 12 100/2/d SilaLite LW00 Brick 84LEL/3/a LEL70488 Cube 13 100/3/a SilaLite LW00 Cube 91LEL/3/b LEL70488 Cube 13 100/3/b SilaLite LW00 Cube 91LEL/3/c LEL70488 Cube 13 100/3/c SilaLite LW00 Cube 91LEL/3/d LEL70488 Brick 13 100/3/d SilaLite LW00 Brick 91LEL/4/a LEL70488 Cube 14 100/4/a SilaLite LW00 Cube 98LEL/4/b LEL70488 Cube 14 100/4/b SilaLite LW00 Cube 98LEL/4/c LEL70488 Cube 14 100/4/c SilaLite LW00 Cube 98LEL/4/d LEL70488 Brick 14 100/4/d SilaLite LW00 Brick 98LEL/5/a LEL70488 Cube 15 100/5/a SilaLite LW00 Cube 105LEL/5/b LEL70488 Cube 15 100/5/b SilaLite LW00 Cube 105LEL/5/c LEL70488 Cube 15 100/5/c SilaLite LW00 Cube 105LEL/5/d LEL70488 Brick 15 100/5/d SilaLite LW00 Brick 105
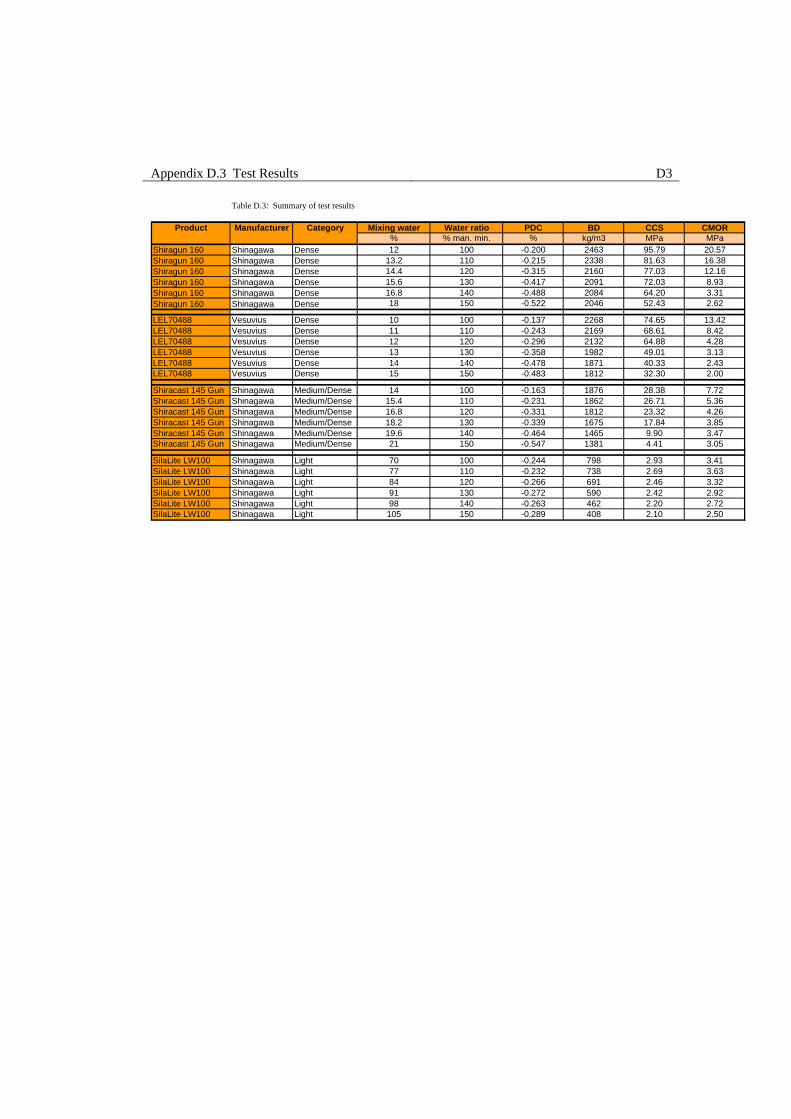
Appendix D.3 Test Results D3
Table D.3: Summary of test results
Product Manufacturer Category Mixing water Water ratio PDC BD CCS CMOR% % man. min. % kg/m3 MPa MPa
Shiragun 160 Shinagawa Dense 12 100 -0.200 2463 95.79 20.57Shiragun 160 Shinagawa Dense 13.2 110 -0.215 2338 81.63 16.38Shiragun 160 Shinagawa Dense 14.4 120 -0.315 2160 77.03 12.16Shiragun 160 Shinagawa Dense 15.6 130 -0.417 2091 72.03 8.93Shiragun 160 Shinagawa Dense 16.8 140 -0.488 2084 64.20 3.31Shiragun 160 Shinagawa Dense 18 150 -0.522 2046 52.43 2.62
LEL70488 Vesuvius Dense 10 100 -0.137 2268 74.65 13.42LEL70488 Vesuvius Dense 11 110 -0.243 2169 68.61 8.42LEL70488 Vesuvius Dense 12 120 -0.296 2132 64.88 4.28LEL70488 Vesuvius Dense 13 130 -0.358 1982 49.01 3.13LEL70488 Vesuvius Dense 14 140 -0.478 1871 40.33 2.43LEL70488 Vesuvius Dense 15 150 -0.483 1812 32.30 2.00
Shiracast 145 Gun Shinagawa Medium/Dense 14 100 -0.163 1876 28.38 7.72Shiracast 145 Gun Shinagawa Medium/Dense 15.4 110 -0.231 1862 26.71 5.36Shiracast 145 Gun Shinagawa Medium/Dense 16.8 120 -0.331 1812 23.32 4.26Shiracast 145 Gun Shinagawa Medium/Dense 18.2 130 -0.339 1675 17.84 3.85Shiracast 145 Gun Shinagawa Medium/Dense 19.6 140 -0.464 1465 9.90 3.47Shiracast 145 Gun Shinagawa Medium/Dense 21 150 -0.547 1381 4.41 3.05
SilaLite LW100 Shinagawa Light 70 100 -0.244 798 2.93 3.41SilaLite LW100 Shinagawa Light 77 110 -0.232 738 2.69 3.63SilaLite LW100 Shinagawa Light 84 120 -0.266 691 2.46 3.32SilaLite LW100 Shinagawa Light 91 130 -0.272 590 2.42 2.92SilaLite LW100 Shinagawa Light 98 140 -0.263 462 2.20 2.72SilaLite LW100 Shinagawa Light 105 150 -0.289 408 2.10 2.50

Appendix D.4 Permanent Dimensional Change Results D4
Table D.4: Results of permanent dimensional change tests
Sample number Dimension, dried Dimension, fired PDC, dried-firedx y z x y z x y z Avg
mm mm mm mm mm mm % % % %160/0/a 74.65 75.28 74.97 74.39 75.22 74.92 -0.343 -0.086 -0.069 -0.166160/0/b 75.43 75.22 74.89 75.42 75.01 74.69 -0.019 -0.278 -0.262 -0.186160/0/c 74.65 74.57 74.59 74.53 74.39 74.34 -0.161 -0.240 -0.339 -0.247160/1/a 75.40 74.80 74.57 75.35 74.64 74.44 -0.072 -0.211 -0.169 -0.151160/1/b 75.10 75.31 74.55 74.89 75.01 74.50 -0.276 -0.393 -0.074 -0.247160/1/c 74.58 74.60 75.35 74.41 74.34 75.23 -0.231 -0.346 -0.161 -0.246160/2/a 74.90 75.07 74.70 74.68 74.91 74.47 -0.296 -0.214 -0.309 -0.273160/2/b 75.31 75.34 75.26 75.00 74.95 75.14 -0.410 -0.516 -0.157 -0.361160/2/c 75.49 74.95 75.12 75.34 74.60 74.91 -0.195 -0.467 -0.274 -0.312160/3/a 75.30 75.00 75.29 74.89 74.81 74.93 -0.551 -0.259 -0.478 -0.429160/3/b 75.22 75.15 75.23 75.00 74.83 74.94 -0.291 -0.430 -0.392 -0.371160/3/c 74.85 75.31 75.13 74.68 74.88 74.71 -0.222 -0.574 -0.560 -0.452160/4/a 74.64 75.31 75.11 74.20 74.92 74.80 -0.587 -0.514 -0.414 -0.505160/4/b 75.21 75.07 74.72 74.82 74.85 74.32 -0.513 -0.296 -0.537 -0.449160/4/c 75.39 75.25 75.22 75.05 74.80 74.85 -0.446 -0.598 -0.488 -0.511160/5/a 75.22 75.09 74.68 74.83 74.62 74.24 -0.524 -0.630 -0.596 -0.583160/5/b 75.16 74.82 74.87 74.88 74.30 74.51 -0.373 -0.699 -0.484 -0.518160/5/c 75.46 75.37 75.01 74.98 75.05 74.76 -0.633 -0.421 -0.337 -0.464LEL/0/a 74.57 75.14 75.39 74.55 74.88 75.29 -0.028 -0.351 -0.129 -0.169LEL/0/b 74.74 74.67 75.31 74.67 74.40 75.25 -0.096 -0.367 -0.078 -0.181LEL/0/c 74.66 75.33 75.19 74.64 75.25 75.16 -0.033 -0.105 -0.047 -0.062LEL/1/a 74.99 75.08 75.24 74.87 74.99 75.06 -0.165 -0.127 -0.246 -0.179LEL/1/b 74.98 75.06 75.31 74.72 74.90 74.99 -0.345 -0.210 -0.426 -0.327LEL/1/c 74.67 74.56 75.05 74.62 74.37 74.80 -0.068 -0.260 -0.336 -0.221LEL/2/a 75.50 74.86 74.84 75.22 74.67 74.57 -0.366 -0.254 -0.362 -0.327LEL/2/b 74.79 75.04 75.39 74.58 74.84 75.27 -0.287 -0.267 -0.155 -0.236LEL/2/c 74.91 74.55 74.68 74.59 74.26 74.56 -0.423 -0.396 -0.157 -0.325LEL/3/a 75.48 75.32 74.89 75.28 75.06 74.66 -0.269 -0.347 -0.312 -0.309LEL/3/b 74.83 75.24 75.28 74.68 74.95 75.06 -0.207 -0.388 -0.296 -0.297LEL/3/c 75.30 74.70 74.57 75.06 74.29 74.17 -0.313 -0.554 -0.531 -0.466LEL/4/a 75.50 74.60 74.56 75.11 74.28 74.28 -0.519 -0.432 -0.378 -0.443LEL/4/b 75.29 74.65 75.09 74.88 74.31 74.87 -0.549 -0.451 -0.293 -0.431LEL/4/c 74.60 74.71 74.99 74.20 74.24 74.61 -0.542 -0.626 -0.508 -0.559LEL/5/a 74.90 74.62 74.59 74.63 74.33 74.13 -0.366 -0.389 -0.623 -0.459LEL/5/b 75.16 75.25 74.78 74.90 74.71 74.33 -0.350 -0.714 -0.607 -0.557LEL/5/c 74.65 74.92 75.07 74.31 74.63 74.73 -0.459 -0.383 -0.458 -0.434145/0/a 75.08 74.67 74.73 75.05 74.53 74.58 -0.044 -0.187 -0.201 -0.144145/0/b 74.54 75.05 75.11 74.38 74.85 75.09 -0.219 -0.270 -0.025 -0.171145/0/c 74.51 75.43 75.44 74.46 75.38 75.15 -0.062 -0.068 -0.391 -0.173145/1/a 74.64 74.57 74.78 74.59 74.44 74.62 -0.068 -0.178 -0.221 -0.156145/1/b 74.75 75.07 74.97 74.56 74.89 74.89 -0.253 -0.240 -0.103 -0.198145/1/c 75.07 74.82 74.97 74.79 74.49 74.82 -0.373 -0.440 -0.207 -0.340145/2/a 74.68 74.50 74.99 74.42 74.14 74.78 -0.352 -0.482 -0.284 -0.373145/2/b 75.00 74.96 75.16 74.62 74.83 75.02 -0.509 -0.172 -0.190 -0.291145/2/c 74.71 74.63 74.96 74.52 74.25 74.79 -0.257 -0.504 -0.228 -0.330145/3/a 75.29 75.19 75.43 75.03 74.81 75.10 -0.345 -0.507 -0.437 -0.430145/3/b 75.42 74.69 74.71 75.21 74.51 74.50 -0.280 -0.241 -0.278 -0.266145/3/c 75.31 74.65 75.02 74.94 74.46 74.86 -0.489 -0.257 -0.217 -0.321145/4/a 74.73 75.45 75.39 74.42 75.10 75.06 -0.418 -0.463 -0.438 -0.439145/4/b 74.80 75.37 74.77 74.54 74.97 74.29 -0.353 -0.525 -0.639 -0.506145/4/c 74.59 74.60 75.07 74.14 74.34 74.78 -0.607 -0.347 -0.388 -0.447145/5/a 75.03 75.21 74.72 74.75 74.81 74.25 -0.379 -0.537 -0.633 -0.516145/5/b 74.89 74.67 75.24 74.63 74.37 74.70 -0.351 -0.400 -0.722 -0.491145/5/c 75.25 75.04 74.55 74.77 74.55 74.10 -0.643 -0.649 -0.609 -0.634100/0/a 74.55 75.16 75.02 74.35 74.93 74.92 -0.270 -0.306 -0.135 -0.237100/0/b 75.46 74.53 75.22 75.30 74.39 74.95 -0.215 -0.184 -0.364 -0.254100/0/c 74.85 74.82 74.93 74.73 74.55 74.78 -0.155 -0.362 -0.203 -0.240100/1/a 75.30 75.10 74.68 75.15 74.89 74.57 -0.202 -0.274 -0.149 -0.208100/1/b 74.81 74.78 74.50 74.69 74.48 74.36 -0.167 -0.400 -0.192 -0.253100/1/c 75.42 75.36 74.96 75.22 75.18 74.81 -0.267 -0.234 -0.203 -0.234100/2/a 74.55 74.58 75.30 74.31 74.45 75.03 -0.318 -0.178 -0.365 -0.287100/2/b 75.47 75.37 75.49 75.29 75.13 75.34 -0.233 -0.314 -0.195 -0.247100/2/c 74.87 74.85 74.65 74.73 74.61 74.44 -0.183 -0.326 -0.281 -0.263100/3/a 74.86 75.41 75.17 74.67 75.14 74.91 -0.248 -0.357 -0.342 -0.316100/3/b 75.04 75.10 75.50 74.93 74.94 75.27 -0.141 -0.208 -0.306 -0.218100/3/c 74.84 75.20 74.51 74.57 75.09 74.26 -0.363 -0.144 -0.336 -0.281100/4/a 75.19 75.17 74.75 74.95 74.97 74.61 -0.321 -0.273 -0.182 -0.258100/4/b 75.26 74.92 74.89 74.99 74.72 74.66 -0.359 -0.272 -0.302 -0.311100/4/c 74.72 74.76 75.38 74.52 74.64 75.21 -0.269 -0.159 -0.227 -0.218

Appendix D.5 Bulk Density Results D5
Table D.5: Results of bulk density tests
Sample number Dimension, fired Mass, fired BDx y z
mm mm mm g kg/m3160/0/a 74.39 75.22 74.92 1070.8 2554160/0/b 75.42 75.01 74.69 917.5 2171160/0/c 74.53 74.39 74.34 1097.2 2662160/1/a 75.35 74.64 74.44 991.3 2368160/1/b 74.89 75.01 74.50 965.2 2306160/1/c 74.41 74.34 75.23 973.9 2340160/2/a 74.68 74.91 74.47 987.0 2369160/2/b 75.00 74.95 75.14 860.1 2036160/2/c 75.34 74.60 74.91 873.3 2074160/3/a 74.89 74.81 74.93 874.5 2083160/3/b 75.00 74.83 74.94 822.6 1956160/3/c 74.68 74.88 74.71 933.7 2235160/4/a 74.20 74.92 74.80 866.8 2084160/4/b 74.82 74.85 74.32 889.7 2138160/4/c 75.05 74.80 74.85 852.7 2029160/5/a 74.83 74.62 74.24 781.2 1885160/5/b 74.88 74.30 74.51 846.6 2042160/5/c 74.98 75.05 74.76 929.9 2210LEL/0/a 74.55 74.88 75.29 976.5 2323LEL/0/b 74.67 74.40 75.25 980.2 2345LEL/0/c 74.64 75.25 75.16 901.5 2136LEL/1/a 74.87 74.99 75.06 919.9 2183LEL/1/b 74.72 74.90 74.99 853.7 2034LEL/1/c 74.62 74.37 74.80 950.7 2290LEL/2/a 75.22 74.67 74.57 875.4 2090LEL/2/b 74.58 74.84 75.27 901.9 2147LEL/2/c 74.59 74.26 74.56 892.3 2161LEL/3/a 75.28 75.06 74.66 857.5 2033LEL/3/b 74.68 74.95 75.06 807.0 1921LEL/3/c 75.06 74.29 74.17 823.5 1991LEL/4/a 75.11 74.28 74.28 771.3 1861LEL/4/b 74.88 74.31 74.87 759.4 1823LEL/4/c 74.20 74.24 74.61 793.1 1930LEL/5/a 74.63 74.33 74.13 725.4 1764LEL/5/b 74.90 74.71 74.33 778.8 1873LEL/5/c 74.31 74.63 74.73 746.1 1800145/0/a 75.05 74.53 74.58 709.4 1701145/0/b 74.38 74.85 75.09 827.1 1979145/0/c 74.46 75.38 75.15 822.1 1949145/1/a 74.59 74.44 74.62 730.6 1763145/1/b 74.56 74.89 74.89 785.7 1879145/1/c 74.79 74.49 74.82 810.3 1944145/2/a 74.42 74.14 74.78 651.6 1579145/2/b 74.62 74.83 75.02 807.0 1927145/2/c 74.52 74.25 74.79 799.1 1931145/3/a 75.03 74.81 75.10 692.2 1642145/3/b 75.21 74.51 74.50 716.7 1717145/3/c 74.94 74.46 74.86 695.8 1666145/4/a 74.42 75.10 75.06 597.8 1425145/4/b 74.54 74.97 74.29 566.3 1364145/4/c 74.14 74.34 74.78 661.5 1605145/5/a 74.75 74.81 74.25 625.4 1507145/5/b 74.63 74.37 74.70 552.2 1332145/5/c 74.77 74.55 74.10 538.7 1304100/0/a 74.35 74.93 74.92 316.4 758100/0/b 75.30 74.39 74.95 361.9 862100/0/c 74.73 74.55 74.78 322.3 774100/1/a 75.15 74.89 74.57 323.0 770100/1/b 74.69 74.48 74.36 277.1 670100/1/c 75.22 75.18 74.81 327.1 773100/2/a 74.31 74.45 75.03 319.2 769100/2/b 75.29 75.13 75.34 287.4 674100/2/c 74.73 74.61 74.44 261.1 629100/3/a 74.67 75.14 74.91 262.4 624100/3/b 74.93 74.94 75.27 265.8 629100/3/c 74.57 75.09 74.26 215.5 518100/4/a 74.95 74.97 74.61 206.5 492100/4/b 74.99 74.72 74.66 185.9 444100/4/c 74.52 74.64 75.21 187.5 448

Appendix D.6 Cold Compressive Strength Results D6
Table D.6: Results of cold compressive strength tests
Sample number Dimension, fired Pressure Force CCSx y
mm mm psi kPa N MPa160/0/a 74.39 75.22 6210 42818 542404 96.94160/0/b 75.42 75.01 6090 41991 531923 94.03160/0/c 74.53 74.39 6120 42197 534543 96.41160/1/a 75.35 74.64 5660 39026 494365 87.90160/1/b 74.89 75.01 5010 34544 437592 77.89160/1/c 74.41 74.34 5010 34544 437592 79.11160/2/a 74.68 74.91 4580 31579 400034 71.51160/2/b 75.00 74.95 5740 39577 501353 89.19160/2/c 75.34 74.60 4530 31234 395667 70.40160/3/a 74.89 74.81 4010 27649 350248 62.52160/3/b 75.00 74.83 4990 34406 435845 77.66160/3/c 74.68 74.88 4860 33510 424490 75.91160/4/a 74.20 74.92 4050 27925 353742 63.63160/4/b 74.82 74.85 4260 29373 372084 66.44160/4/c 75.05 74.80 4020 27718 351122 62.54160/5/a 74.83 74.62 3150 21719 275133 49.28160/5/b 74.88 74.30 3420 23581 298715 53.69160/5/c 74.98 75.05 3500 24133 305703 54.32LEL/0/a 74.55 74.88 5330 36750 465542 83.40LEL/0/b 74.67 74.40 4360 30062 380819 68.55LEL/0/c 74.64 75.25 4630 31924 404401 72.00LEL/1/a 74.87 74.99 4090 28201 357236 63.63LEL/1/b 74.72 74.90 4140 28545 361603 64.61LEL/1/c 74.62 74.37 4930 33992 430604 77.60LEL/2/a 75.22 74.67 3940 27166 344134 61.27LEL/2/b 74.58 74.84 4280 29511 373831 66.98LEL/2/c 74.59 74.26 4210 29028 367717 66.39LEL/3/a 75.28 75.06 3120 21512 272512 48.23LEL/3/b 74.68 74.95 3370 23236 294348 52.59LEL/3/c 75.06 74.29 2950 20340 257664 46.21LEL/4/a 75.11 74.28 2420 16686 211372 37.89LEL/4/b 74.88 74.31 2820 19444 246309 44.27LEL/4/c 74.20 74.24 2450 16893 213992 38.85LEL/5/a 74.63 74.33 2070 14273 180801 32.59LEL/5/b 74.90 74.71 1990 13721 173814 31.06LEL/5/c 74.31 74.63 2110 14548 184295 33.23145/0/a 75.05 74.53 1770 12204 154598 27.64145/0/b 74.38 74.85 1870 12894 163333 29.34145/0/c 74.46 75.38 1810 12480 158092 28.17145/1/a 74.59 74.44 1660 11446 144991 26.11145/1/b 74.56 74.89 1780 12273 155472 27.84145/1/c 74.79 74.49 1670 11515 145864 26.18145/2/a 74.42 74.14 1580 10894 138003 25.01145/2/b 74.62 74.83 1400 9653 122281 21.90145/2/c 74.52 74.25 1460 10067 127522 23.05145/3/a 75.03 74.81 1120 7722 97825 17.43145/3/b 75.21 74.51 1120 7722 97825 17.46145/3/c 74.94 74.46 1190 8205 103939 18.63145/4/a 74.42 75.10 619 4268 54066 9.67145/4/b 74.54 74.97 668 4606 58346 10.44145/4/c 74.14 74.34 605 4171 52843 9.59145/5/a 74.75 74.81 295 2034 25766 4.61145/5/b 74.63 74.37 261 1800 22797 4.11145/5/c 74.77 74.55 288 1986 25155 4.51100/0/a 74.35 74.93 172 1186 15023 2.70100/0/b 75.30 74.39 189 1303 16508 2.95100/0/c 74.73 74.55 200 1379 17469 3.14100/1/a 75.15 74.89 167 1151 14586 2.59100/1/b 74.69 74.48 180 1241 15722 2.83100/1/c 75.22 75.18 171 1179 14936 2.64100/2/a 74.31 74.45 154 1062 13451 2.43100/2/b 75.29 75.13 168 1158 14674 2.59100/2/c 74.73 74.61 150 1034 13102 2.35100/3/a 74.67 75.14 140 965 12228 2.18100/3/b 74.93 74.94 167 1151 14586 2.60100/3/c 74.57 75.09 160 1103 13975 2.50100/4/a 74.95 74.97 145 1000 12665 2.25100/4/b 74.99 74.72 135 931 11791 2.10100/4/c 74.52 74.64 143 986 12490 2.25

Appendix D.7 Cold Modulus of Rupture Results D7